


The Influence of Reservoirs on Water Temperature in the Downstream Part of an Open Watercourse: A Case Study at Botovo Station on the Drava River


Abstract
1. Introduction
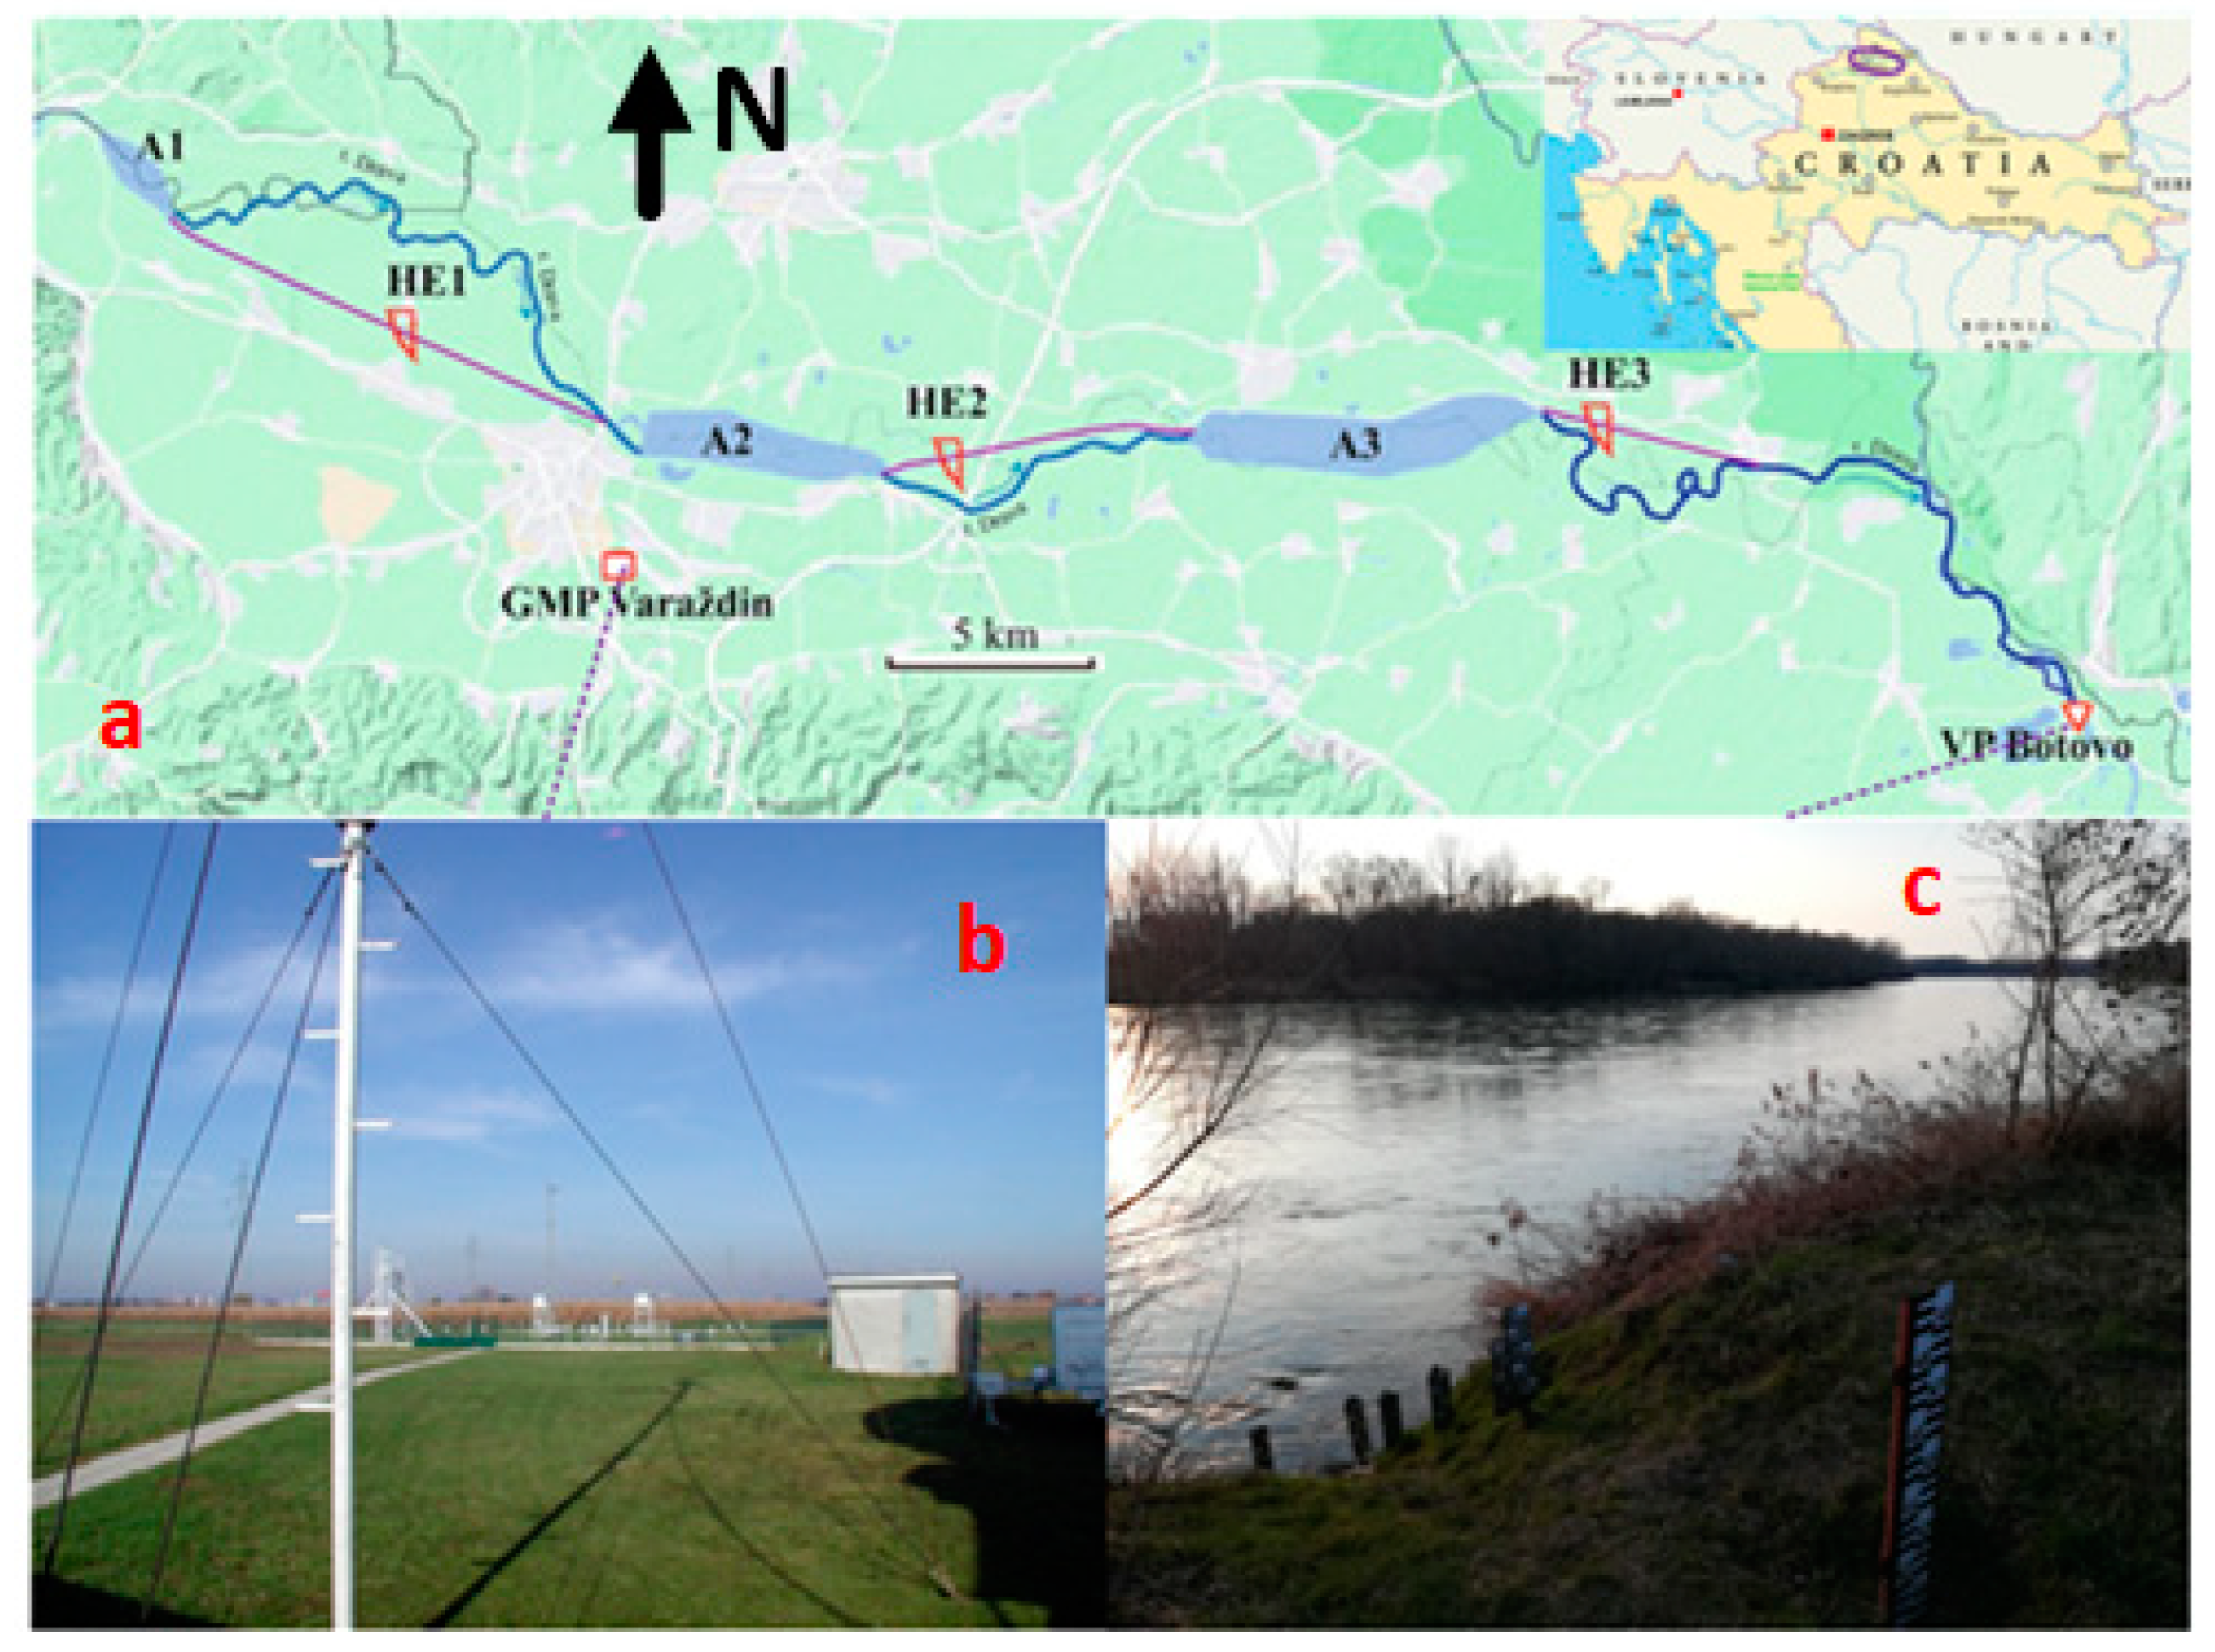
2. Materials
3. Methods
4. Results
4.1. Year as a Time Increment of Analysis
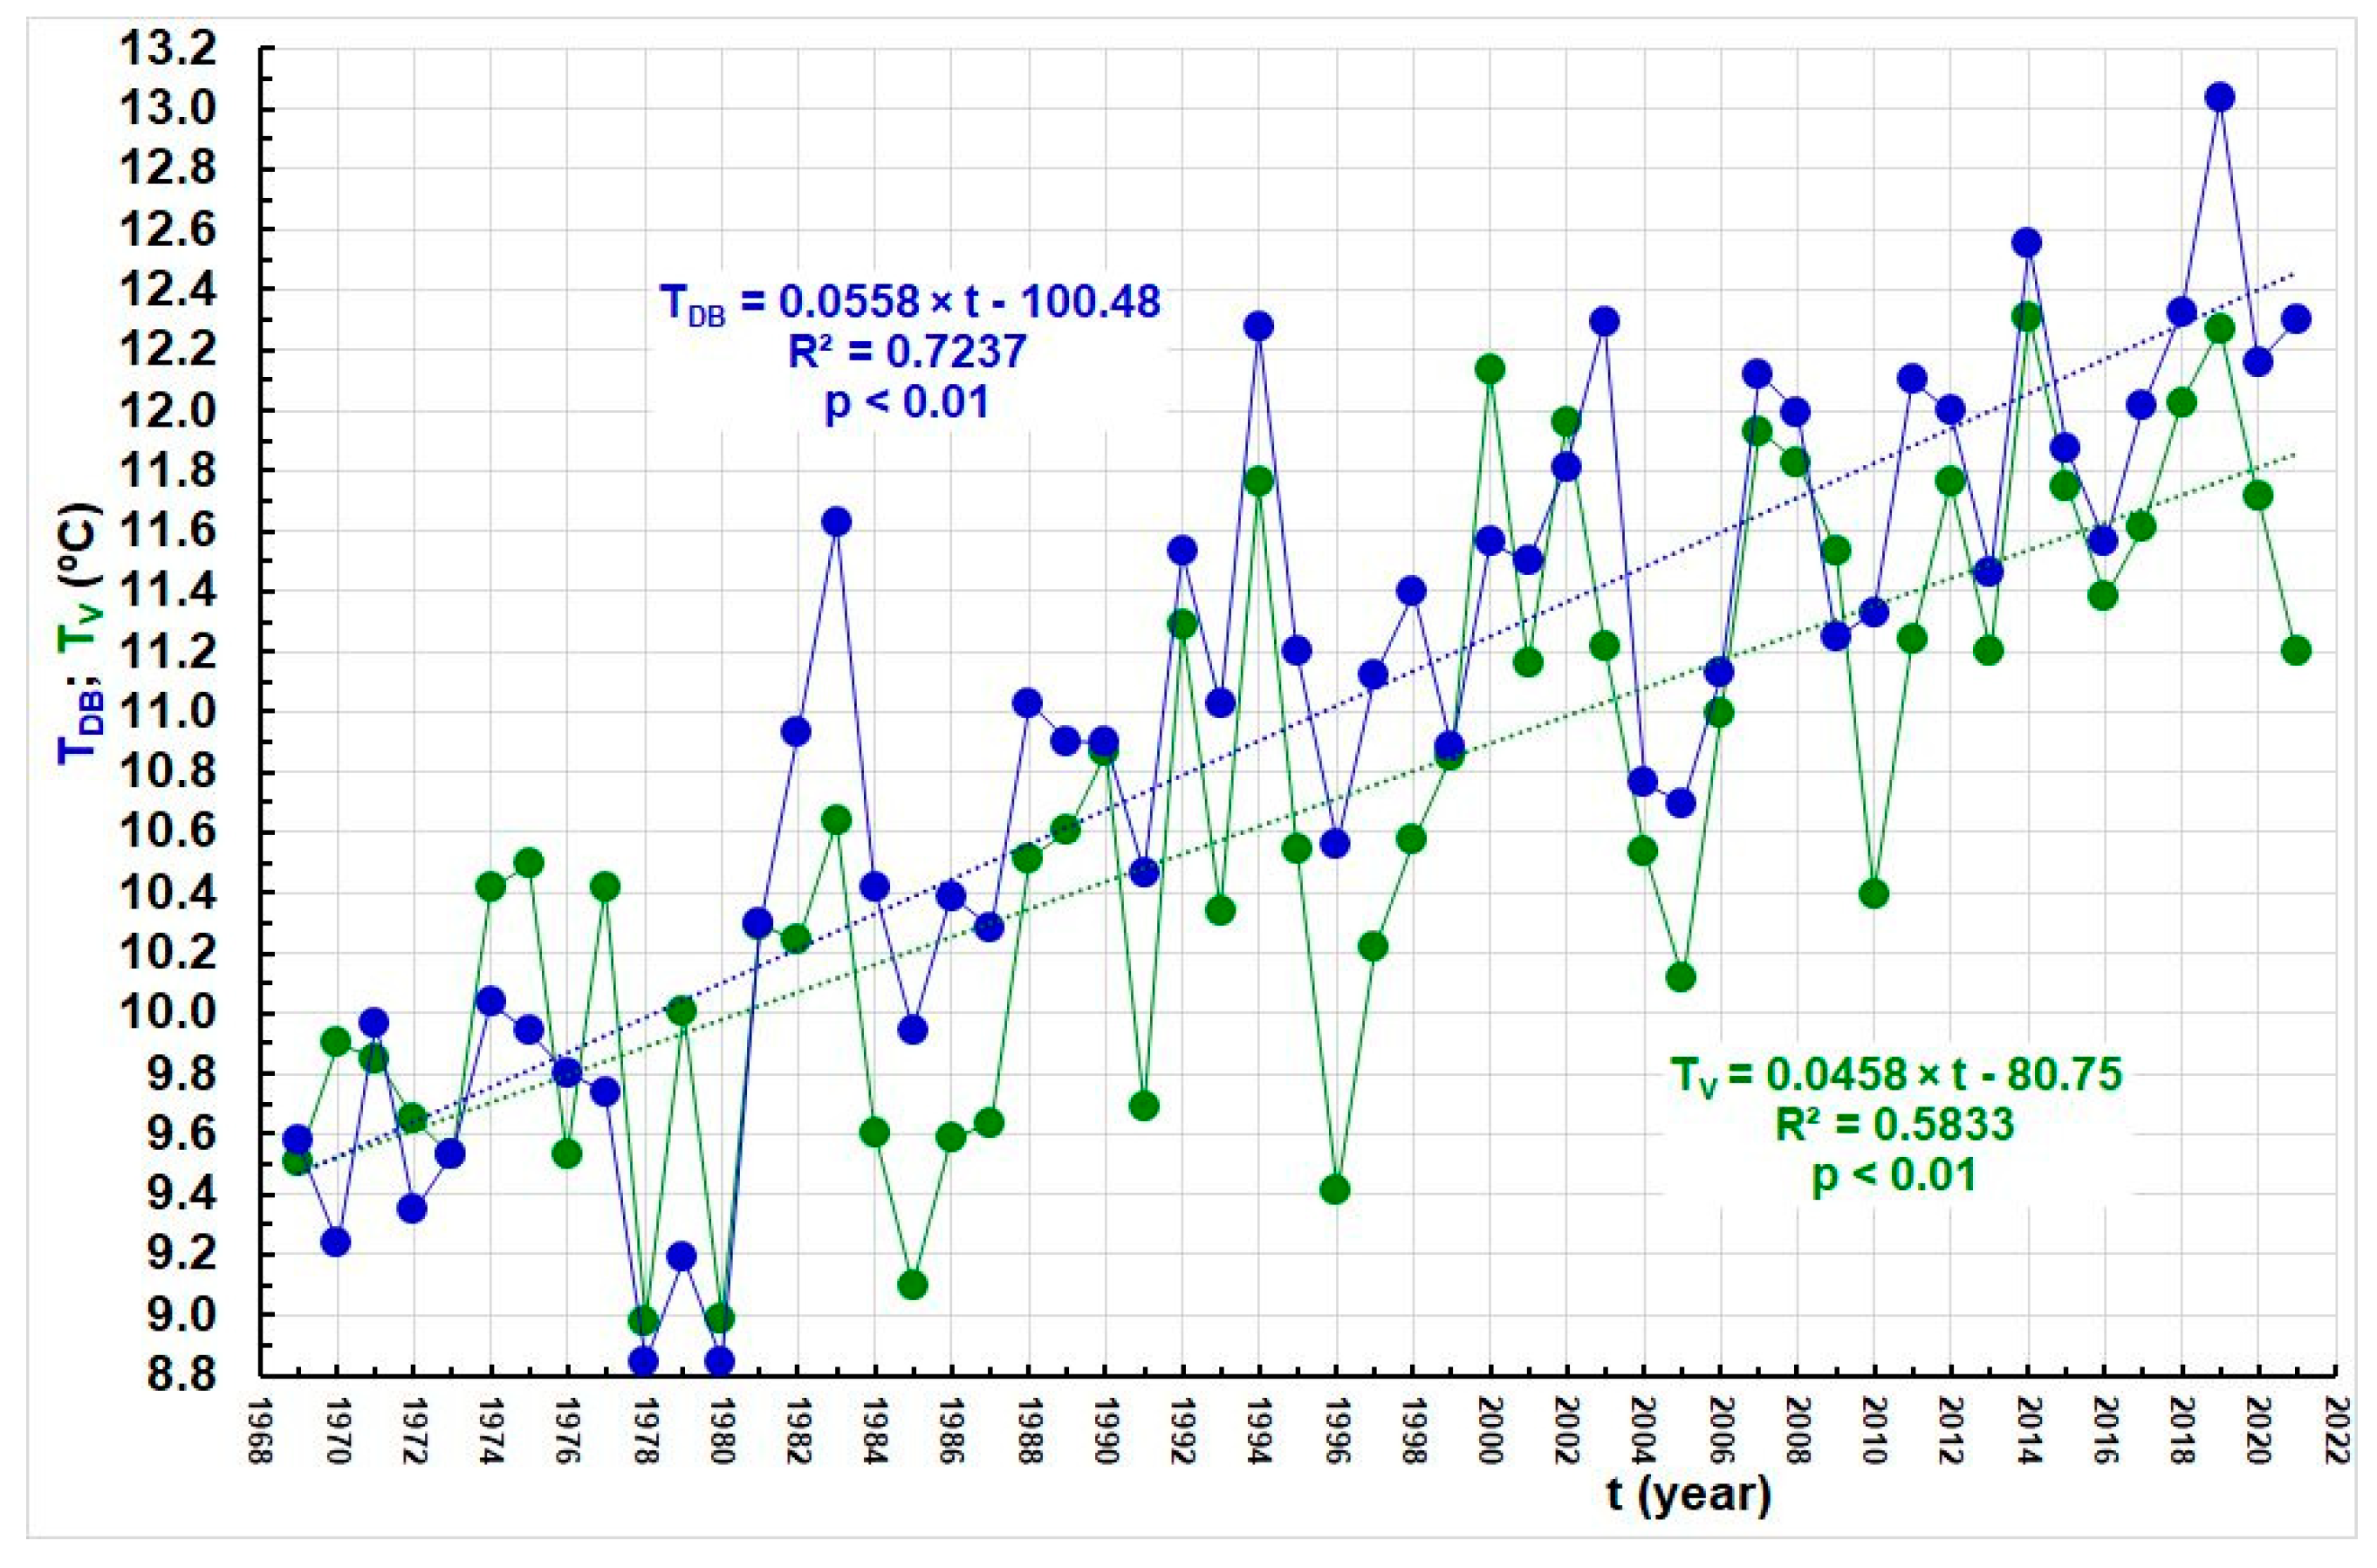
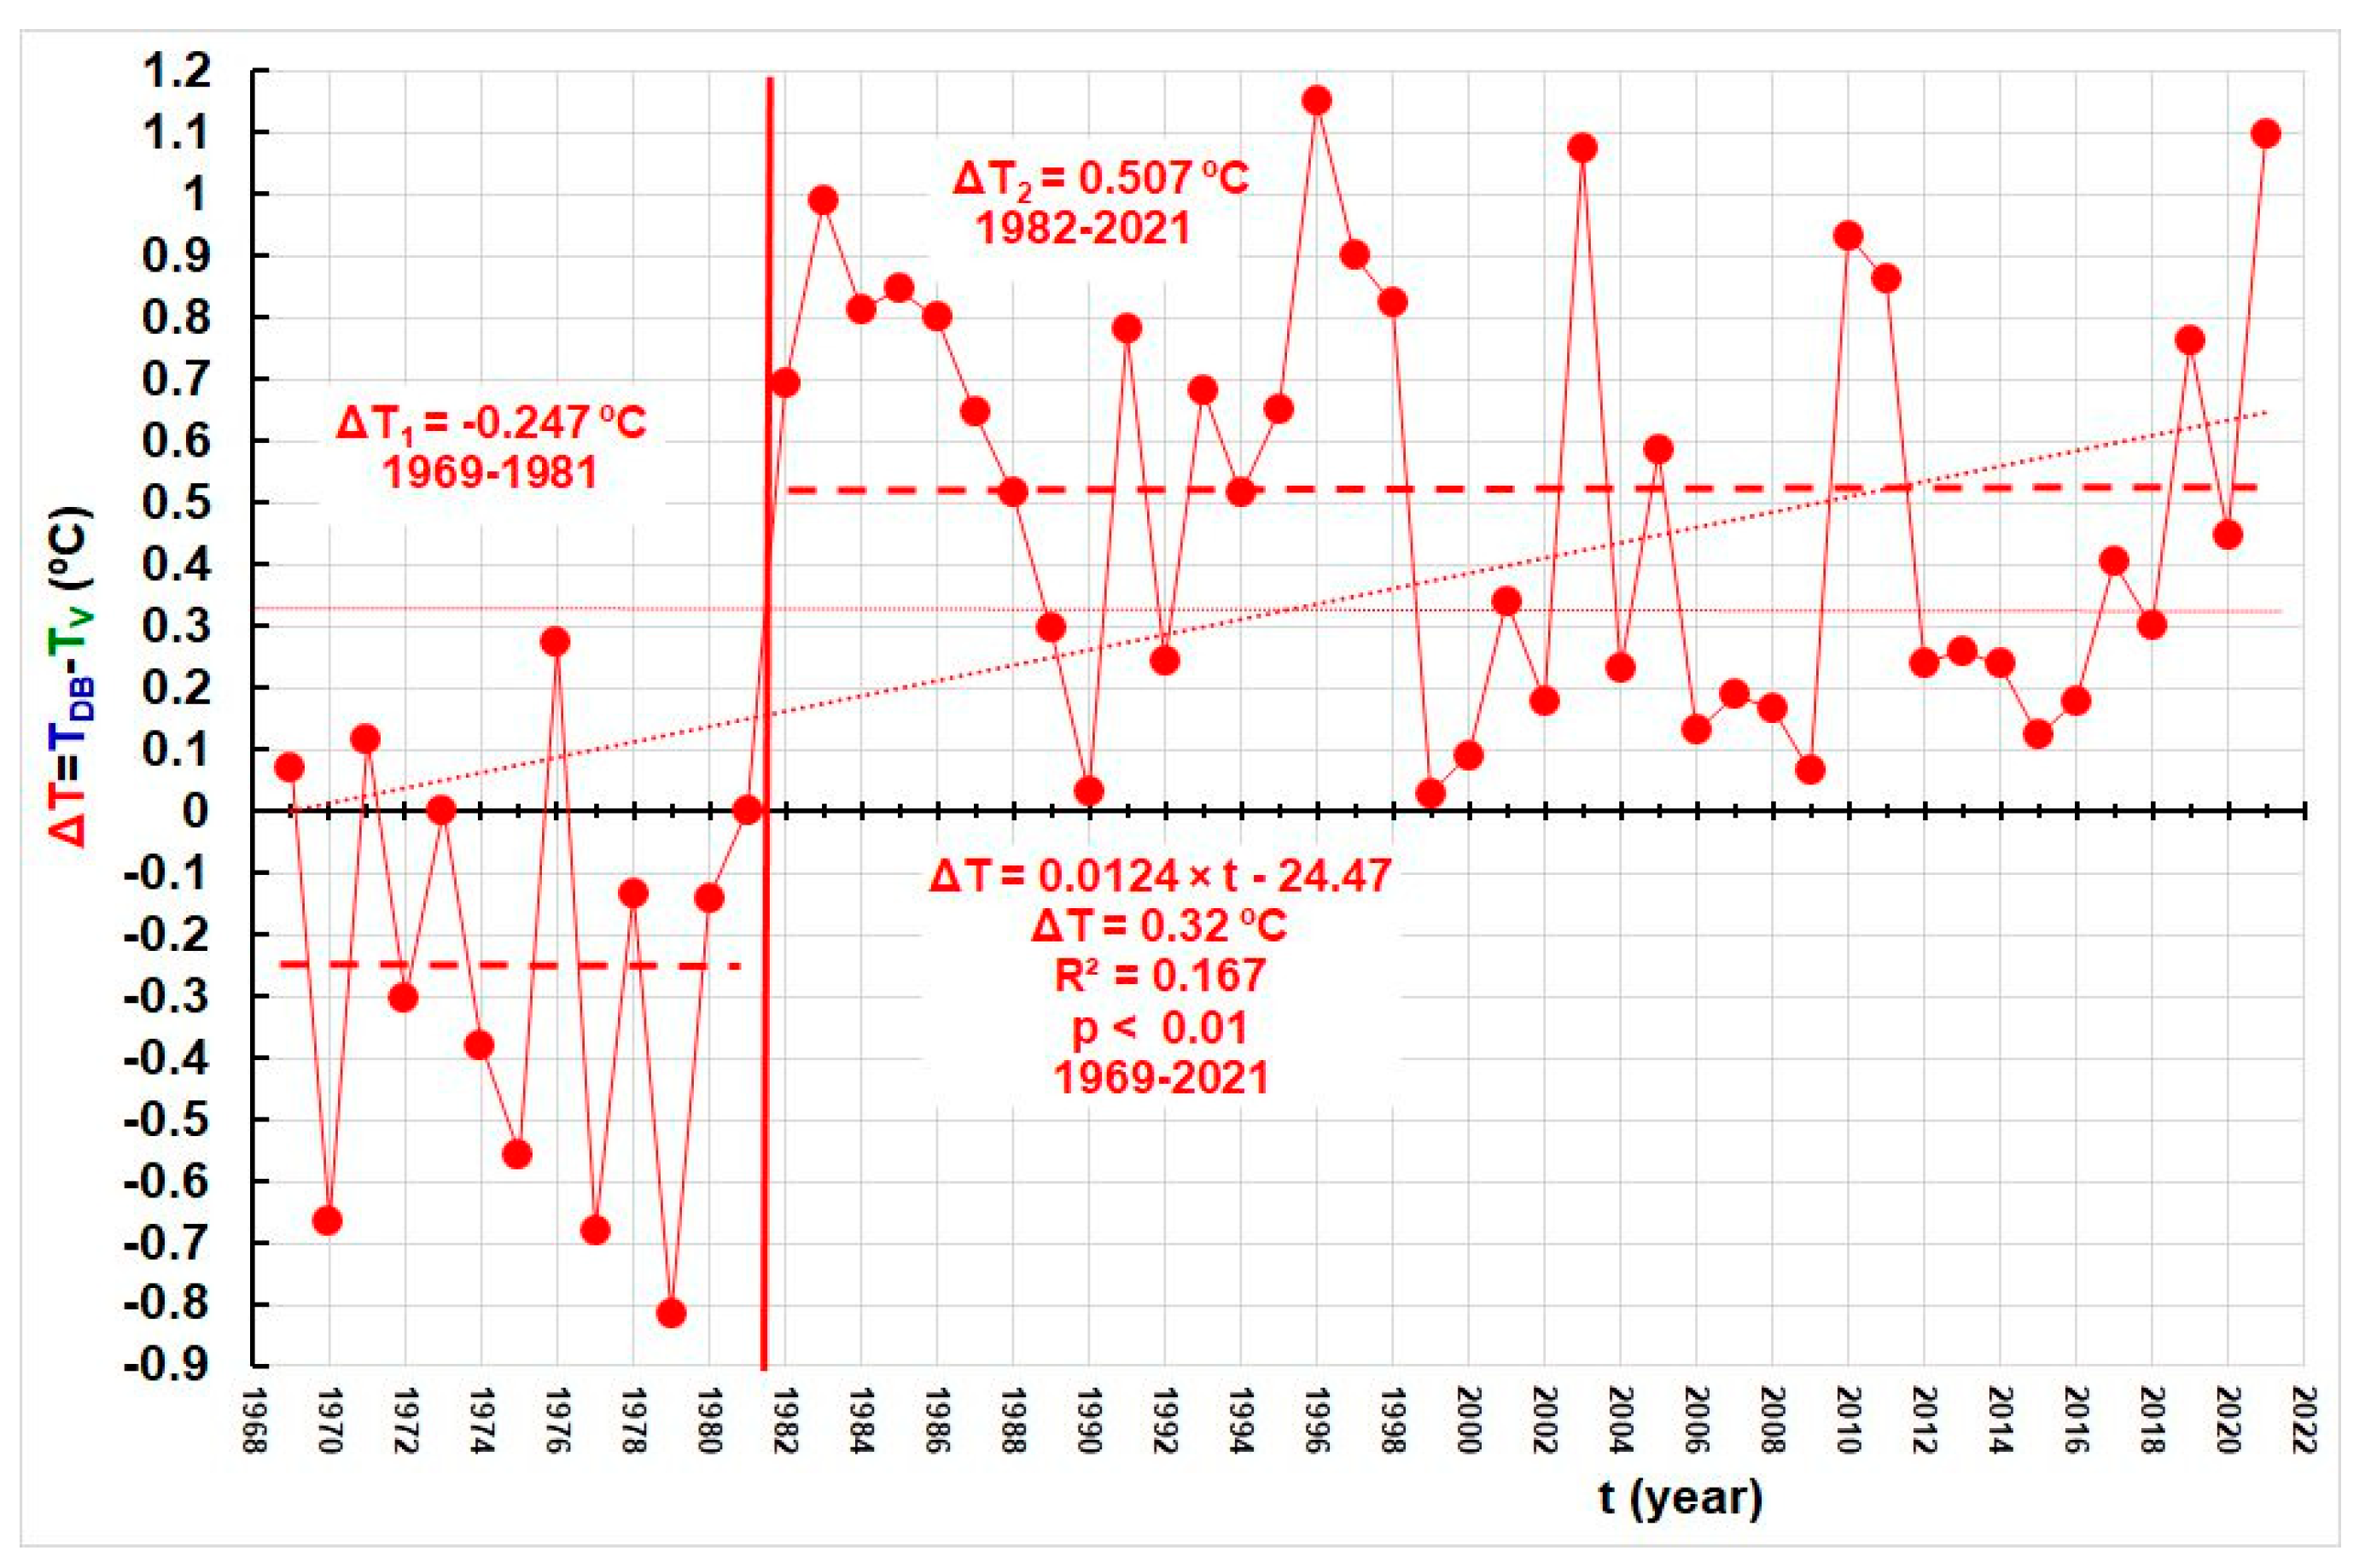
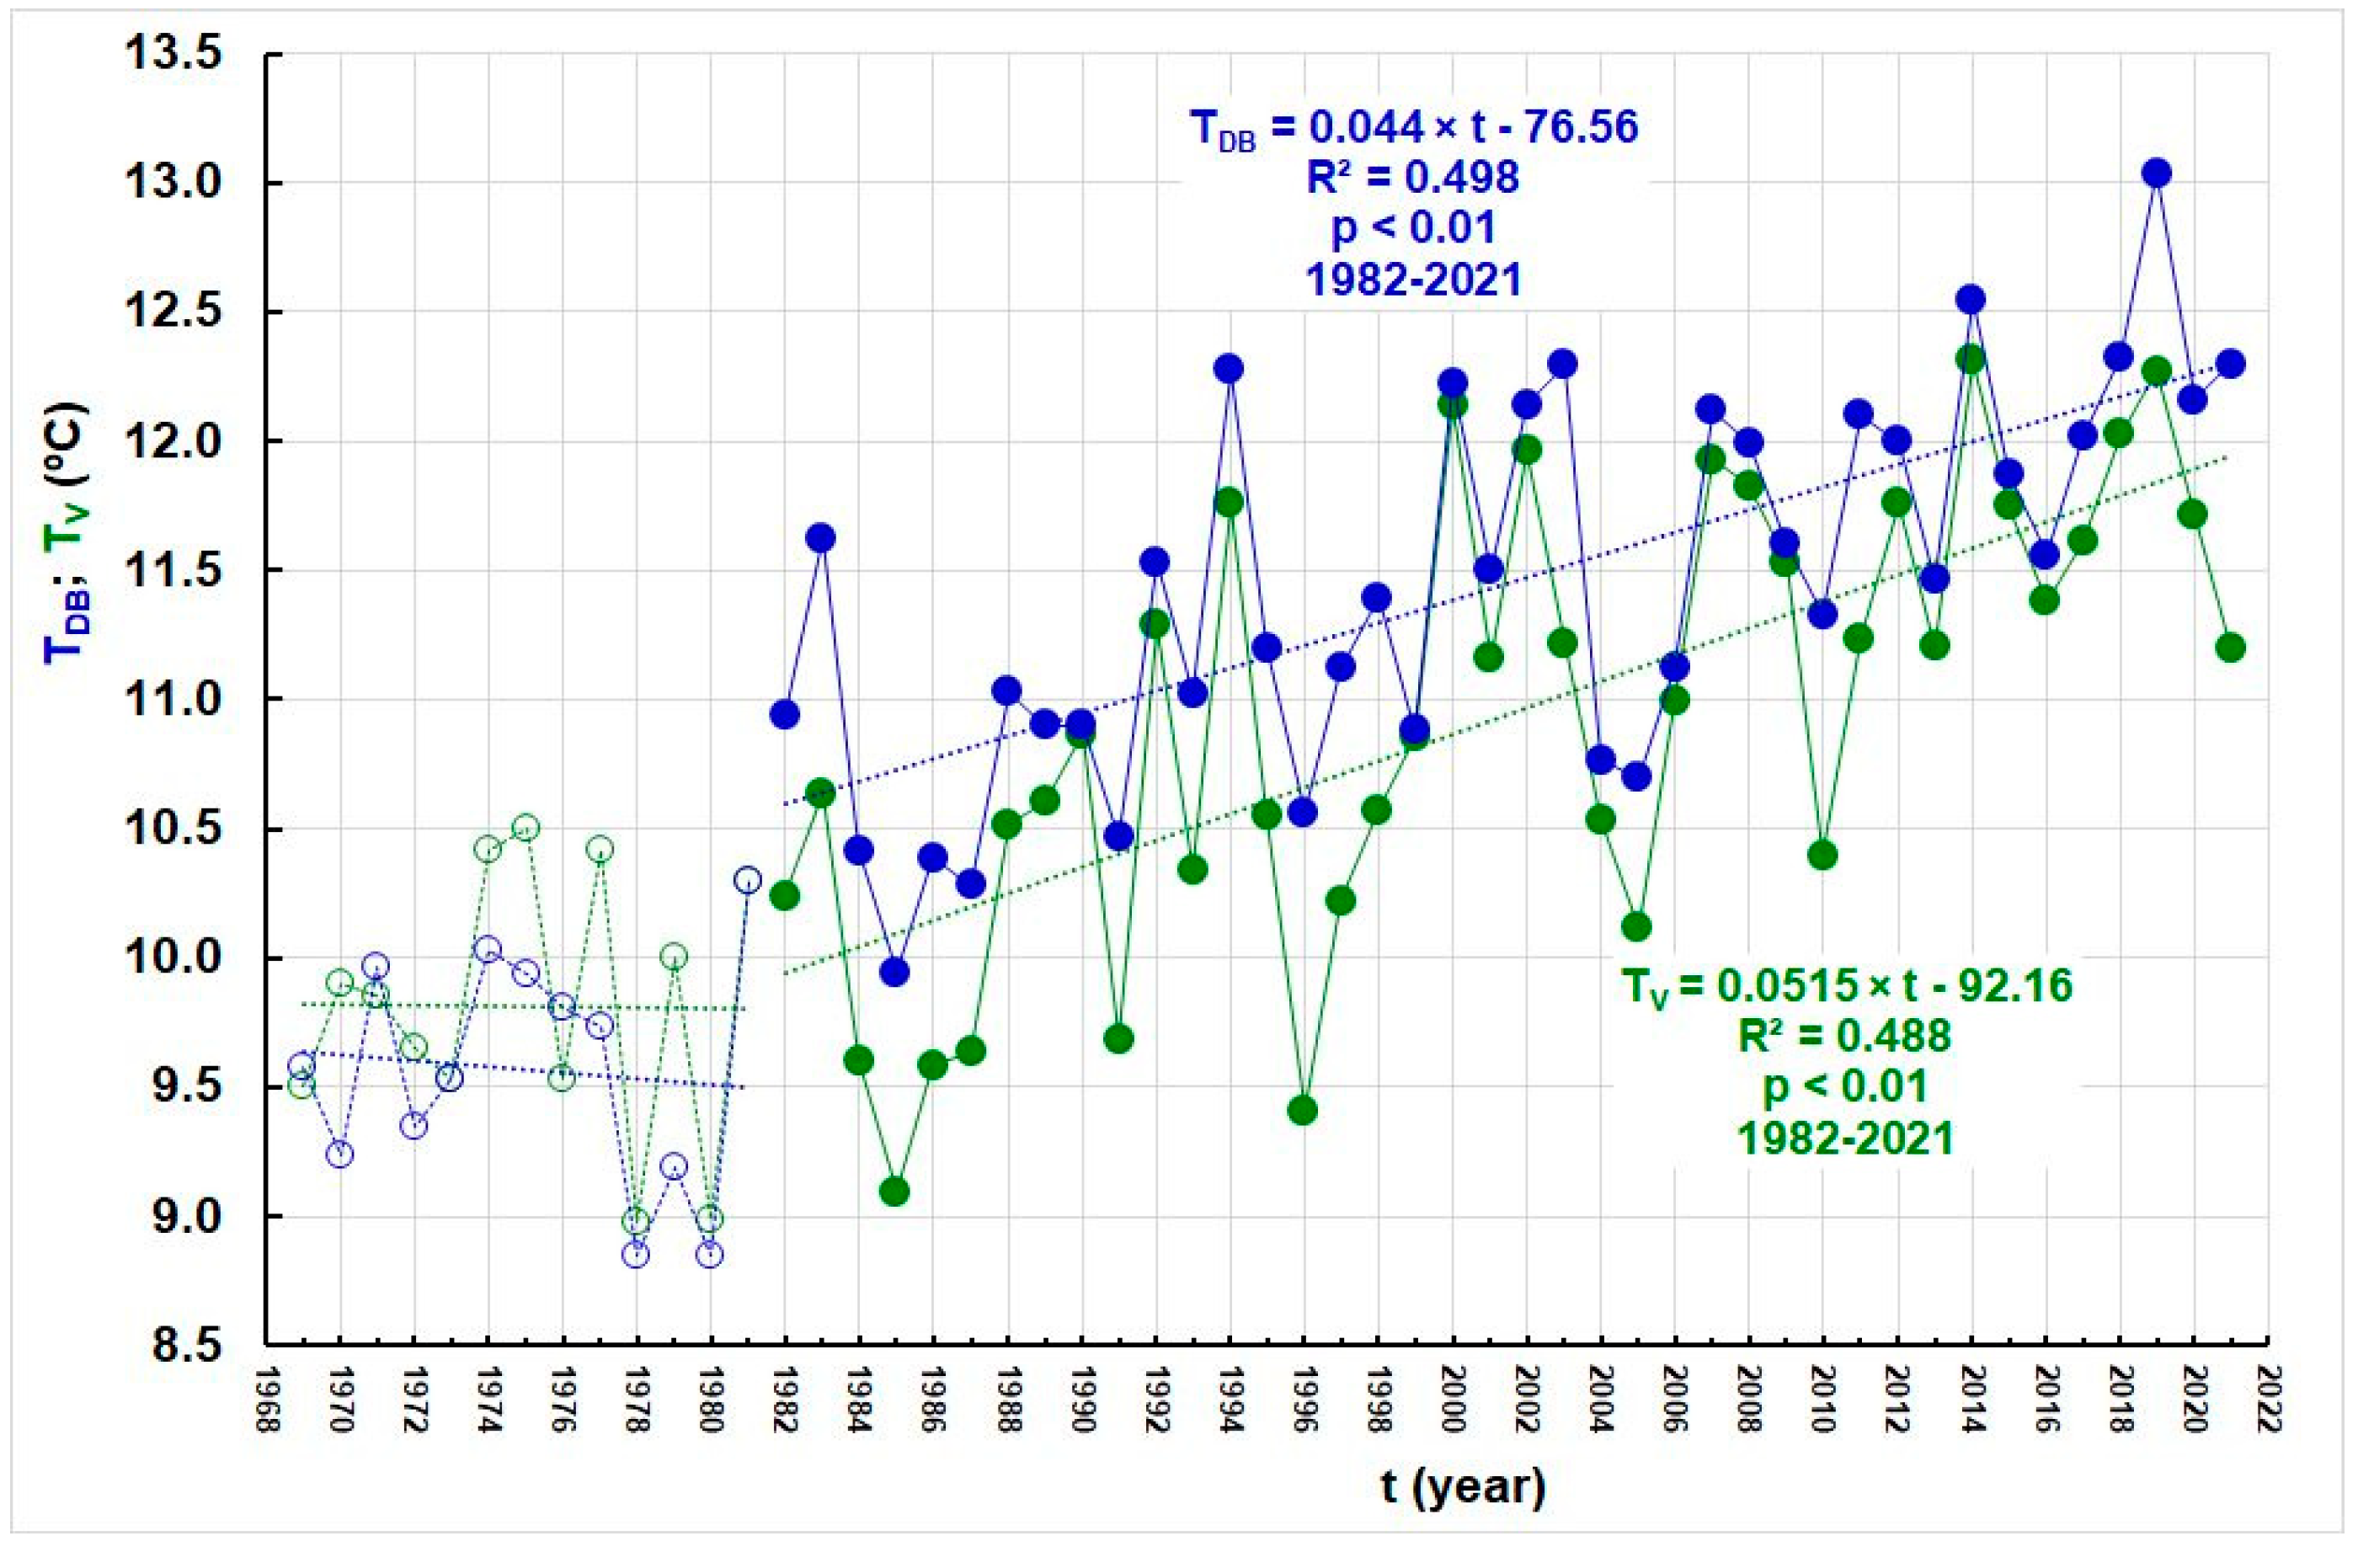
4.1.1. Air and Water Temperature
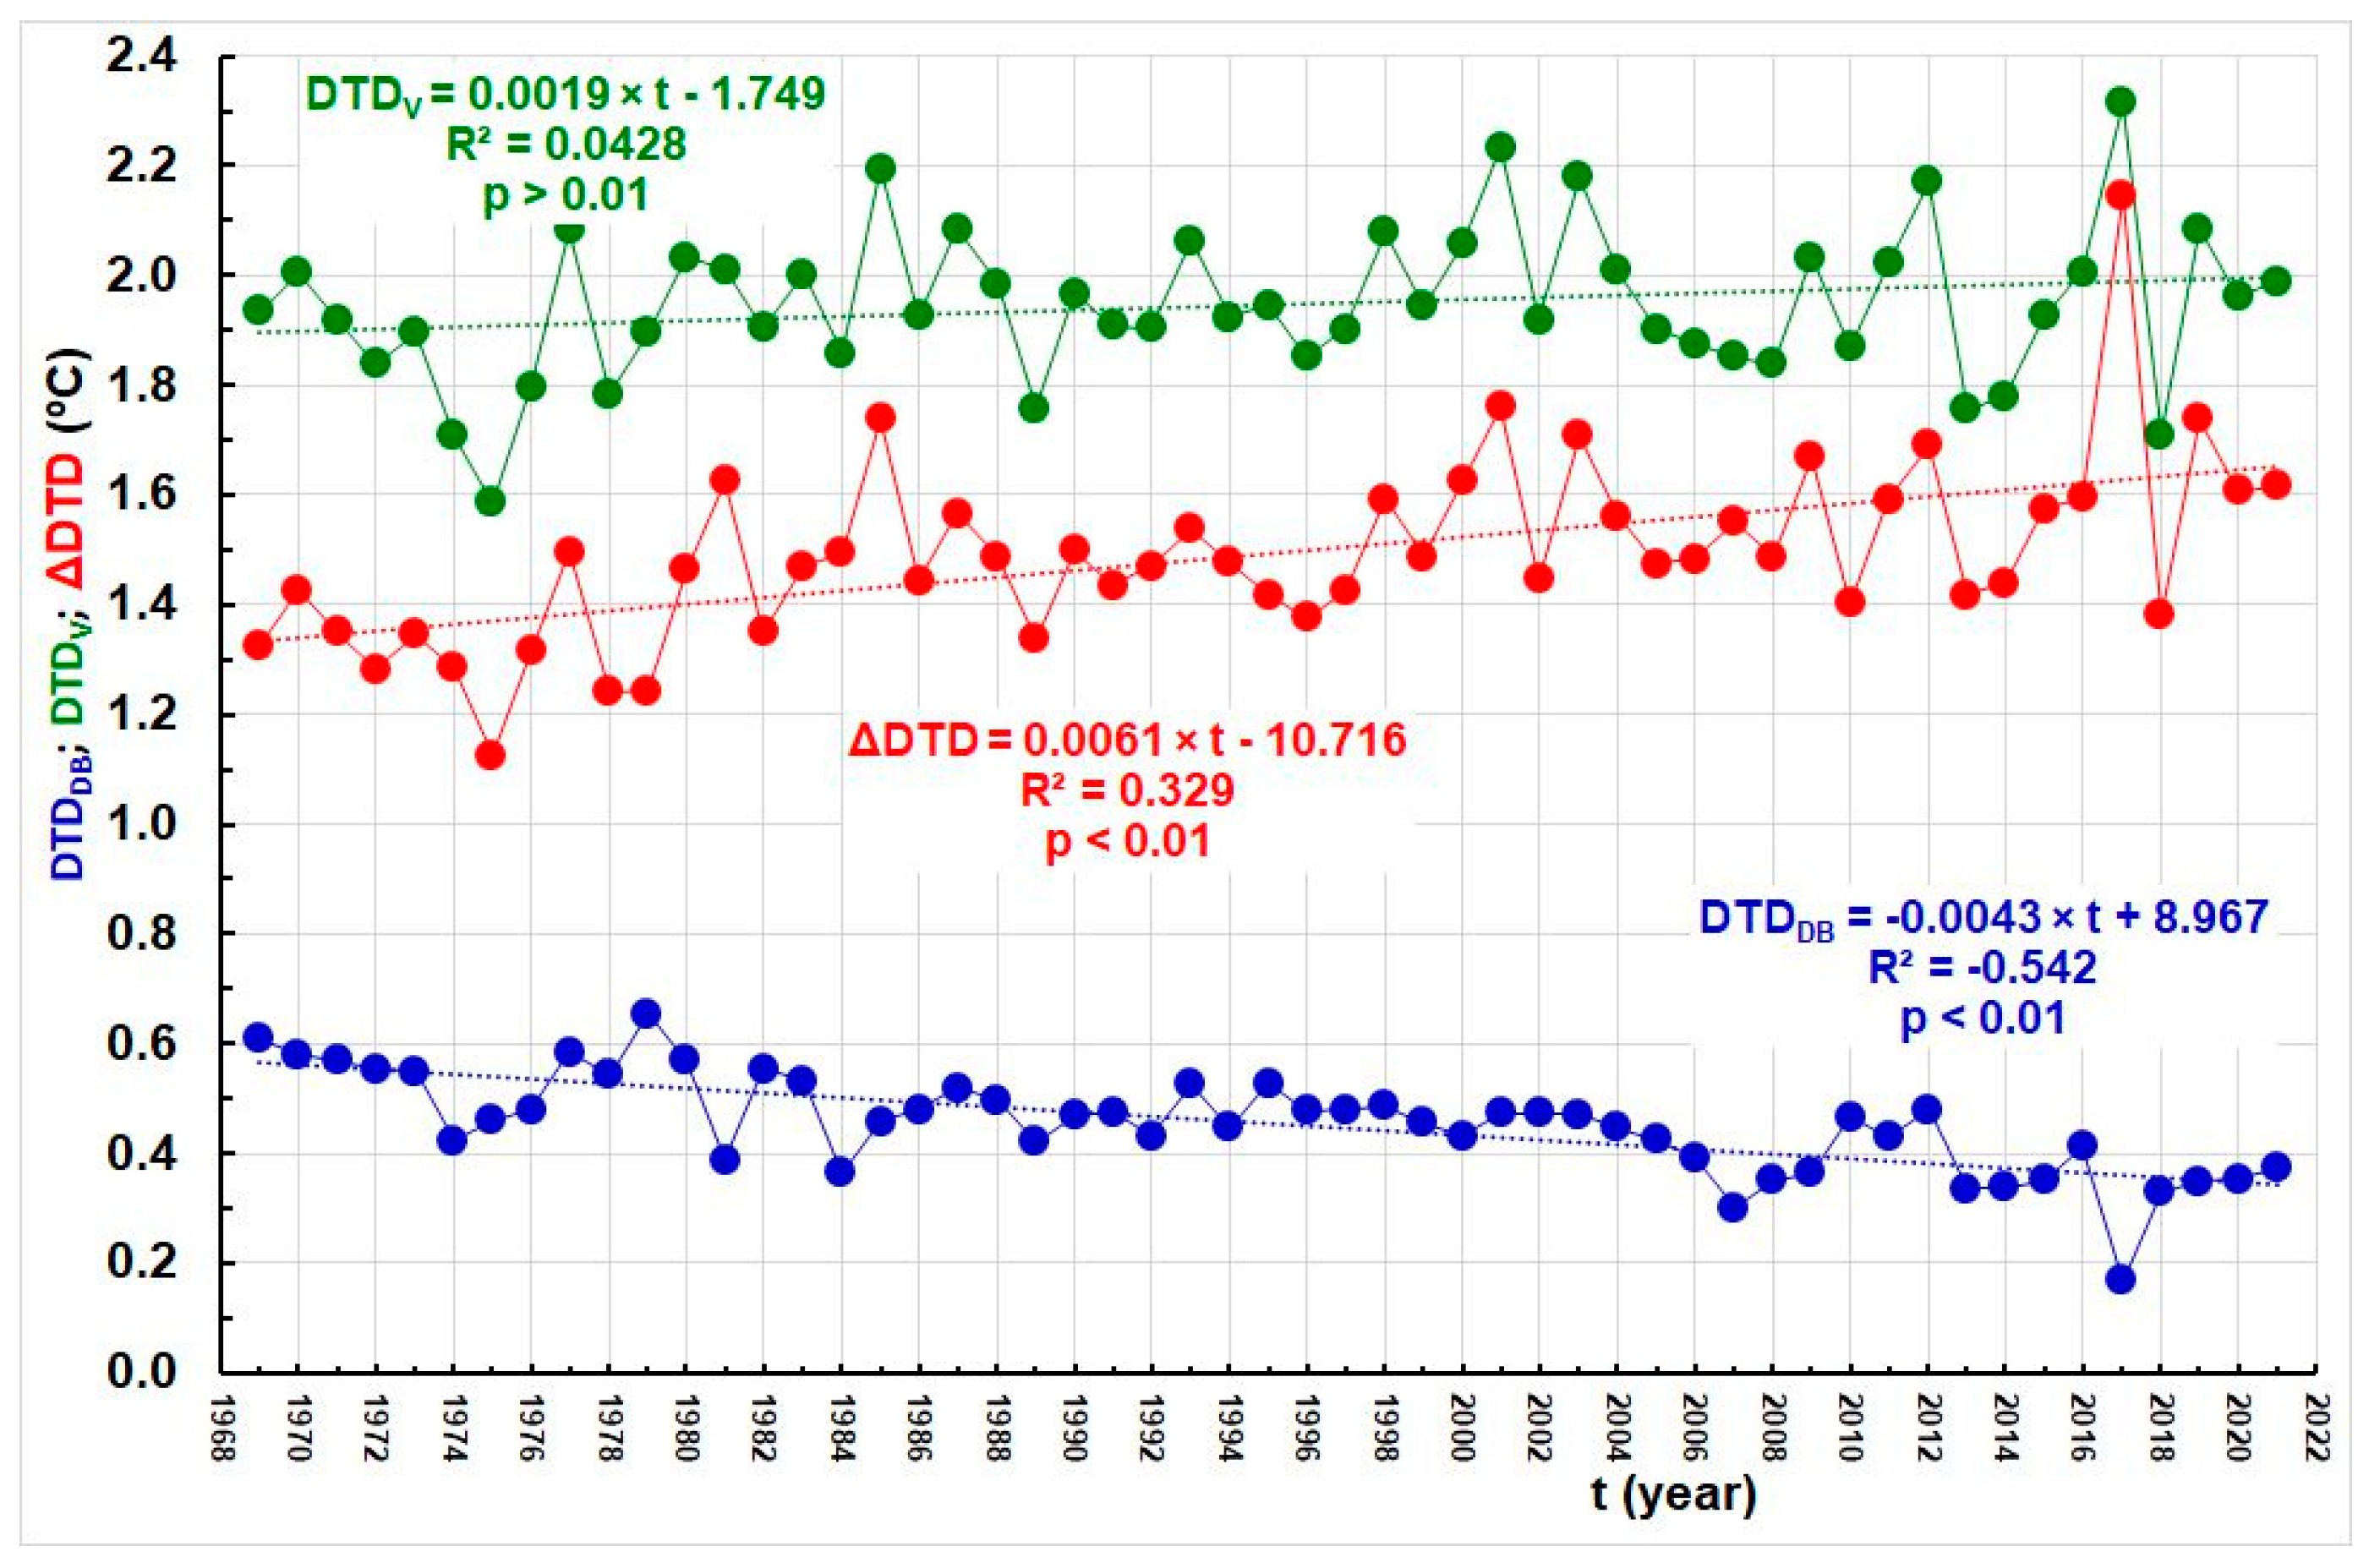
4.1.2. Day-to-Day (DTD) Method
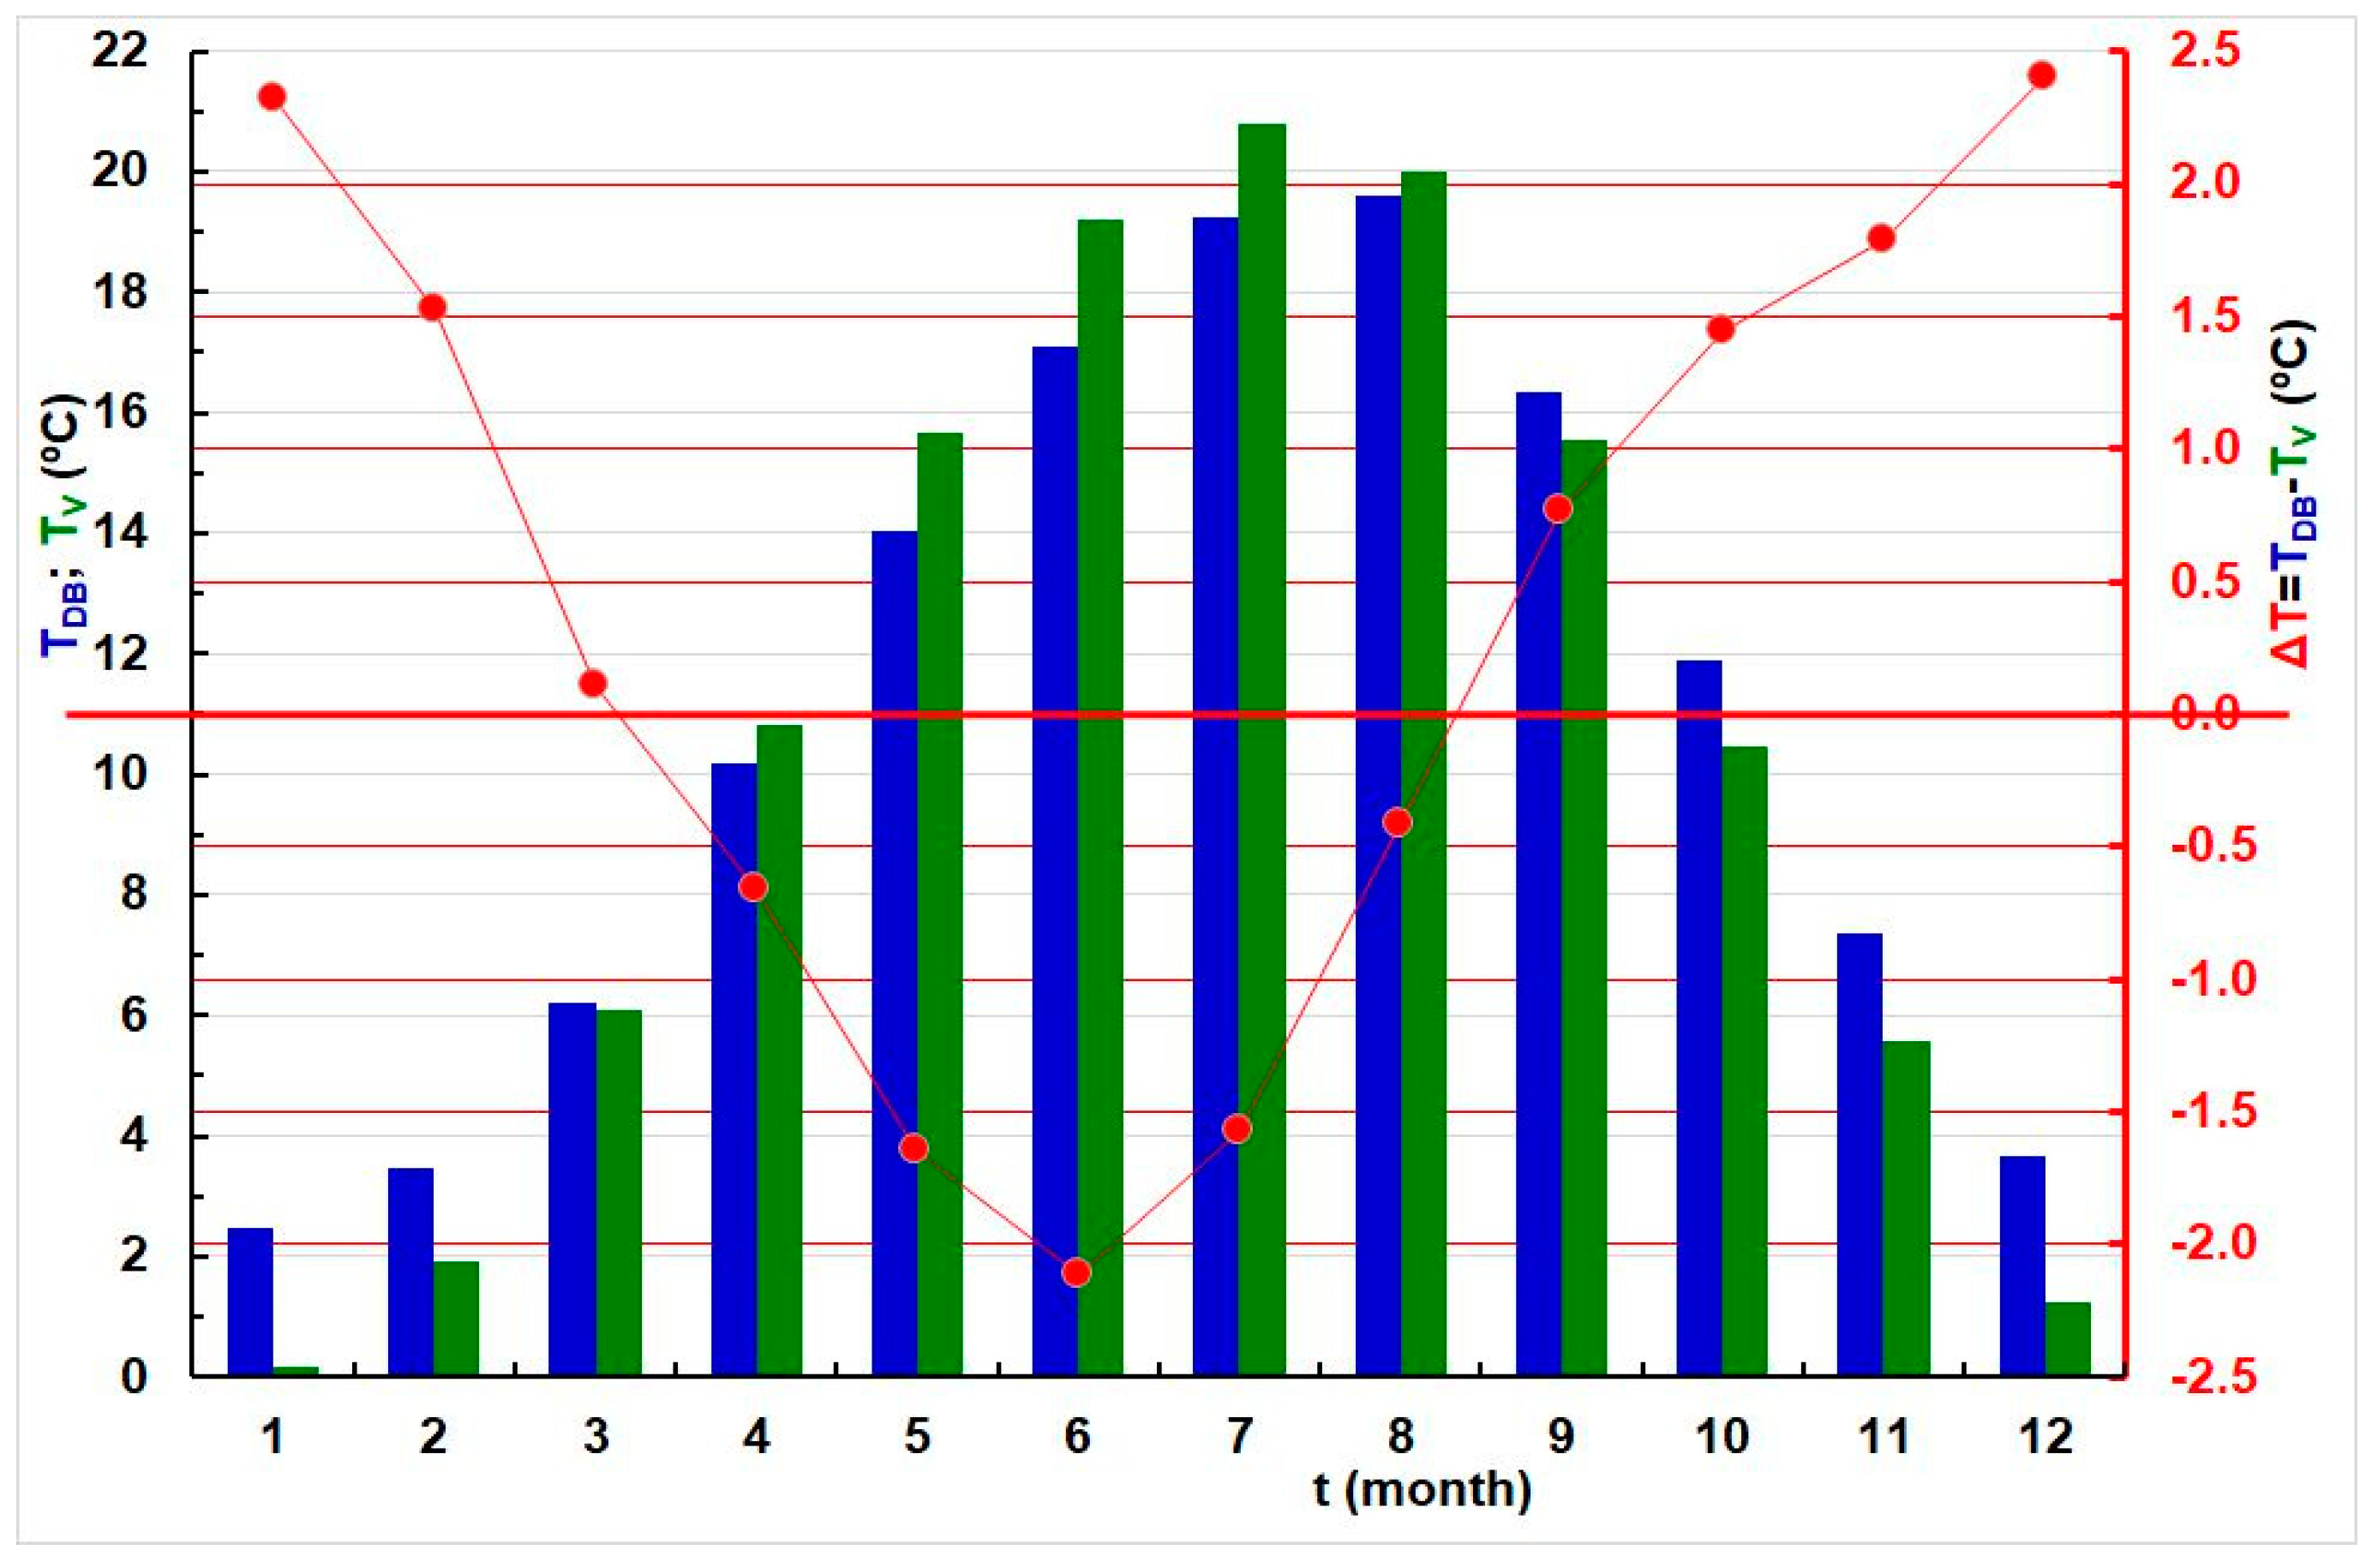
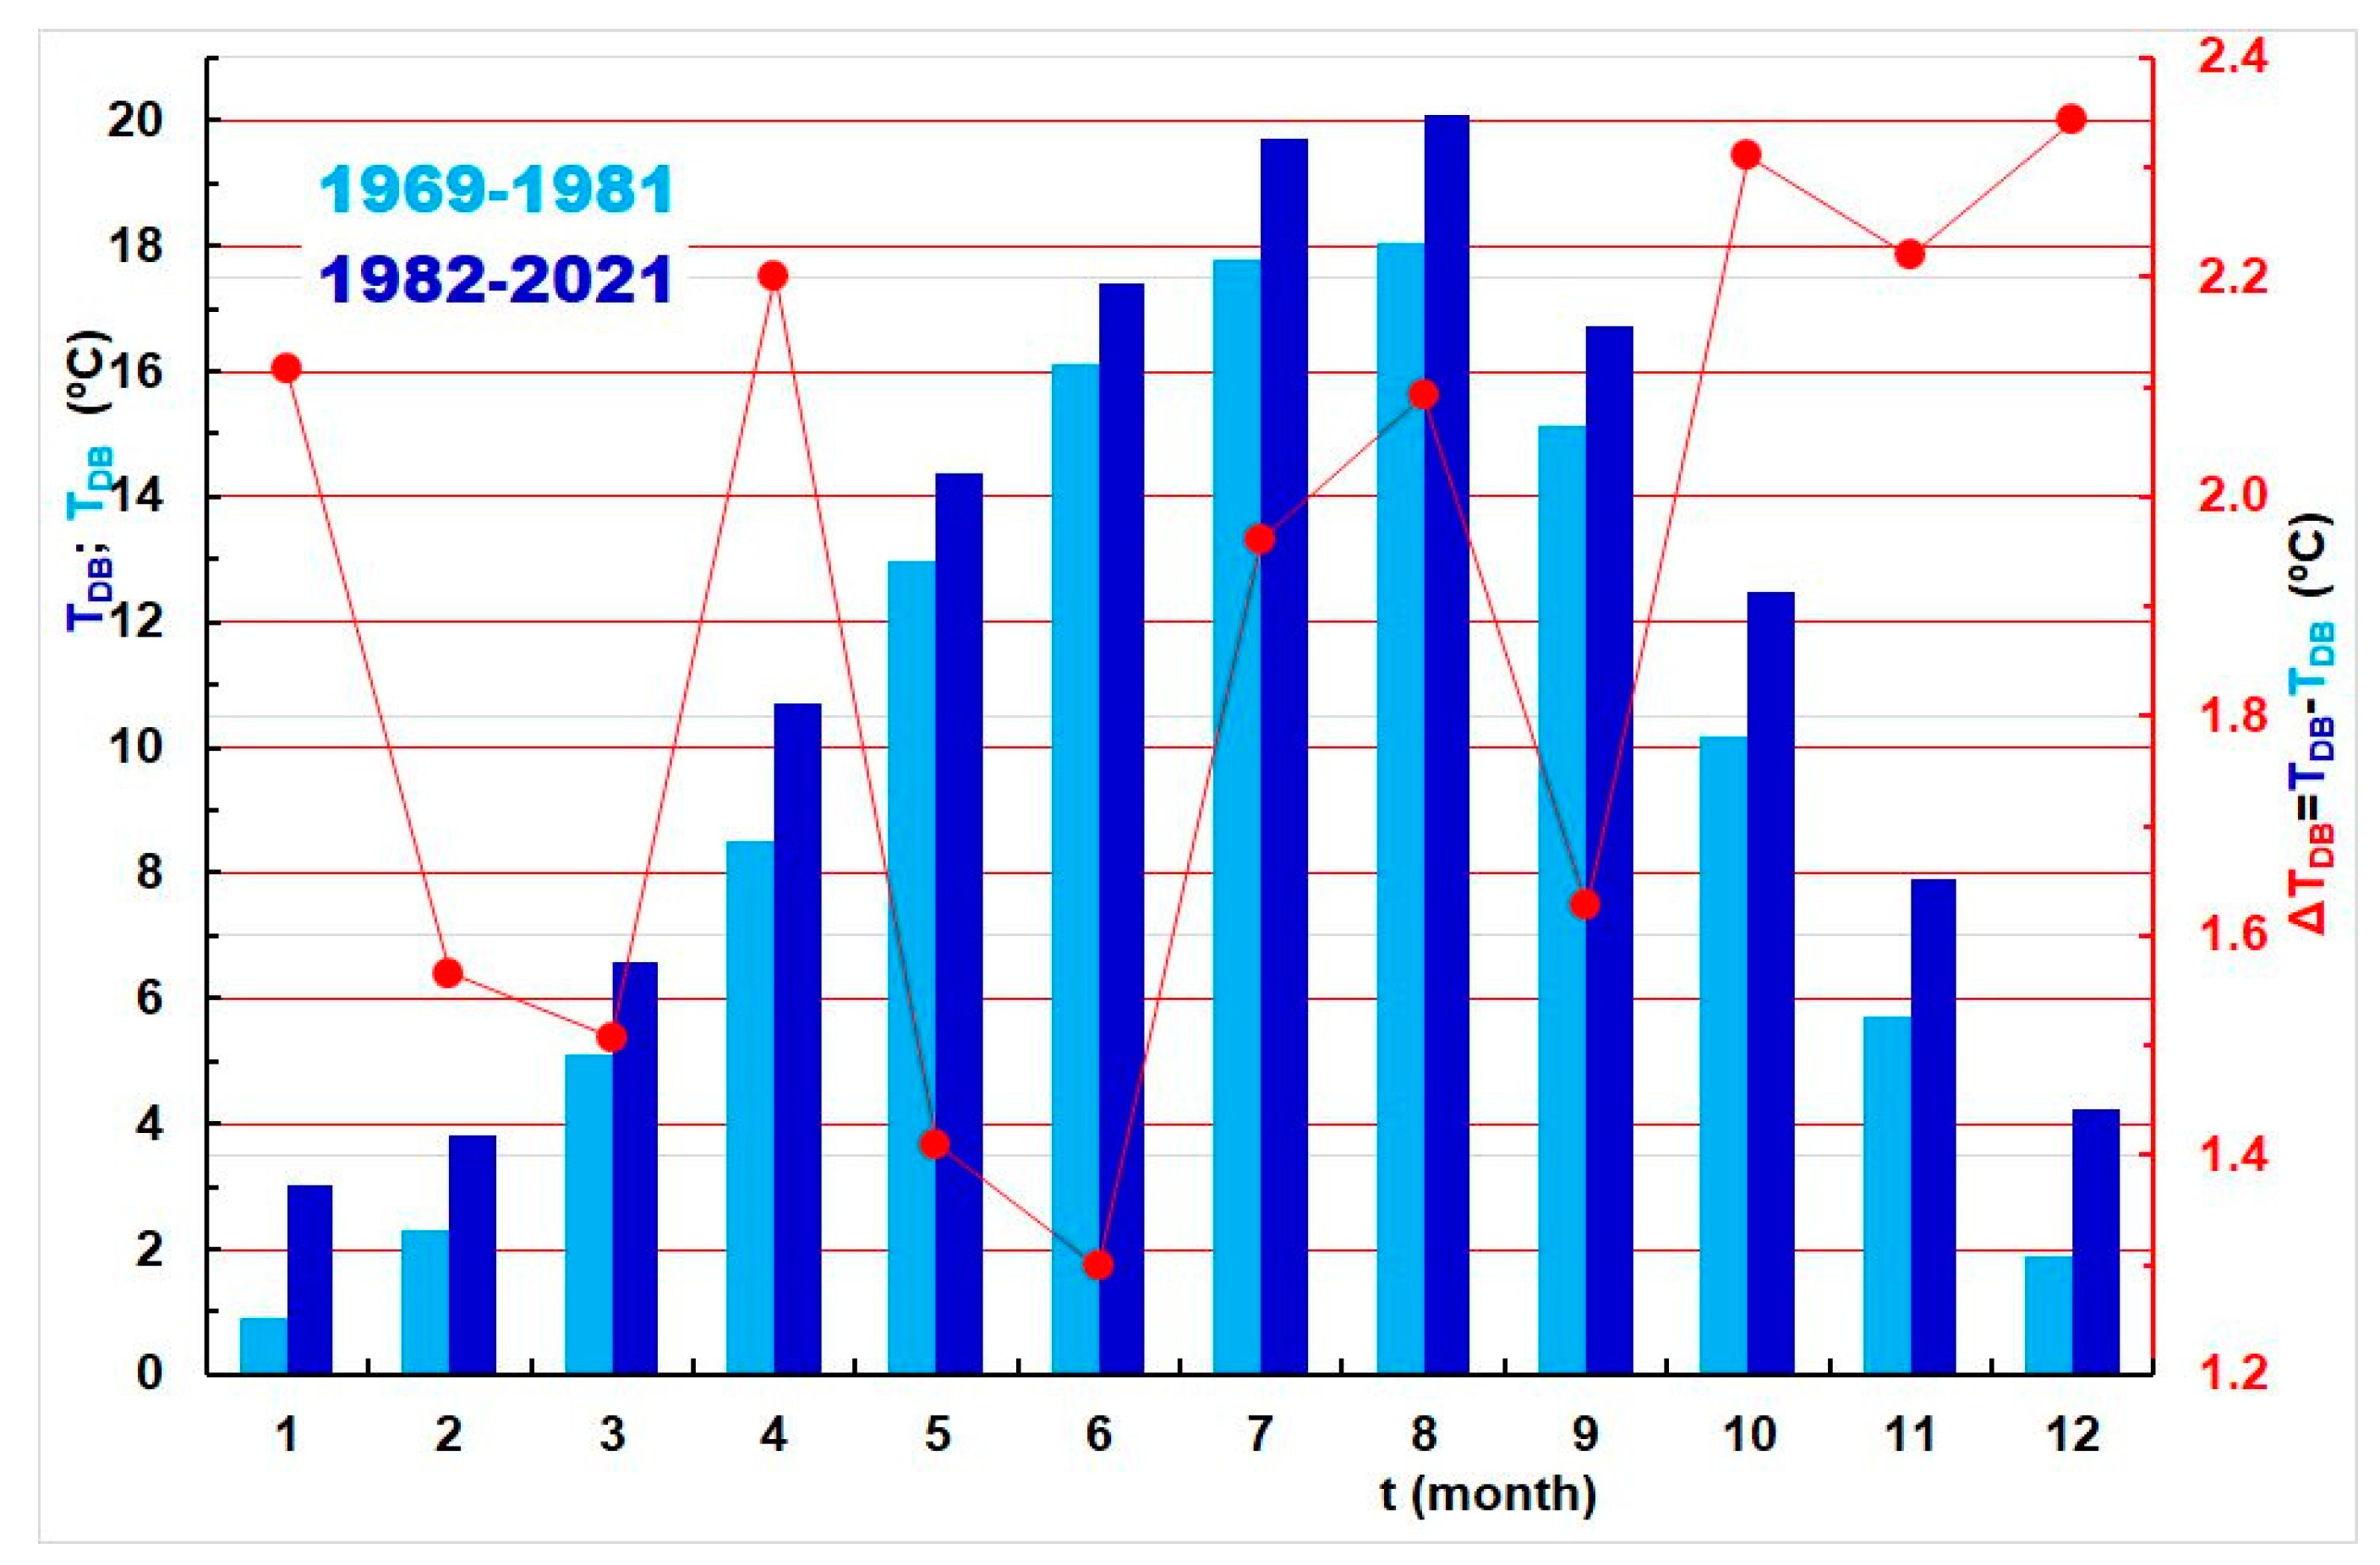
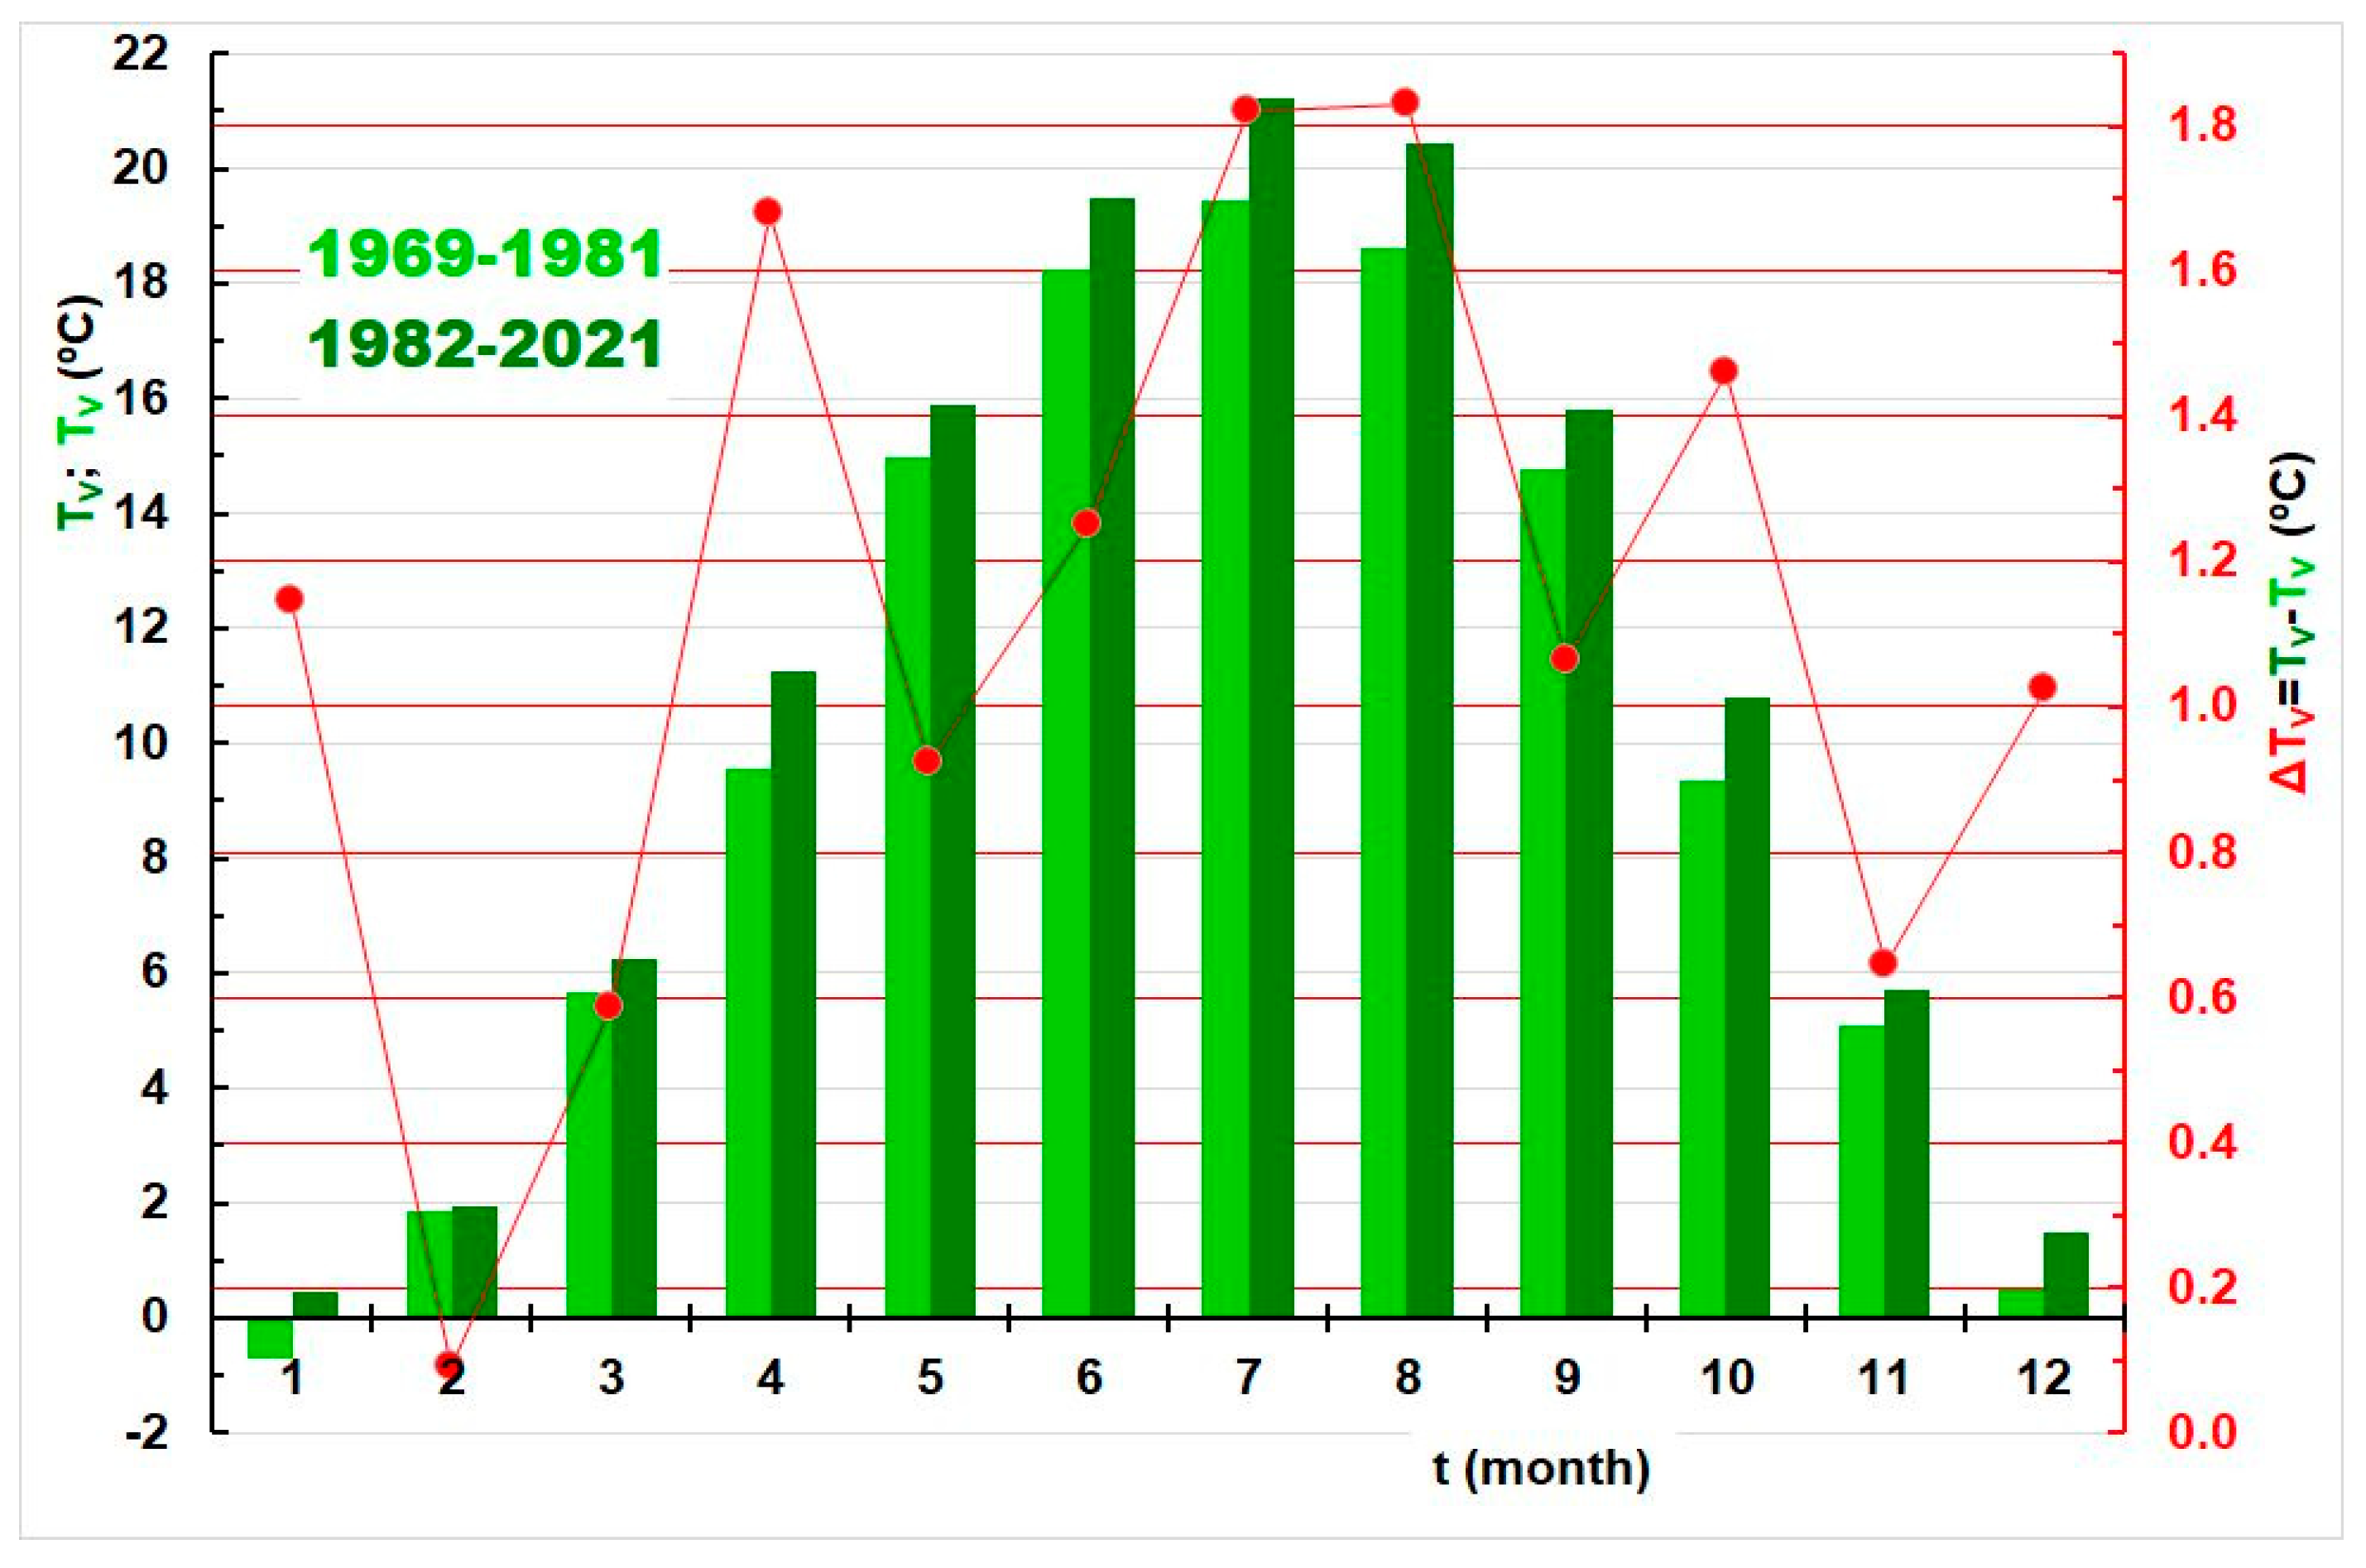
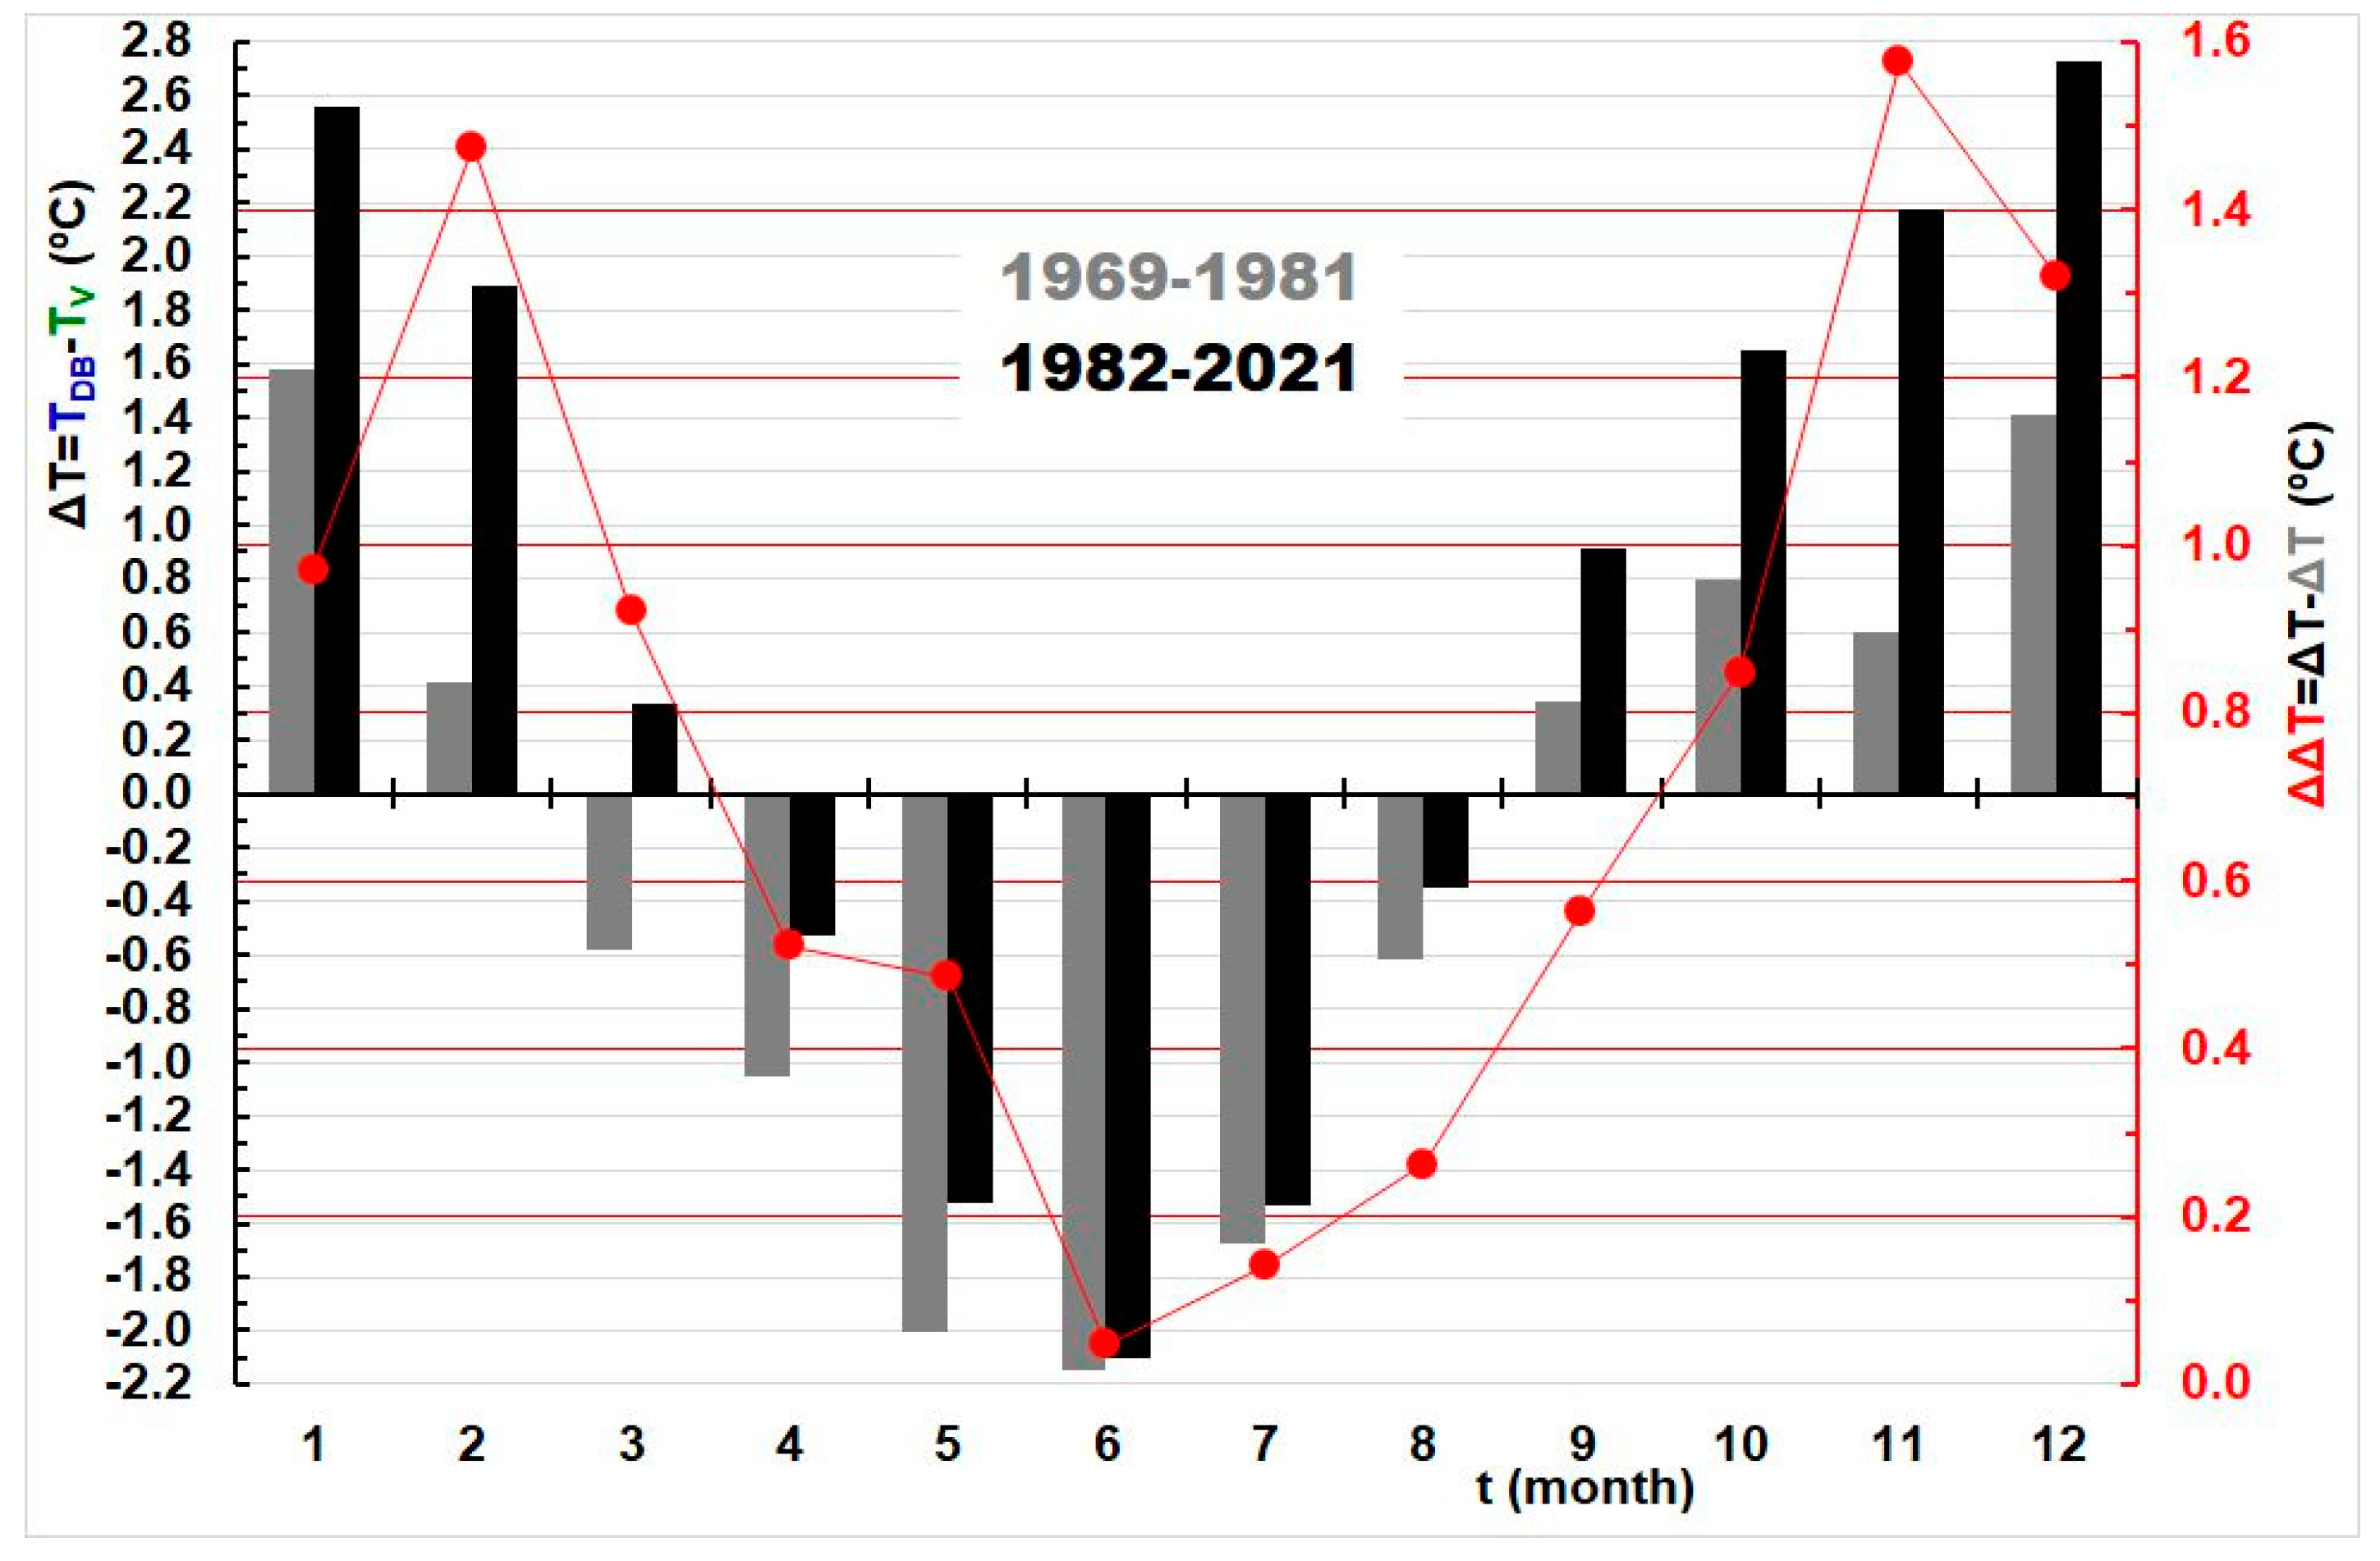
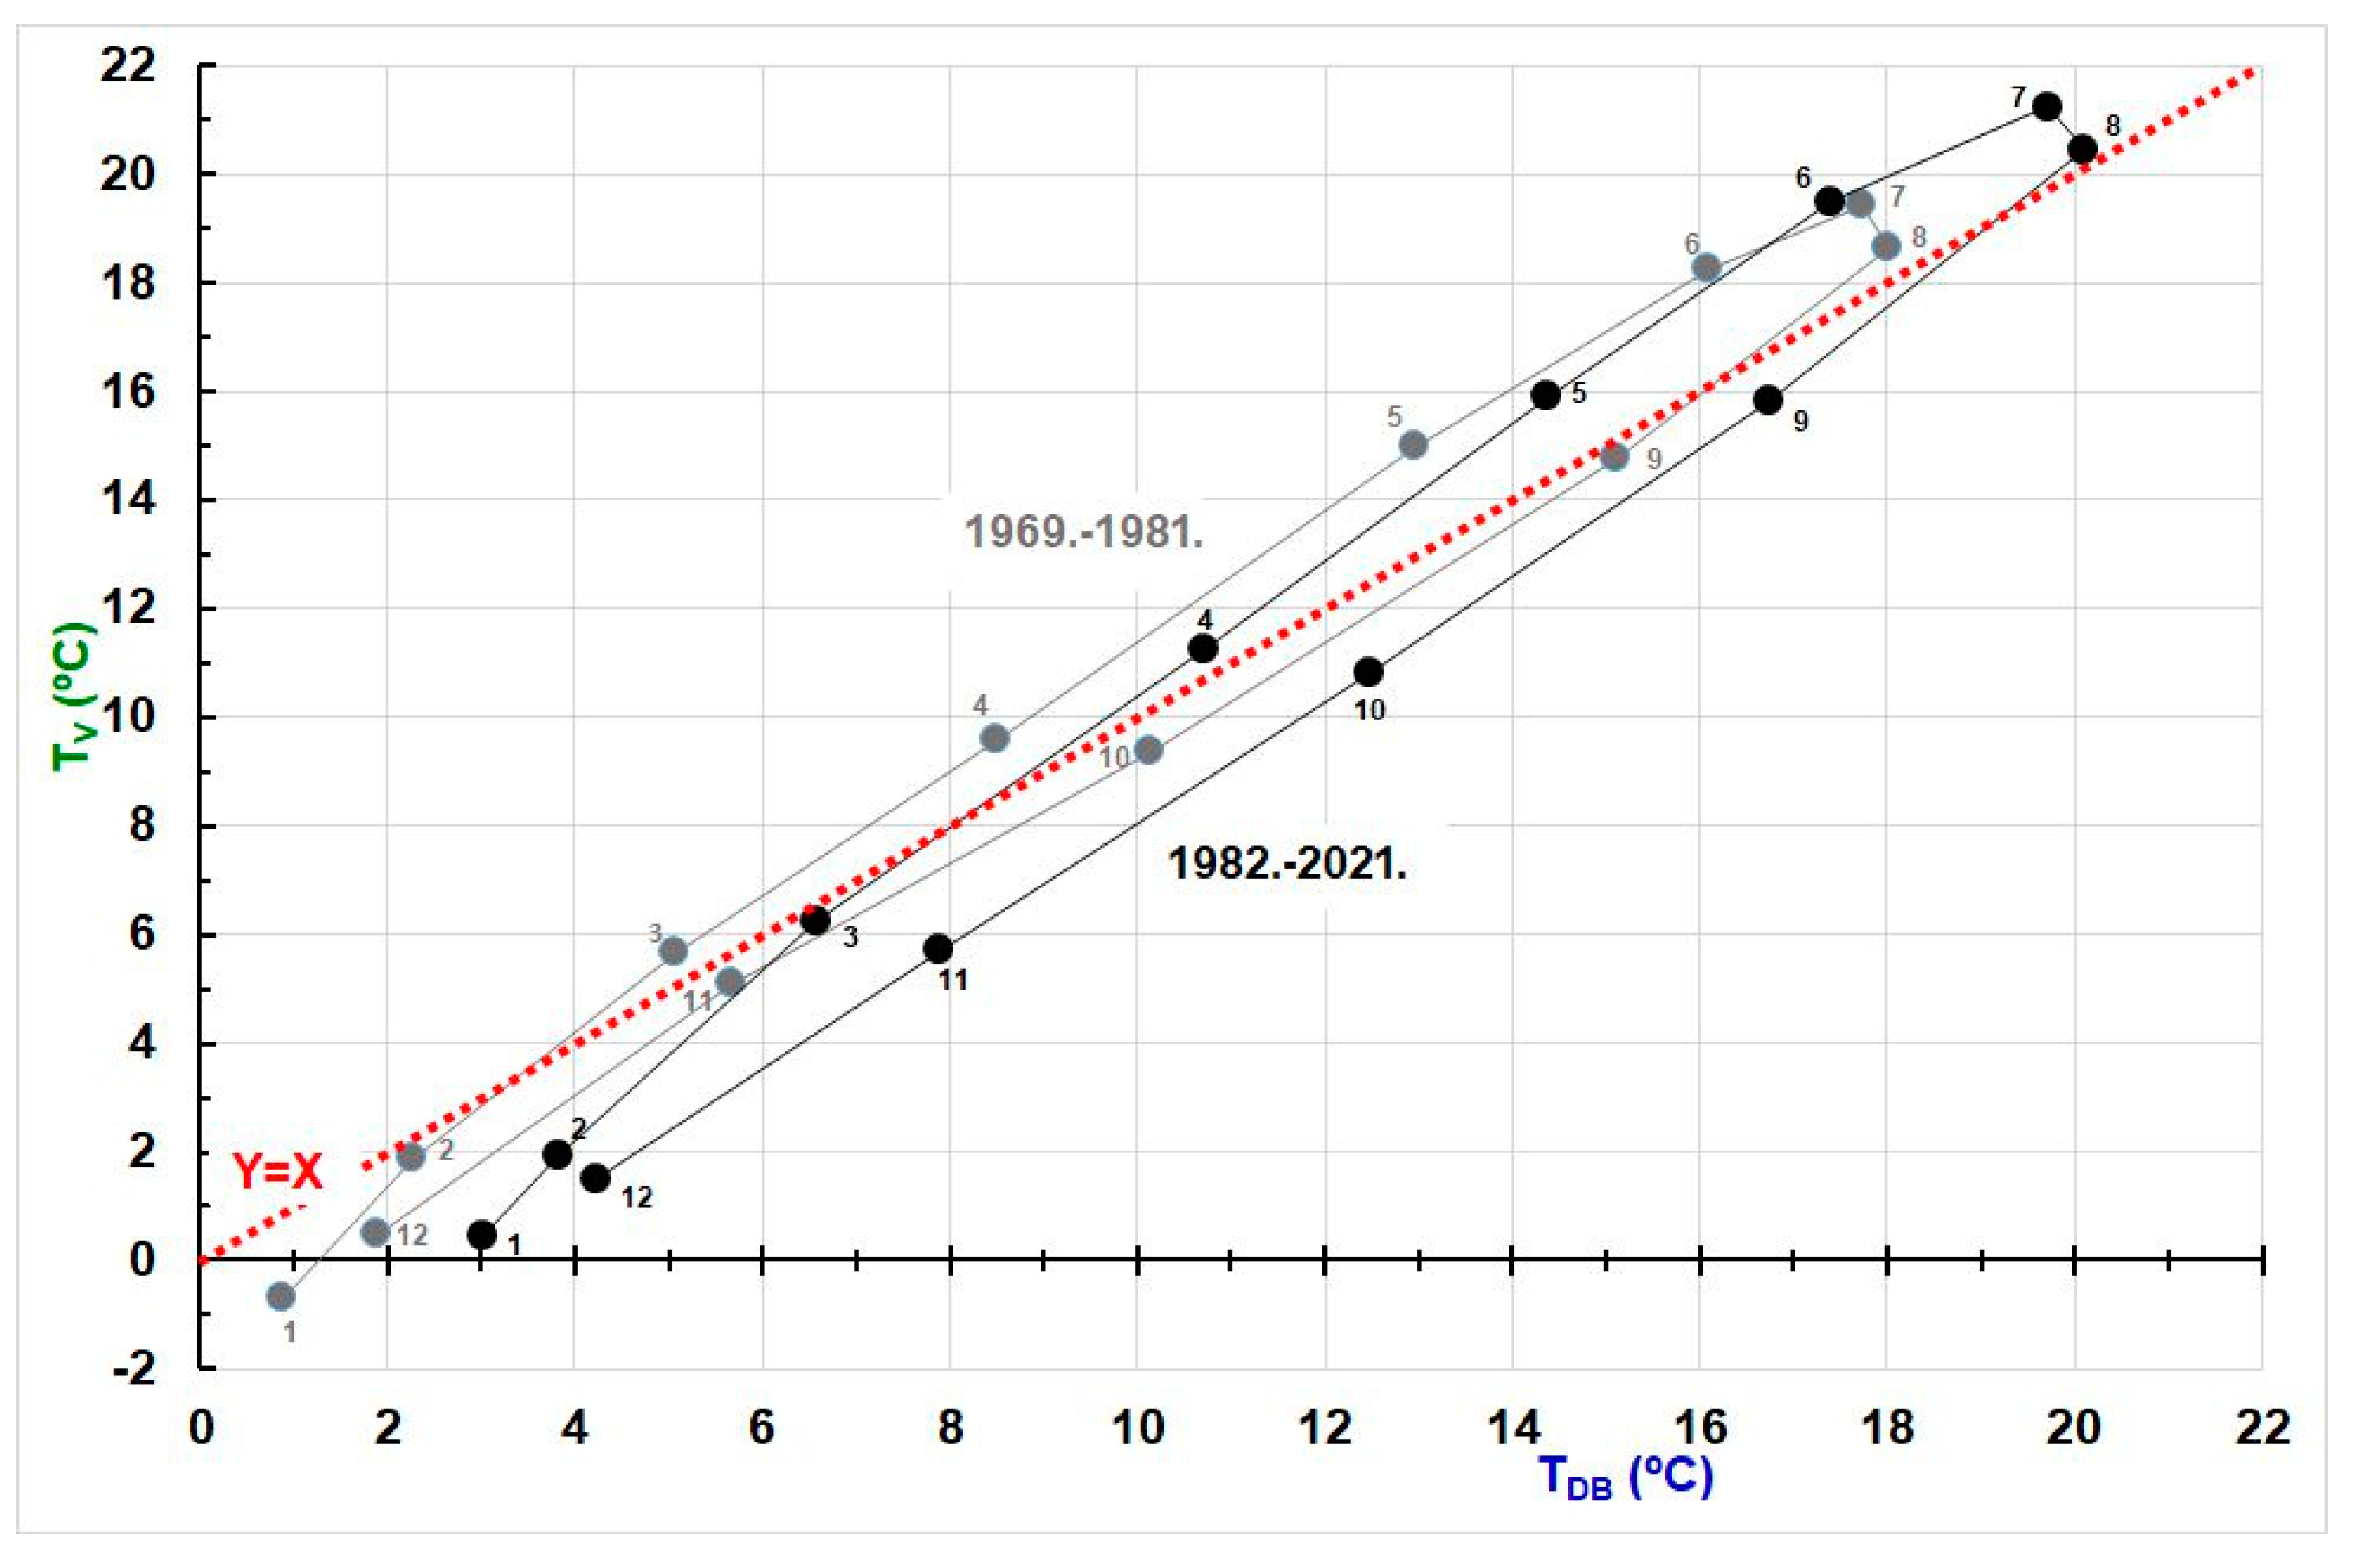
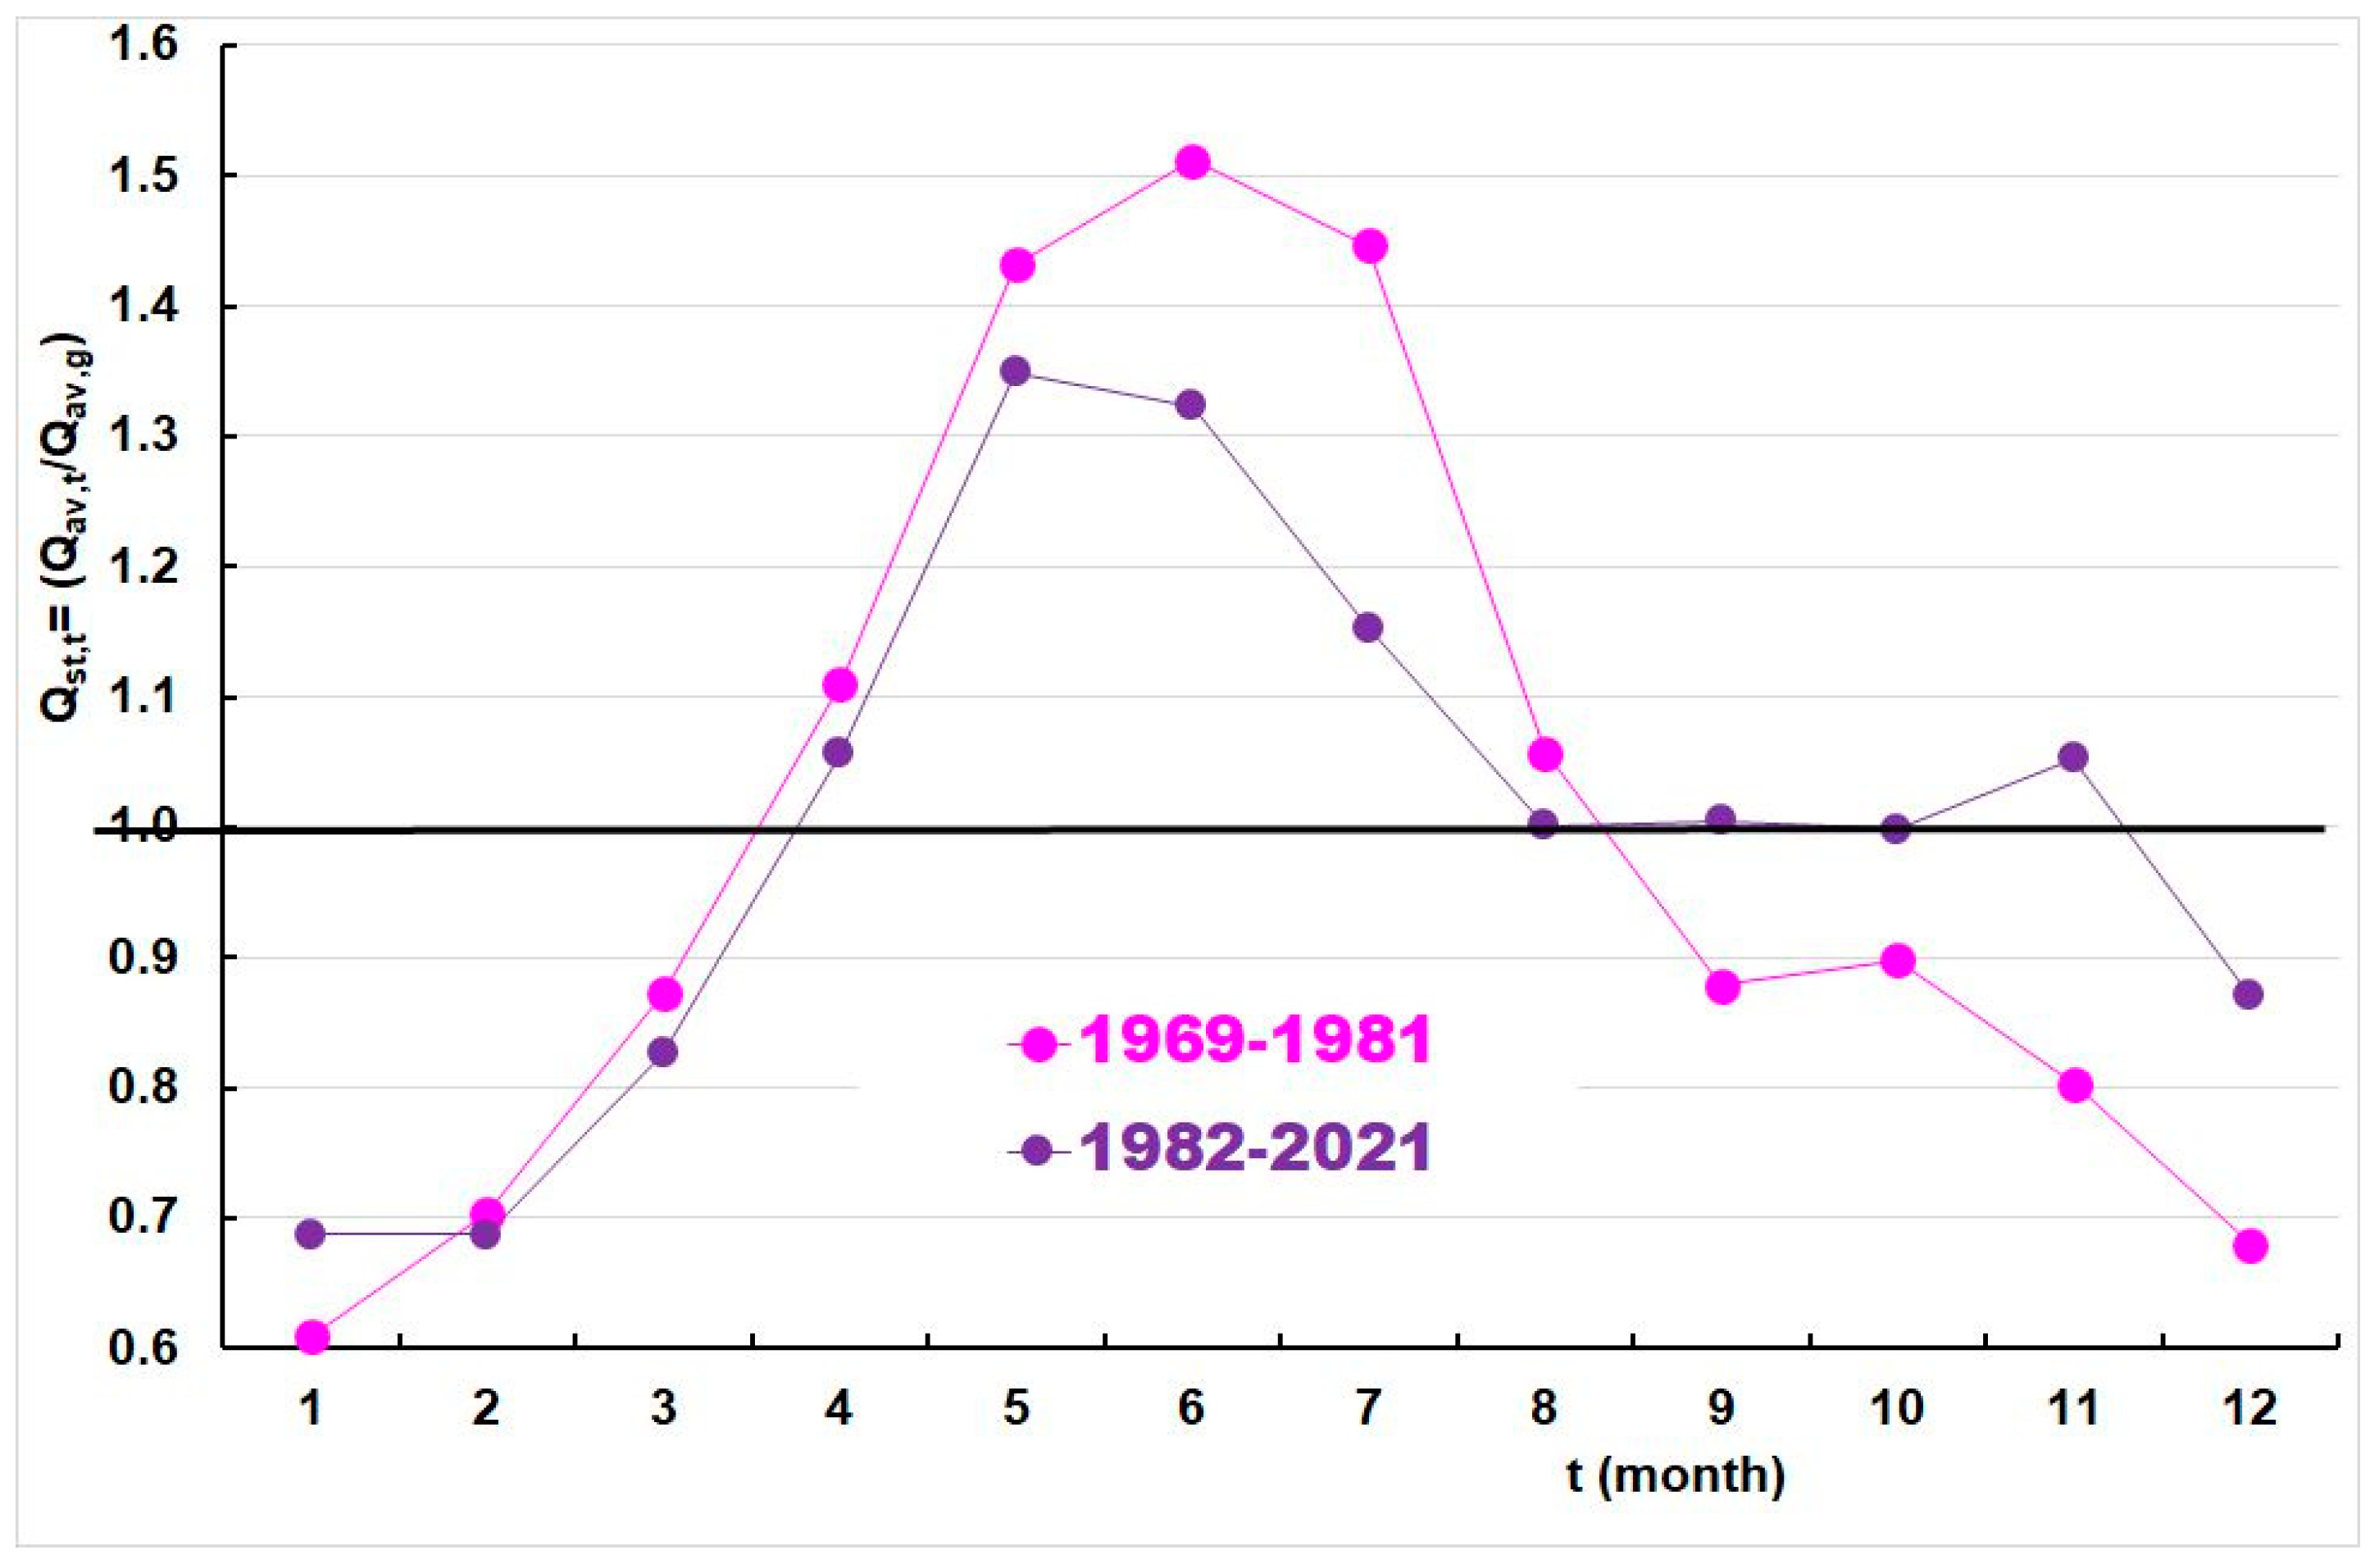
4.2. A Month as a Time Increment of Analysis
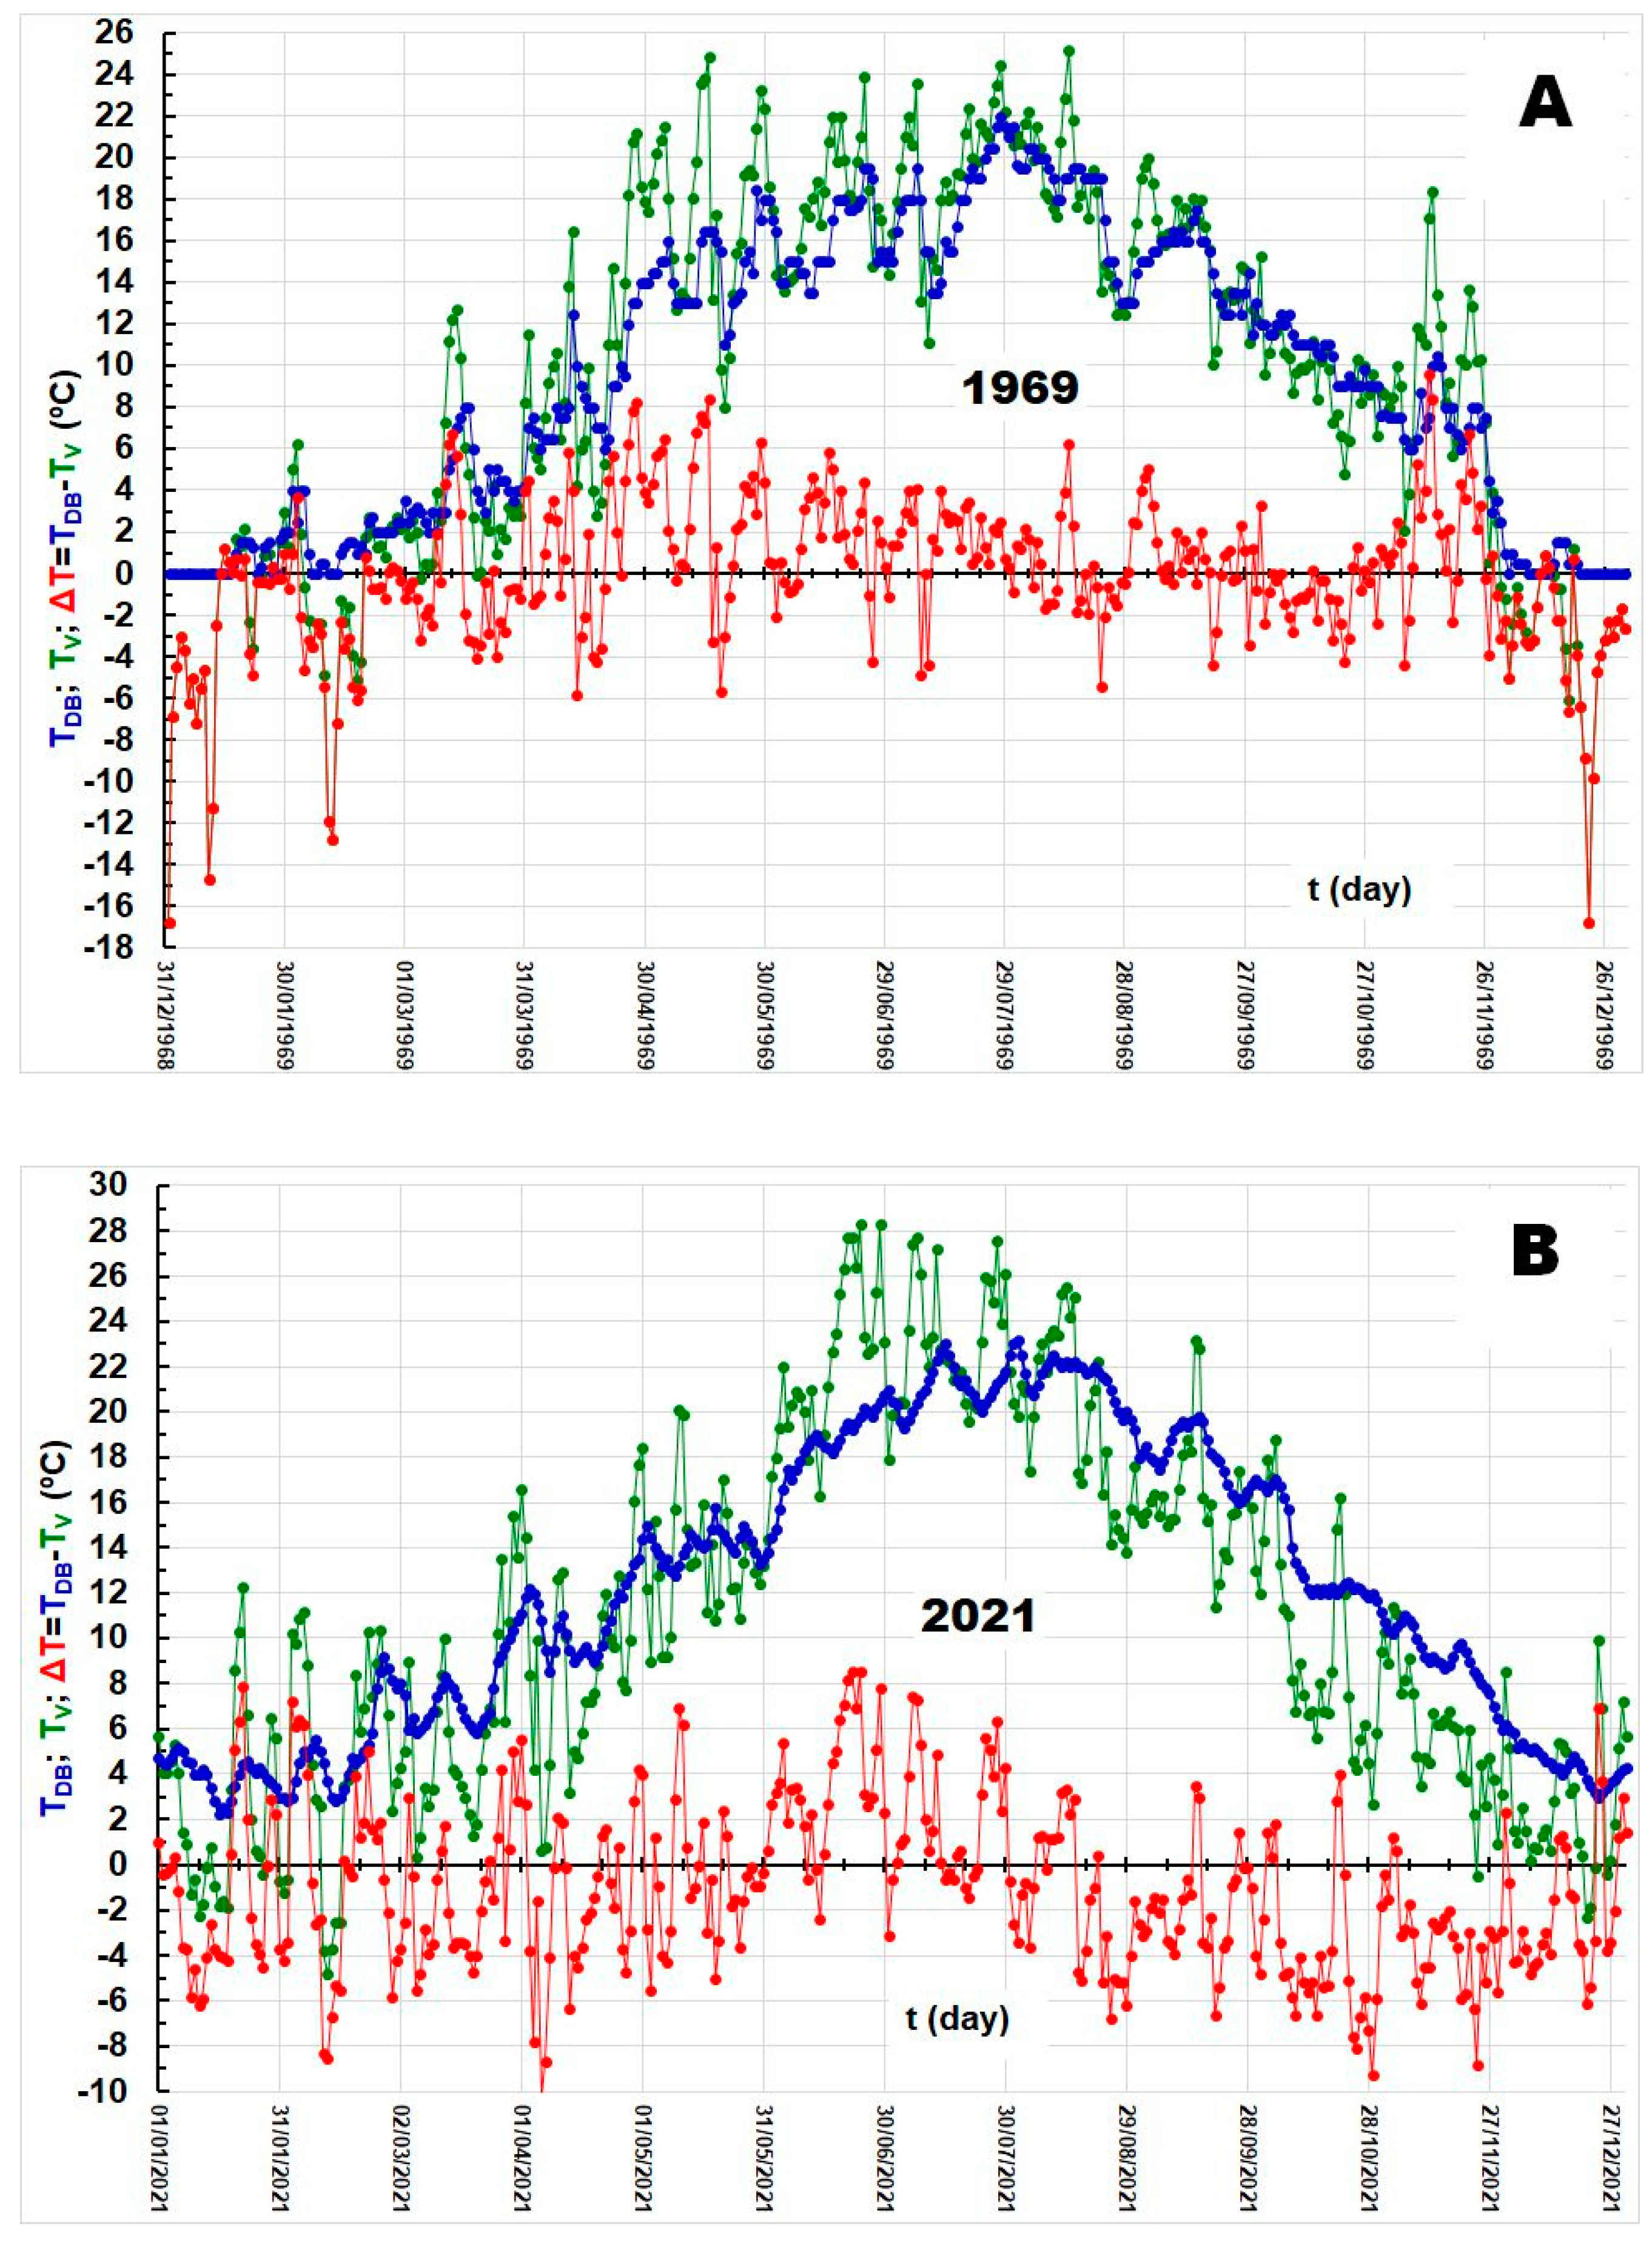
4.3. Day as a Time Increment of the Analysis
5. Conclusions
Author Contributions
Funding
Institutional Review Board Statement
Informed Consent Statement
Data Availability Statement
Acknowledgments
Conflicts of Interest
References
- Bonacci, O. River—The bloodstream of landscape and catchment. Acta Hydrotech. 2016, 29, 1–12. [Google Scholar]
- Ahmadi-Nedushan, B.; St-Hilaire, A.; Ouarda, T.B.M.J.; Bilodeau, L.; Robichaud, É.; Thiémonge, N.; Bobée, B. Predicting river water temperatures using stochastic models: Case study of the Moisie River (Québec, Canada). Hydrol. Process. 2006, 21, 21–34. [Google Scholar] [CrossRef]
- Łaszewski, M. Stream water temperature: A short review with special reference to diurnal dynamics. Misc. Geogr. 2013, 17, 34–41. [Google Scholar] [CrossRef]
- van Vliet, M.T.; Franssen, W.H.; Yearsley, J.R.; Ludwig, F.; Haddeland, I.; Lettenmaier, D.P.; Kabat, P. Global river discharge and water temperature under climate change. Glob. Environ. Chang. 2013, 23, 450–464. [Google Scholar] [CrossRef]
- Webb, B.; Walling, D. Temporal variability in the impact of river regulation on thermal regime and some biological implications. Freshw. Biol. 1993, 29, 167–182. [Google Scholar] [CrossRef]
- Ducharne, A. Importance of stream temperature to climate change impact on water quality. Hydrol. Earth Syst. Sci. 2008, 12, 797–810. [Google Scholar] [CrossRef]
- Mohseni, O.; Stefan, H.G.; Eaton, J.G. Global Warming and Potential Changes in Fish Habitat in U.S. Streams. Clim. Chang. 2003, 59, 389–409. [Google Scholar] [CrossRef]
- Padilla, A.; Rasouli, K.; Déry, S.J. Impacts of variability and trends in runoff and water temperature on salmon migration in the Fraser River Basin, Canada. Hydrol. Sci. J. 2015, 60, 523–533. [Google Scholar] [CrossRef]
- Vishwakarma, D.K.; Ali, R.; Bhat, S.A.; Elbeltagi, A.; Kushwaha, N.L.; Kumar, R.; Rajput, J.; Heddam, S.; Kuriqi, A. Pre- and post-dam river water temperature alteration prediction using advanced machine learning models. Environ. Sci. Pollut. Res. 2022. online ahead of print. [Google Scholar] [CrossRef]
- Stefan, H.G.; Sinokrot, B.A. Projected global climate change impact on water temperatures in five north central U.S. streams. Clim. Chang. 1993, 24, 353–381. [Google Scholar] [CrossRef]
- Webb, B.W.; Nobilis, F. Long-term changes in river temperature and the influence of climatic and hydrological factors. Hydrol. Sci. J. 2007, 52, 74–85. [Google Scholar] [CrossRef]
- Hannah, D.M.; Webb, B.W.; Nobilis, F. River and stream temperature: Dynamics, processes, models and implications. Hydrol. Process. 2008, 22, 899–901. [Google Scholar] [CrossRef]
- Webb, B.W.; Hannah, D.M.; Moore, R.D.; Brown, L.E.; Nobilis, F. Recent advances in stream and river temperature research. Hydrol. Process. 2008, 22, 902–918. [Google Scholar] [CrossRef]
- Toffolon, M.; Piccolroaz, S. A hybrid model for river water temperature as a function of air temperature and discharge. Environ. Res. Lett. 2015, 10, 114011. [Google Scholar] [CrossRef]
- Arora, R.; Tockner, K.; Venohr, M. Changing river temperatures in northern Germany: Trends and drivers of change. Hydrol. Process. 2016, 30, 3084–3096. [Google Scholar] [CrossRef]
- Basarin, B.; Lukić, T.; Pavić, D.; Wilby, R.L. Trends and multi-annual variability of water temperatures in the river Danube, Serbia. Hydrol. Process. 2016, 30, 3315–3329. [Google Scholar] [CrossRef]
- Graf, R. A multifaceted analysis of the relationship between daily temperature of river water and air. Acta Geophys. 2019, 67, 905–920. [Google Scholar] [CrossRef]
- Zhu, S.; Bonacci, O.; Oskoruš, D.; Hadzima-Nyarko, M.; Wu, S. Long term variations of river temperature and the influence of air temperature and river discharge: Case study of Kupa River watershed in Croatia. J. Hydrol. Hydromech. 2019, 67, 305–313. [Google Scholar] [CrossRef]
- Graf, R.; Wrzesiński, D. Detecting Patterns of Changes in River Water Temperature in Poland. Water 2020, 12, 1327. [Google Scholar] [CrossRef]
- Ptak, M.; Sojka, M.; Graf, R.; Choiński, A.; Zhu, S.; Nowak, B. Warming Vistula River—The effects of climate and local conditions on water temperature in one of the largest rivers in Europe. J. Hydrol. Hydromech. 2022, 70, 1–11. [Google Scholar] [CrossRef]
- Hadzima-Nyarko, M.; Rabi, A.; Šperac, M. Implementation of Artificial Neural Networks in Modeling the Water-Air Temperature Relationship of the River Drava. Water Resour. Manag. 2014, 28, 1379–1394. [Google Scholar] [CrossRef]
- Zhu, S.; Hadzima-Nyarko, M.; Bonacci, O. Application of machine learning models in hydrology: Case study of river temperature forecasting in the Drava River using coupled wavelet analysis and adaptive neuro-fuzzy inference systems model. In Basics of Computational Geophysics; Elsevier: Kidlington, UK, 2021; pp. 399–411. [Google Scholar] [CrossRef]
- Bonacci, O.; Trninić, D.; Roje-Bonacci, T. Analysis of the water temperature regime of the Danube and its tributaries in Croatia. Hydrol. Process. 2008, 22, 1014–1021. [Google Scholar] [CrossRef]
- Rabi, A.; Hadzima-Nyarko, M.; Šperac, M. Modelling river temperature from air temperature: Case of the River Drava (Croatia). Hydrol. Sci. J. 2015, 60, 1490–1507. [Google Scholar] [CrossRef]
- Lóczy, D. The Drava River—Environmental Problems and Solutions; Springer: Cham, Switzerland, 2019. [Google Scholar]
- Google Maps. 2022. Available online: https://www.google.com/maps/@46.2678219,16.7078867,8.56z (accessed on 2 August 2022).
- Visit Croatia. Available online: https://www.visit-croatia.co.uk/map-of-croatia/croatia-map/co.uk/map-of-croatia/croatia-map/ (accessed on 10 August 2022).
- CHMS 2022. Main Meteorological Stations. Available online: http://prognoza.hr/karte_postaja.php?id=glavne (accessed on 19 July 2022).
- Bonacci, O.; Oskoruš, D. The changes in the lower Drava River water level, discharge and suspended sediment regime. Environ. Earth Sci. 2010, 59, 1661–1670. [Google Scholar] [CrossRef]
- Mann, H.B. Nonparametric tests against trend. Econometrica 1945, 13, 245–259. [Google Scholar] [CrossRef]
- Kendall, M.G. Rank Correlation Methods, 4th ed.; Charles Griffin: London, UK, 1975. [Google Scholar]
- Hussain; Mahmud, I. pyMannKendall: A python package for non parametric Mann Kendall family of trend tests. J. Open Source Softw. 2019, 4, 1556. [Google Scholar] [CrossRef]
- McGhee, J.W. Introductory Statistics; West Publishing Company: St. Paul, MN, USA; New York, NY, USA, 1985. [Google Scholar]
- Karl, T.R.; Knight, R.W.; Plummer, N. Trends in high-frequency climate variability in the twentieth century. Nature 1995, 377, 217–220. [Google Scholar] [CrossRef]
- Moberg, A.; Jones, P.D.; Barriendos, M.; Bergström, H.; Camuffo, D.; Cocheo, C.; Davies, T.D.; Demarée, G.; Martín-Vide, J.; Maugeri, M.; et al. Day-to-day temperature variability trends in 160- to 275-year-long European instrumental records. J. Geophys. Res. Earth Surf. 2000, 105, 22849–22868. [Google Scholar] [CrossRef]
- Gough, W.A. Theoretical considerations of day-to-day temperature variability applied to Toronto and Calgary, Canada data. Arch. Meteorol. Geophys. Bioclimatol. Ser. B 2008, 94, 97–105. [Google Scholar] [CrossRef]
- Gough, W.A. Thermal Metrics to Identify Canadian Coastal Environments. Coasts 2022, 2, 93–101. [Google Scholar] [CrossRef]
- Tam, B.Y.; Gough, W.A. Examining past temperature variability in Moosonee, Thunder Bay, and Toronto, Ontario, Canada through a day-to-day variability framework. Arch. Meteorol. Geophys. Bioclimatol. Ser. B 2012, 110, 103–113. [Google Scholar] [CrossRef]
- Tam, B.Y.; Gough, W.A.; Mohsin, T. The impact of urbanization and the urban heat island effect on day to day temperature variation. Urban Clim. 2015, 12, 1–10. [Google Scholar] [CrossRef]
- Gough, W.A.; Hu, Y. Day-to-day temperature variability for four urban areas in China. Urban Clim. 2016, 17, 80–88. [Google Scholar] [CrossRef]
- Anderson, C.I.; Gough, W.A.; Mohsin, T. Characterization of the urban heat island at Toronto: Revisiting the choice of rural sites using a measure of day-to-day variation. Urban Clim. 2018, 25, 187–195. [Google Scholar] [CrossRef]
- Bonacci, O.; Bonacci, D.; Roje-Bonacci, T. Different air temperature changes in continental and Mediterranean regions: A case study from two Croatian stations. Theor. Appl. Climatol. 2021, 145, 1333–1346. [Google Scholar] [CrossRef]
- Bonacci, O.; Roje-Bonacci, T. Primjena metode dan za danom (day to day) varijabilnosti temperature zraka na podatcima opaženim na opservatoriju Zagreb-Grič (1887–2018.). Hrvatske Vode 2020, 28, 125–134. [Google Scholar]
- Gough, W.A.; Shi, B. Impact of Coastalization on Day-to-Day Temperature Variability along China’s East Coast. J. Coast. Res. 2020, 36, 451. [Google Scholar] [CrossRef]
- Li, S.-F.; Jiang, D.-B.; Lian, Y.; Yao, Y.-X. Trends in day-to-day variability of surface air temperature in China during 1961–2012. Atmos. Ocean. Sci. Lett. 2017, 10, 122–129. [Google Scholar] [CrossRef]
- Wu, F.; Fu, C.; Qian, Y.; Gao, Y.; Wang, S. High-frequency daily temperature variability in China and its relationship to large-scale circulation. Int. J. Clim. 2017, 37, 570–582. [Google Scholar] [CrossRef]


| L (km) | Drava Botovo | GMP Varaždin | A1 | A2 | A3 |
|---|---|---|---|---|---|
| Drava Botovo | - | 29 | 36 | 22 | 11 (28 *) |
| GMP Varaždin | - | 16 | 3.2 | 18 | |
| A1 | - | 9.8 | 26.8 | ||
| A2 | - | 5.2 | |||
| A3 | - |
| A1 | A2 | A3 | |
|---|---|---|---|
| Starting of the work (years) | 1975 | 1982 | 1989 |
| Volume (106 m3) | 8.0 | 51.0 | 93.5 |
| Area (km2) | 3.0 | 10.5 | 16.6 |
| Max. altitude (m asl) | 191.0 | 168.0 | 149.6 |
| TDB | TV | ΔT | DTDDB | DTDV | ΔDTD | Q | |
| °C | m3/s | ||||||
| 1 | 2 | 3 | 4 | 5 | 6 | 7 | |
| minimum | 8.85 | 8.98 | −0.81 | 0.17 | 1.59 | 1.12 | 327 |
| average | 10.99 | 10.67 | 0.32 | 0.045 | 1.95 | 1.49 | 490 |
| maximum | 13.04 | 12.31 | 1.15 | 0.65 | 2.31 | 2.15 | 739 |
| R2 | 0.7253 | 0.5833 | 0.1668 | −0.542 | 0.0428 | 0.329 | −0.0146 |
| p | p < 0.01 | p < 0.01 | p < 0.01 | p < 0.01 | p > 0.01 | p < 0.01 | p > 0.01 |
| TDB | TV | ΔT | |||||||
|---|---|---|---|---|---|---|---|---|---|
| Min. | Aver. | Max. | Min. | Aver. | Max. | Min. | Aver. | Max. | |
| January | 0.1 | 2.49 | 6.6 | −6.0 | 0.17 | 5.8 | −1.2 | 2.32 | 6.9 |
| February | 0.4 | 3.45 | 7.5 | −4.5 | 1.92 | 7.1 | −1.1 | 1.53 | 5.7 |
| March | 3.5 | 6.21 | 9.4 | 0.4 | 6.10 | 9.9 | −2.7 | 0.11 | 3.1 |
| April | 7.2 | 10.17 | 13.0 | 8.0 | 10.83 | 15.1 | −3.4 | −0.66 | 1.7 |
| May | 10.9 | 14.03 | 16.7 | 12.2 | 15.67 | 18.7 | −3.8 | −1.64 | 0.7 |
| June | 14.5 | 17.08 | 21.3 | 16.7 | 19.19 | 23.8 | −4.0 | −2.11 | −0.6 |
| July | 15.5 | 19.23 | 22.4 | 17.8 | 20.80 | 23.0 | −3.5 | −1.57 | 0.9 |
| August | 16.3 | 19.59 | 23.5 | 16.3 | 20.00 | 24.5 | −2.5 | −0.42 | 1.7 |
| September | 12.9 | 16.33 | 19.5 | 12.3 | 15.56 | 18.4 | −1.8 | 0.77 | 5 |
| October | 8.1 | 11.90 | 15.7 | 6.6 | 10.46 | 13.8 | −0.3 | 1.44 | 4.1 |
| November | 3.5 | 7.35 | 10.3 | 0.8 | 5.56 | 9.5 | −2.0 | 1.79 | 5.1 |
| December | 0.3 | 3.65 | 6.2 | −3.2 | 1.25 | 4.7 | −0.5 | 2.40 | 5.2 |
| TDB | TV | ΔT | ||||
|---|---|---|---|---|---|---|
| R2 | p | R2 | p | R2 | p | |
| January | 0.419 | p < 0.01 | 0.089 | p < 0.01 | 0.088 | p > 0.01 |
| February | 0.235 | p < 0.01 | 0.054 | p > 0.01 | 0.007 | p > 0.01 |
| March | 0.268 | p < 0.01 | 0.081 | p > 0.01 | 0.028 | p > 0.01 |
| April | 0.542 | p < 0.01 | 0.323 | p < 0.01 | 0.041 | p > 0.01 |
| May | 0.194 | p < 0.01 | 0.037 | p > 0.01 | 0.096 | p > 0.01 |
| June | 0.286 | p < 0.01 | 0.407 | p < 0.01 | 0.090 | p > 0.01 |
| July | 0.312 | p < 0.01 | 0.441 | p < 0.01 | 0.000 | p > 0.01 |
| August | 0.304 | p < 0.01 | 0.286 | p < 0.01 | 0.008 | p > 0.01 |
| September | 0.264 | p < 0.01 | 0.088 | p > 0.01 | 0.148 | p < 0.01 |
| October | 0.463 | p < 0.01 | 0.212 | p < 0.01 | 0.061 | p > 0.01 |
| November | 0.546 | p < 0.01 | 0.113 | p < 0.01 | 0.081 | p > 0.01 |
| December | 0.506 | p < 0.01 | 0.125 | p < 0.01 | 0.081 | p > 0.01 |
| Months | Subperiods | Tdb | Tv | Δt | |||
|---|---|---|---|---|---|---|---|
| Average | p | Average | p | Average | p | ||
| January | 1969–1981 | 0.89 | p < 0.01 | −0.69 | p > 0.01 | 1.58 | p > 0.01 |
| 1982–2021 | 3.01 | 0.45 | 2.56 | ||||
| February | 1969–1981 | 2.27 | p < 0.01 | 1.85 | p > 0.01 | 0.42 | p < 0.01 |
| 1982–2021 | 3.84 | 1.95 | 1.89 | ||||
| March | 1969–1981 | 5.08 | p < 0.01 | 5.66 | p > 0.01 | −0.58 | p > 0.01 |
| 1982–2021 | 6.58 | 6.25 | 0.34 | ||||
| April | 1969–1981 | 8.51 | p < 0.01 | 9.56 | p < 0.01 | 1.05 | p > 0.01 |
| 1982–2021 | 10.71 | 11.24 | −0.53 | ||||
| May | 1969–1981 | 12.96 | p < 0.01 | 14.97 | p > 0.01 | −2.01 | p > 0.01 |
| 1982–2021 | 14.37 | 15.89 | −1.52 | ||||
| June | 1969–1981 | 16.10 | p < 0.01 | 18.25 | p < 0.01 | −2.15 | p > 0.01 |
| 1982–2021 | 17.40 | 19.50 | −2.10 | ||||
| July | 1969–1981 | 17.75 | p < 0.01 | 19.42 | p < 0.01 | −1.68 | p > 0.01 |
| 1982–2021 | 19.71 | 21.24 | −1.53 | ||||
| August | 1969–1981 | 18.01 | p < 0.01 | 18.62 | p < 0.01 | −0.62 | p > 0.01 |
| 1982–2021 | 20.10 | 20.45 | −0.35 | ||||
| September | 1969–1981 | 15.10 | p < 0.01 | 14.75 | p > 0.01 | 0.35 | p > 0.01 |
| 1982–2021 | 16.73 | 15.82 | 0.91 | ||||
| October | 1969–1981 | 10.15 | p < 0.01 | 9.35 | p < 0.01 | 0.80 | p > 0.01 |
| 1982–2021 | 12.46 | 10.82 | 1.65 | ||||
| November | 1969–1981 | 5.68 | p < 0.01 | 5.08 | p > 0.01 | 0.60 | p < 0.01 |
| 1982–2021 | 7.90 | 5.72 | 2.18 | ||||
| December | 1969–1981 | 1.88 | p < 0.01 | 0.48 | p > 0.01 | 1.41 | p < 0.01 |
| 1982–2021 | 4.23 | 1,50 | 2.73 | ||||
Publisher’s Note: MDPI stays neutral with regard to jurisdictional claims in published maps and institutional affiliations. |
© 2022 by the authors. Licensee MDPI, Basel, Switzerland. This article is an open access article distributed under the terms and conditions of the Creative Commons Attribution (CC BY) license (https://creativecommons.org/licenses/by/4.0/).
Share and Cite
Bonacci, O.; Đurin, B.; Bonacci, T.R.; Bonacci, D. The Influence of Reservoirs on Water Temperature in the Downstream Part of an Open Watercourse: A Case Study at Botovo Station on the Drava River. Water 2022, 14, 3534. https://doi.org/10.3390/w14213534
Bonacci O, Đurin B, Bonacci TR, Bonacci D. The Influence of Reservoirs on Water Temperature in the Downstream Part of an Open Watercourse: A Case Study at Botovo Station on the Drava River. Water. 2022; 14(21):3534. https://doi.org/10.3390/w14213534
Chicago/Turabian StyleBonacci, Ognjen, Bojan Đurin, Tanja Roje Bonacci, and Duje Bonacci. 2022. "The Influence of Reservoirs on Water Temperature in the Downstream Part of an Open Watercourse: A Case Study at Botovo Station on the Drava River" Water 14, no. 21: 3534. https://doi.org/10.3390/w14213534
APA StyleBonacci, O., Đurin, B., Bonacci, T. R., & Bonacci, D. (2022). The Influence of Reservoirs on Water Temperature in the Downstream Part of an Open Watercourse: A Case Study at Botovo Station on the Drava River. Water, 14(21), 3534. https://doi.org/10.3390/w14213534