Spatiotemporal Variation and Influence Factors of Vegetation Cover in the Yellow River Basin (1982–2021) Based on GIMMS NDVI and MOD13A1
Abstract
:1. Introduction
2. Study Area and Datasets
2.1. Study Area
2.2. Datasets
3. Methodology
3.1. Dataset Preprocessing
3.2. Data Fusion
- (1)
- Resampling MOD13A3 NDVI. The bilinear interpolation method is used to resample MOD13A3 NDVI in the YRB from 2000 to 2021 to 8 km;
- (2)
- Establishing a consistency correction model. The spectral resolution of different sensors is different. In order to maintain the consistency of the NDVI dataset generated by data fusion [19], the resampled MOD13A3 NDVI should be corrected. Previous studies have shown that NDVI from different sensors has a certain linear correlation [19]. Therefore, this study intends to establish a unary linear regression model pixel by pixel to correct the resampled MOD13A3 NDVI based on the resampled MOD13A3 NDVI and GIMMS NDVI from 2000 to 2015. The model is as follows:
- (3)
- Establishing an 8 km scale NDVI dataset for the YRB from 1982 to 2021. The above model is used to correct the resampling MOD13A3 NDVI data from 2016 to 2021 and then combined with GIMMS NDVI data from 1982 to 2015 to generate an 8 km scale NDVI dataset of the YRB from 1982 to 2021.
3.3. Spatiotemporal Dynamic Analysis
3.4. Influence Factors Analysis
- (1)
- Building the bivariate linear regression model per pixel and predicting NDVI value (NDVICC) only affected by climate change.where Tem and Pre represent the average temperature and cumulative precipitation pre pixels from March to October, respectively. a, b, and c represent the model parameters, which are obtained by least square fitting using data from 1982 to 2000.
- (2)
- Predicting NDVI value (NDVIHA) affected by human activities.where NDVI indicates the annual NDVI value of each pixel.
- (3)
- Exploring the influencing factors of vegetation cover change.
4. Results
4.1. Spatial Pattern of Vegetation Cover in the YRB
4.2. Temporal Variation Characteristics of Vegetation Cover in the YRB
4.3. Influence Factors of Vegetation Cover Change in the YRB
5. Discussion
6. Conclusions
- (1)
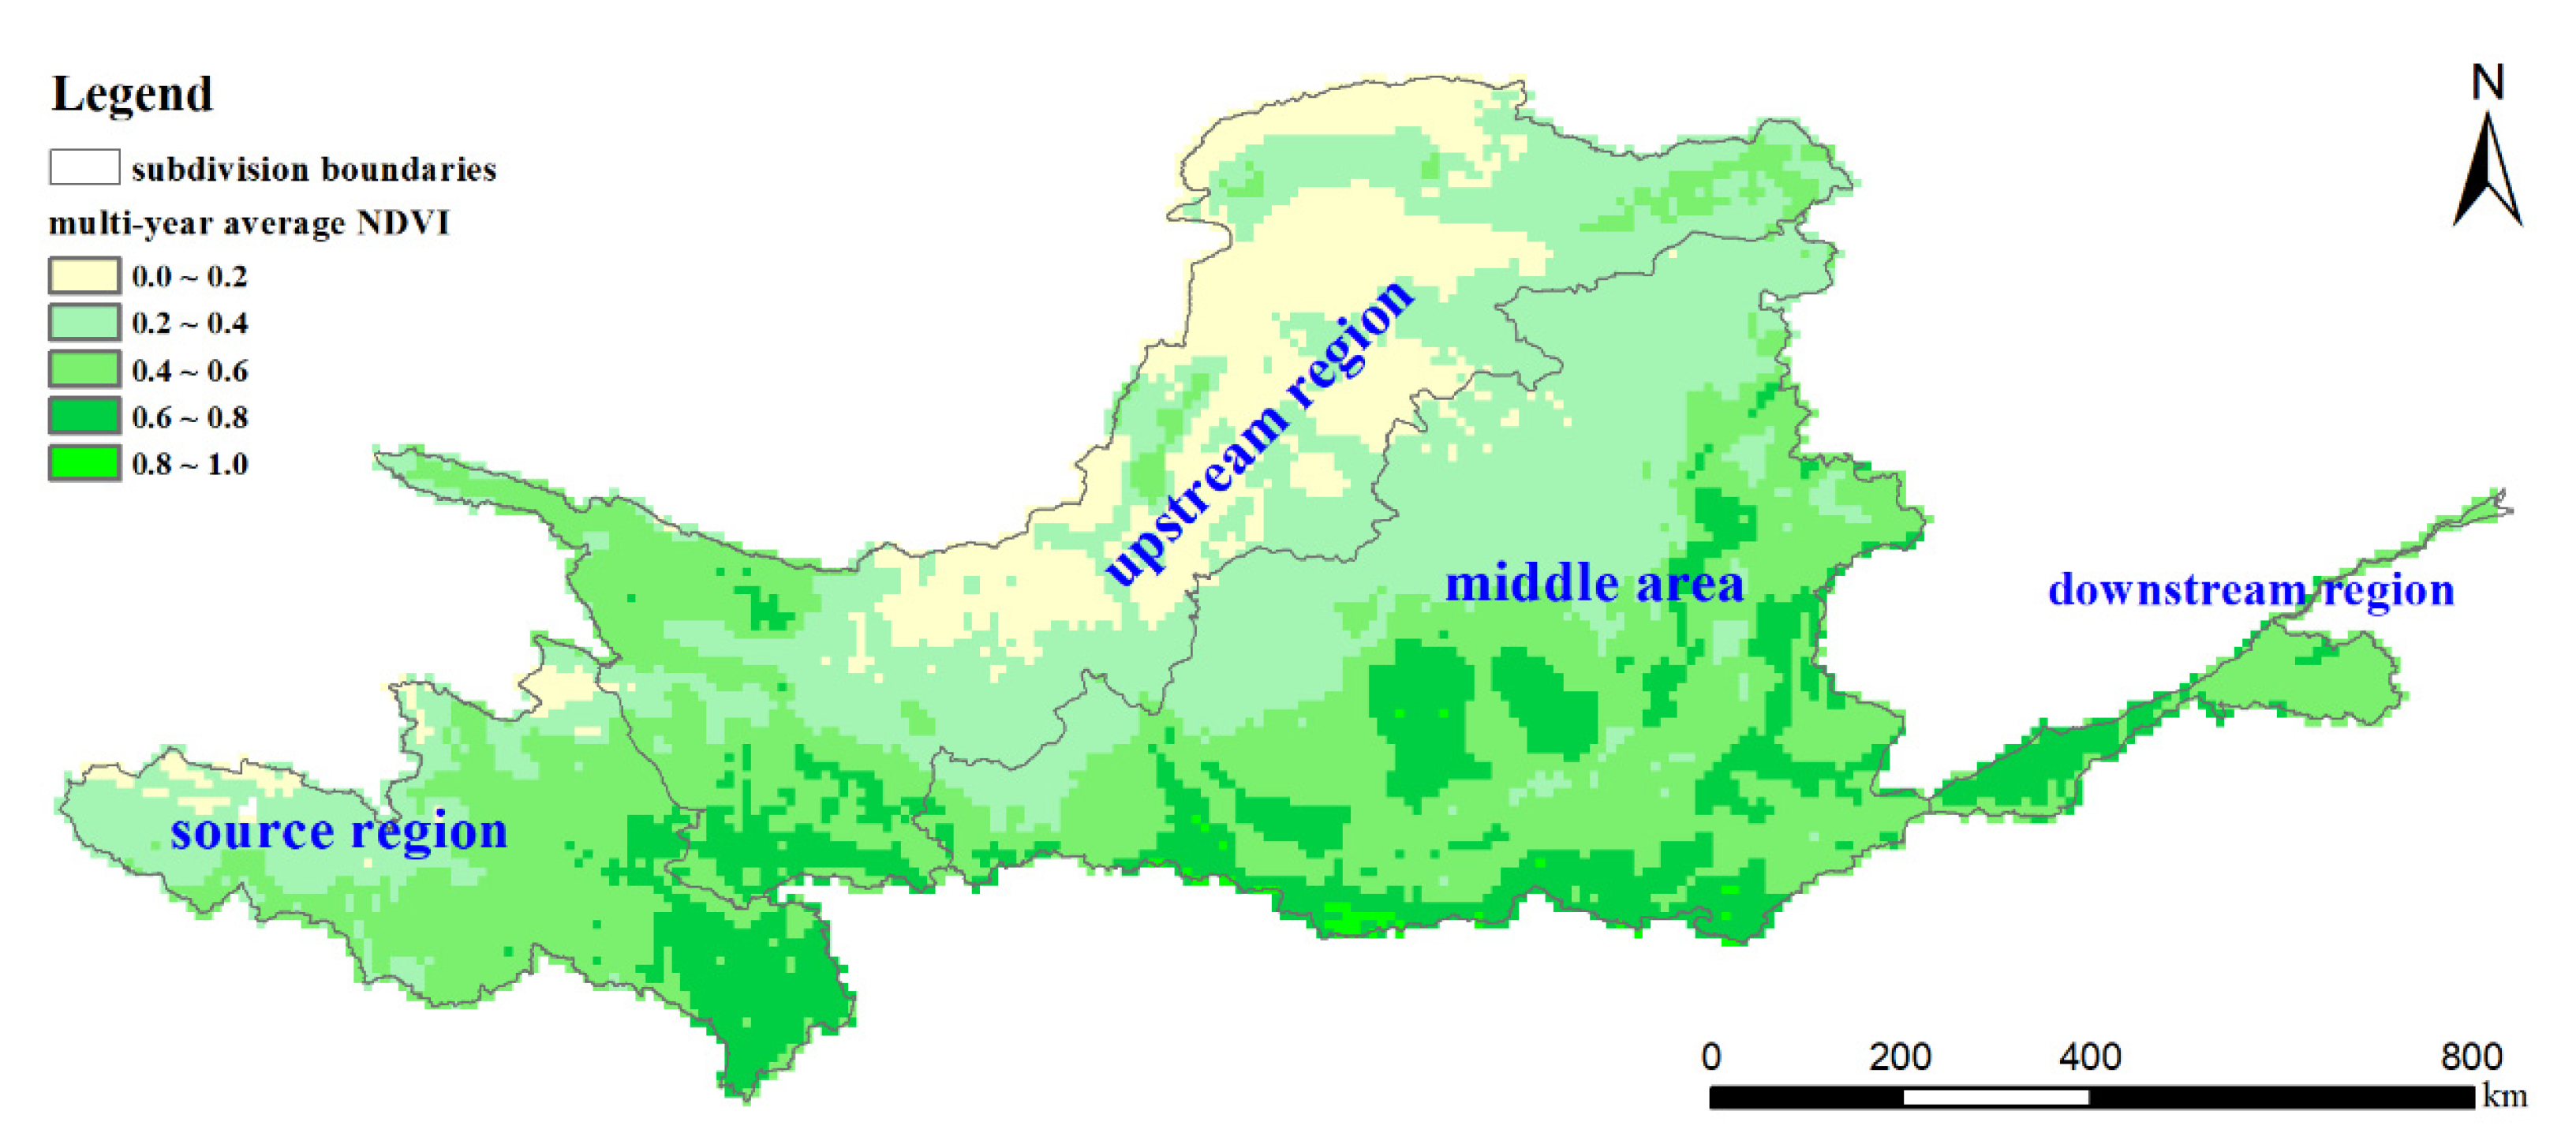
- In terms of spatial distribution, the vegetation cover in the YRB shows obvious spatial heterogeneity, which gradually increased from northwest to southeast, and the vegetation cover in the upper reaches of the YRB is the worst. The monthly average NDVI increases first and then decreases, and the NDVI in August is the largest (0.4936), which may be mainly due to the high temperature and high precipitation in the YRB in August. The interannual variation showed a fluctuating growth trend, with an increase rate of 0.019/10a.
- (2)
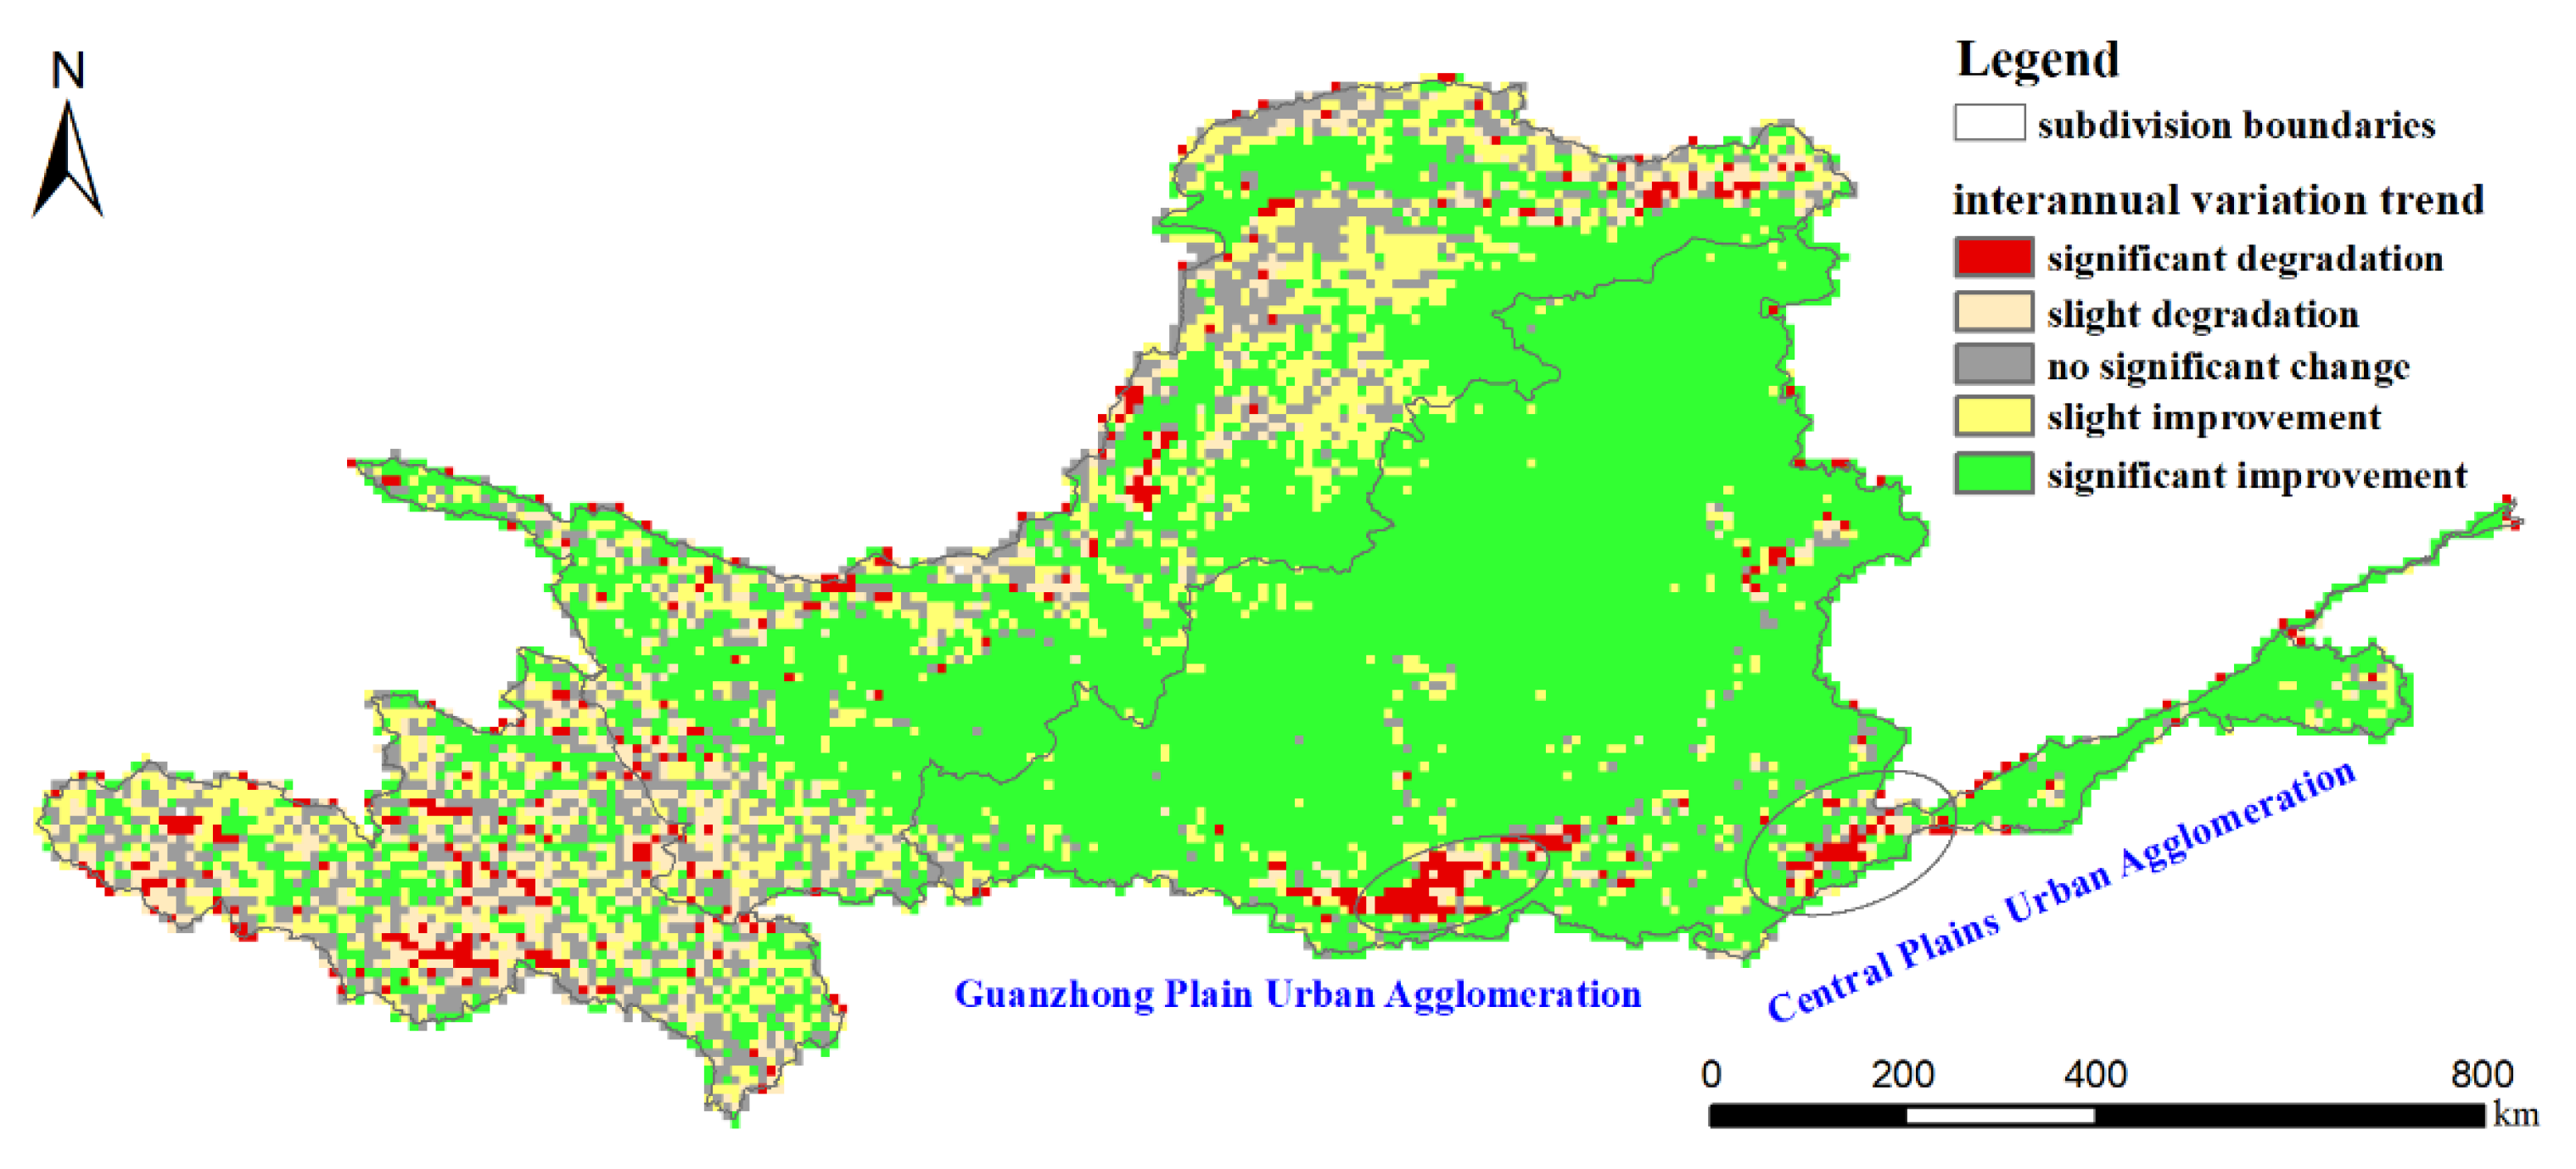
- The areas with significant improvement in vegetation cover account for 63% of the total basin. However, 22.65% of the basin show vegetation cover degradation or no significant change, which may be determined by the climatic characteristics of the YRB. The vegetation cover of most areas in the middle reaches of the YRB shows a significant improvement trend except for the urban concentrated development areas (such as the Guanzhong Plain Urban Agglomeration and the Central Plains Urban Agglomeration), which may be related to the positive effects of China’s ecological management projects.
- (3)
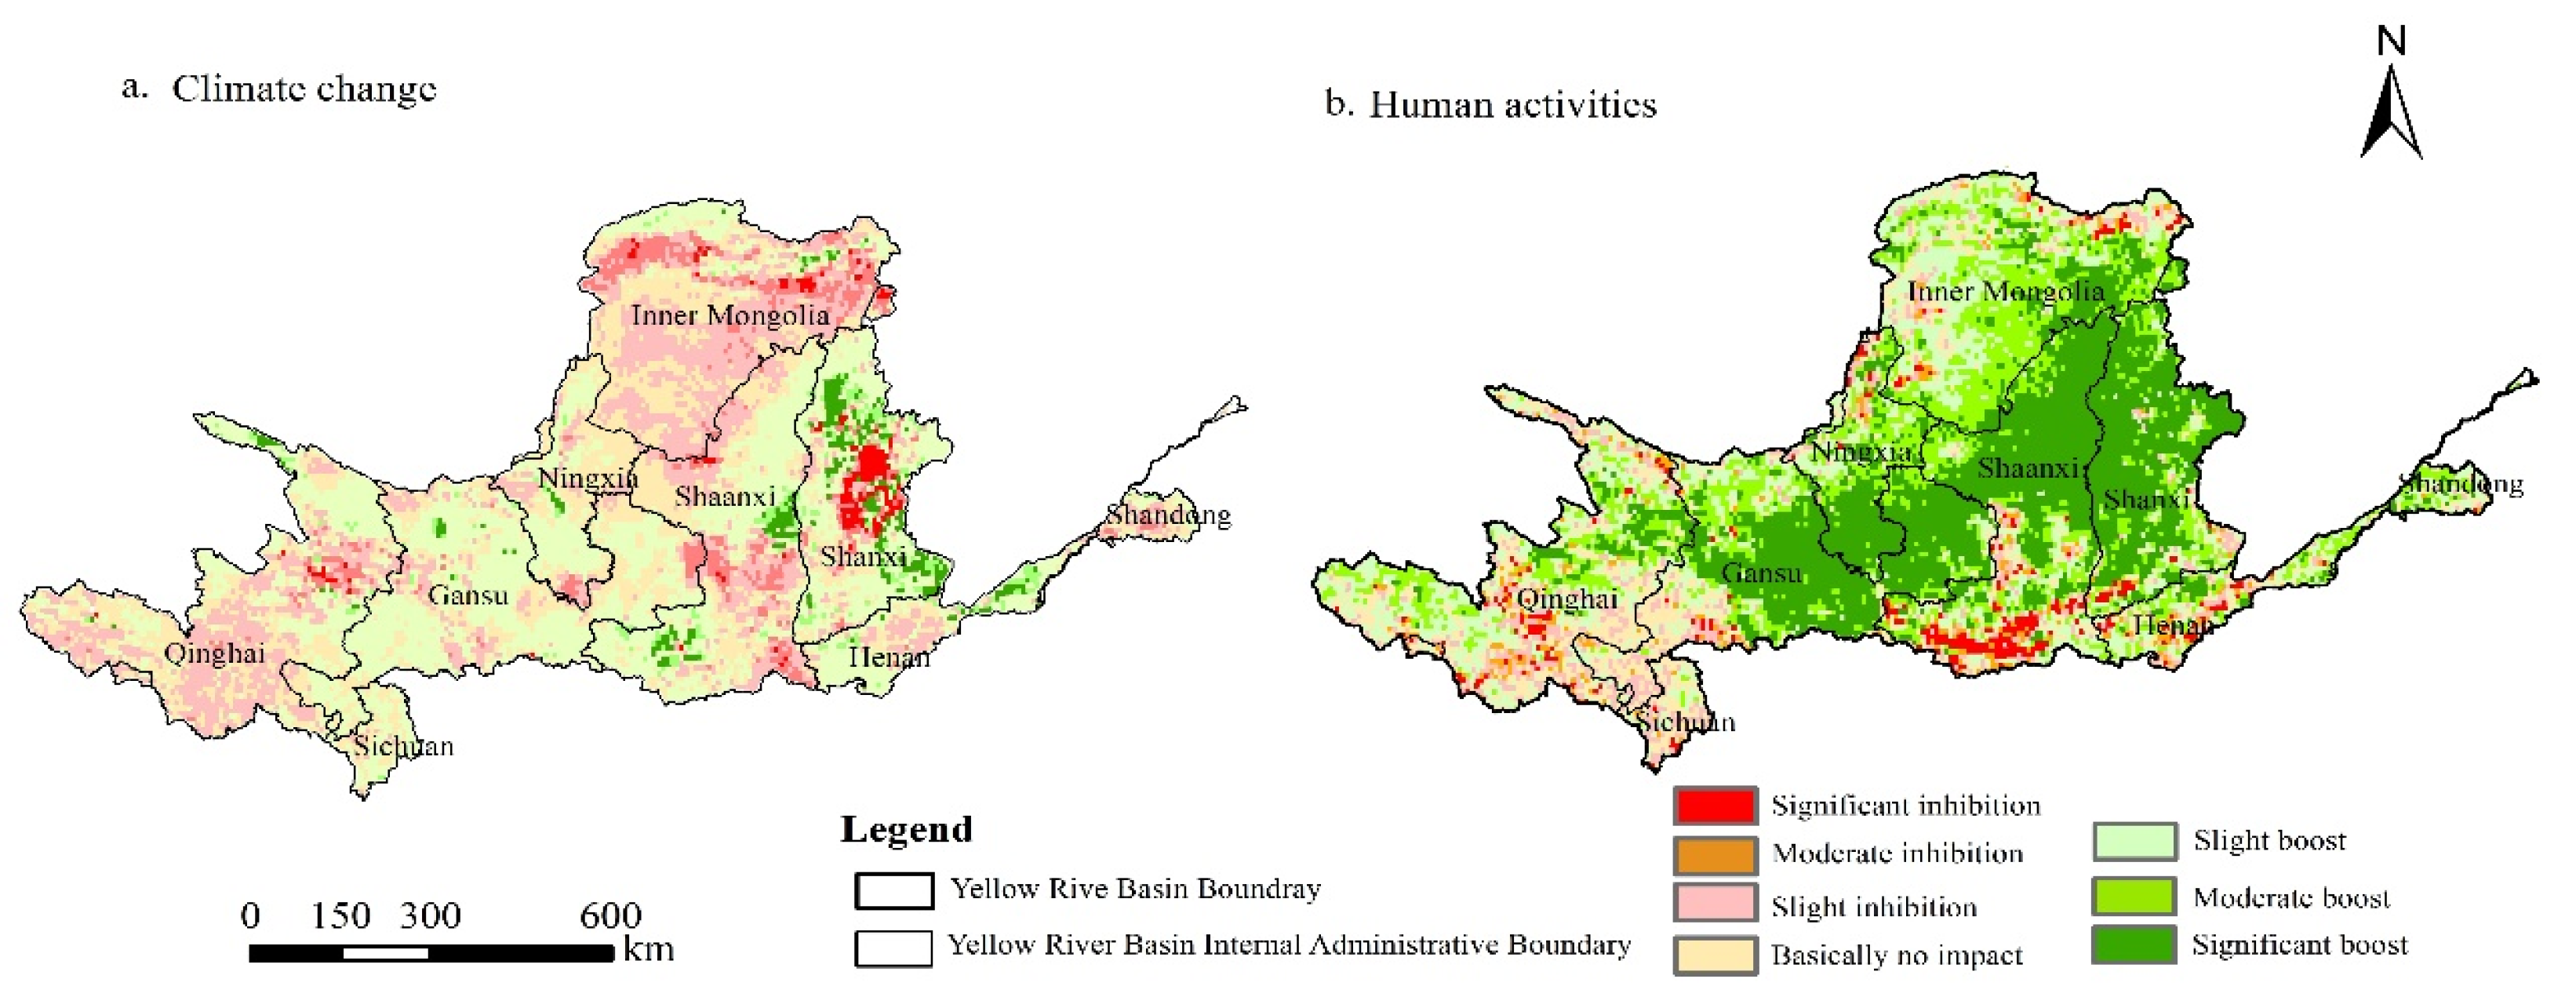
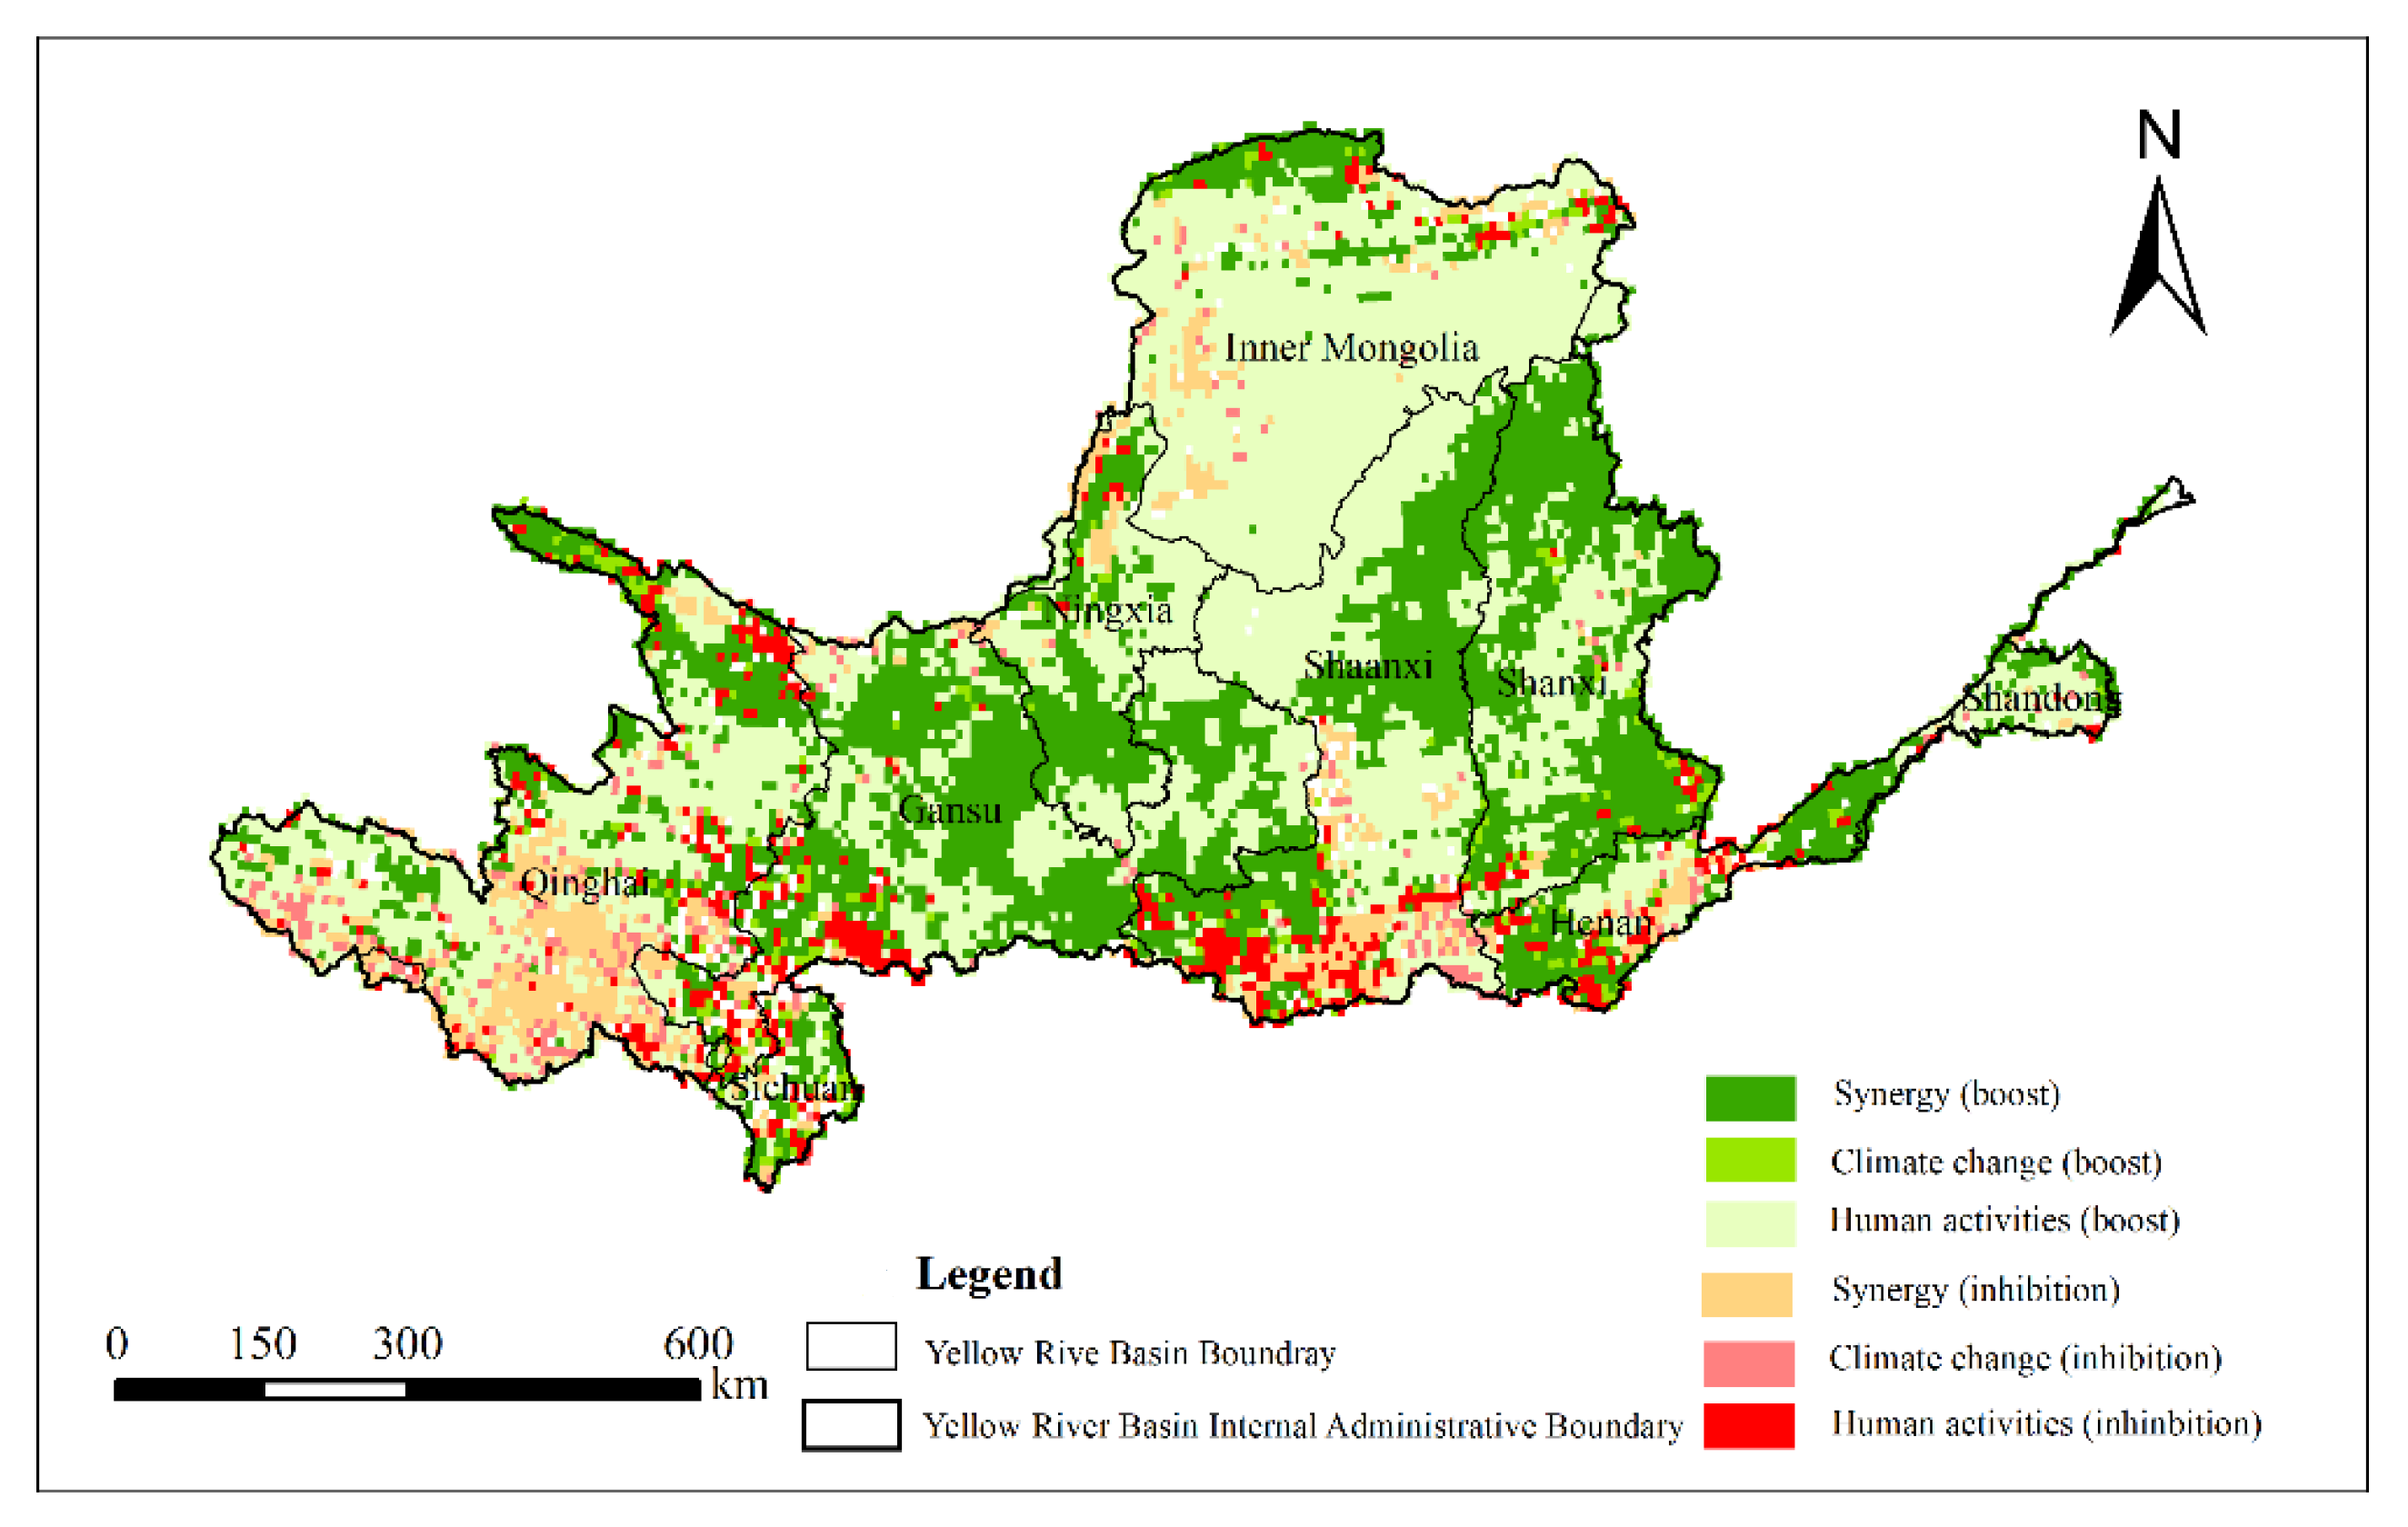
- The vegetation cover change in the YRB is influenced by both climate change and human activities. The areas in which human activities and climate change boosted vegetation cover restoration account for 46.13% and 2.19% of the total basin, respectively, indicating that human activities play a greater role in boosting vegetation cover restoration in the YRB.
Author Contributions
Funding
Data Availability Statement
Acknowledgments
Conflicts of Interest
References
- Duo, A.; Zhao, W.; Qu, X.; Jing, R.; Xiong, K. Spatio-temporal variation of vegetation coverage and its response to climate change in North China plain in the last 33 years. Int. J. Appl. Earth Obs. 2016, 53, 103–117. [Google Scholar]
- Gwapedza, D.; Hughes, D.A.; Slaughter, A.R.; Mantel, S.K. Temporal Influences of Vegetation Cover (C) Dynamism on MUSLE Sediment Yield Estimates: NDVI Evaluation. Water 2021, 13, 2707. [Google Scholar] [CrossRef]
- Zhang, Z.Q.; Liu, H.; Zuo, Q.T.; Yu, J.T.; Li, Y. Spatiotemporal change of fractional vegetation cover in the Yellow River Basin during 2000—2019. Resour Sci. 2021, 43, 849–858. [Google Scholar]
- Wu, D.; Zhao, X.; Liang, S.; Zhou, T.; Huang, K.; Tang, B.; Zhao, W. Time-lag effects of global vegetation responses to climate change. Global Change Biol. 2015, 21, 3520–3531. [Google Scholar] [CrossRef]
- Cao, R.; Jiang, W.; Yuan, L.; Wang, W.; Lv, Z.; Chen, Z. Inter-annual variations in vegetation and their response to climatic factors in the upper catchments of the Yellow River from 2000 to 2010. J. Geogr. Sci. 2014, 24, 963–979. [Google Scholar] [CrossRef] [Green Version]
- Liu, X.; Zhang, J.; Zhu, X.; Pan, Y.; Liu, Y.; Zhang, D.; Lin, Z. Spatiotemporal changes in vegetation coverage and its driving factors in the Three-River Headwaters Region during 2000–2011. J. Geogr. Sci. 2014, 24, 288–302. [Google Scholar] [CrossRef]
- Liu, X.; Zhu, X.; Pan, Y.; Li, S.; Ma, Y.; Nie, J. Vegetation dynamics in Qinling-Daba Mountains in relation to climate factors between 2000 and 2014. J. Geogr. Sci. 2016, 26, 45–58. [Google Scholar] [CrossRef] [Green Version]
- Shi, S.; Yu, J.; Wang, F.; Wang, P.; Zhang, Y.; Jin, K. Quantitative contributions of climate change and human activities to vegetation changes over multiple time scales on the Loess Plateau. Sci. Total Environ. 2021, 755, 142419. [Google Scholar] [CrossRef]
- Zheng, K.; Wei, J.Z.; Pei, J.Y.; Cheng, H.; Zhang, X.L.; Huang, F.Q.; Li, F.M.; Ye, J.S. Impacts of climate change and human activities on grassland vegetation variation in the Chinese Loess Plateau. Sci. Total Environ. 2019, 660, 236–244. [Google Scholar] [CrossRef]
- Zeng, Z.; Chen, A.; Piao, S.; Rabin, S.; Shen, Z. Environmental determinants of tropical forest and savanna distribution: A quantitative model evaluation and its implication. J. Geophys. Res.-Biogeosci. 2014, 119, 1432–1445. [Google Scholar] [CrossRef]
- Wang, S.; Cui, C.; Dai, Q. Contributions of Vegetation Greening and Climate Change to Evapotranspiration Trend after Large-Scale Vegetation Restoration on the Loess Plateau, China. Water 2021, 13, 1755. [Google Scholar] [CrossRef]
- Yuan, J.; Xu, Y.; Xiang, J.; Wu, L.; Wang, D. Spatiotemporal variation of vegetation coverage and its associated influence factor analysis in the Yangtze River Delta, eastern China. Environ. Sci. Pollut. R. 2019, 26, 32866–32879. [Google Scholar] [CrossRef]
- Duan, L.; Liu, T.; Wang, X.; Luo, Y. Spatio-temporal patterns of water table and vegetation status of a deserted area. Water 2015, 7, 5788–5805. [Google Scholar] [CrossRef] [Green Version]
- Martínez, B.; Gilabert, M.A. Vegetation dynamics from NDVI time series analysis using the wavelet transform. Remote Sens. Environ. 2009, 113, 1823–1842. [Google Scholar] [CrossRef]
- Feng, D.; Wang, J.; Fu, M.; Liu, G.; Zhang, M.; Tang, R. Spatiotemporal variation and influencing factors of vegetation cover in the ecologically fragile areas of China from 2000 to 2015: A case study in Shaanxi Province. Environ. Sci. Pollut. R. 2019, 26, 28977–28992. [Google Scholar] [CrossRef]
- Sun, W.; Song, X.; Mu, X.; Gao, P.; Wang, F.; Zhao, G. Spatiotemporal vegetation cover variations associated with climate change and ecological restoration in the Loess Plateau. Agr. Forest Meteorol. 2015, 209, 87–99. [Google Scholar] [CrossRef]
- Kong, D.; Miao, C.; Borthwick, A.G.; Lei, X.; Li, H. Spatiotemporal variations in vegetation cover on the Loess Plateau, China, between 1982 and 2013: Possible causes and potential impacts. Environ. Sci. Pollut. R. 2018, 25, 13633–13644. [Google Scholar] [CrossRef] [Green Version]
- Ibrahim, Y.Z.; Balzter, H.; Kaduk, J.; Tucker, C.J. Land degradation assessment using residual trend analysis of GIMMS NDVI3g, soil moisture and rainfall in Sub-Saharan West Africa from 1982 to 2012. Remote Sens. 2015, 7, 5471–5494. [Google Scholar] [CrossRef] [Green Version]
- Xin, Z.B.; Xu, J.X.; Zheng, W. Spatiotemporal variations of vegetation cover on the Chinese Loess Plateau (1981–2006): Impacts of climate changes and human activities. Sci China Ser. D 2007, 37, 1504–1514. [Google Scholar] [CrossRef]
- Chen, J.; Yan, F.; Lu, Q. Spatiotemporal variation of vegetation on the Qinghai–Tibet Plateau and the influence of climatic factors and human activities on vegetation trend (2000–2019). Remote Sens. 2020, 12, 3150. [Google Scholar] [CrossRef]
- Jiang, S.; Chen, X.; Smettem, K.; Wang, T. Climate and land use influences on changing spatiotemporal patterns of mountain vegetation cover in southwest China. Ecol. Indic. 2021, 121, 107193. [Google Scholar] [CrossRef]
- Tong, S.; Zhang, J.; Bao, Y. Spatial and temporal variations of vegetation cover and the relationships with climate factors in Inner Mongolia based on GIMMS NDVI3g data. J. Arid Land 2017, 9, 394–407. [Google Scholar] [CrossRef]
- Huo, H.; Sun, C. Spatiotemporal variation and influencing factors of vegetation dynamics based on Geodetector: A case study of the northwestern Yunnan Plateau, China. Ecol. Indic. 2021, 130, 108005. [Google Scholar] [CrossRef]
- Zhao, Y.; Feng, Q.; Lu, A. Spatiotemporal variation in vegetation coverage and its driving factors in the Guanzhong Basin, NW China. Ecol. Inform. 2021, 64, 101371. [Google Scholar] [CrossRef]
- Nie, T.; Dong, G.; Jiang, X.; Lei, Y. Spatio-temporal changes and driving forces of vegetation coverage on the loess plateau of Northern Shaanxi. Remote Sens. 2021, 13, 613. [Google Scholar] [CrossRef]
- Wang, H.; Xiao, W.; Zhao, Y.; Wang, Y.; Hou, B.; Zhou, Y.; Yang, H.; Zhang, X.; Cui, H. The spatiotemporal variability of evapotranspiration and its response to climate change and land use/land cover change in the three gorges reservoir. Water 2019, 11, 1739. [Google Scholar] [CrossRef] [Green Version]
- Shi, P.; Hou, P.; Gao, J.; Wan, H.; Wang, Y.; Sun, C. Spatial-Temporal Variation Characteristics and Influencing Factors of Vegetation in the Yellow River Basin from 2000 to 2019. Atmosphere 2021, 12, 1576. [Google Scholar] [CrossRef]
- Huang, S.; Zheng, X.; Ma, L.; Wang, H.; Huang, Q.; Leng, G.; Meng, E.; Guo, Y. Quantitative contribution of climate change and human activities to vegetation cover variations based on GA-SVM model. J. Hydrol. 2020, 584, 124687. [Google Scholar] [CrossRef]
- Yang, C.; Fu, M.; Feng, D.; Sun, Y.; Zhai, G. Spatiotemporal changes in vegetation cover and its influencing factors in the loess Plateau of China based on the geographically weighted regression model. Forests 2021, 12, 673. [Google Scholar] [CrossRef]
- Chen, W.; Bai, S.; Zhao, H.; Han, X.; Li, L. Spatiotemporal analysis and potential impact factors of vegetation variation in the karst region of Southwest China. Environ. Sci. Pollut. R. 2021, 28, 61258–61273. [Google Scholar] [CrossRef]
- Gu, Z.; Duan, X.; Shi, Y.; Li, Y.; Pan, X. Spatiotemporal variation in vegetation coverage and its response to climatic factors in the Red River Basin, China. Ecol. Indic. 2018, 93, 54–64. [Google Scholar] [CrossRef]
- Gao, W.; Zheng, C.; Liu, X.; Lu, Y.; Chen, Y.; Wei, Y.; Ma, Y. NDVI-based vegetation dynamics and their responses to climate change and human activities from 1982 to 2020: A case study in the Mu Us Sandy Land, China. Ecol. Indic. 2022, 137, 108745. [Google Scholar] [CrossRef]
- Zhang, X.; Jin, X. Vegetation dynamics and responses to climate change and anthropogenic activities in the Three-River Headwaters Region, China. Ecol. Indic. 2021, 131, 108223. [Google Scholar] [CrossRef]
- Bai, T.; Chang, J.X.; Chang, F.J.; Huang, Q.; Wang, Y.M.; Chen, G.S. Synergistic gains from the multi-objective optimal operation of cascade reservoirs in the Upper Yellow River basin. J. Hydrol. 2015, 523, 758–767. [Google Scholar] [CrossRef]
- Bao, Z.; Zhang, J.; Wang, G.; Chen, Q.; Guan, T.; Yan, X.; Liu, C.; Liu, J.; Wang, J. The impact of climate variability and land use/cover change on the water balance in the Middle Yellow River Basin, China. J. Hydrol. 2019, 577, 123942. [Google Scholar] [CrossRef]
- Zhang, X.; Liu, K.; Wang, S.; Wu, T.; Li, X.; Wang, J.; Wang, D.; Zhu, H.; Tan, C.; Ji, Y. Spatiotemporal evolution of ecological vulnerability in the Yellow River Basin under ecological restoration initiatives. Ecol. Indic. 2022, 135, 108586. [Google Scholar] [CrossRef]
- Wu, Z.; Zhang, F.; Di, D.; Wang, H. Study of spatial distribution characteristics of river eco-environmental values based on emergy-GeoDa method. Sci. Total Environ. 2022, 802, 149679. [Google Scholar] [CrossRef]
- Chen, Y.P.; Fu, B.J.; Zhao, Y.; Wang, K.B.; Zhao, M.M.; Ma, J.F.; Wu, J.H.; Xu, C.; Liu, W.G.; Wang, H. Sustainable development in the Yellow River Basin: Issues and strategies. J. Clean Prod. 2020, 263, 121223. [Google Scholar] [CrossRef]
- Wang, S.Y.; Liu, J.S.; Ma, T.B. Dynamics and changes in spatial patterns of land use in Yellow River Basin, China. Land Use Policy 2010, 27, 313–323. [Google Scholar] [CrossRef]
- Jiang, L.; Zuo, Q.; Ma, J.; Zhang, Z. Evaluation and prediction of the level of high-quality development: A case study of the Yellow River Basin, China. Ecol. Indic. 2021, 129, 107994. [Google Scholar] [CrossRef]
- Cao, S.; Chen, L.; Yu, X. Impact of China’s Grain for Green Project on the landscape of vulnerable arid and semi-arid agricultural regions: A case study in northern Shaanxi Province. J. Appl. Ecol. 2009, 46, 536–543. [Google Scholar] [CrossRef]
- Yuan, W.; Li, X.; Liang, S.; Cui, X.; Dong, W.; Liu, S.; Xia, J.; Chen, Y.; Liu, D.; Zhu, W. Characterization of locations and extents of afforestation from the Grain for Green Project in China. Remote Sens. Lett. 2014, 5, 221–229. [Google Scholar] [CrossRef]
- Bai, Y.; Yang, Y.; Jiang, H. Intercomparison of AVHRR GIMMS3g, terra MODIS, and SPOT-VGT NDVI products over the Mongolian plateau. Remote Sens. 2019, 11, 2030. [Google Scholar] [CrossRef] [Green Version]
- Jiang, W.; Yuan, L.; Wang, W.; Cao, R.; Zhang, Y.; Shen, W. Spatio-temporal analysis of vegetation variation in the Yellow River Basin. Ecol. Indic. 2015, 51, 117–126. [Google Scholar] [CrossRef]
- Tian, Y.; Bai, X.; Wang, S.; Qin, L.; Li, Y. Spatial-temporal changes of vegetation cover in Guizhou Province, Southern China. Chinese Geogr. Sci. 2017, 27, 25–38. [Google Scholar] [CrossRef]
- Jin, K.; Wang, F.; Han, J.Q.; Shi, S.Y.; Ding, W.B. Contribution of climatic change and human activities to vegetation NDVI change over China during 1982—2015. Acta Geogr. Sin. 2020, 75, 961–974. [Google Scholar]
- Gao, J.B.; Jiao, K.W.; Wu, S.H. Revealing the climatic impacts on spatial heterogeneity of NDVI in China during 1982—2013. Acta Geogr. Sin. 2019, 74, 534–543. [Google Scholar]



| Classification Criterion | Vegetation Cover Change Trend |
|---|---|
| > 0 and |Z| ≥ 2.58 | Significant improvement |
| > 0 and 1.96 ≤ |Z| < 2.58 | Slight improvement |
| |Z| < 1.96 | No significant change |
| ≤ 0 and 1.96 ≤ |Z| < 2.58 | Slight degradation |
| ≤ 0 and |Z| ≥ 2.58 | Significant degradation |
| Identification Criterion [16] | Influence Factors | ||
|---|---|---|---|
| >0 | >0 | Synergy boost | |
| >0 | >0 | <0 | Climate change boost |
| <0 | >0 | Human activities boost | |
| <0 | <0 | Synergy inhibition | |
| <0 | <0 | >0 | Climate change inhibition |
| >0 | <0 | Human activities inhibition | |
| Occupies the Area of Total YRB | LVC | RLVC | MVC | RHVC | HVC | |
|---|---|---|---|---|---|---|
| YRB | 100% | 13.44% | 35.85% | 35.47% | 14.85% | 0.38% |
| SRYRB | 16.14% | 5.35% | 30.91% | 46.09% | 17.65% | 0.00% |
| URYRB | 38.04% | 32.39% | 42.14% | 20.78% | 4.69% | 0.00% |
| MAYRB | 42.96% | 0.60% | 36.01% | 42.20% | 20.53% | 0.66% |
| DRYRB | 2.86% | 0.00% | 0.30% | 64.35% | 35.35% | 0.00% |
| SID | SLD | NSC | SLM | SIM | |
|---|---|---|---|---|---|
| YRB | 2.51% | 5.74% | 14.40% | 15.02% | 62.33% |
| SRYRB | 0.88% | 2.51% | 5.35% | 4.17% | 3.47% |
| URYRB | 0.76% | 2.43% | 7.41% | 8.32% | 19.31% |
| MAYRB | 0.83% | 0.69% | 1.48% | 2.30% | 37.19% |
| DRYRB | 0.05% | 0.12% | 0.15% | 0.23% | 2.36% |
| Significant Inhibition | Moderate Inhibition | Slight Inhibition | Basically No Impact | Slight Boost | Moderate Boost | Significant Boost | |
|---|---|---|---|---|---|---|---|
| <−2.0 | −2.0~−1.0 | −1.0~−0.2 | −0.2~0.2 | 0.2~1.0 | 1.0~2.0 | ≥2.0 | |
| Climate change(%) | 0.93 | 5.91 | 23.35 | 27.43 | 35.51 | 5.09 | 1.78 |
| Human activities(%) | 2.57 | 7.49 | 3.15 | 13.09 | 21.19 | 15.31 | 37.19 |
| Influence Factors | Synergy Boost | CC Boost | HA Boost | Synergy Inhibition | CC Inhibition | HA Inhibition |
|---|---|---|---|---|---|---|
| Ratio(%) | 36.65 | 2.19 | 46.13 | 7.32 | 2.53 | 5.18 |
Publisher’s Note: MDPI stays neutral with regard to jurisdictional claims in published maps and institutional affiliations. |
© 2022 by the authors. Licensee MDPI, Basel, Switzerland. This article is an open access article distributed under the terms and conditions of the Creative Commons Attribution (CC BY) license (https://creativecommons.org/licenses/by/4.0/).
Share and Cite
Cheng, Y.; Zhang, L.; Zhang, Z.; Li, X.; Wang, H.; Xi, X. Spatiotemporal Variation and Influence Factors of Vegetation Cover in the Yellow River Basin (1982–2021) Based on GIMMS NDVI and MOD13A1. Water 2022, 14, 3274. https://doi.org/10.3390/w14203274
Cheng Y, Zhang L, Zhang Z, Li X, Wang H, Xi X. Spatiotemporal Variation and Influence Factors of Vegetation Cover in the Yellow River Basin (1982–2021) Based on GIMMS NDVI and MOD13A1. Water. 2022; 14(20):3274. https://doi.org/10.3390/w14203274
Chicago/Turabian StyleCheng, Yi, Lijuan Zhang, Zhiqiang Zhang, Xueyin Li, Haiying Wang, and Xu Xi. 2022. "Spatiotemporal Variation and Influence Factors of Vegetation Cover in the Yellow River Basin (1982–2021) Based on GIMMS NDVI and MOD13A1" Water 14, no. 20: 3274. https://doi.org/10.3390/w14203274
APA StyleCheng, Y., Zhang, L., Zhang, Z., Li, X., Wang, H., & Xi, X. (2022). Spatiotemporal Variation and Influence Factors of Vegetation Cover in the Yellow River Basin (1982–2021) Based on GIMMS NDVI and MOD13A1. Water, 14(20), 3274. https://doi.org/10.3390/w14203274


