
Study on the Sources of Salinity of Groundwater in Holocene and Late Pleistocene Sediments Based on Hydrochemical and Isotopic Methods in Southern Laizhou Bay

Abstract
:1. Introduction
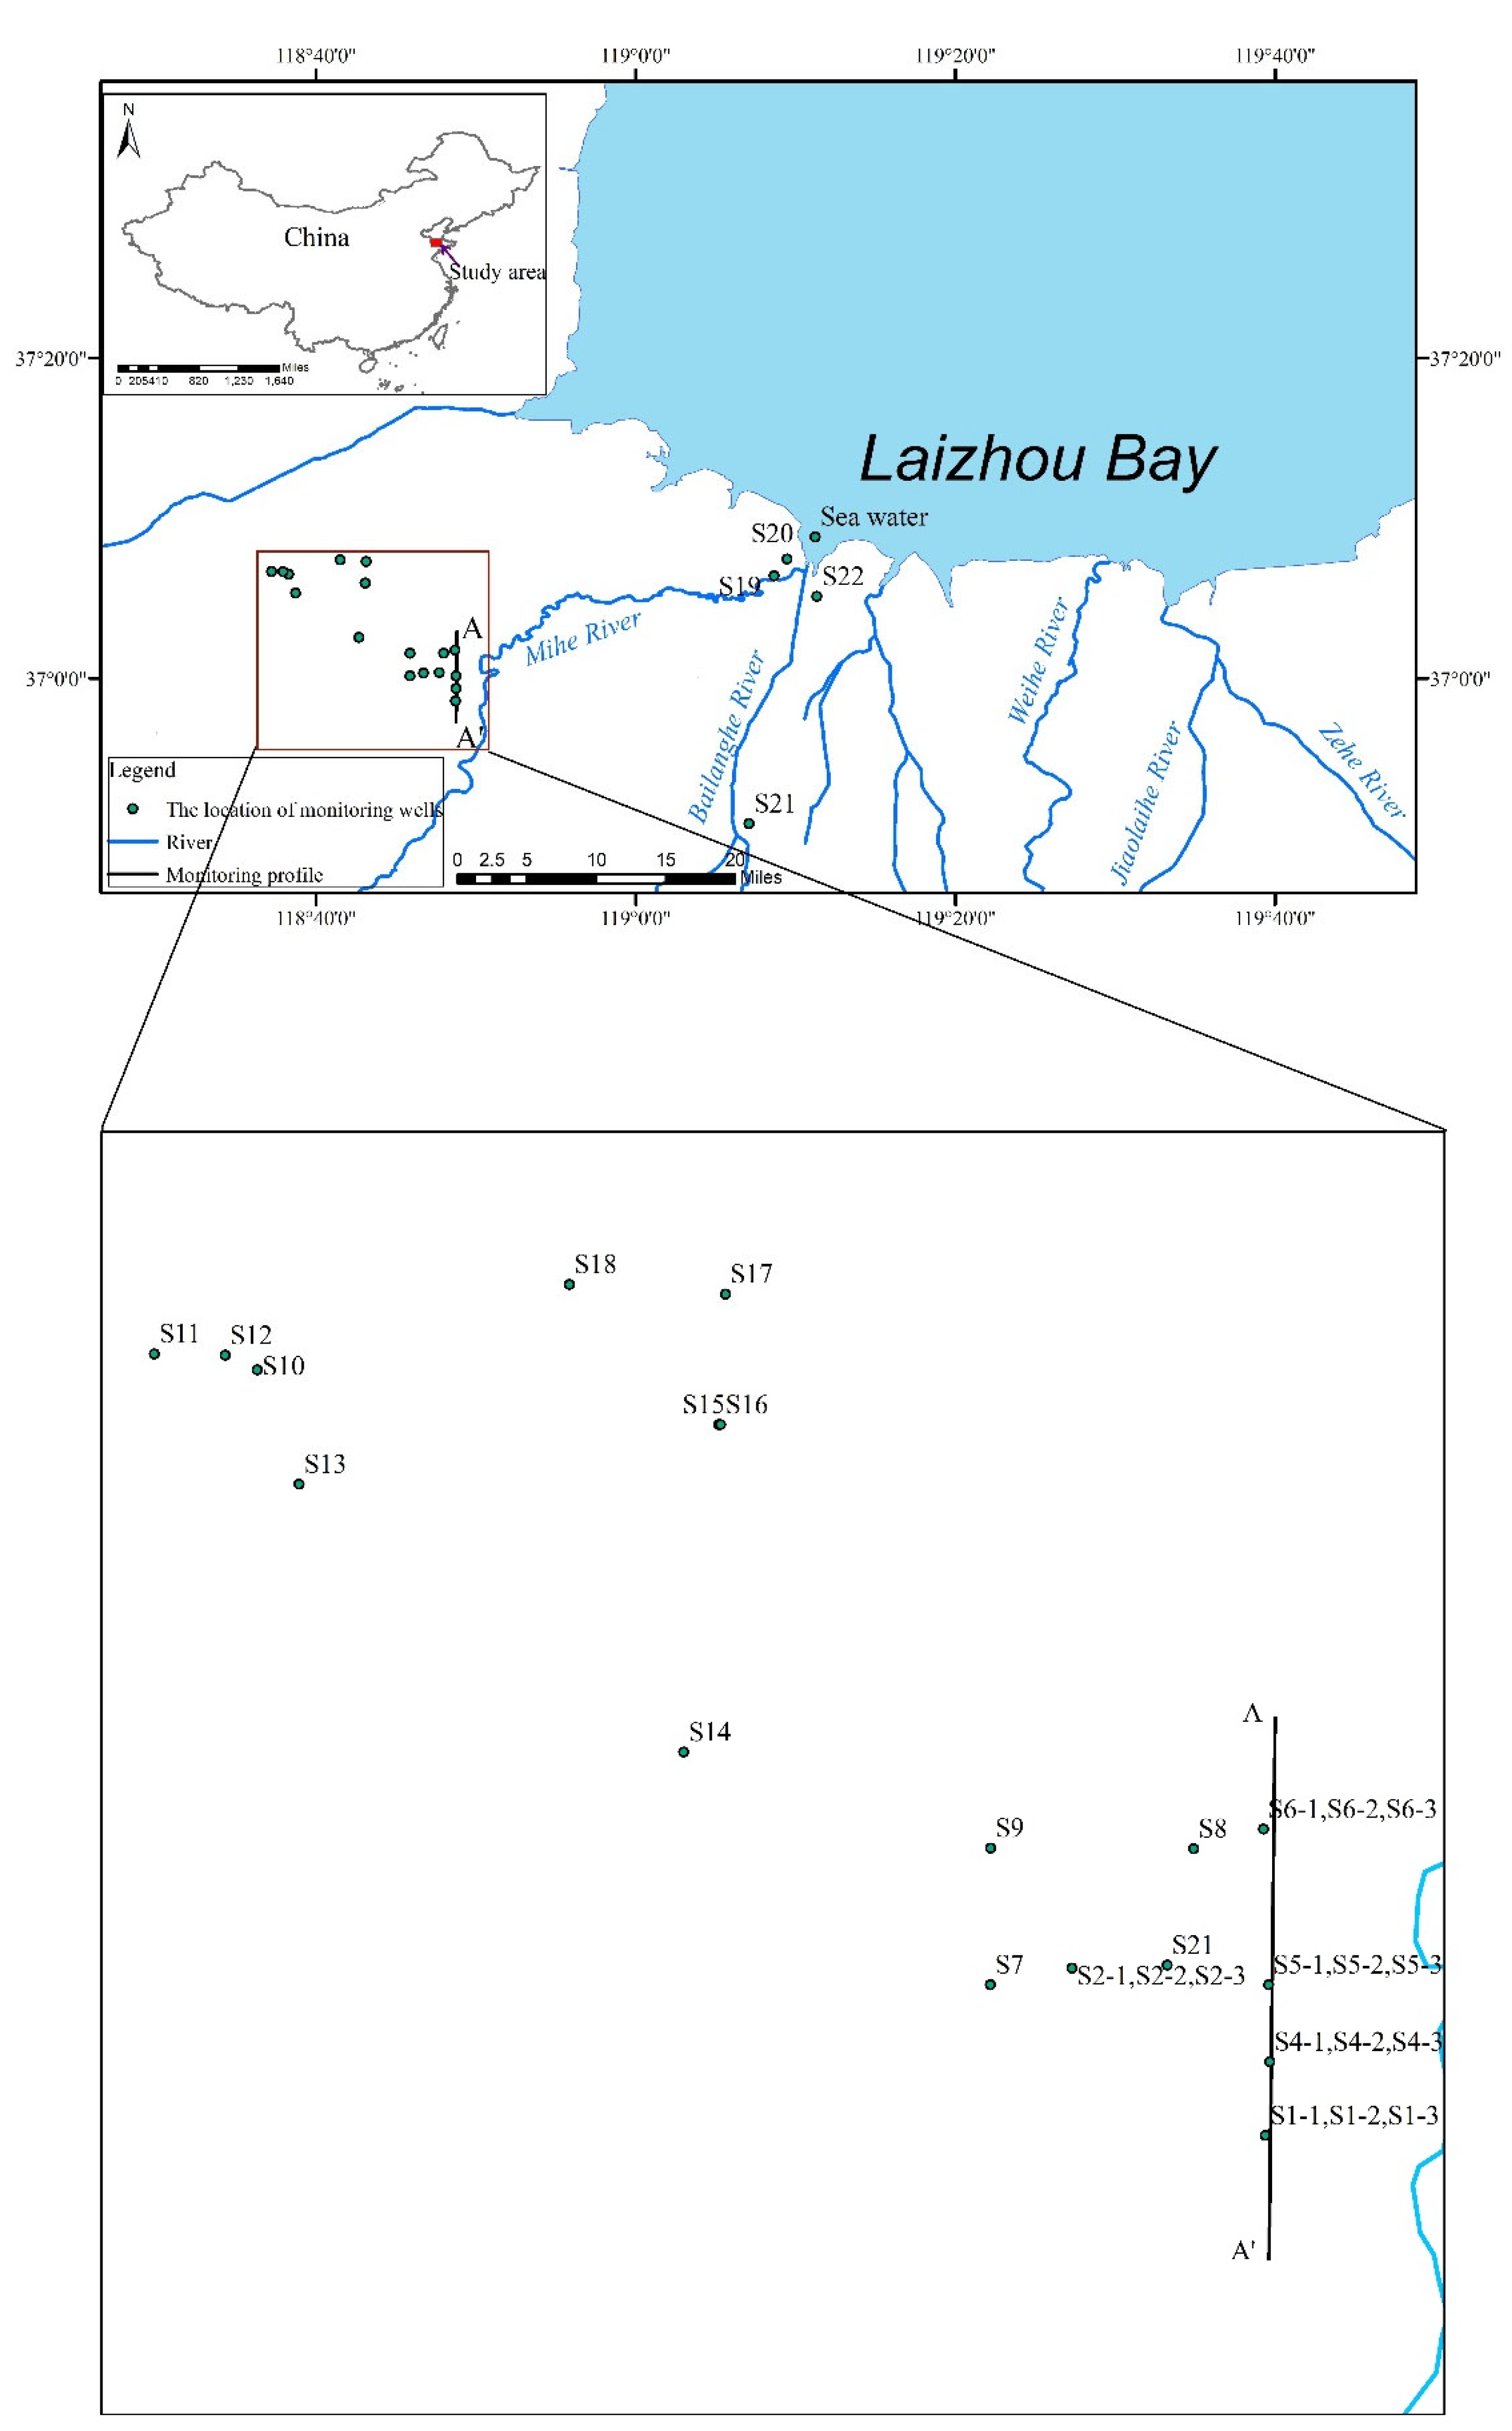
2. Study Area
2.1. Location and Weather
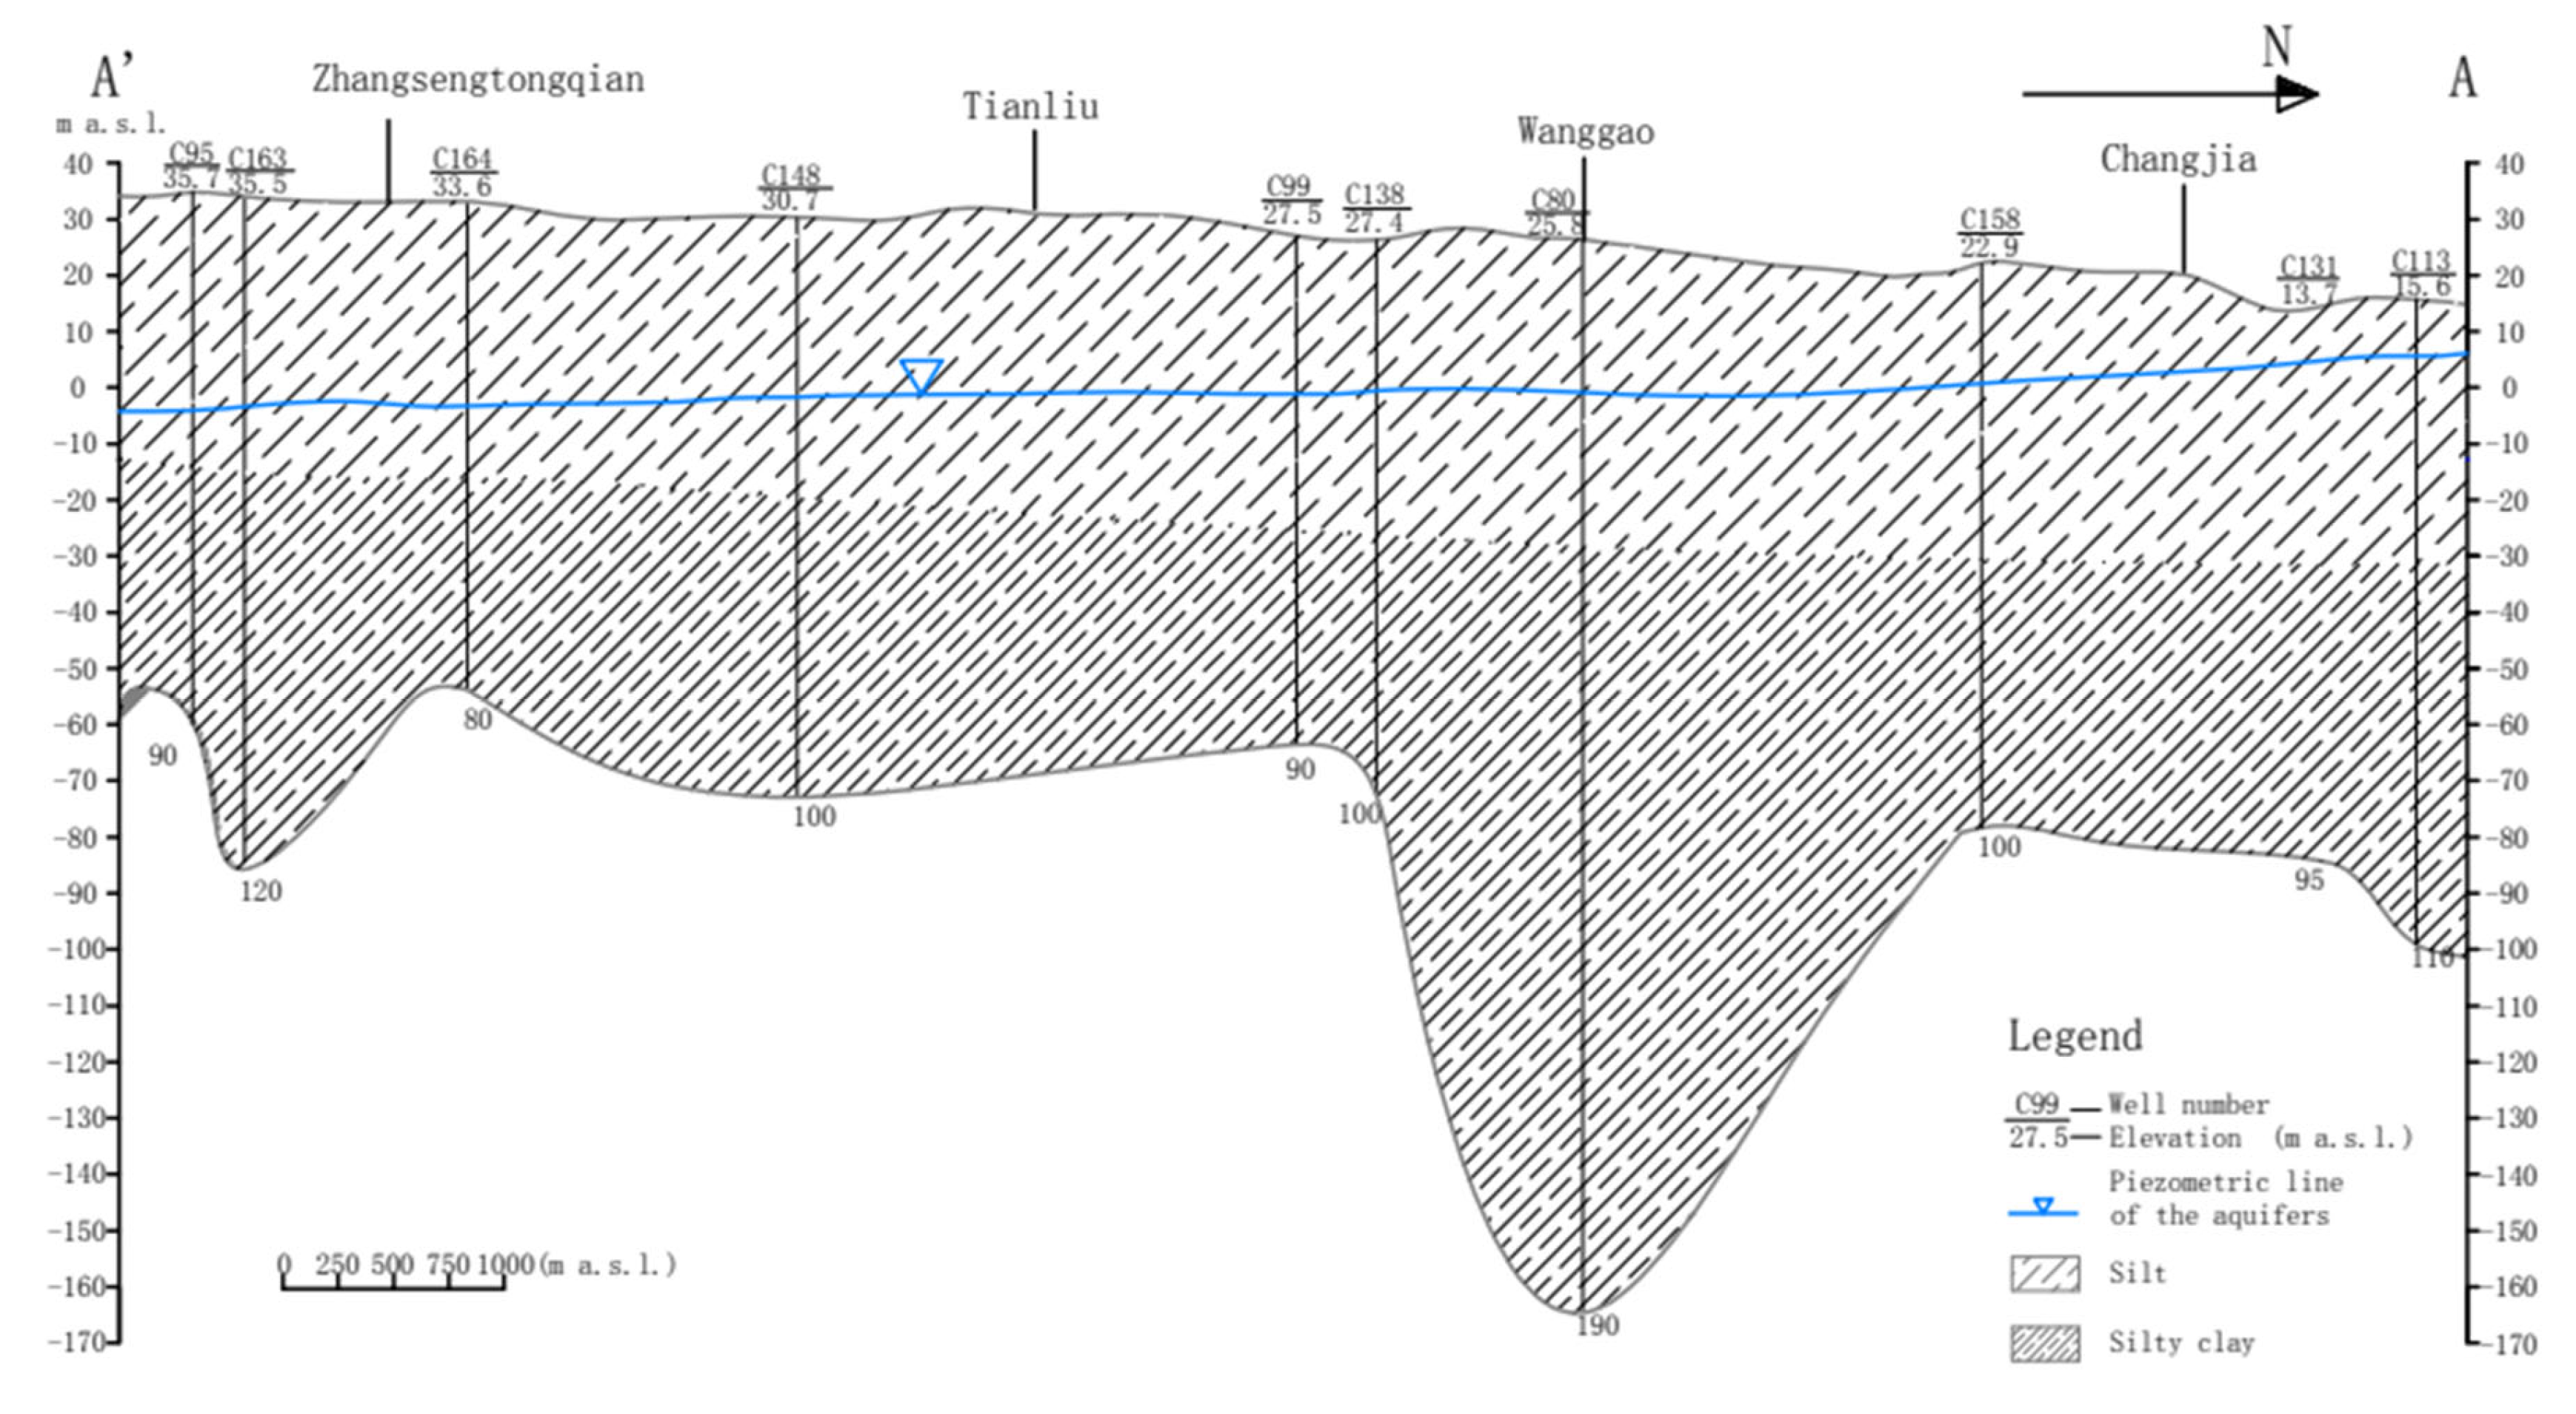
2.2. Hydrogeological Conditions
2.3. Environmental Issues
3. Materials and Methods
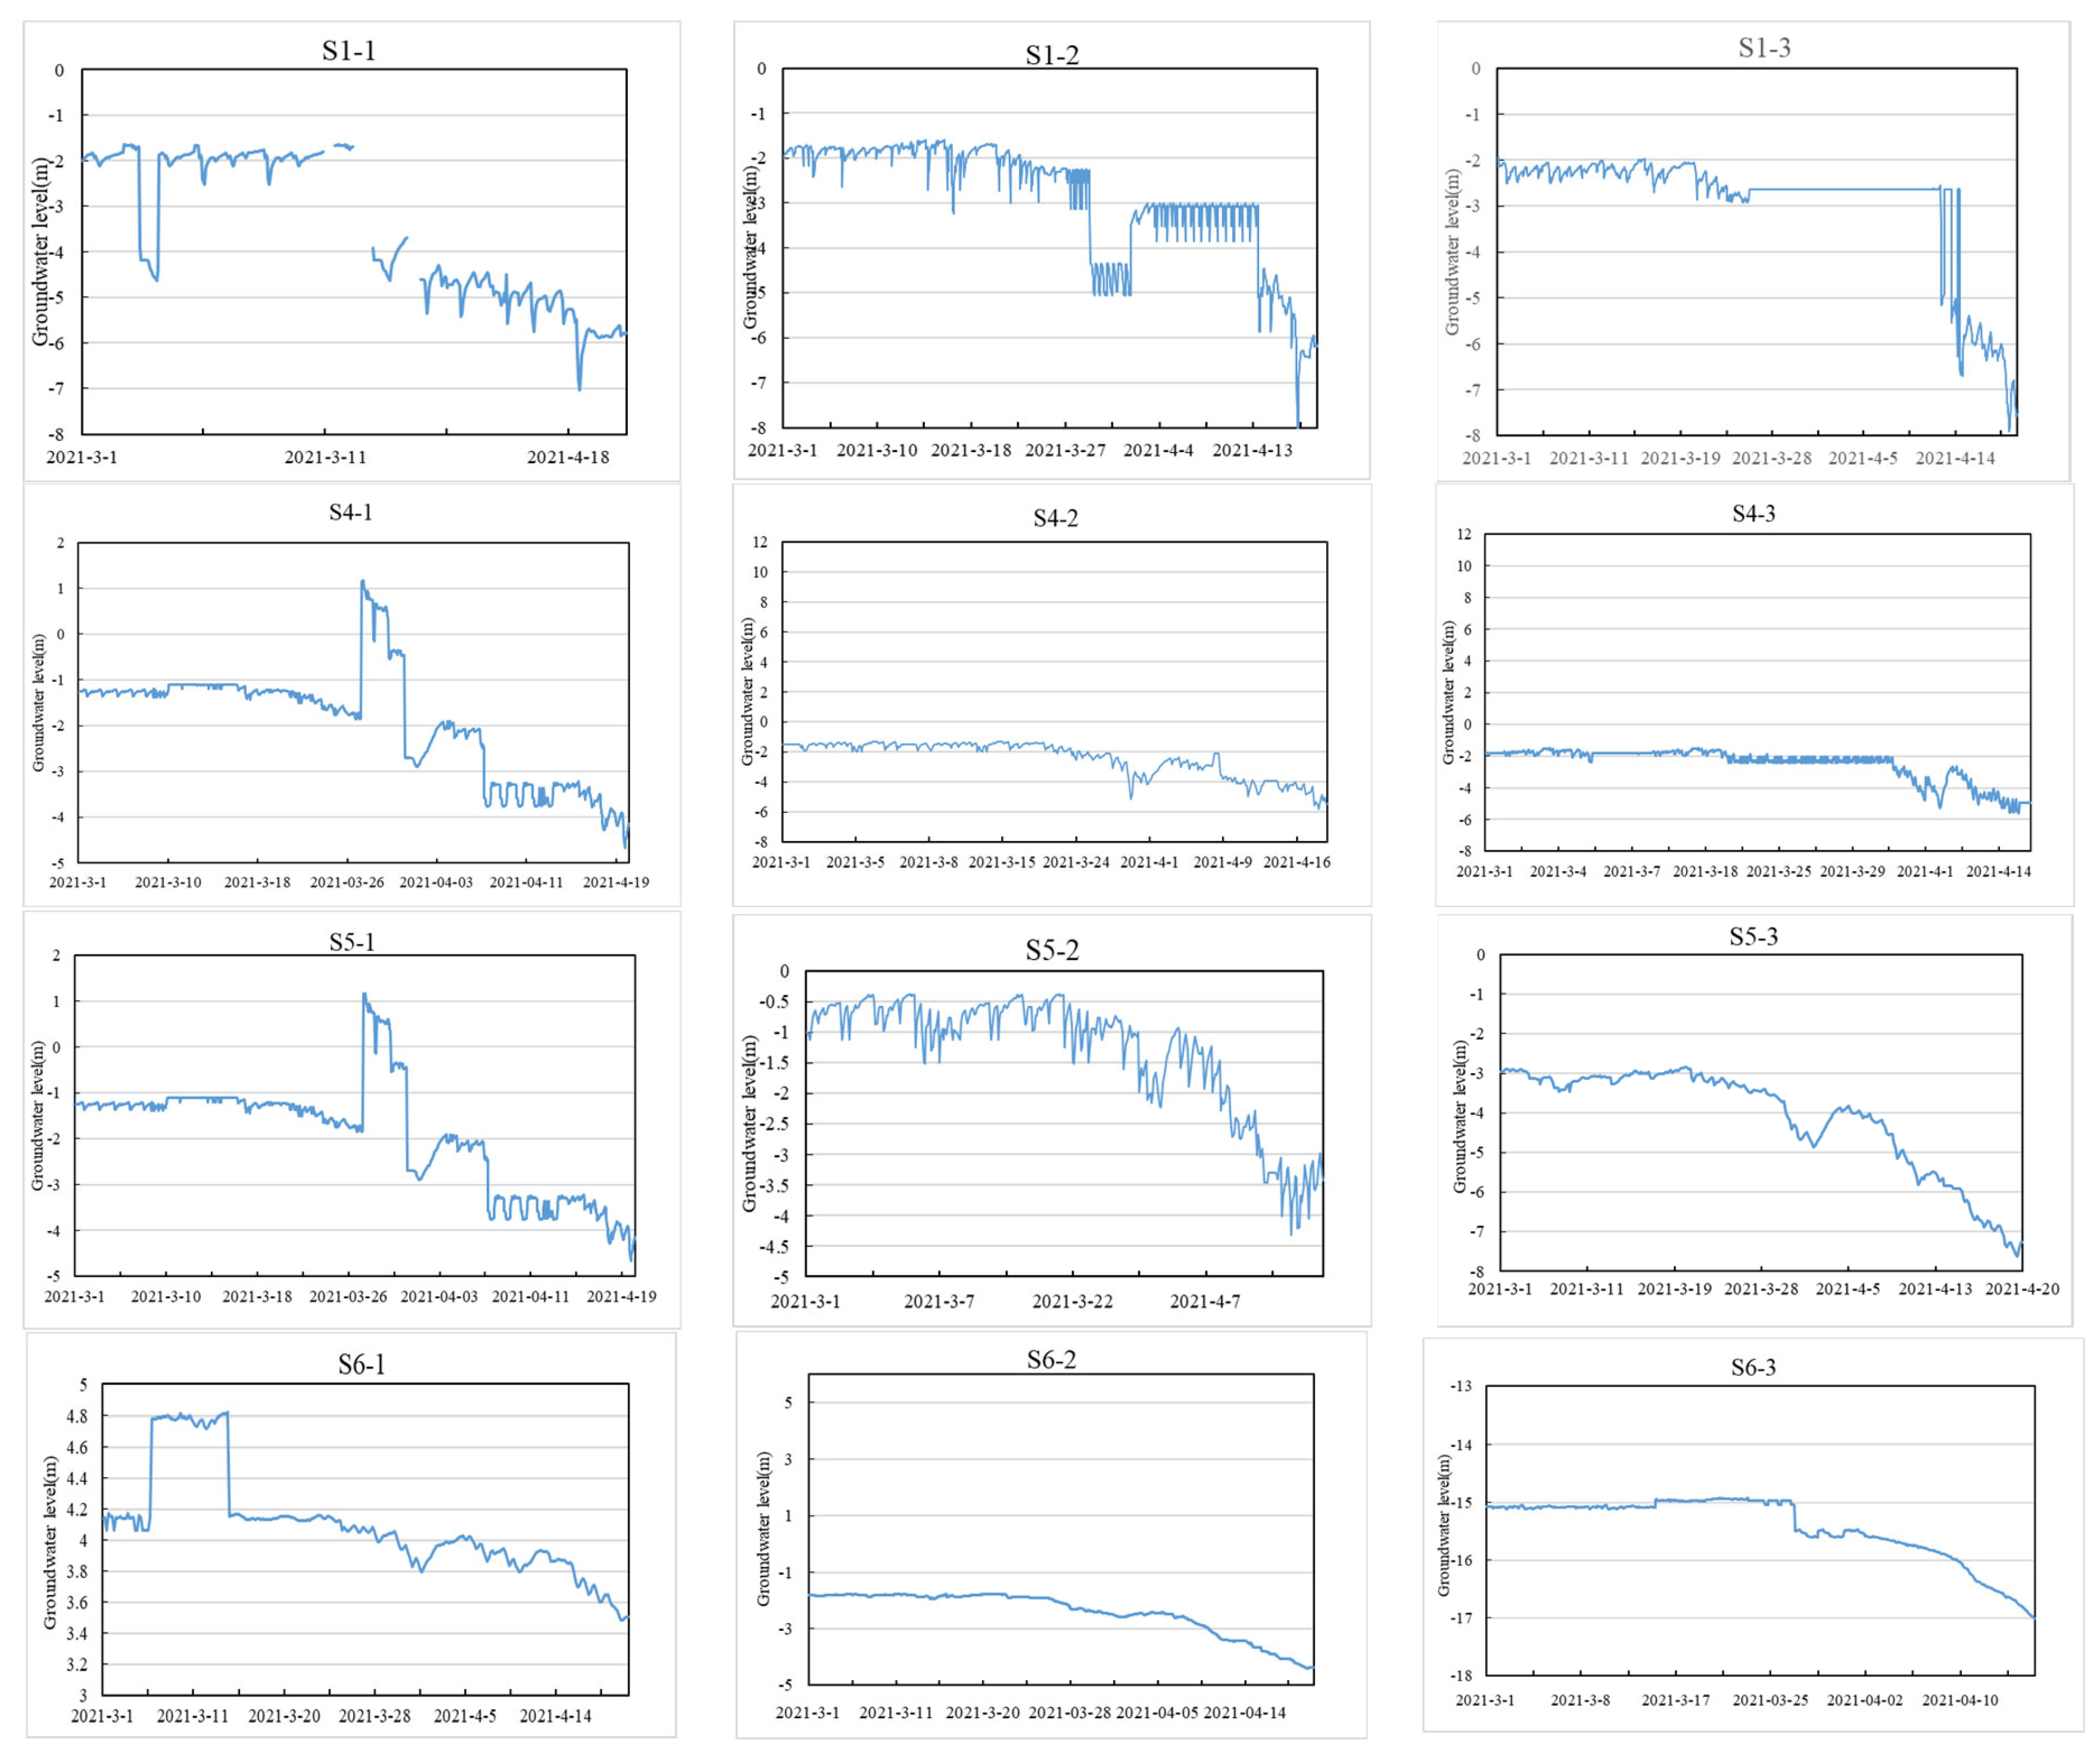
3.1. Groundwater Level Monitoring
3.2. Sampling
3.3. Analytical Methods
4. Results and Discussion
4.1. Groundwater Level
4.2. Hydrochemistry
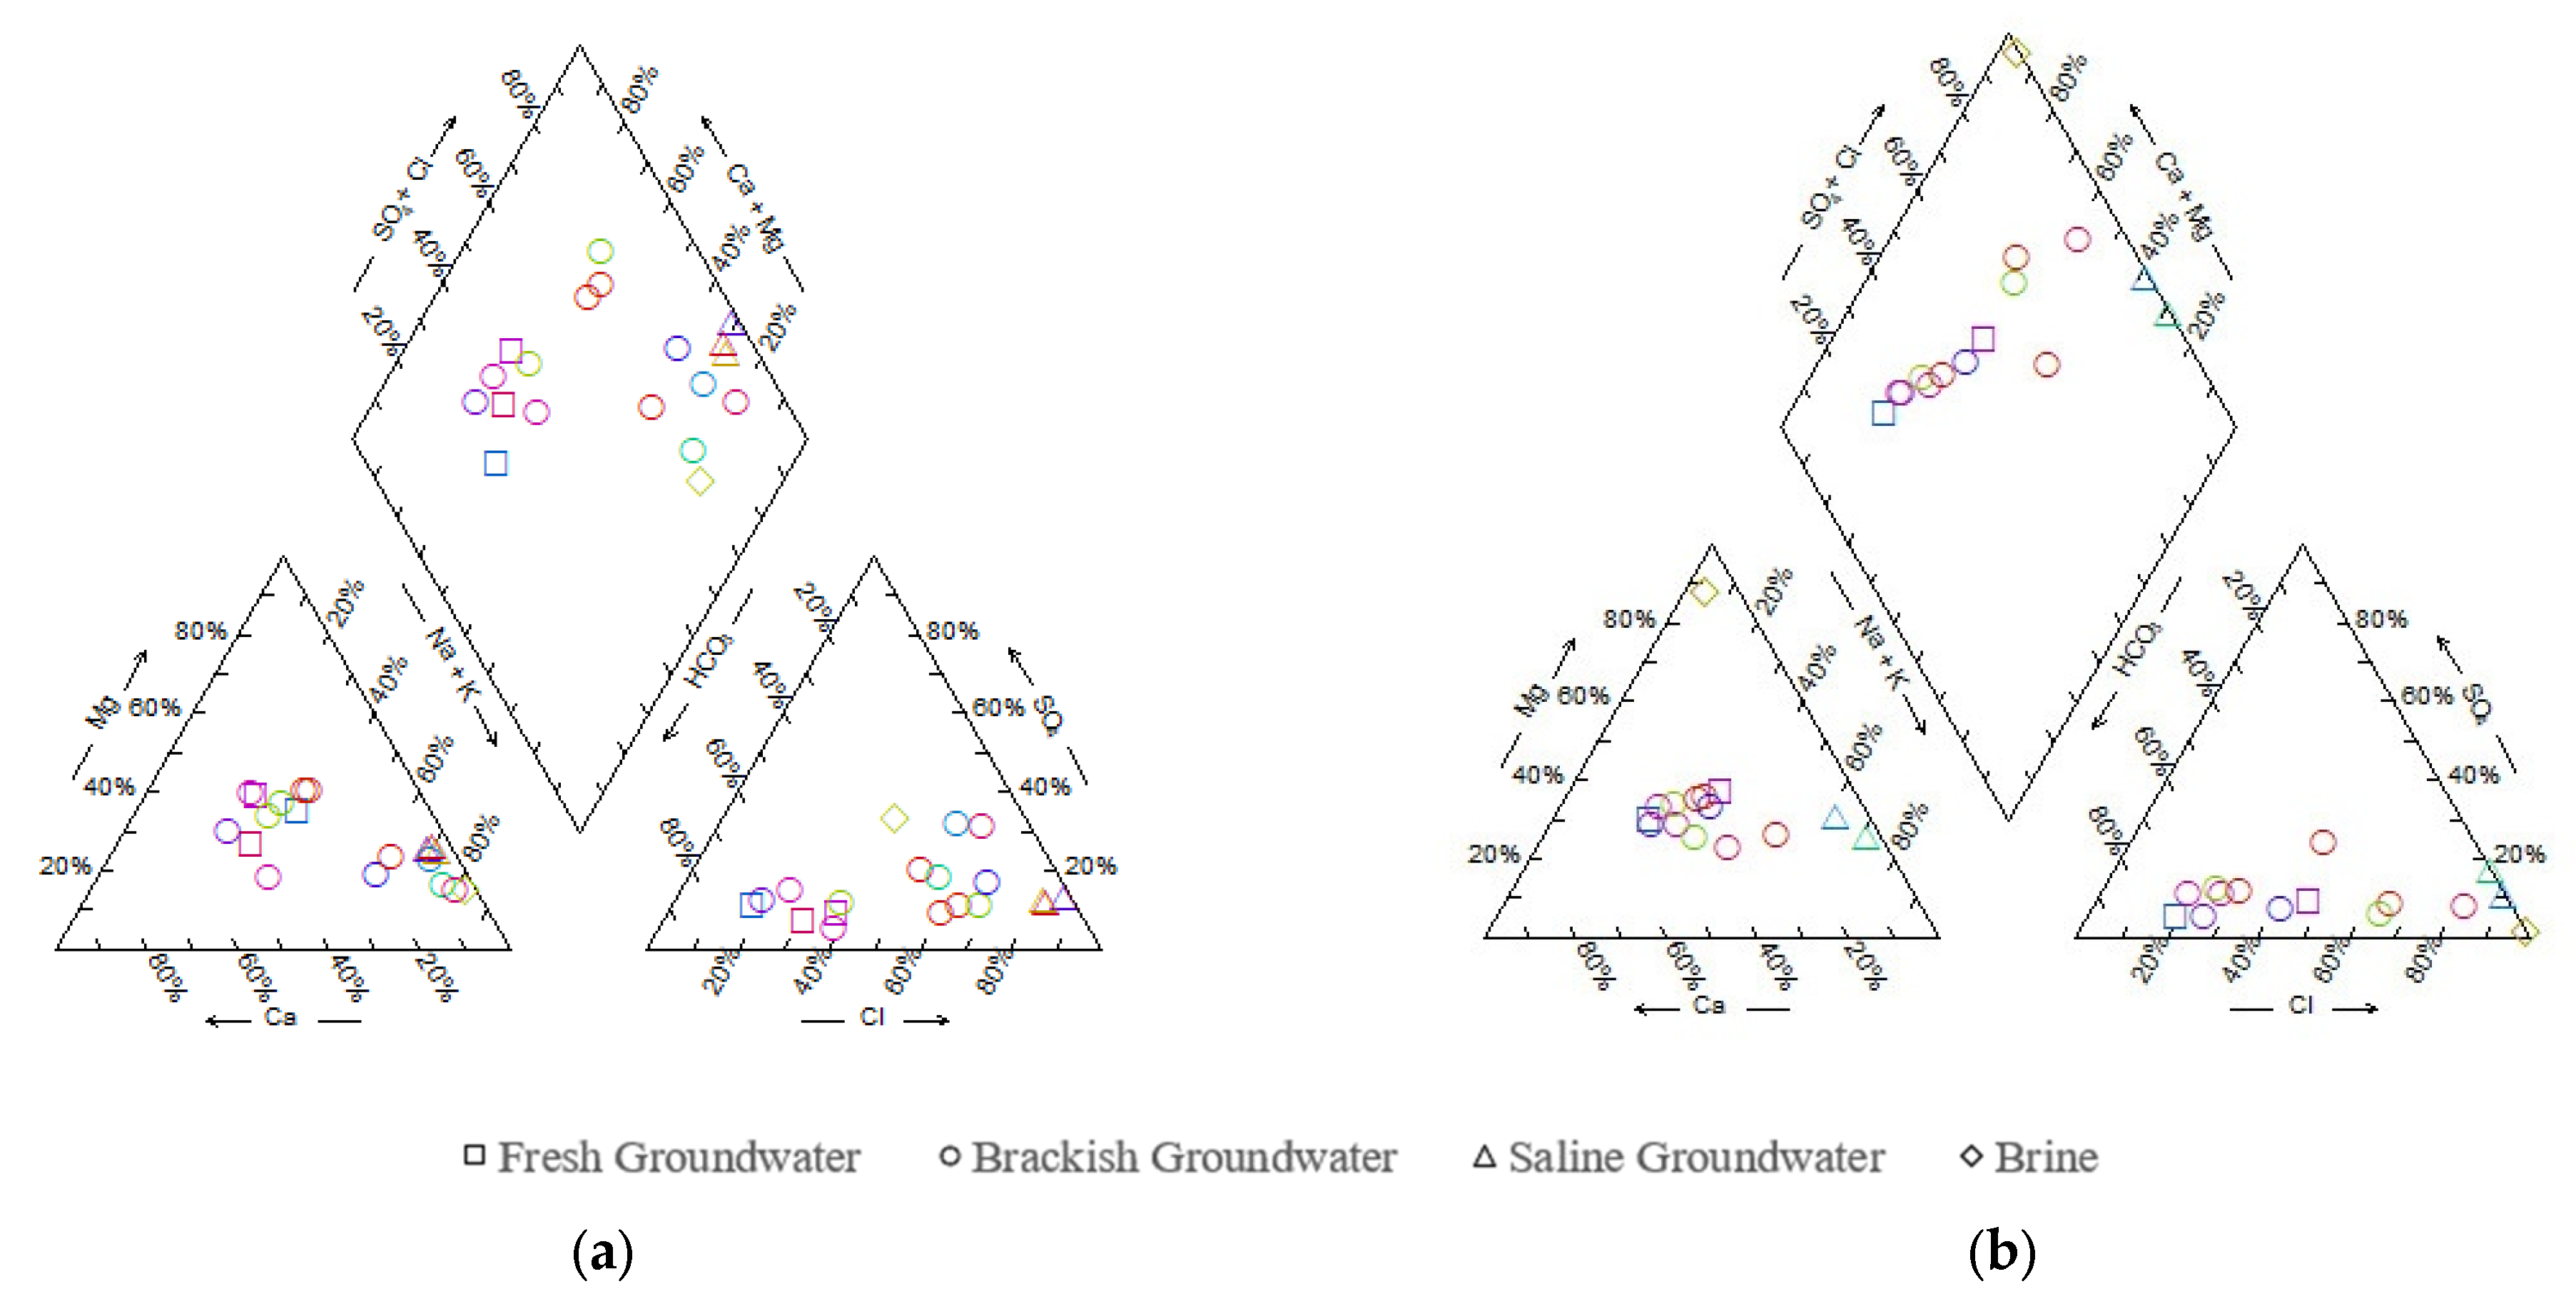
4.2.1. Chemical Types
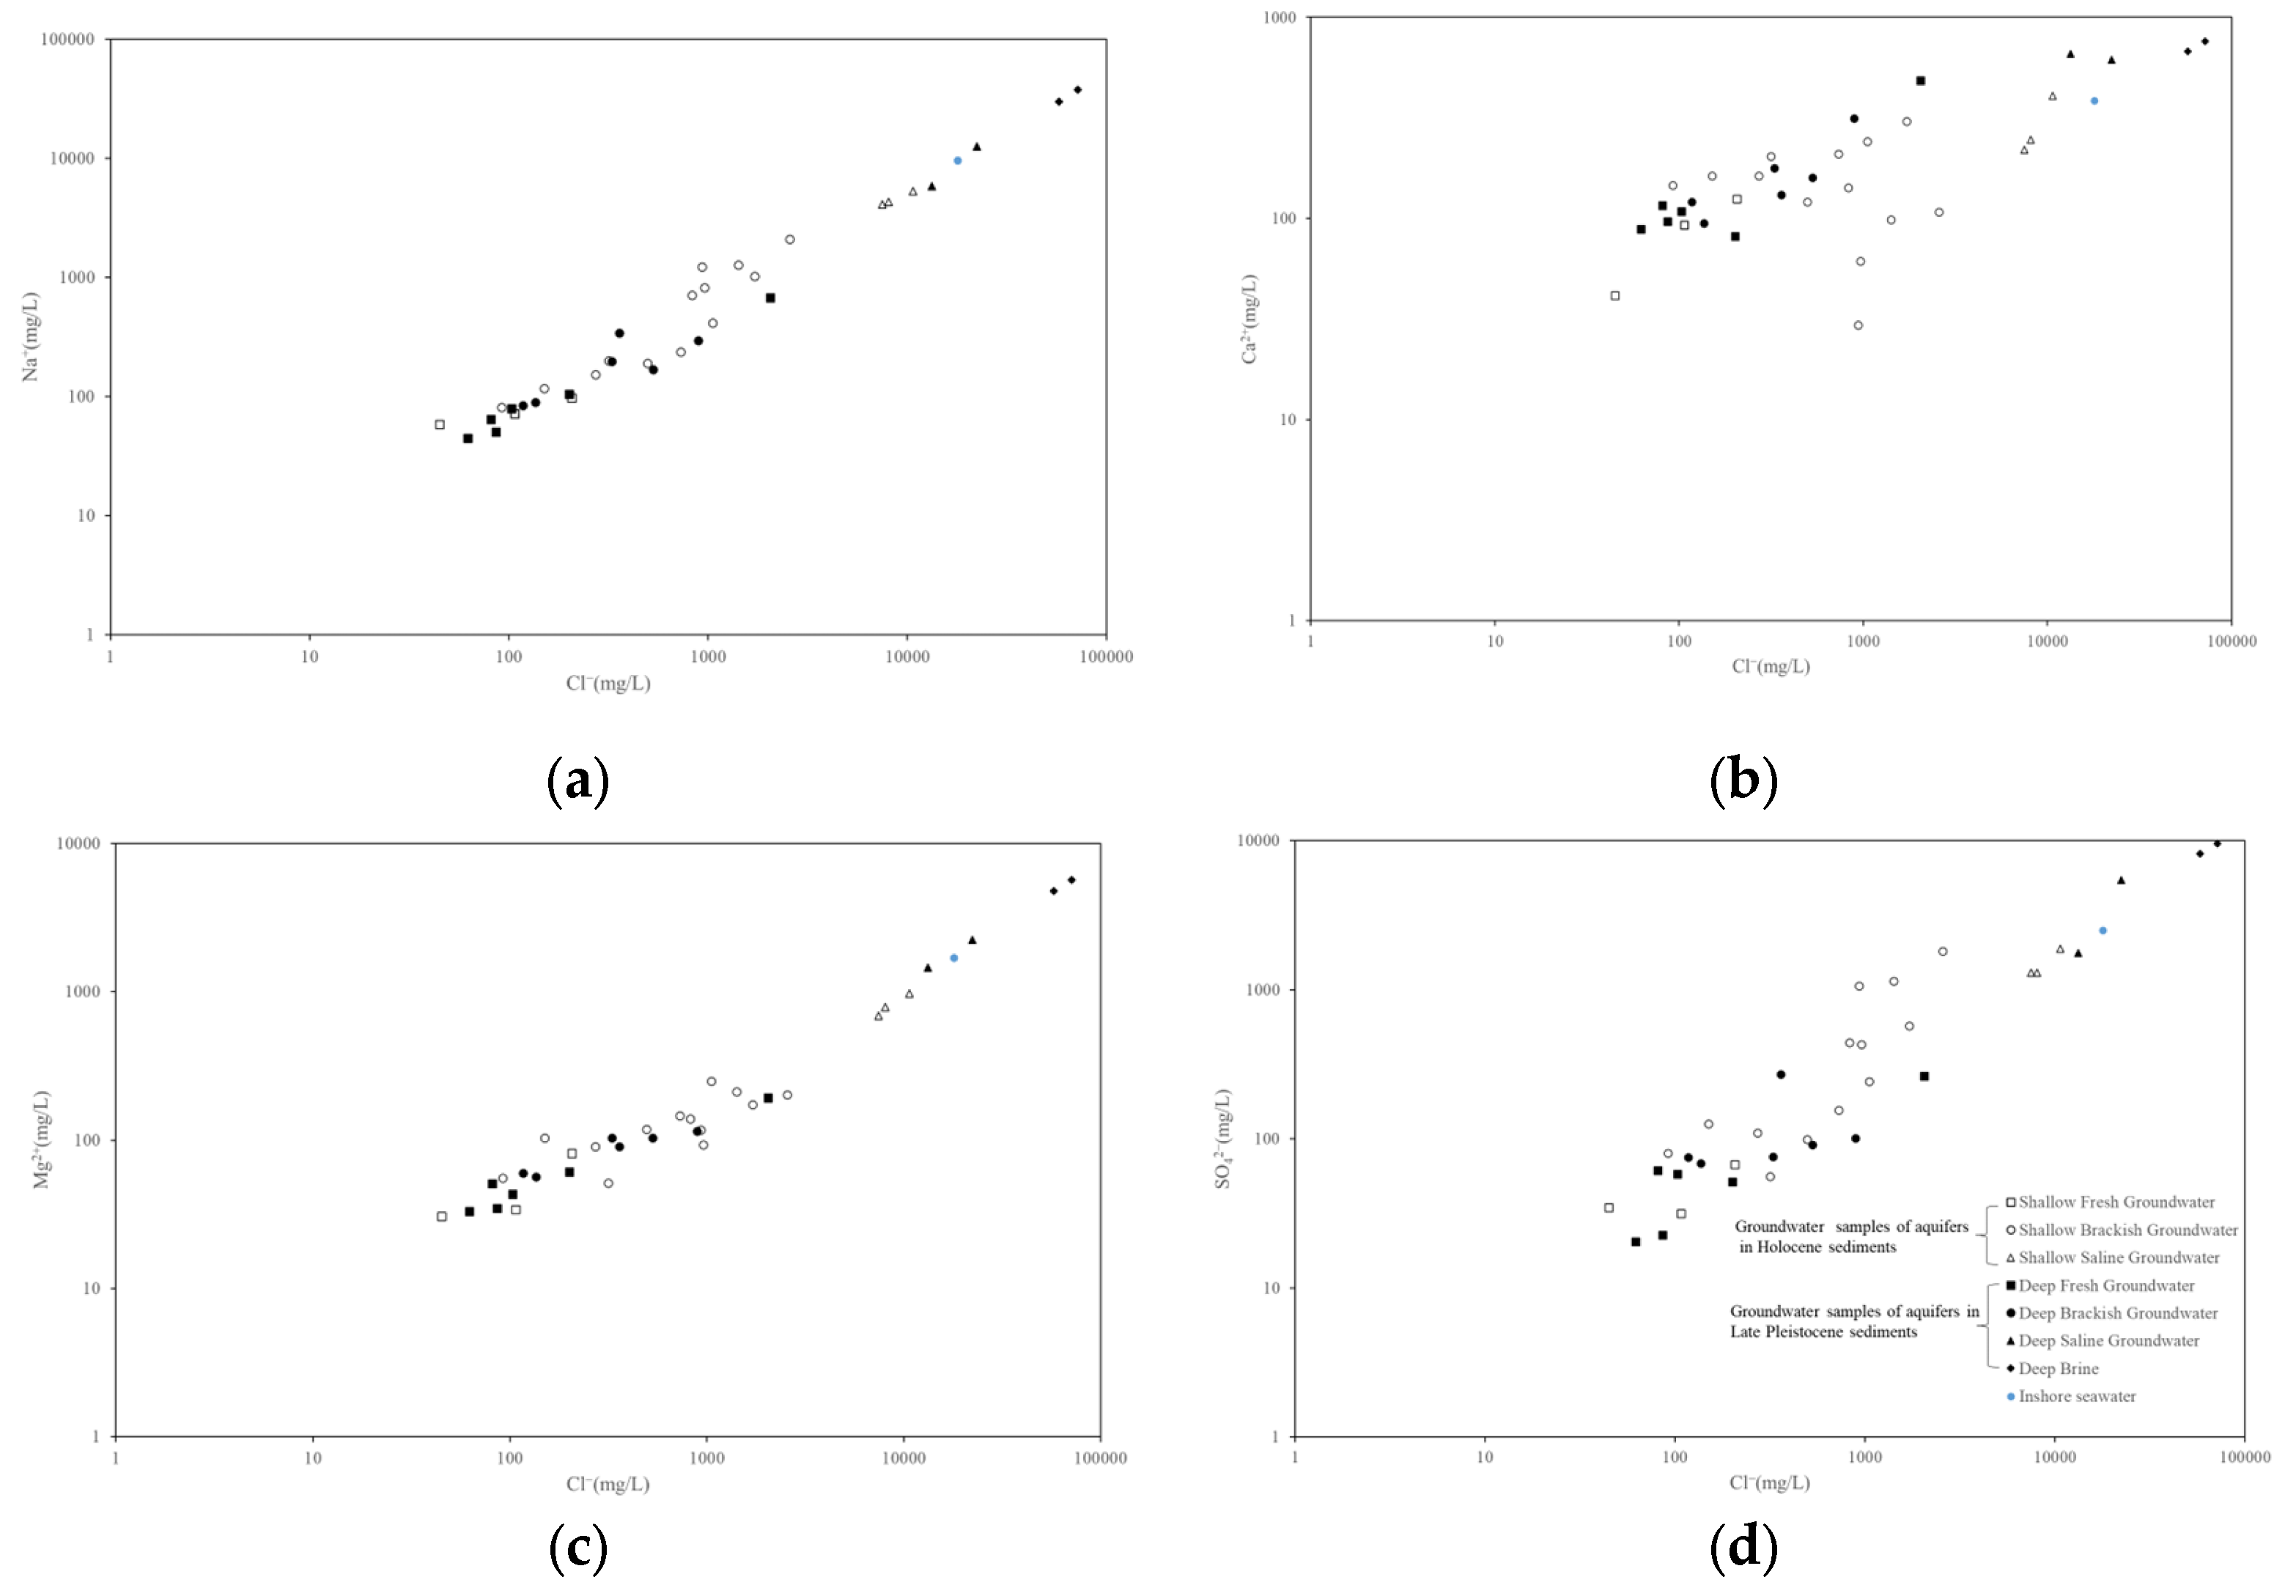
4.2.2. Ion Correlation Analysis
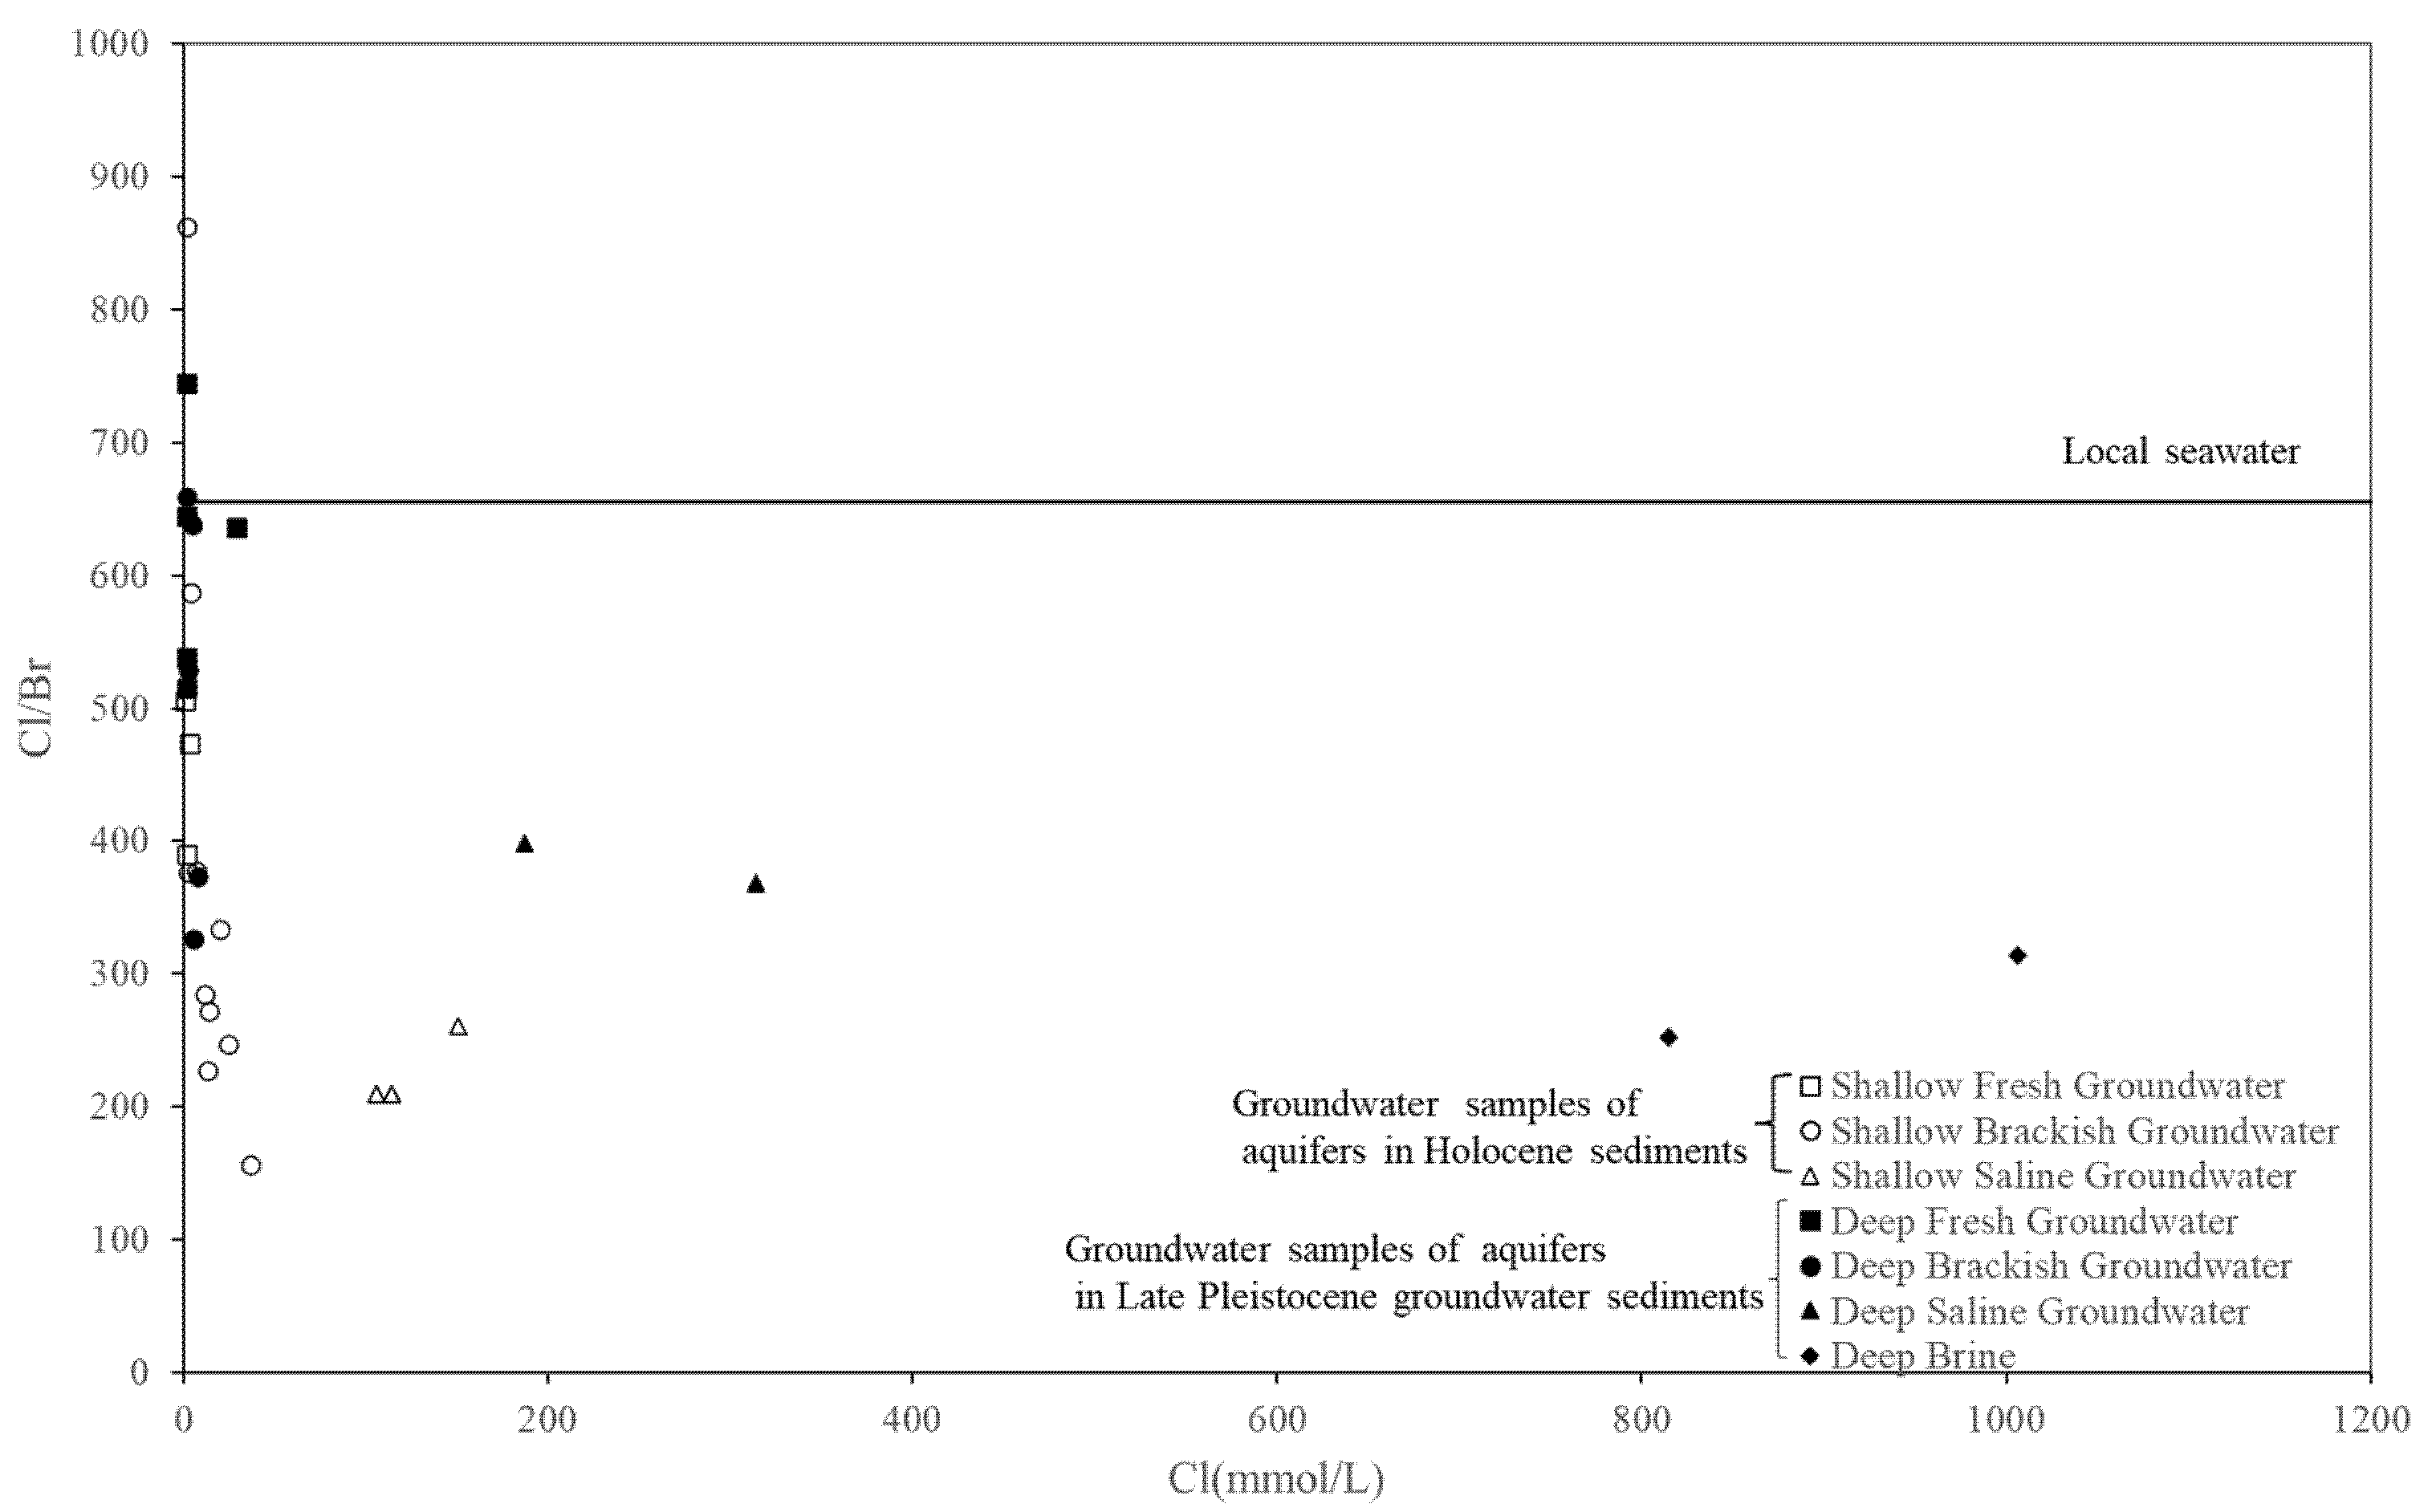
4.2.3. Other Significant Constituents and Ratios
Cl/Br Ratios and Origin of Salt
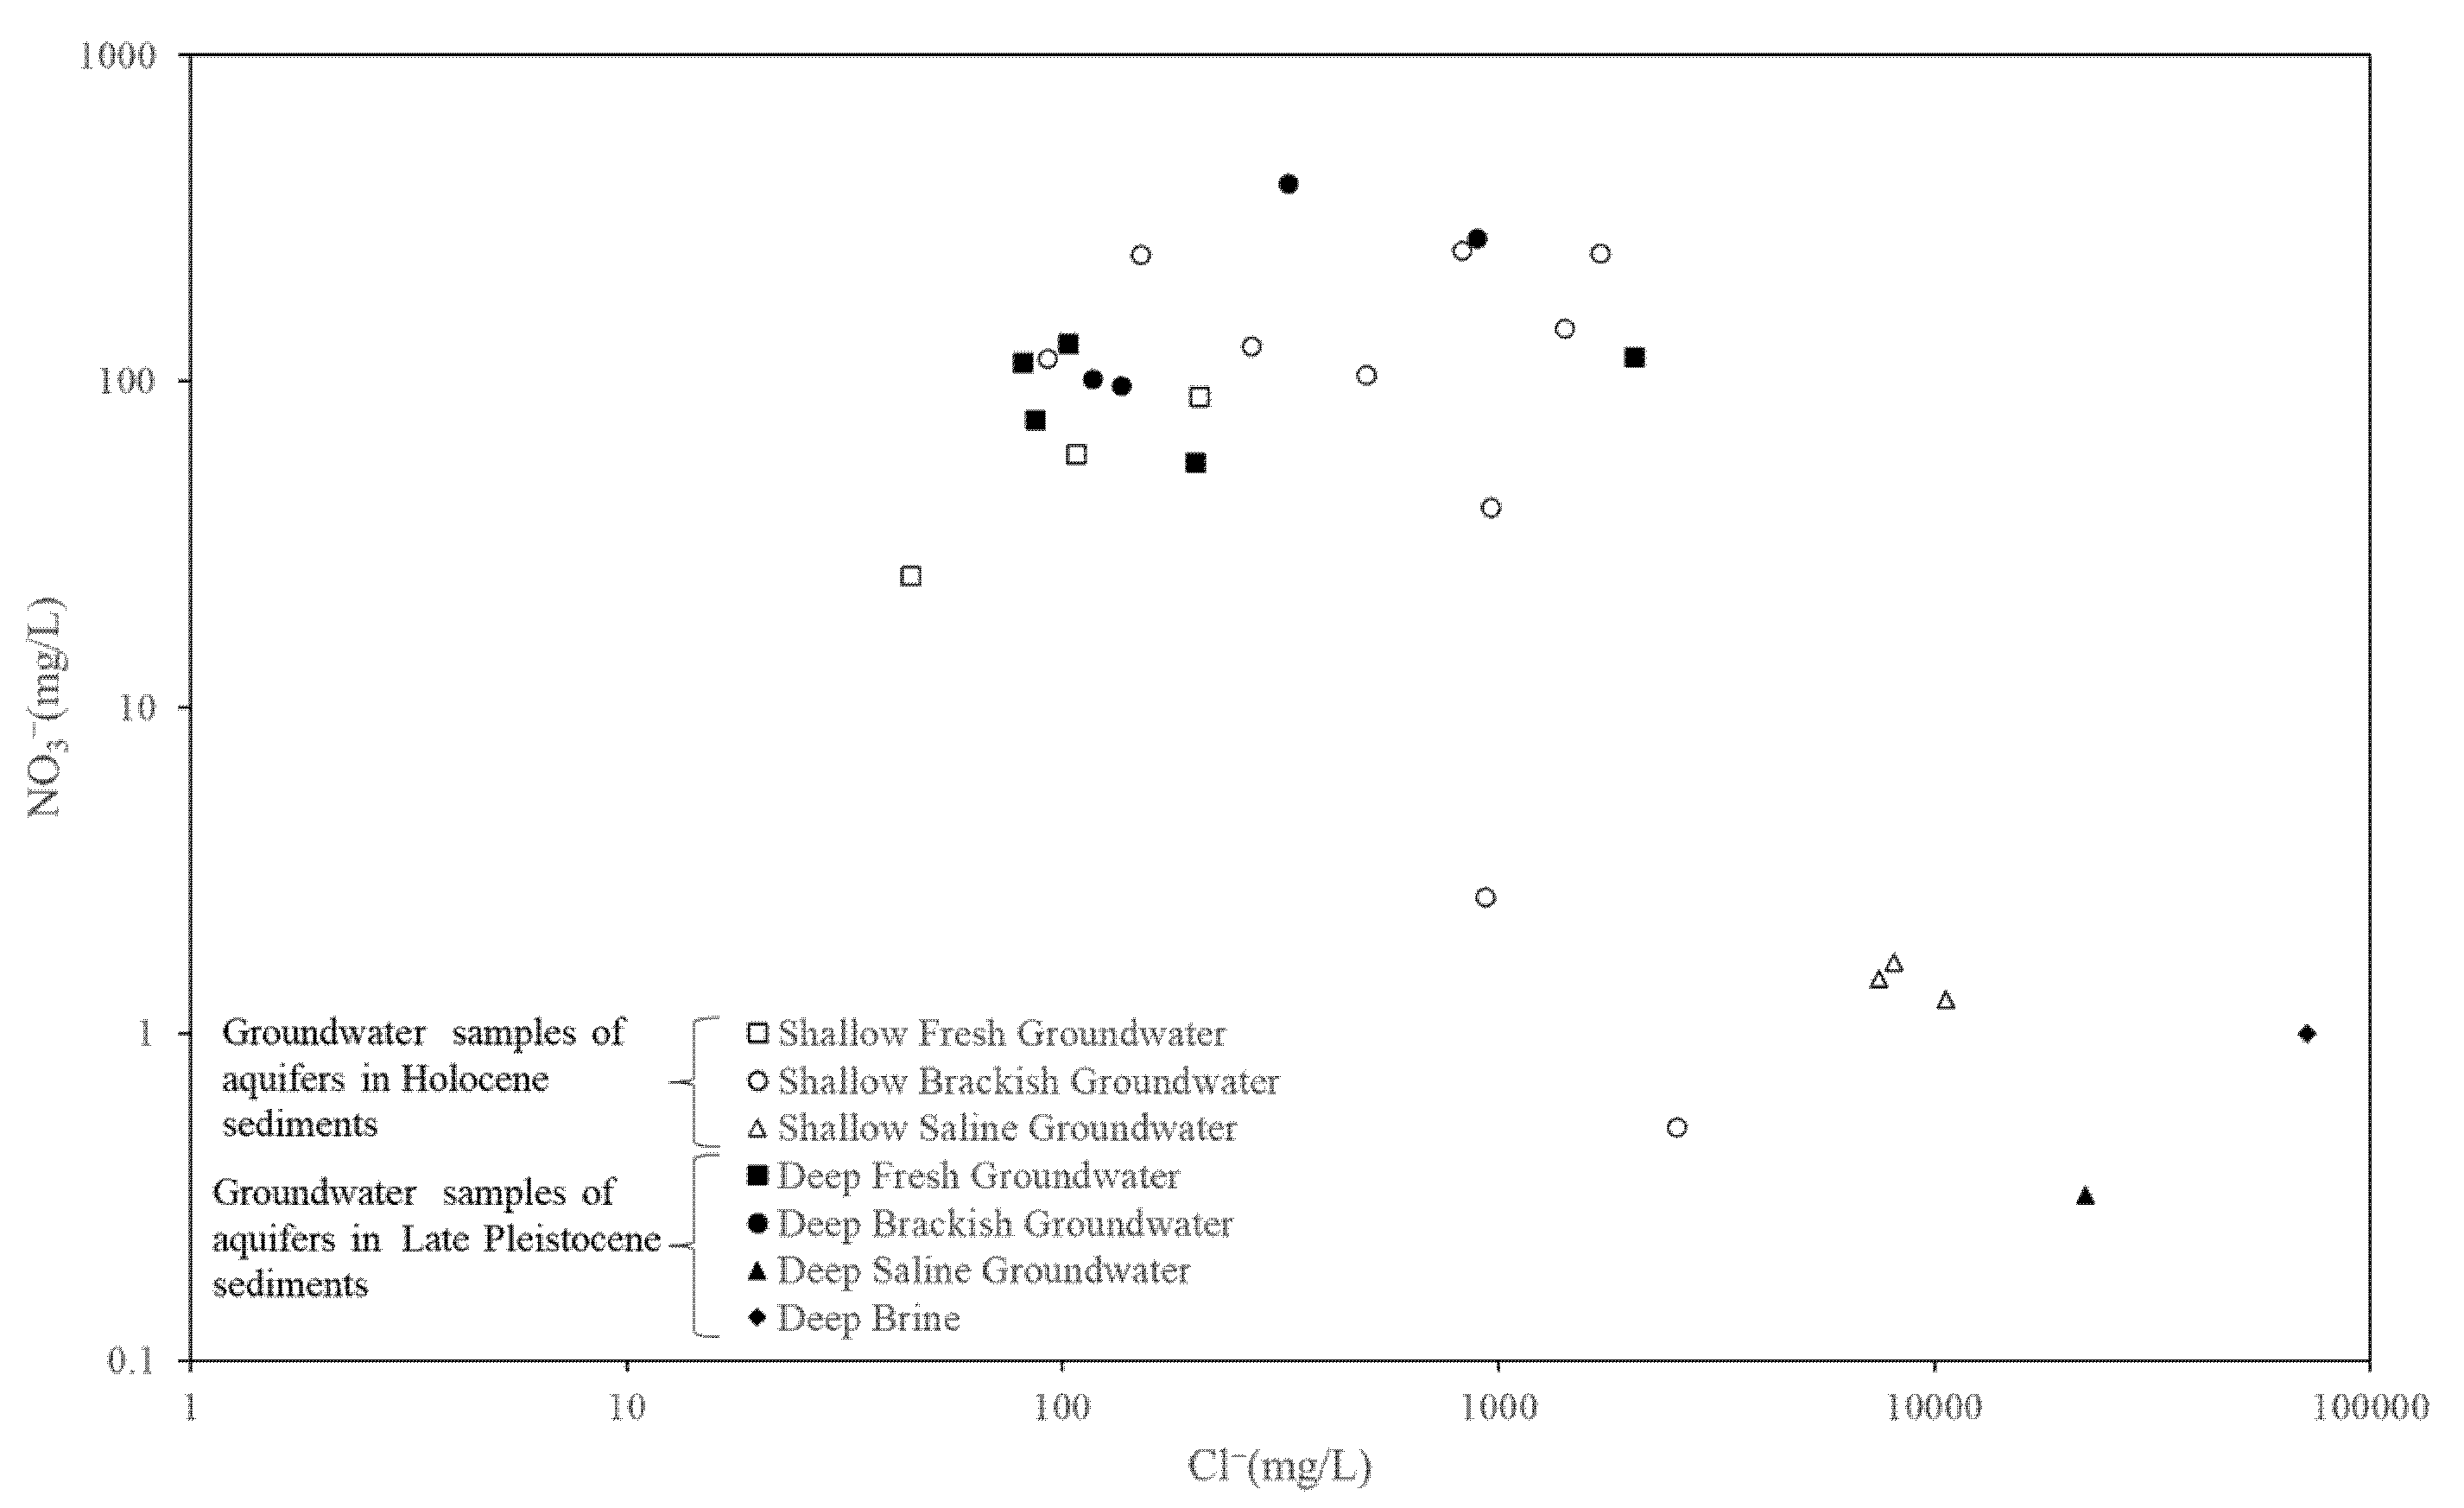
NO3− and Cl−
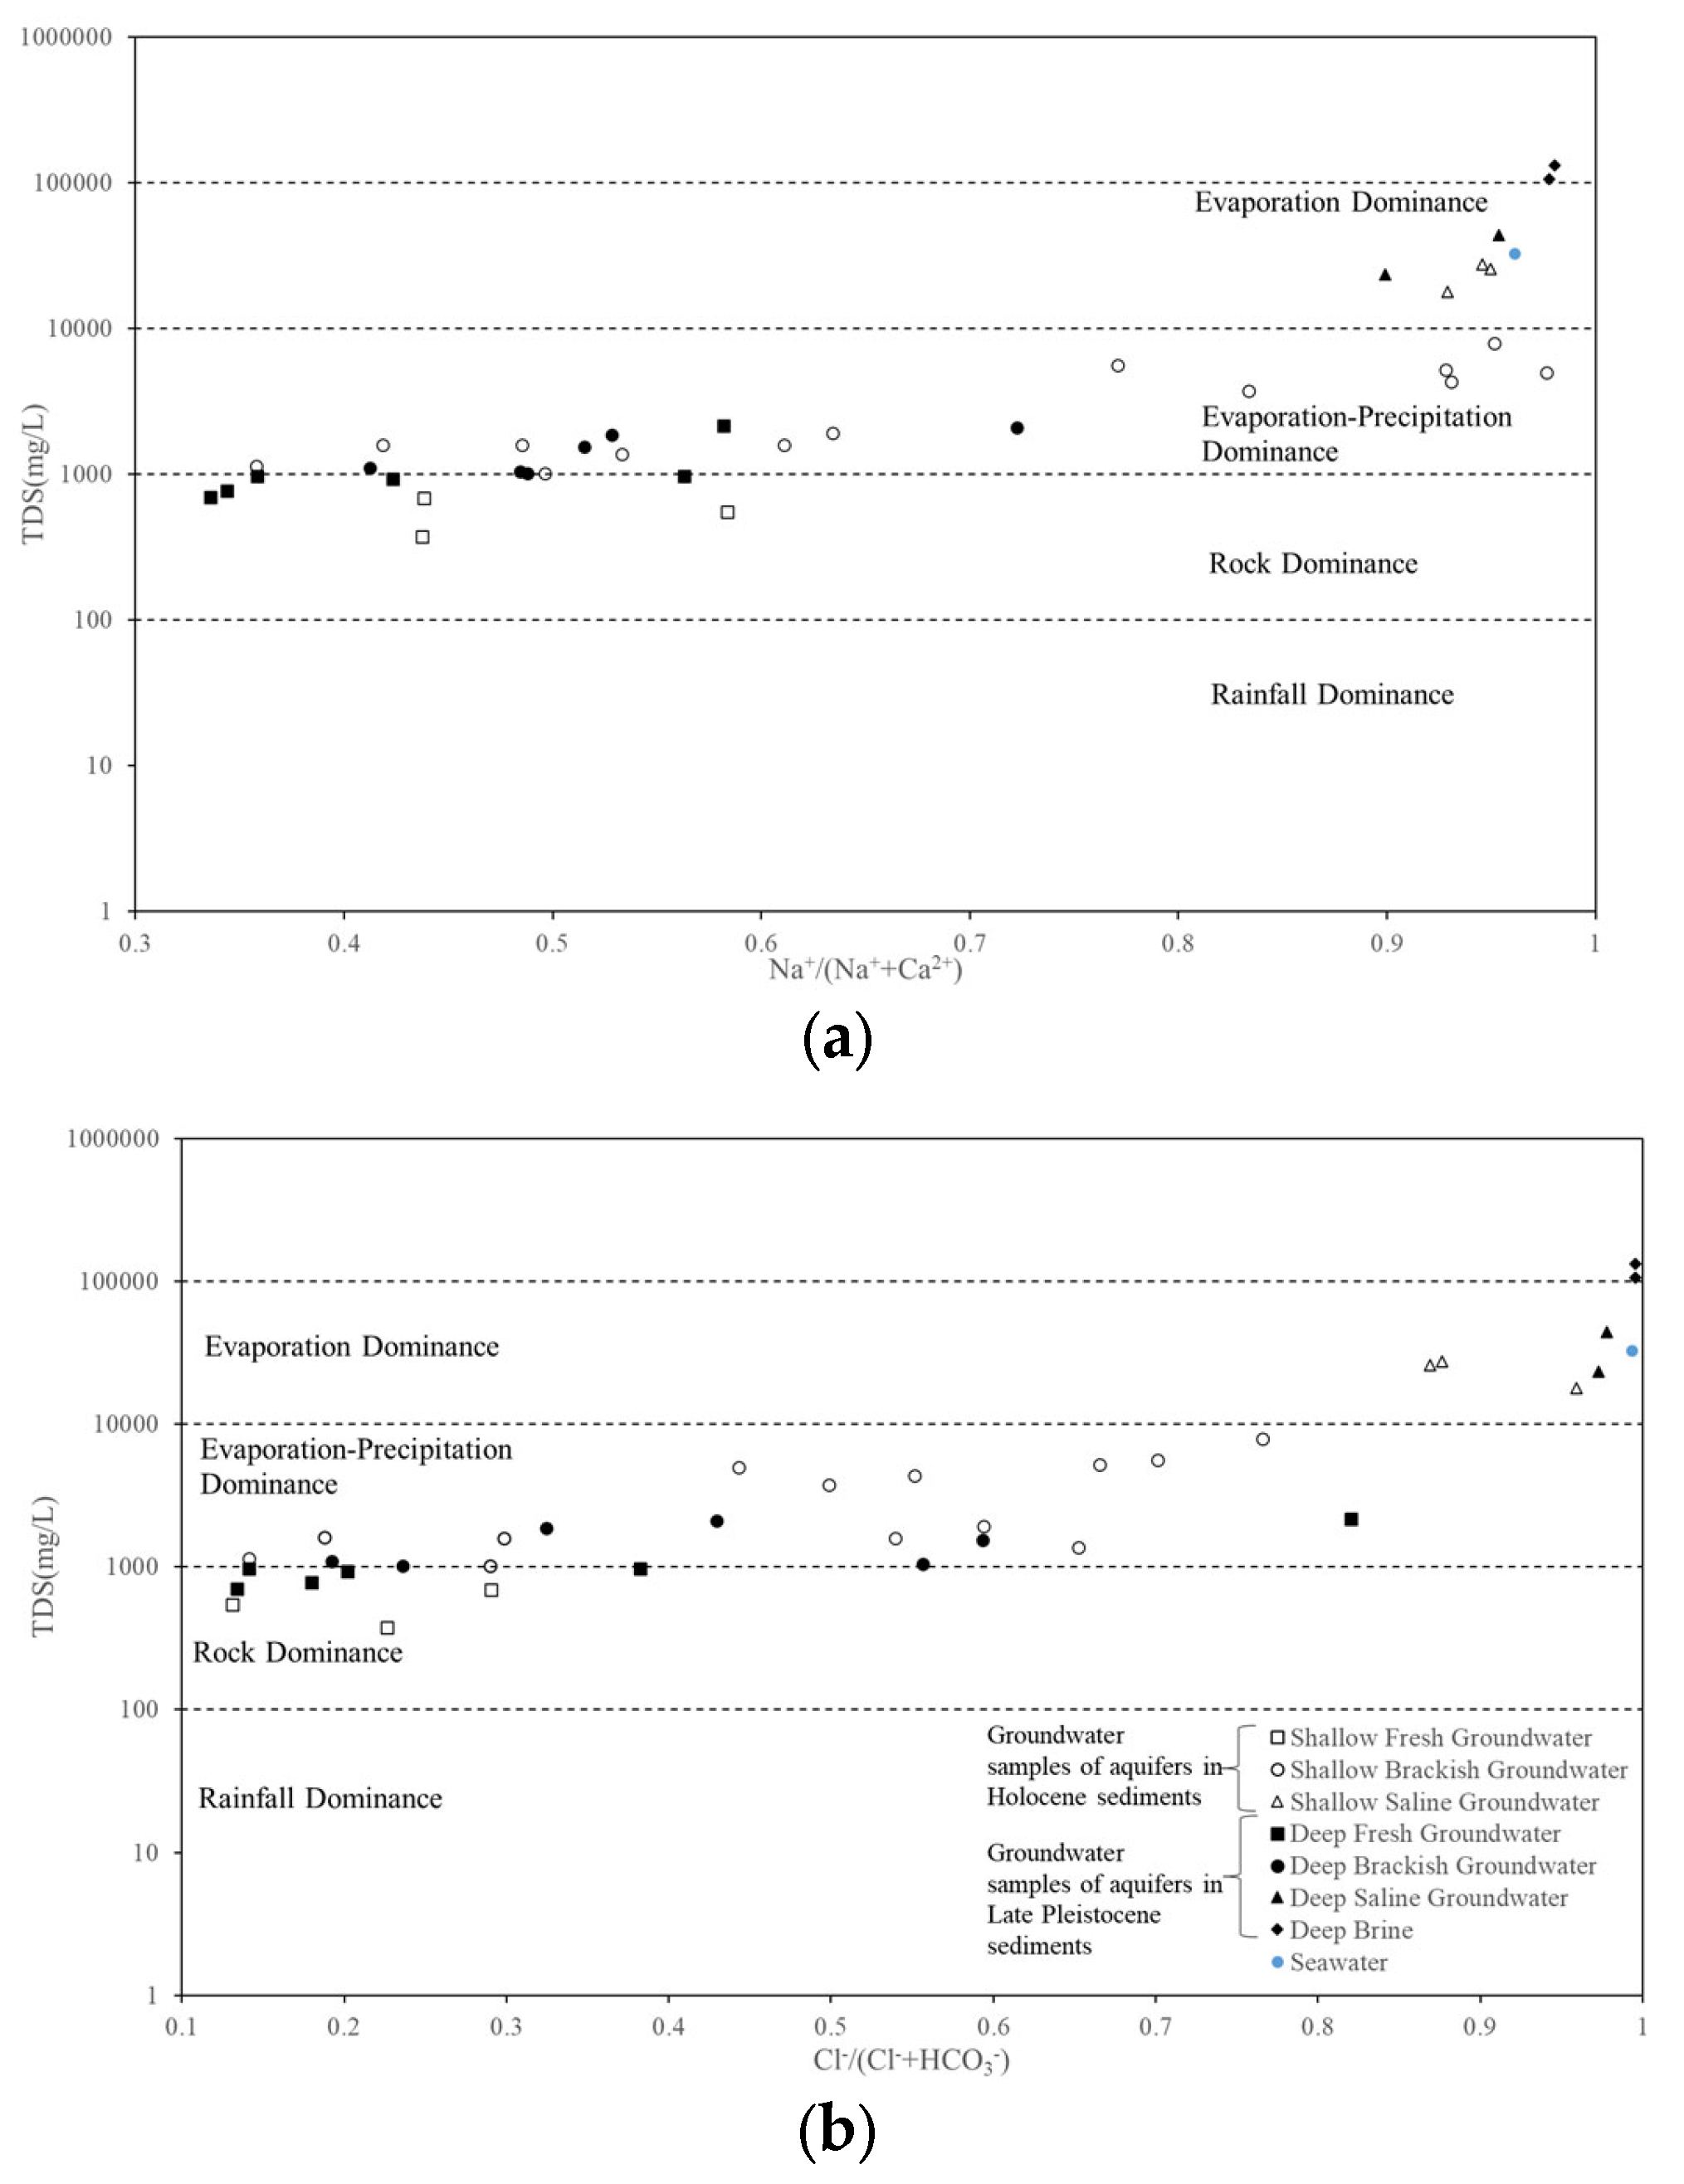
4.2.4. Hydrogeochemistry
4.3. Isotopic Characteristics
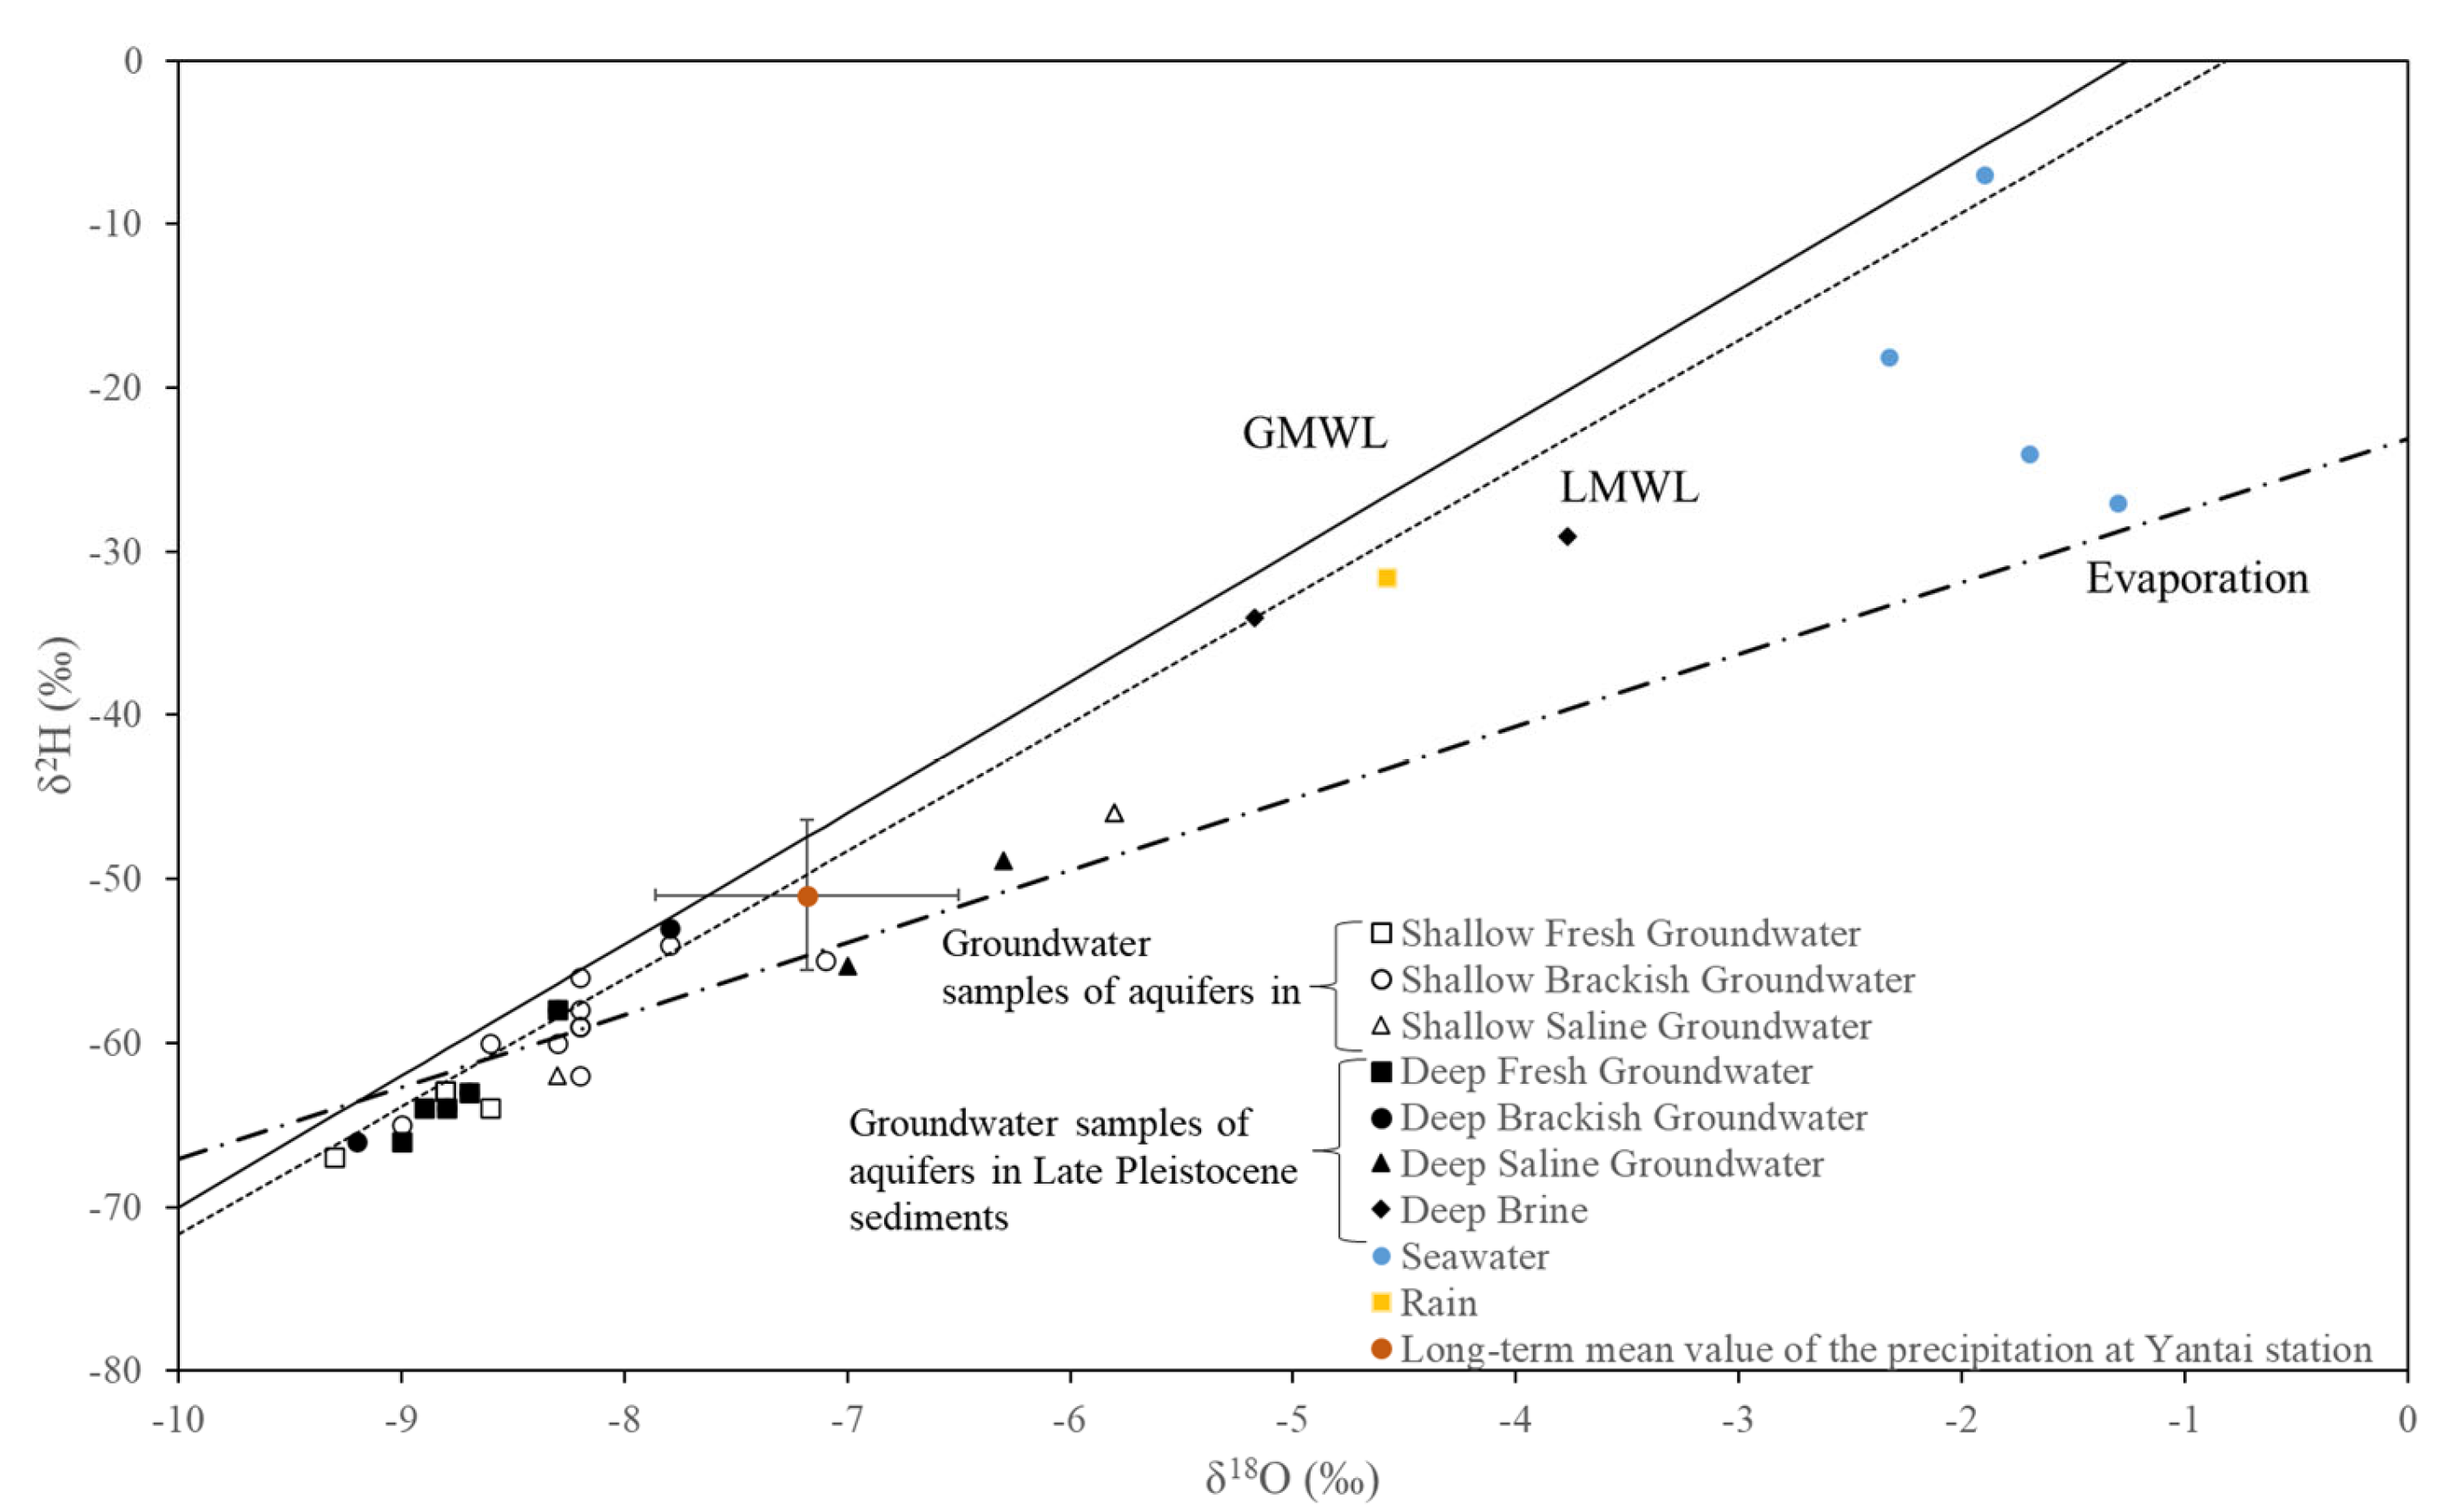
4.3.1. δ18O and δ2H Isotopes and Recharge Conditions
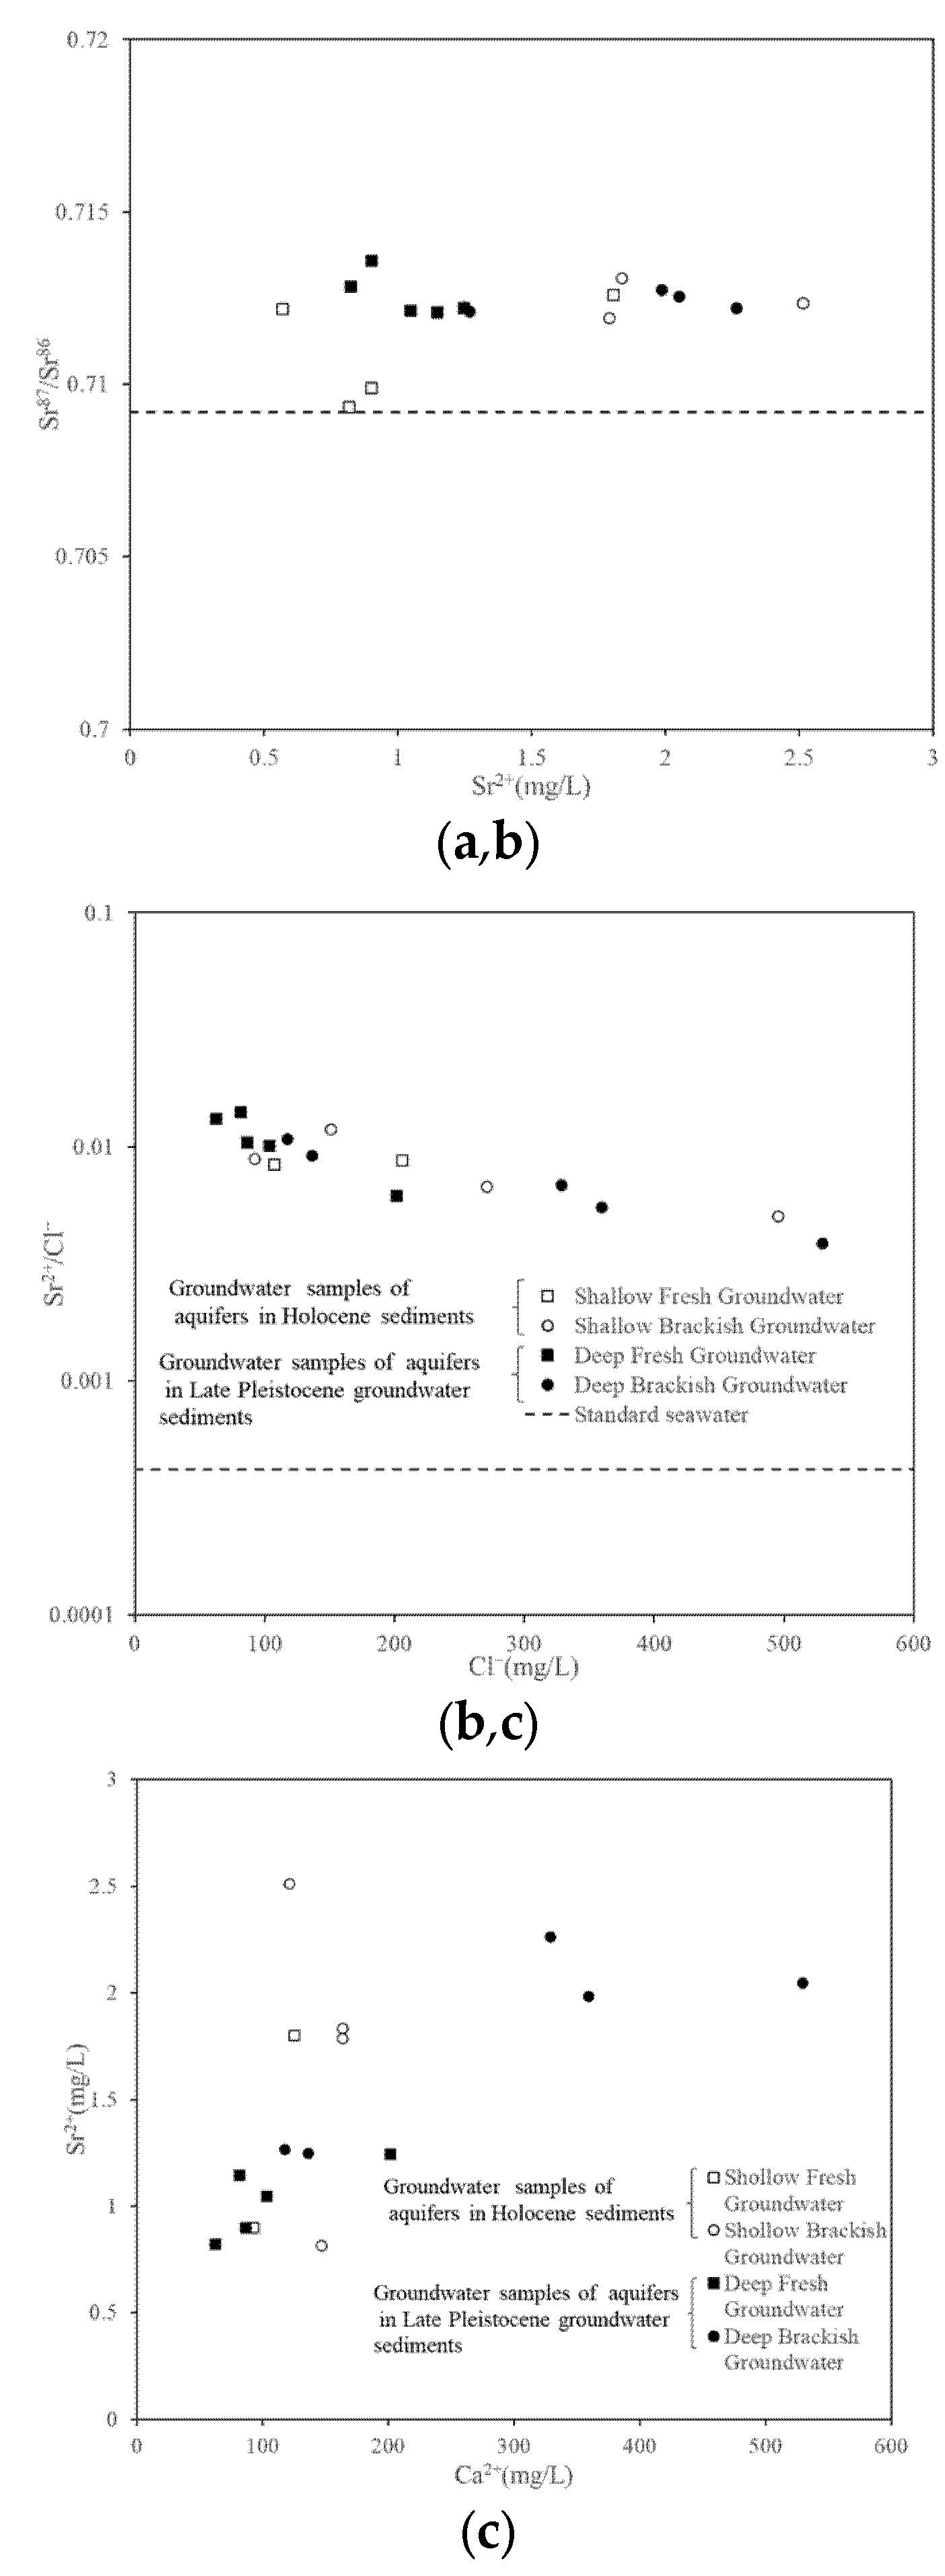
4.3.2. Sr and its Isotopic Characteristics
5. Conclusions
Author Contributions
Funding
Institutional Review Board Statement
Informed Consent Statement
Data Availability Statement
Conflicts of Interest
References
- Chang, C.M.; Yeh, H.D. Spectral approach to seawater intrusion in heterogeneous coastal aquifers. Hydrol. Earth Syst. Sci. 2010, 14, 719–727. [Google Scholar] [CrossRef]
- Post, V.E.A. Fresh and saline groundwater interaction in coastal aquifers: Is our technology ready for the problems ahead. Hydrogeol. J. 2005, 13, 120–123. [Google Scholar] [CrossRef]
- Sefelnasr, A.; Sherif, M. Impacts of seawater rise on seawater intrusion in the Nile Delta aquifer, Egypt. Ground Water 2014, 52, 264–276. [Google Scholar] [CrossRef] [PubMed]
- Sherif, M.; Sefelnasr, A.; Javadi, A. Incorporating the concept of equivalent freshwater head in successive horizontal simulations of seawater intrusion in the Nile Delta aquifer, Egypt. Hydrogeol. J. 2012, 464–465, 186–198. [Google Scholar] [CrossRef]
- Werner, A.D.; Bakker, M.; Post, V.E.A.; Vandenbohede, A.; Lu, C.H.; Ataie-Ashtianiab, B.; Simmonsab, C.T.; Barry, D.A. Seawater intrusion processes, investigation and management: Recent advances and future challenges. Adv. Water Resour. 2013, 51, 3–26. [Google Scholar] [CrossRef]
- Ketabchi, H.; Mahmoodzadeh, D.; Ataieashtiani, B.; Simmonset, C.T. Sea-level rise impacts on seawater intrusion in coastal aquifers: Review and integration. J. Hydrol. 2016, 535, 235–255. [Google Scholar] [CrossRef]
- Sheril, M.M.; Singh, V.P. Effect of climate change on sea water intrusion in coastal aquifers. Hydrol. Processes 1999, 13, 1277–1287. [Google Scholar] [CrossRef]
- Naeem, M.F.A.A.; Yusoff, I.; Ng, T.F.; Maity, J.P.; Alias, Y.; May, R.; Alborsh, H. A study on the impact of anthropogenic and geogenic factors on groundwater salinization and seawater intrusion in Gaza coastal aquifer, Palestine: An integrated multi-techniques approach. J. Afr. Earth Sci. 2019, 156, 75–93. [Google Scholar] [CrossRef]
- Chang, Y.W.; Hu, B.X.; Xu, Z.X.; Li, X.; Tong, J.X.; Chen, L.; Zhang, H.X.; Miao, J.J.; Liu, H.; Ma, Z. Numerical simulation of seawater intrusion to coastal aquifers and brine water/freshwater interaction in south coast of Laizhou Bay, China. J. Contam. Hydrol. 2018, 215, 1–10. [Google Scholar] [CrossRef]
- Ji, M.C. Some changes of resources and environment caused by seawater intrusion. Environmental Sciences 1991, 12, 62–66. (In Chinese) [Google Scholar]
- Carol, E.; Kruse, E.; Mas-Pla, J. Hydrochemical and isotopical evidence of ground water salinization process on the coastal plain of Samborombón Bay, Argentina. J. Hydrol. 2009, 365, 335–345. [Google Scholar] [CrossRef]
- Ahmed, M.A.; Samie, S.G.A.; Badawy, H.A. Factors controlling mechanics of groundwater salinization and hydrogeochemical processes in the Quaternary aquifer of the Eastern Nile Delta, Egypt. Environ. Earth Sci. 2013, 68, 369–394. [Google Scholar] [CrossRef]
- Bergelson, G.; Nativ, R.; Bein, A. Salinization and dilution history of groundwater discharging into the Sea of Galilee, the Dead Sea Transform, Israel. Appl. Geochem. 1999, 14, 91–118. [Google Scholar] [CrossRef]
- Kim, Y.; Lee, K.S.; Koh, D.C.; Lee, D.H.; Lee, S.G.; Park, W.B.; Koh, G.W.; Woo, N.C. Hydrogeochemical and isotopic evidence of groundwater salinization in a coastal aquifer: A case study in Jeju volcanic island, Korea. J. Hydrol. 2003, 270, 282–294. [Google Scholar] [CrossRef]
- Marimuthu, S.; Reynolds, D.A.; Le Gal, L.C. A field study of hydraulic, geochemical and stable isotope relationships in a coastal wetlands system. J. Hydrol. 2005, 315, 93–116. [Google Scholar] [CrossRef]
- Schiavo, M.A.; Hauser, S.; Povinec, P.P. Stable isotopes of water as a tool to study groundwater-seawater interactions in coastal south-eastern Sicily. J. Hydrol. 2009, 364, 40–49. [Google Scholar] [CrossRef]
- Han, D.M.; Kohfahl, C.; Song, X.F.; Xiao, G.Q.; Yang, J.L. Geochemical and isotopic evidence for palaeo-seawater intrusion into the south coast aquifer of Laizhou Bay. China. Appl. Geochem. 2011, 26, 863–883. [Google Scholar] [CrossRef]
- Han, D.M.; Song, X.F.; Currell, M.J.; Yang, J.L.; Xiao, G.Q. Chemical and isotopic constraints on evolution of groundwater salinization in the coastal plain aquifer of Laizhou Bay, China. J. Hydrol. 2014, 508, 12–27. [Google Scholar] [CrossRef]
- Barbieri, M.; Boschetti, T.; Petitta, M.; Tallini, M. Stable isotope (H2, O18 and Sr87/Sr86) and hydrochemistry monitoring for groundwater hydrodynamics analysis in a karst aquifer (Gran Sasso, Central Italy). Appl. Geochem. 2005, 20, 2063–2081. [Google Scholar] [CrossRef]
- Shi, Q.Y.; Andreas, M. Linking human-biometeorological thermal conditions with the KöppenGeiger climate classification updated–The Example of China. In Proceedings of the ICUC9—9th International Conference on Urban Climate jointly with 12th Symposium on the Urban Environment, Toulouse, France, 20–24 July 2015. [Google Scholar]
- Yang, Q.F.; Wang, R.J.; Xu, S.N.; Li, W.P.; Wang, Z.Y.; Mei, J.J.; Ding, Z.L.; Yang, P.J. Hydrogeochemistry and stable isotopes of groundwater from Shouguang, Laizhou and Longkou in the south coast aquifer of Laizhou Bay. Acta Geol. Sin. 2016, 90, 801–817. (In Chinese) [Google Scholar]
- Yang, Q.F.; Wang, R.J.; Xu, S.N.; Li, W.P.; Wang, Z.Y.; Mei, J.J.; Ding, Z.L.; Yang, P. J.Hydrogeochemistry and stable isotopes characteristic of brine in Laizhou Bay. Geol. Rev. 2016, 62, 343–352. (In Chinese) [Google Scholar]
- Xue, Y.Q.; Wu, J.C.; Ye, S.J.; Zhang, Y.X. Hydrogeological and hydrogeochemical studies for salt water intrusion on the south coast of Laizhou Bay, China. Ground Water 2000, 38, 38–45. [Google Scholar] [CrossRef]
- Liu, S. The Evolution of Ground-Saline Water and Process Mechanism of Saline Water Intrusion in Southern Laizhou Bay; China University of Geosciences: Wuhan, China, 2018. [Google Scholar]
- Zhang, X.Y.; Miao, J.J.; Bill, X.H.; Liu, H.W.; Zhang, H.X.; Ma, Z. Hydrogeochemical characterization and groundwater quality assessment in intruded coastal brine aquifers (Laizhou Bay, China). Environ. Sci. Pollut. Res. 2017, 24, 21073–21090. [Google Scholar] [CrossRef] [PubMed]
- Guan, Q.H.; Chen, X.Q.; Zhang, J. Analysis on dynamic changes of salt water intrusion in Northern Weibei Plain in south Laizhou Bay. Shandong Land Resour. 2014, 9, 39–47. (In Chinese) [Google Scholar]
- Yang, F.; Liu, S.; Jia, C.; Wang, Y.J. Hydrochemical characteristics and functions of groundwater in southern Laizhou Bay based on the multivariate statistical analysis approach. Estuarine. Coast. Shelf Sci. 2021, 250, 107153. [Google Scholar] [CrossRef]
- Liu, S.; Tang, Z.; Gao, M.; Hou, G.H. Evolutionary process of saline-water intrusion in Holocene and Late Pleistocene groundwater in southern Laizhou Bay. Sci. Total Environ. 2017, s607–s608, 586–599. [Google Scholar] [CrossRef]
- Ning, J.F.; Zou, X.Z.; Yang, S.H.; Chen, Y.; Wu, J.L.; Sun, L.L. Heavy metal contents analysis and potential ecological risk appraisal to sediments of large and medium-scaled reservoirs in Guangdong Province. Acta Ecol. Sin. 2009, 11, 801–817. [Google Scholar]
- Gates, J.B.; Edmunds, W.M.; Darling, W.; Ma, J.; Pang, Z.; Young, A.A. Conceptual model of recharge to southeastern Badain Jaran Desert groundwater and lakes from environmental tracers. Appl. Geochem. 2008, 23, 3519–3534. [Google Scholar] [CrossRef]
- Edmunds, W.M.; Ma, J.; Aeschbach-Hertig, W.; Kipfer, R.; Darbyshire, D.P.F. Groundwater recharge history and hydrogeochemical evolution in the Minqin Basin, North West China. Appl. Geochem. 2006, 21, 2148–2170. [Google Scholar] [CrossRef]
- Cartwright, I.; Weaver, T.R.; Fifield, L.K. Cl/Br ratios and environmental isotopes as indicators of recharge variability and groundwater flow: An example from the southeast Murray Basin, Australia. Chem. Geol. 2006, 231, 38–56. [Google Scholar] [CrossRef]
- Alcalá, F.J.; Custodio, E. Using the Cl/Br ratio as a tracer to identify the origin of salinity in aquifers in Spain and Portugal. J. Hydrol. 2008, 359, 189–207. [Google Scholar] [CrossRef]
- Siemann, M.G. Extensive and rapid changes in seawater chemistry during the Phanerozoic: Evidence from Br contents in basal halite. Terra Nova 2003, 15, 243–248. [Google Scholar] [CrossRef]
- Drever, J.I. The Geochemistry of Natural Waters: Surface and Groundwater Environments; Prentice-Hall: Hoboken, NJ, USA, 1997. [Google Scholar]
- Usiglio, M.J. Etudes sur la composition de leau de la Mediterranee et sur lexploitation des sels quelle contient. Ann. Chim. Phys. 1849, 27, 172–197. [Google Scholar]
- Mazor, E. Chemical and Isotopic Groundwater Hydrology; Marcel Dekker Inc.: New York, NY, USA, 2004. [Google Scholar]
- GB5749–2006. Standards for Drinking Water Quality. National Standard of People’s Republic of China: Beijing, China; 2006; pp. 1–10.
- Gibbs, R.J. Mechanisms controlling world water chemistry. Science 1970, 170, 1088–1090. [Google Scholar] [CrossRef]
- Aggarwal, P.K.; Gat, J.; Frochlich, K.F.O. Isotopes in the water cycle: Past, present and future of a developing science. J. Paleolimnol. 2007, 38, 621–622. [Google Scholar]
- Nagaya, Y.; Nakamura, K.; Saiki, M. Strontium concentrations and strontium-chlorinity ratios in seawater of the North Pacific and the adjacent seas of Japan. J. Oceanogr. Soc. Jpn. 1971, 27, 20–26. [Google Scholar] [CrossRef]
- Li, L.; Wang, Y.; Xie, X. Cl/Br ratios and chlorine isotope evidences for groundwater salinization and its impact on groundwater arsenic, fluoride and iodine enrichment in the Datong basin, China. Sci. Total Environ. 2016, 544, 158–167. [Google Scholar] [CrossRef]


| Groundwater | Water Type | Well Label | TDS (mg/L) | EC (ms/m) | PH | SO42− (mg/L) | Cl− (mg/L) | HCO3− (mg/L) | NO3− (mg/L) | F− (mg/L) | Br− (mg/L) | I− (mg/L) | K+ (mg/L) | Na+ (mg/L) | Ca2+ (mg/L) | Mg2+ (mg/L) | Sr (mg/L) | δ2H (‰) | δ18O (‰) | 87Sr/86Sr |
|---|---|---|---|---|---|---|---|---|---|---|---|---|---|---|---|---|---|---|---|---|
| Groundwater in Holocene sediments | Fresh | S3-1 | 549.8 | 642 | 7.97 | 34.77 | 44.87 | 297.60 | 25.43 | 0.49 | 0.10 | 0.01 | 1.21 | 58.22 | 41.52 | 30.58 | 0.57 | −63 | −8.8 | 0.712202 |
| Fresh | S7 | 375 | 772 | 7.50 | 31.50 | 107.15 | 366.13 | 60.00 | 0.53 | 0.31 | <0.01 | 1.30 | 71.91 | 92.55 | 34.17 | 0.90 | −67 | −9.3 | 0.709981 | |
| Fresh | S21 | 689 | 1400 | 7.37 | 67.07 | 205.86 | 503.00 | 90.00 | 0.61 | 0.49 | <0.01 | 1.16 | 97.29 | 124.74 | 81.76 | 1.80 | −64 | −8.6 | 0.712603 | |
| Brackish | S1-1 | 1145 | 1281 | 7.39 | 80.32 | 91.90 | 560.20 | 117.50 | 0.46 | 0.12 | <0.01 | 0.97 | 81.49 | 146.30 | 55.64 | 0.82 | −58 | −8.2 | 0.709337 | |
| Brackish | S2-1 | 1010 | 2020 | 7.15 | 56.22 | 315.32 | 772.18 | - | - | - | - | 1.24 | 200.10 | 203.21 | 51.26 | - | - | - | - | |
| Brackish | S4-1 | 1597 | 1760 | 7.26 | 125.60 | 150.40 | 649.50 | 245.60 | 0.66 | 0.45 | <0.01 | 1.21 | 117.40 | 163.00 | 103.80 | 1.79 | −54 | −7.8 | 0.711934 | |
| Brackish | S5-1 | 1581 | 1865 | 7.14 | 110.10 | 271.00 | 637.00 | 129.10 | 0.42 | 0.52 | <0.01 | 2.27 | 153.90 | 163.20 | 90.53 | 1.84 | −62 | −8.2 | 0.713085 | |
| Brackish | S6-1 | 1588 | 2160 | 7.41 | 98.81 | 495.40 | 422.70 | 105.10 | 0.51 | 1.48 | 0.05 | 3.81 | 189.70 | 120.90 | 118.10 | 2.51 | −65 | −9.0 | 0.712368 | |
| Brackish | S8 | 1920 | 3990 | 7.63 | 243.43 | 1051.41 | 718.57 | - | - | - | - | 2.54 | 418.60 | 241.44 | 248.95 | - | - | - | - | |
| Brackish | S9 | 1380 | 3010 | 7.36 | 156.44 | 729.17 | 388.94 | - | - | - | - | 1.72 | 239.00 | 209.25 | 146.44 | - | - | - | - | |
| Brackish | S10 | 5617 | - | 6.93 | 574.15 | 1708.92 | 728.09 | 248.09 | 0.12 | 7.80 | 0.09 | 64.50 | 1025.00 | 304.91 | 173.60 | - | −56 | −8.2 | - | |
| Brackish | S12 | 3742 | - | 7.21 | 442.69 | 825.66 | 829.42 | 251.40 | 1.05 | 3.26 | 0.12 | 6.20 | 715.00 | 142.58 | 139.68 | - | −59 | −8.2 | - | |
| Brackish | S13 | 5185 | - | 7.28 | 1148.31 | 1411.30 | 709.12 | 145.39 | 1.23 | 4.75 | 0.23 | 25.00 | 1270.00 | 98.71 | 212.18 | - | −60 | −8.3 | - | |
| Brackish | S14 | 4342 | - | 7.45 | 429.27 | 960.06 | 781.93 | 41.06 | 1.50 | 3.97 | 0.20 | 10.10 | 825.00 | 61.42 | 93.12 | - | −55 | −7.1 | - | |
| Brackish | S17 | 7937 | - | 7.45 | 1824.41 | 2563.68 | 785.10 | 0.52 | 0.95 | 18.50 | 0.10 | 62.50 | 2100.00 | 107.49 | 202.66 | - | −59 | −8.2 | - | |
| Brackish | S18 | 4978 | - | 7.77 | 1059.77 | 931.27 | 1171.23 | 2.64 | 1.58 | 4.63 | 0.13 | 38.00 | 1225.00 | 29.61 | 117.06 | - | −60 | −8.6 | - | |
| Saline | S11 | 17,781 | - | 7.32 | 1891.48 | 10,656.75 | 449.53 | 1.27 | 0.28 | 46.00 | 0.22 | 48.75 | 5312.50 | 405.81 | 971.10 | - | −62 | −8.3 | - | |
| Saline | S15 | 25,708 | - | 7.10 | 1298.55 | 7464.52 | 1123.83 | 1.48 | 0.83 | 40.30 | 0.48 | 48.00 | 4125.00 | 219.36 | 691.74 | - | −46 | −5.8 | - | |
| Saline | S16 | 27,430 | - | 6.85 | 1309.28 | 8064.58 | 1139.66 | 1.66 | 0.96 | 43.40 | 0.59 | 49.00 | 4300.00 | 246.78 | 788.18 | - | −46 | −5.8 | - | |
| Groundwater in Late Pleistocene sediments | Fresh | S1-2 | 699 | 793 | 7.34 | 20.38 | 62.11 | 401.80 | 34.73 | 0.42 | 0.11 | <0.01 | 1.44 | 44.70 | 88.44 | 33.04 | 0.82 | −64 | −8.8 | 0.712853 |
| Fresh | S3-2 | 977 | 1253 | 7.91 | 51.50 | 201.00 | 324.40 | 119.30 | 0.47 | 0.44 | 0.01 | 3.54 | 105.00 | 81.52 | 61.06 | 1.25 | −58 | −8.3 | 0.712223 | |
| Fresh | S1-3 | 776 | 910 | 7.48 | 22.75 | 86.16 | 392.90 | 56.78 | 0.45 | 0.13 | <0.01 | 2.21 | 50.77 | 96.98 | 34.77 | 0.90 | −64 | −8.9 | 0.713595 | |
| Fresh | S4-3 | 968 | 1087 | 7.28 | 61.55 | 81.13 | 494.10 | 76.20 | 0.40 | 0.17 | <0.01 | 1.08 | 64.80 | 116.10 | 51.21 | 1.15 | −63 | −8.7 | 0.712087 | |
| Fresh | S5-3 | 936 | 1059 | 7.36 | 57.81 | 103.00 | 407.80 | 114.20 | 0.44 | 0.18 | 0.02 | 1.20 | 79.70 | 108.50 | 43.38 | 1.05 | −66 | −9.0 | 0.712154 | |
| Brackish | S2-2 | 2170 | 4340 | 6.88 | 264.28 | 2043.12 | 448.25 | - | - | - | - | 7.41 | 678.20 | 486.91 | 192.82 | - | - | - | - | |
| Brackish | S4-2 | 1105 | 1185 | 7.35 | 75.21 | 117.00 | 491.70 | 131.10 | 0.39 | 0.20 | <0.01 | 1.32 | 84.90 | 120.90 | 60.14 | 1.27 | −58 | −8.3 | 0.712131 | |
| Brackish | S5-2 | 1015 | 1236 | 7.50 | 68.81 | 136.10 | 440.50 | 101.90 | 0.46 | 0.29 | <0.01 | 1.11 | 90.11 | 94.64 | 56.75 | 1.25 | −64 | −8.8 | 0.712236 | |
| Brackish | S6-2 | 1544 | 2090 | 7.34 | 91.08 | 529.50 | 363.10 | 97.05 | 0.38 | 1.60 | <0.01 | 4.36 | 169.60 | 159.50 | 103.40 | 2.05 | −66 | −9.2 | 0.712554 | |
| Brackish | S2-3 | 1050 | 2140 | 7.26 | 101.51 | 891.59 | 710.58 | - | - | - | - | 1.98 | 295.10 | 313.87 | 114.71 | - | - | - | - | |
| Brackish | S3-3 | 1870 | 2210 | 7.14 | 75.99 | 328.50 | 684.60 | 276.50 | 0.69 | 0.58 | <0.01 | 0.89 | 199.00 | 177.70 | 103.90 | 2.26 | −63 | −8.7 | 0.712211 | |
| Brackish | S6-3 | 2106 | 2490 | 7.69 | 270.90 | 359.00 | 477.40 | 404.00 | 0.46 | 1.24 | <0.01 | 1.06 | 341.20 | 131.00 | 90.42 | 1.99 | −53 | −7.8 | 0.712753 | |
| Saline | S21 | 23,470 | 31.1 | 7.80 | 1769.12 | 13,281.00 | 368.80 | - | - | 37.56 | 0.28 | 60.37 | 5841.15 | 656.53 | 1456.23 | - | −55 | −7.0 | - | |
| Saline | S22 | 43,902 | 54.31 | 9.16 | 5466.95 | 22,239.01 | 496.82 | - | - | 68.06 | 1.44 | 139.79 | 12,629.00 | 616.05 | 2244.34 | - | −49 | −6.3 | - | |
| Brine | S19 | 132,300 | - | 7.15 | 961.80 | 71,336.00 | 316.94 | 0.32 | - | 256.03 | 0.14 | 1016.11 | 37.53 | 757.23 | 5692.11 | - | −34 | −5.2 | - | |
| Brine | S20 | 106,350 | - | 7.75 | 816.90 | 57,784.00 | 269.10 | 1.00 | - | 258.89 | 0.14 | 885.03 | 29.98 | 676.70 | 4782.47 | - | −29 | −3.8 | - | |
| Seawater | 32,622 | 8.32 | 2508.69 | 17,881.84 | 118.87 | 58.73 | 0.24 | 358.22 | 9582.96 | 386.72 | 1701.66 | −18 | −2.3 | |||||||
| TDS | PH | K+ | Na+ | Ca2+ | Mg2+ | SO42− | Cl− | HCO3− | NO3− | |
|---|---|---|---|---|---|---|---|---|---|---|
| TDS | 1 | |||||||||
| PH | 0.134 | 1 | ||||||||
| K+ | 0.971 | 0.064 | 1 | |||||||
| Na+ | 0.996 | 0.55 | 0.979 | 1 | ||||||
| Ca2+ | 0.781 | 0.177 | 0.703 | 0.785 | 1 | |||||
| Mg2+ | 0.992 | 0.197 | 0.965 | 0.996 | 0.824 | 1 | ||||
| SO42− | 0.975 | 0.28 | 0.937 | 0.981 | 0.793 | 0.98 | 1 | |||
| Cl− | 0.995 | 0.152 | 0.98 | 0.999 | 0.797 | 0.997 | 0.974 | 1 | ||
| HCO3− | −0.177 | −0.295 | −0.255 | −0.234 | −0.244 | −0.251 | −0.179 | −0.253 | 1 | |
| NO3− | −0.358 | −0.118 | −0.307 | −0.34 | −0.214 | −0.335 | −0.362 | −0.338 | −0.032 | 1 |
Publisher’s Note: MDPI stays neutral with regard to jurisdictional claims in published maps and institutional affiliations. |
© 2022 by the authors. Licensee MDPI, Basel, Switzerland. This article is an open access article distributed under the terms and conditions of the Creative Commons Attribution (CC BY) license (https://creativecommons.org/licenses/by/4.0/).
Share and Cite
Chang, Y.; Chen, X.; Guan, Q.; Tian, C.; Liu, D.; Xu, D. Study on the Sources of Salinity of Groundwater in Holocene and Late Pleistocene Sediments Based on Hydrochemical and Isotopic Methods in Southern Laizhou Bay. Water 2022, 14, 2761. https://doi.org/10.3390/w14172761
Chang Y, Chen X, Guan Q, Tian C, Liu D, Xu D. Study on the Sources of Salinity of Groundwater in Holocene and Late Pleistocene Sediments Based on Hydrochemical and Isotopic Methods in Southern Laizhou Bay. Water. 2022; 14(17):2761. https://doi.org/10.3390/w14172761
Chicago/Turabian StyleChang, Yawen, Xuequn Chen, Qinghua Guan, Chanjuan Tian, Dan Liu, and Dandan Xu. 2022. "Study on the Sources of Salinity of Groundwater in Holocene and Late Pleistocene Sediments Based on Hydrochemical and Isotopic Methods in Southern Laizhou Bay" Water 14, no. 17: 2761. https://doi.org/10.3390/w14172761
APA StyleChang, Y., Chen, X., Guan, Q., Tian, C., Liu, D., & Xu, D. (2022). Study on the Sources of Salinity of Groundwater in Holocene and Late Pleistocene Sediments Based on Hydrochemical and Isotopic Methods in Southern Laizhou Bay. Water, 14(17), 2761. https://doi.org/10.3390/w14172761