Communication

Development and Validation of an ICP-MS Method for the Detection of Platinum in the Lebanese Aquatic Environment

by
Carla Nassour
*,
Zilvinas Zacharauskas
,
Shereen Nabhani-Gebara
,
Stephen Jonathan Barton
and
James Barker
School of Life Sciences, Pharmacy and Chemistry, Kingston University, Kingston-upon-Thames, London KT12EE, UK
*
Author to whom correspondence should be addressed.
Water 2022, 14(17), 2631; https://doi.org/10.3390/w14172631
Submission received: 22 June 2022 / Revised: 19 August 2022 / Accepted: 24 August 2022 / Published: 26 August 2022
(This article belongs to the Section Water Quality and Contamination)

Abstract

:
Lebanon is a Middle Eastern country located on the eastern Mediterranean coast. Compared to other countries in the MENA (Middle East North Africa) region, Lebanon is considered the richest in water resources. However, due to inadequate water management, Lebanese water resources are under stress. Water pollution is one of the main problems causing major concerns. The contamination of Lebanese surface water originates predominantly from the discharge of untreated municipal and industrial wastewater. With only a few studies investigating the level of water contamination in Lebanon, this research is the first to report the level of platinum in numerous rivers, three wastewater treatment plants, and two untreated sewage outfalls in coastal areas across Lebanon. To determine the platinum levels, an Inductively Coupled Plasma-Mass Spectrometry (ICP-MS) method was developed and validated in compliance with the ICH guidelines. The method demonstrated acceptable sensitivity with LOQ and LOD equal to 2.35 and 0.56 ng L−1, respectively. The level of total platinum in the Lebanese water samples ranged between 22.44–53.32 ng L−1. These concentrations were all above the baseline concentration of platinum in tap water indicated by WHO and aligned with previous studies in other countries. Although the baseline concentration of platinum in Lebanese water resources is unknown and the source of the total platinum detected in this study could not be identified, these preliminary findings could serve as a foundation for future research.

Graphical Abstract

1. Introduction

Lebanon is a Middle Eastern country bounded by the Mediterranean Sea with a coastline length of about 225 km. Despite its small area (10,452 km2), Lebanon is privileged with plentiful water resources [1]. These consist of rivers, springs, water storage and groundwater with a flow ranging between 2000 and 2700 million m3 per year.
With no clear and updated reports on the state and use of water resources, estimations and projections for water consumption and demand concluded that Lebanon would encounter chronic water shortages due to the poor management of the seasonal water imbalance. The factors promoting this imbalance are (1) minimal water storage capacity; (2) water loss into the sea; (3) increased water demand; and (4) insufficient water networks [1,2,3].
Another environmental stress affecting the Lebanese water environment is its deteriorated quality. This originates from anthropogenic sources and has previously resulted in numerous water-borne disease outbreaks such as cholera, typhoid fever, shigella infection and hepatitis A & E [4]. The water resources are mainly contaminated by untreated sewage from households and industries, agricultural runoff, dumpsite leachate and recreational activities [5].
Few academic studies and reports have assessed the contamination levels in the water, with only microbiological and heavy metals evaluations [6,7,8]. Despite examining the occurrence of several heavy metals in the Lebanese water resources and sediments, including Cu, Cd, Co, Pb, As, Ag and Hg [9,10], platinum has never been assessed.
Platinum (Pt) is a noble, scarce, and precious metal. Consequently, the presence of platinum in soil, water and air is at very low concentrations, often ng L−1. Naturally, platinum occurs in its native form (chemically uncombined) in alluvial deposits and rare ores such as Cooperite, mainly in South Africa, the Soviet Union, and the United States. Anthropogenically, platinum may arise from sources such as chemotherapeutic drugs, catalytic converters or industrial usage, and it is a potential contaminant in water discharges [11,12].
Platinum has been widely used since the 1970s in the mining and automobile industry. The most common oxidation states are II and IV [13]. Gastrointestinal absorption of platinum salts in rats is extremely low (<1% of oral dose) but much higher in humans (42–60%) [14]. The acute toxicity of platinum salts depends on their water solubility and speciation. Pt(II) forms a tetra-coordinate aqua ion [Pt(H2O)4]2+, but PtOH+, Pt(OH)2, or [Pt(OH)5(H2O)] in river water and [PtCl5(OH)]2− in seawater. These have been proposed to be the dominant inorganic species of platinum. A range of Pt(IV) salts has been reported to have rodent oral LD50 (lethal concentration 50) values of 10–1100 mg kg−1. The mean UK human dietary intake was found to be ca. 0.2 µg/day [13], and a human permitted daily exposure (PDE) of 108 μg/day (orally) has been advised [15].
With the discovery of its chemotherapeutic properties, platinum-based drugs have been developed and administered to treat various types of cancer, such as testicular, ovarian and lung cancer [16,17]. The most commonly used drugs, cisplatin, carboplatin and oxaliplatin, are eliminated within 24 h via urine with excretion rates of 28 ± 4%, 77 ± 5% and 36 ± 8%, respectively [18].
Improvements in analytical techniques have facilitated the detection of trace elements in various environmental samples. Nevertheless, the ICP-MS technique is currently the most preferred method for this type of analysis due to its higher sensitivity and selectivity [19], especially for not regularly monitored elements such as thallium and platinum [20,21]. Besides environmental analysis, ICP-MS has been applied in several fields, including clinical, pharmaceutical, food, fertiliser and geological analysis [22,23].
Based on the data gathered from the literature, the table below represents the occurrence of dissolved platinum in the aquatic environment (Table 1).
With the continuous discharge of platinum into the environment from hospital/household wastewater and road runoff, it has become essential to assess the environmental impact of these contaminants on the aquatic biota. A small number of studies have evaluated the effect of the element platinum and the anticancer drug cisplatin. However, these revealed that platinum has an impact on the mobility and survival of Daphnia magna with EC50 (48h) = 110 µg L−1 (half maximal effective concentration) and LC50 (48h) = 157 µg L−1 [37]. Cisplatin has also affected the reproduction of crustaceans by reducing the offspring percentage [38], the number of eggs and the population growth rate [39]. Moreover, it has caused DNA damage at concentrations starting from 300 ng L−1 [40] and modified the activity of several enzymes at 100 ng L−1 [41].
Considering the potential occurrence of platinum-based anticancer drugs in the aquatic environment, even at very low concentrations and the lack of data on the occurrence of platinum in the Lebanese water sources, this research aims to give a comprehensive assessment of multiple sites and sources and offer preliminary findings for future research, with the purpose of highlighting the state of waste management in Lebanon. This will be achieved by determining the level of total platinum in Lebanese rivers, wastewater treatment plants and sewage outfalls by ICP-MS.

2. Materials and Methods

2.1. Chemicals and Instrumentation

Ultrapure water (18.2 MΩ·cm, 0.22 µm filtered) was provided by an Avidity Science (Aylesbury, UK) water purification system. MF-Millipore membrane filters (0.45 µm pore size) were obtained from Merck Millipore (Cork, Ireland). Platinum and Rhenium standard solutions for ICP were purchased from Sigma-Aldrich (Gillingham, UK) in 2% HNO3 and at a concentration of 1000 mg L−1. For metal dissolution and stabilisation, the acid HNO3 (trace analysis grade) was obtained from Fisher Chemical (Loughborough, UK).
The determination and quantification of total platinum were carried out on a 7700 series ICP-MS instrument from Agilent Technologies (Didcot, UK) coupled with an ASX-520 series autosampler. The ICP-MS was controlled by Agilent Masshunter 5.1 software (version D.01.01). The operating parameters of the instrument are presented in Table 2.

2.2. Calibration Standards Preparation:

Stock solutions of platinum and rhenium were prepared at concentrations of 1000 ng mL−1 and 500 ng mL−1 (w/w), respectively, in ultrapure water with 2% HNO3 (v/v%). The calibration curve points ranging from 0.01 to 10 ng mL−1 (w/w) of platinum, including a blank, were made from the stock solution. The internal standard, rhenium, was added to each solution at a fixed and constant concentration, 1 ng mL−1 (w/w). Throughout this manuscript, the concentrations are presented as nominal concentrations.

2.3. Method Optimisation and Validation

For the method optimisation, a single solution of platinum was prepared at a concentration of 2.5 ng mL−1. Different parameters were investigated separately in order to achieve the highest sensitivity for platinum with the lowest background noise. These include He gas flow rate, cell deflect energy, optical bias, energy discrimination, etc.
Moreover, the signal of hafnium was monitored, as this element is expected to have interferences with platinum through the hafnium oxide (HfO+) signals generated in the plasma [19,22]. A pilot study was initially conducted with 3 river samples and 3 wastewater samples to evaluate the presence of hafnium and its potential effect on the platinum signal.
Once optimised, the method was then validated according to the International Council for Harmonization (ICH) guidelines for the following parameters: linearity, limit of detection, limit of quantification, precision and accuracy [42]. The linearity was assessed over the working range of 0.01 to 10 ng mL−1. The limit of detection and quantification was calculated based on the standard deviation of the blank. For precision and accuracy, 3 points covering the working range were selected (QClow = 0.5, QCmedium = 2.5 and QChigh = 7.5 ng mL−1) and evaluated as percent relative standard (%RSD) deviation and recovery percentage, respectively. The recovery percentage of platinum in the samples was also measured by spiking river and wastewater matrices with the QCs concentrations.
Nevertheless, to avoid any instrumental drift, a calibration was run before every sample analysis. In addition, quality control measures were run throughout the analysis (QClow = 0.5 ng mL−1 of platinum) at regular intervals, followed by two instrumental 2% HNO3 washes, to ensure no memory effects related to the QC standard were carried over.

2.4. Sample Collection and Preparation

Grab samples were collected from the 5–10 January 2022 from different rivers and wastewater treatment plants (WWTPs) covering all the Lebanese regions, as illustrated in Figure 1. In total, 22 samples were collected, including 14 from rivers, three from wastewater treatment plants (influent and effluent) and two from sewage outfalls to the sea. Sample bottles were formerly soaked and washed with 5% HNO3 and triple rinsed with the sample water before collection.
Upon reaching the laboratory, samples were filtered through 0.45 µm syringe filters and acidified with HNO3 at a concentration of 2%. The effect of filtration was assessed over three concentrations covering the working range (0.1, 1 and 10 ng mL−1) to determine if the platinum concentration is reduced by the retention on the filter material. All samples were stored in a fridge at 3 °C until analysis. Before analysis, the internal standard, rhenium, was added at a concentration of 1 ng mL−1.

3. Results and Discussion

3.1. Method Development and Validation

The platinum signal was initially monitored in a real-time scan to detect which parameter was enhancing or suppressing the signal of 195Pt. All the parameters were assessed individually and were found to not cause any significant effect, except for the Helium gas flow rate. For this reason, this parameter was examined further by analysing a solution of platinum at variable flow rates (0 to 12 mL min−1). The figure of merit obtained showed that the platinum signal was the highest at “no gas mode” and at 4 mL of He min−1. All the other parameters were operated as default, as shown in Table 3.
The signal of the element hafnium was monitored for both isotopes 178Hf and 179Hf in 6 environmental samples. Hafnium could be detected in the environment from its adoption in autocatalysts with zirconium or from mineral dust particles [43]. Nevertheless, the counts of the interferent were less than five times the counts of platinum measured in the samples, which suggests that the formation rate of hafnium oxide was negligible. Hence, mathematical correction and further analysis of hafnium were not required [24,44].
In the analysis of the environmental samples, it was noticed that under “Helium mode”, the counts of hafnium were reduced by 60% (±6%). Helium is known to be more effective against all polyatomic interferences, including 178Hf and 179Hf [19,43], especially in complex matrices, in addition to reducing the responses of several elements such as Na, K, Ca, Mg, etc., which are expected to be abundant in environmental samples [45]. Thus, “Helium mode” concentrations could represent a more accurate indication of platinum levels in real samples where the levels of interferent ions are variable. For this reason, “Helium mode” was adopted for the validation and sample analysis procedures.
For the filtration procedure, it was experimentally found that platinum at low, medium and high concentrations did not vary by more than ± 9% in filtered and unfiltered standard solutions. Hence, the quantification of total platinum in real samples was performed in filtered samples. The same results were obtained in a study by Vidmar et al., where the variation was not more than ± 5% after filtration with 0.45 µm cellulose nitrate membrane filters [32].
The method was validated when the operating parameters for “Helium mode”, as stated in Table 3, were performing over a period of two days. All the platinum signals were corrected by the response of the internal standard. The calibration curve obtained demonstrated linearity over the working range with a regression coefficient greater than 0.999. The instrumental limit of detection and limit of quantification corresponding to 3.3 × SDblank and 10 × SDblank demonstrated high sensitivity for platinum with values in the range of several ng L−1. The precision was assessed within one day (intraday) and between days (interday), which are equivalent to the method repeatability and intermediate precision, respectively. The precision met the acceptance criteria with a % RSD lower than 5%. Similarly, the accuracy met the acceptance range of 80–120%. The detailed results are presented in Table 4.
Additionally, the coefficient of variation of the QC runs throughout the analysis was consistently lower than 5%, and the instrumental blanks did not show detectable traces of platinum, which validated the results obtained for the environmental samples.

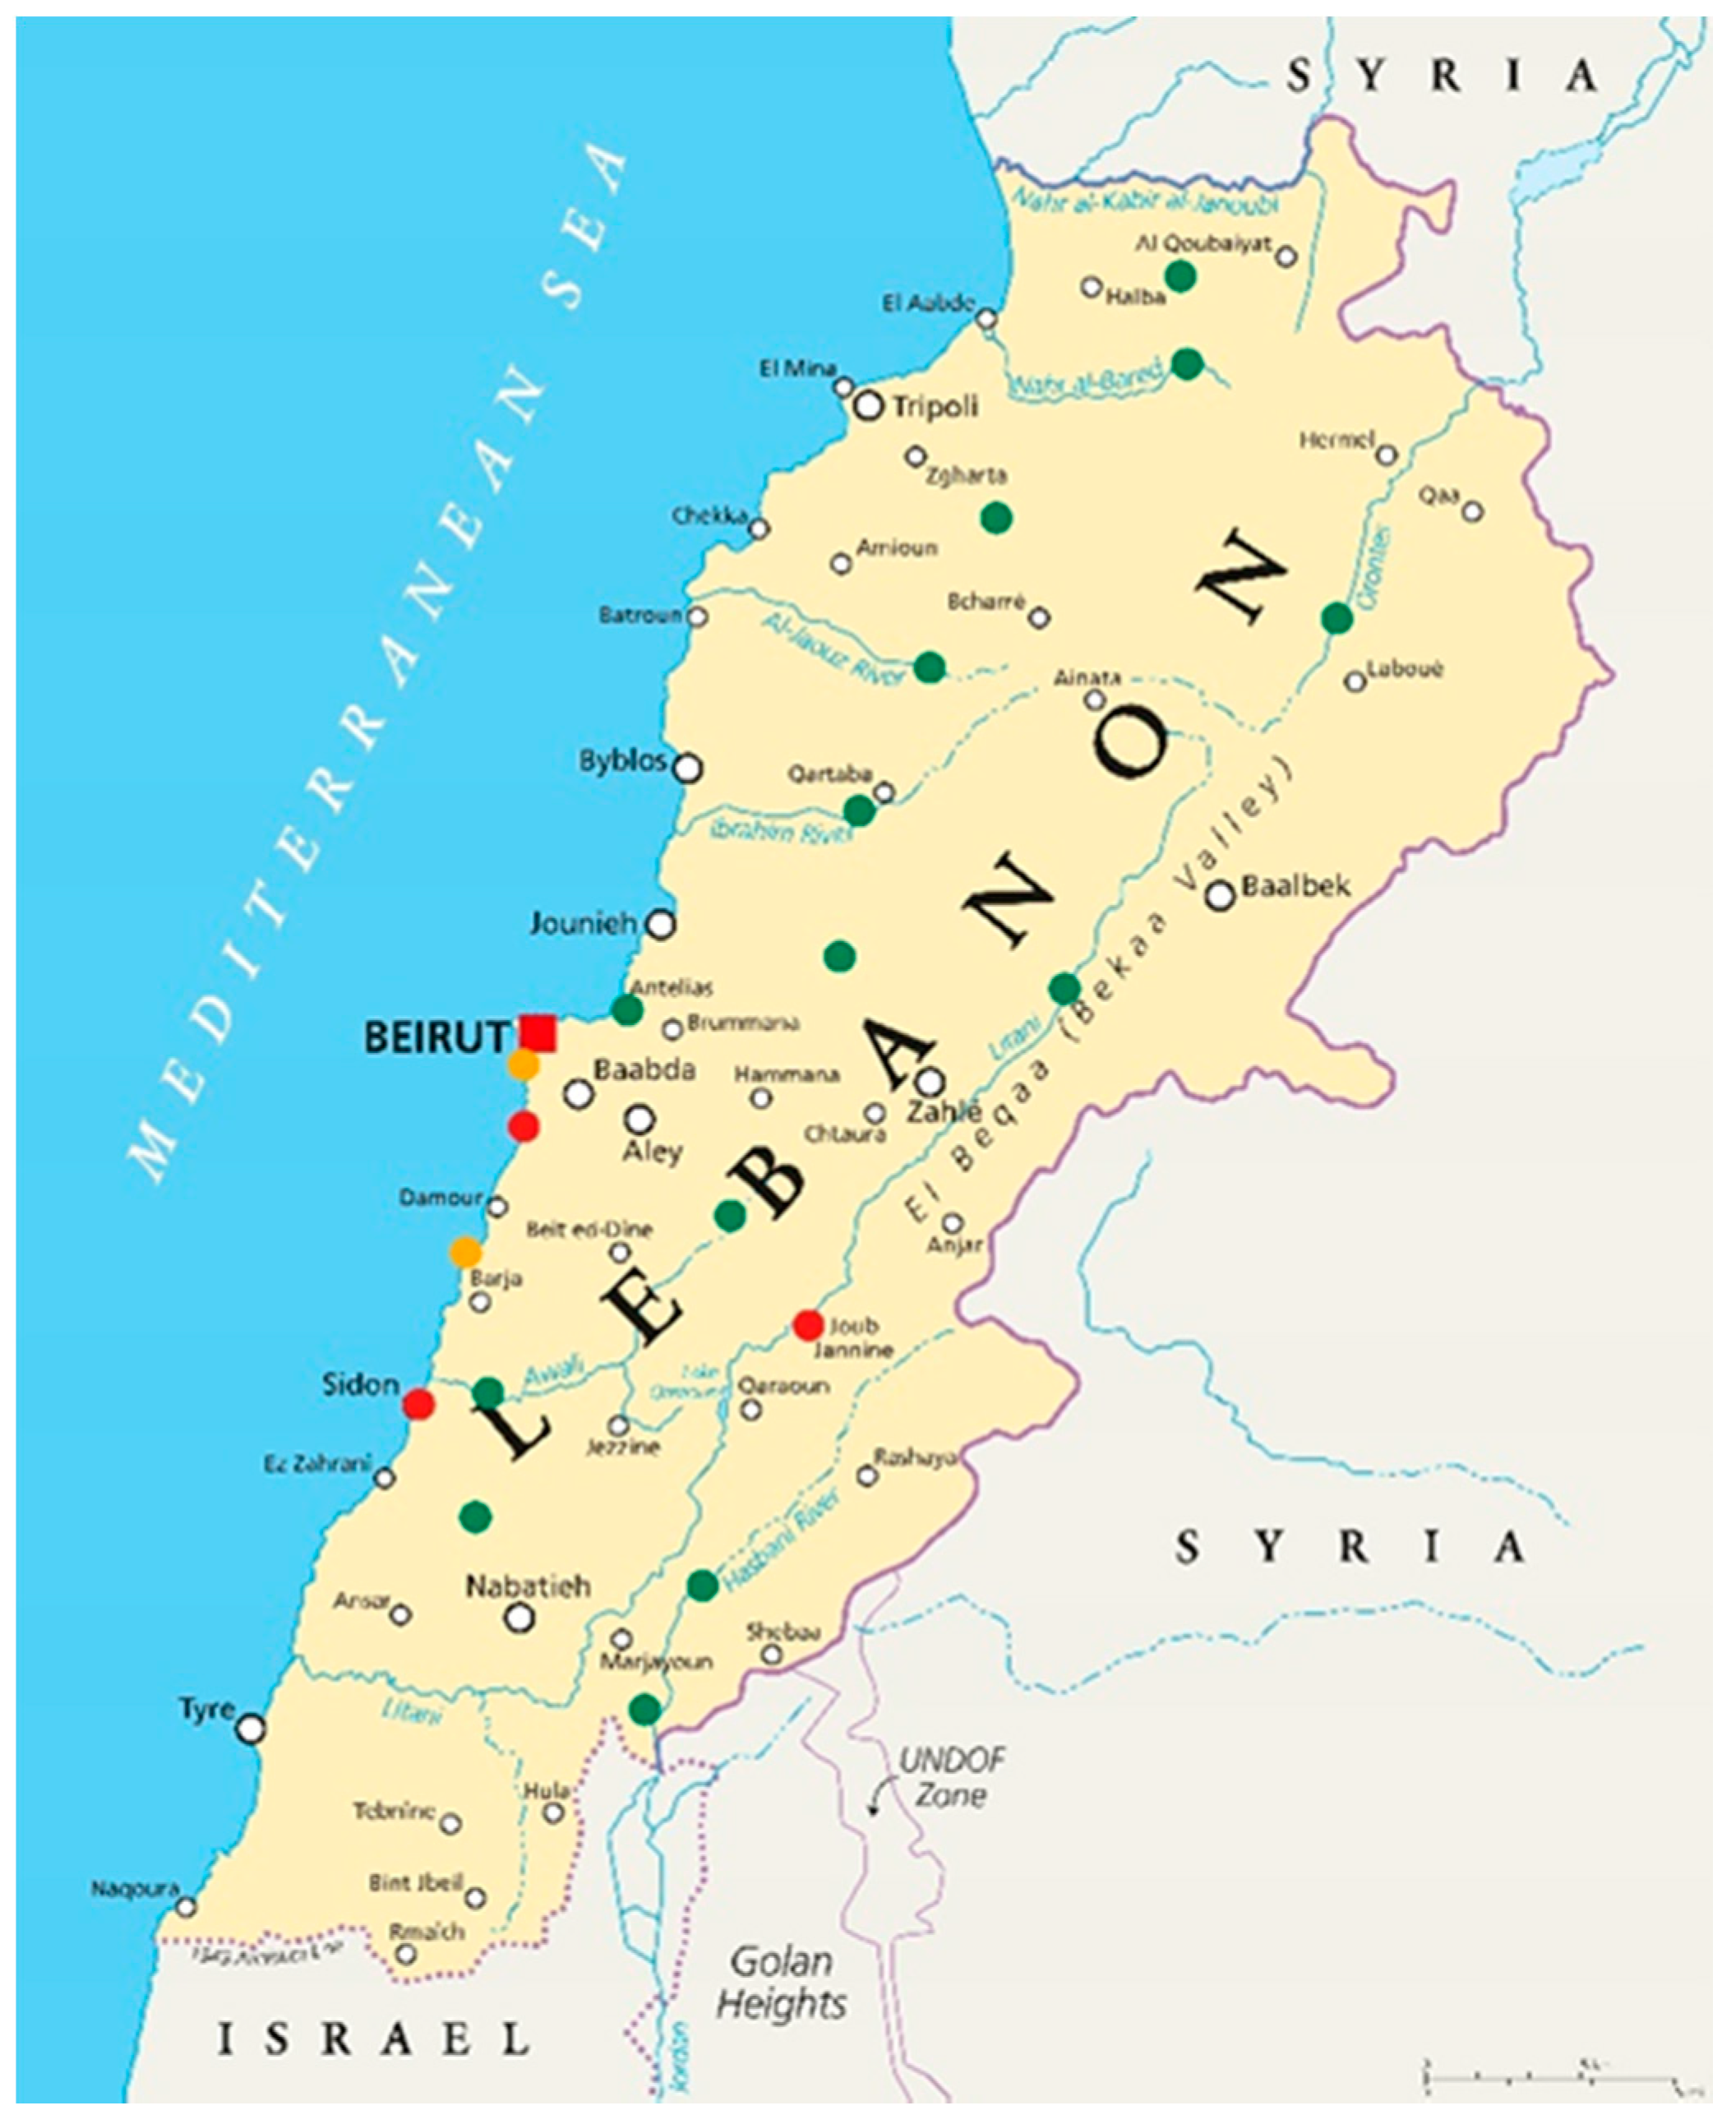
3.2. Application to Lebanese Surface Water and Wastewater Samples

Total platinum concentrations in Lebanese rivers and wastewater samples were all above the instrumental limit of quantification, as shown in Table 5.
During the monitored period, the dissolved platinum concentrations ranged between 22.44 and 53.32 ng L−1. In comparison with previous studies conducted in different countries, the results obtained were at the same level in terms of concentration range, especially for the wastewater samples. For example, total platinum in Slovenian wastewater samples ranged between 12.8 and 27 ng L−1; in Spanish wastewater samples, it ranged between 3.97 and 75.79 ng L−1 [17,32,33]. In France, platinum concentrations ranged between 10 and 20 ng L−1 during working days and 10 ng L−1 during non-working days [35].
Nevertheless, the concentrations detected in wastewater from hospitals and surface water were significantly different from those obtained in this present study. As expected, samples collected directly from hospitals showed higher levels of platinum. In Spain, platinum levels ranged between 81.94 and 13,913 ng L−1 [17,32], reaching 140,000 ng L−1 in the United Kingdom and 266,000 ng L−1 in Austria [18,34,36]. In surface water, the concentrations were much lower, with reported concentrations ranging from 0.004 to 0.164 ng L−1 in Spain and France [25,31] and from 0.037 to 6.867 ng L−1 in Japan [26,27,28,29,30].
From the data collected in this study, it was evident that the concentration of total platinum was of the same order in all the analysed samples. This could be interpreted in three ways: (1) due to the continuous release of untreated or poorly treated waste in surface water, the concentration of platinum has stabilised in the water resources and hence, the concentrations in river samples are similar to the wastewater samples; (2) the detected concentrations could represent the baseline concentration of total platinum in the aquatic environment in Lebanon and/or (3) the platinum could be majorly deposited and accumulated in the sediment/sludge phase.
Since no previous studies have been conducted in Lebanon, the baseline concentration of platinum in the aquatic environment is unknown. Nevertheless, based on reports and previously published studies, the level of platinum estimated in global drinking water was 0.1 ng L−1 [46] and not detected when assessed in tap water samples from France and the UK, respectively [35,36]. Consequently, the measured platinum in this study is presumed to be derived from anthropogenic emissions.
The primary source of platinum contamination is from catalytic converters in motor vehicles. The industrial contribution may come from glassmaking, jewellery production, or dentistry and medicine [16]. In medicine, the increased use of platinum-based anticancer drugs has been recorded, with a 50 to 70% administration rate in cancer treatment regimens [47]. With no guaranteed access to Lebanese hospital wastewater, it was not possible to determine the contribution of hospitals regarding platinum contamination. In a study conducted by Goullé et al., it was determined that the hospital contribution was 9.4% of the total platinum in the environment [35]. This estimation depends on several parameters such as sample collection day (working/non-working days), type of sampling, hospital wastewater flow and amount of platinum administered within a selected hospital [48]. Although these results cannot be compared, it could be assumed that platinum-based drugs contribute to the total amount of platinum discharged in the aquatic environment and that current treatment processes are not efficient for the removal of platinum from these wastewater streams.

4. Conclusions

In the present study, an ICP-MS method was developed, validated and applied for the quantitative determination of platinum in the aquatic environment using an Agilent 7700 ICP-MS. As previously stated, this is the first research to report the concentrations of total platinum in the Lebanese aquatic environment. The concentrations detected in rivers and wastewater samples ranged between 22.44 and 53.32 ng L−1 with no significant differences between the various sampling points, especially between WWTP influents and effluents. This could indicate that the operating treatment plants are not efficiently eliminating these trace concentrations of platinum.
The levels of platinum obtained were estimated to emerge from anthropogenic sources such as catalytic converters in vehicles and drug excretion of cancer patients as medical discharge. The results obtained were in good agreement with similar studies presented for the aquatic environment, including France, Slovenia and Spain.
Despite the inability to specify the source of the platinum detected within this study, its presence in the environment should be a matter of concern. Considering the PDE of 108 µg/day and neglecting other parenteral sources of platinum, humans could be exposed daily from gastrointestinal ingestion alone to approximately 34 ng L−1, which is way below the permissible limit. However, since platinum is commonly used and increasingly in the medical field and with the continuous discharge of untreated sewage into the Lebanese surface water, more attention and further research should be carried out on the potential long-term effect on aquatic biota and human health. Therefore, the development of specific treatments for its reduction and removal should be investigated and implemented.

Author Contributions

Conceptualization, S.N.-G., S.J.B., J.B., Z.Z. and C.N.; methodology, software, validation, and formal analysis, C.N. and Z.Z.; writing—original draft preparation, C.N.; writing—review and editing, S.N.-G., S.J.B., J.B. and Z.Z. All authors have read and agreed to the published version of the manuscript.

Funding

This research did not receive any specific grant from funding agencies in the public, commercial, or not-for-profit sectors.

Institutional Review Board Statement

Not applicable.

Informed Consent Statement

Not applicable.

Data Availability Statement

The data used to support the findings of this study are included within the article.

Conflicts of Interest

The authors declare no conflict of interest.

References

  1. Geara-Matta, D.; Moilleron, R.; El Samarani, A.; Lorgeoux, C.; Chebbo, G. State of Art About Water Uses and Wastewater Management in Lebanon. Leban. Sci. J. 2010, 11, 139–152. [Google Scholar] [CrossRef]
  2. Republic of Lebanon Water Sector: Public Expenditure Review (English); World Bank Group: Washington, DC, USA, 2010; Available online: http://documents.worldbank.org/curated/en/965931468265767738/Republic-of-Lebanon-Water-sector-public-expenditure-review (accessed on 13 July 2022)Public Expenditure review (PER).
  3. World Bank. Lebanon: Country Water Sector Assistance Strategy, 2012–2016. Washington, DC. © World Bank. License: CC BY 3.0 IGO.2012.. Available online: https://openknowledge.worldbank.org/handle/10986/12622 (accessed on 13 July 2022).
  4. Houri, A.; El Jeblawi, S.W. Water Quality Assessment of Lebanese Coastal Rivers during Dry Season and Pollution Load into the Mediterranean Sea. J. Water Health 2007, 5, 615–623. [Google Scholar] [CrossRef] [PubMed]
  5. Nehme, N.; Haydar, C.; Koubaissy, B.; Fakih, M.; Awad, S.; Toufaily, J.; Villieras, F.; Hamieh, T. The Distribution of Heavy Metals in the Lower River Basin, Lebanon. Phys. Procedia 2014, 55, 456–463. [Google Scholar] [CrossRef]
  6. Harakeh, S.; Yassine, H.; El-Fadel, M. Antimicrobial-Resistant Patterns of Escherichia Coli and Salmonella Strains in the Aquatic Lebanese Environments. Environ. Pollut. 2006, 143, 269–277. [Google Scholar] [CrossRef]
  7. Diab, M.; Hamze, M.; Bonnet, R.; Saras, E.; Madec, J.Y.; Haenni, M. Extended-Spectrum Beta-Lactamase (ESBL)- and Carbapenemase-Producing Enterobacteriaceae in Water Sources in Lebanon. Vet. Microbiol. 2018, 217, 97–103. [Google Scholar] [CrossRef]
  8. Daou, C.; Salloum, M.; Legube, B.; Kassouf, A.; Ouaini, N. Characterization of Spatial and Temporal Patterns in Surface Water Quality: A Case Study of Four Major Lebanese Rivers. Environ. Monit. Assess. 2018, 190, 485. [Google Scholar] [CrossRef]
  9. El Houssainy, A.; Abi-Ghanem, C.; Dang, D.H.; Mahfouz, C.; Omanović, D.; Khalaf, G.; Mounier, S.; Garnier, C. Distribution and Diagenesis of Trace Metals in Marine Sediments of a Coastal Mediterranean Area: St Georges Bay (Lebanon). Mar. Pollut. Bull. 2020, 155, 111066. [Google Scholar] [CrossRef]
  10. Korfali, S.I.; Jurdi, M. Chemical Profile of Lebanon’s Potential Contaminated Coastal Water. J. Environ. Sci. Eng. 2012, A, 351–363. [Google Scholar]
  11. Rauch, S.; Morrison, G.M. Environmental Relevance of the Platinum-Group Elements. Elements 2008, 4, 259–263. [Google Scholar] [CrossRef]
  12. Zientek, M.; Loferski, P.; Parks, H.; Schulte, R.; Seal, R.I. Critical mineral resources of the United States—Economic and environmental geology and prospects for future supply. In Platinum-Group Elements; Professional Paper 1802-K; U.S. Geological Survey: Reston, VA, USA, 2017; Volume 1, pp. N1–N92. [Google Scholar] [CrossRef]
  13. Ysart, G.; Miller, P.; Crews, H.; Robb, P.; Baxter, M.; De L’Argy, C.; Lofthouse, S.; Sargent, C.; Harrison, N. Dietary Exposure Estimates of 30 Elements from the UK. Total Diet Study. Food Addit. Contam. 1999, 16, 391–403. [Google Scholar] [CrossRef]
  14. U.S. EPA. IRIS Toxicological Review Of Halogenated Platinum Salts And Platinum Compounds (External Review Draft); EPA/635/R-08/018; U.S. Environmental Protection Agency: Washington, DC, USA, 2009.
  15. ICH. ICH Harmonised Guideline, Guideline for Elemental Impurities Q3D (R1); European Medicines Agency: Amsterdam, The Netherlands, 2019.
  16. Fortin, C.; Wang, F.; Pitre, D. Critical Review of Platinum Group Elements (Pd, Pt, Rh) in Aquatic Ecosystems; Research Report No R-1269; Science and Technology Branch Environment Canada: Burlington, ON, Canasa, 2011.
  17. Santana-Viera, S.; Padrón, M.E.T.; Sosa-Ferrera, Z.; Santana-Rodríguez, J.J. Quantification of Cytostatic Platinum Compounds in Wastewater by Inductively Coupled Plasma Mass Spectrometry after Ion Exchange Extraction. Microchem. J. 2020, 157, 104862. [Google Scholar] [CrossRef]
  18. Lenz, K.; Hann, S.; Koellensperger, G.; Stefanka, Z.; Stingeder, G.; Weissenbacher, N.; Mahnik, S.N.; Fuerhacker, M. Presence of Cancerostatic Platinum Compounds in Hospital Wastewater and Possible Elimination by Adsorption to Activated Sludge. Sci. Total Environ. 2005, 345, 141–152. [Google Scholar] [CrossRef] [PubMed]
  19. Balcerzak, M. Methods of Elimination of Hafnium Interference in the Determination of Platinum in Environmental Samples by ICP-MS Technique. Chem. Analityczna 2009, 54, 135–149. [Google Scholar]
  20. Yin, M.; Zhou, Y.; Tsang, D.C.W.; Beiyuan, J.; Song, L.; She, J.; Wang, J.; Zhu, L.; Fang, F.; Wang, L.; et al. Emergent Thallium Exposure from Uranium Mill Tailings. J. Hazard. Mater. 2021, 407, 124402. [Google Scholar] [CrossRef] [PubMed]
  21. Liu, J.; Zhou, Y.; She, J.; Tsang, D.C.W.; Lippold, H.; Wang, J.; Jiang, Y.; Wei, X.; Yuan, W.; Luo, X.; et al. Quantitative Isotopic Fingerprinting of Thallium Associated with Potentially Toxic Elements (PTEs) in Fluvial Sediment Cores with Multiple Anthropogenic Sources. Environ. Pollut. 2020, 266, 115252. [Google Scholar] [CrossRef]
  22. Machado, R.C.; Amaral, C.D.B.; Schiavo, D.; Nóbrega, J.A.; Nogueira, A.R.A. Complex Samples and Spectral Interferences in ICP-MS: Evaluation of Tandem Mass Spectrometry for Interference-Free Determination of Cadmium, Tin and Platinum Group Elements. Microchem. J. 2017, 130, 271–275. [Google Scholar] [CrossRef]
  23. Al-Hakkani, M.F. Guideline of Inductively Coupled Plasma Mass Spectrometry “ICP–MS”: Fundamentals, Practices, Determination of the Limits, Quality Control, and Method Validation Parameters. SN Appl. Sci. 2019, 1, 1–15. [Google Scholar] [CrossRef]
  24. Soyol-Erdene, T.O.; Huh, Y. Dissolved Platinum in Major Rivers of East Asia: Implications for the Oceanic Budget. Geochem. Geophys. Geosystems 2012, 13, 1–13. [Google Scholar] [CrossRef]
  25. Cobelo-García, A.; López-Sánchez, D.E.; Schäfer, J.; Petit, J.C.J.; Blanc, G.; Turner, A. Behavior and Fluxes of Pt in the Macrotidal Gironde Estuary (SW France). Mar. Chem. 2014, 167, 93–101. [Google Scholar] [CrossRef]
  26. Obata, H.; Yoshida, T.; Ogawa, H. Determination of Picomolar Levels of Platinum in Estuarine Waters: A Comparison of Cathodic Stripping Voltammetry and Isotope Dilution-Inductively Coupled Plasma Mass Spectrometry. Anal. Chim. Acta 2006, 580, 32–38. [Google Scholar] [CrossRef]
  27. Mashio, A.S.; Tanimura, T.; Hasegawa, H.; Takeda, S.; Obata, H. Budgets and Sources of Dissolved Platinum in the Inland Seas of Japan. Estuar. Coast. Shelf Sci. 2021, 253, 107293. [Google Scholar] [CrossRef]
  28. Suzuki, A.; Obata, H.; Okubo, A.; Gamo, T. Precise Determination of Dissolved Platinum in Seawater of the Japan Sea, Sea of Okhotsk and Western North Pacific Ocean. Mar. Chem. 2014, 166, 114–121. [Google Scholar] [CrossRef]
  29. Suzuki Mashio, A.; Obata, H.; Shimazaki, T.; Fukuda, H.; Ogawa, H. Spatiotemporal Variations of Platinum in Seawater in Otsuchi Bay, Japan after the 2011 Tsunami. Sci. Total Environ. 2020, 708, 134659. [Google Scholar] [CrossRef]
  30. Mashio, A.S.; Obata, H.; Gamo, T. Dissolved Platinum Concentrations in Coastal Seawater: Boso to Sanriku Areas, Japan. Arch. Environ. Contam. Toxicol. 2017, 73, 240–246. [Google Scholar] [CrossRef] [PubMed]
  31. Cobelo-García, A.; López-Sánchez, D.E.; Almécija, C.; Santos-Echeandía, J. Behavior of Platinum during Estuarine Mixing (Pontevedra Ria, NW Iberian Peninsula). Mar. Chem. 2013, 150, 11–18. [Google Scholar] [CrossRef]
  32. Vidmar, J.; Martinčič, A.; Milačič, R.; Ščančar, J. Speciation of Cisplatin in Environmental Water Samples by Hydrophilic Interaction Liquid Chromatography Coupled to Inductively Coupled Plasma Mass Spectrometry. Talanta 2015, 138, 1–7. [Google Scholar] [CrossRef] [PubMed]
  33. Isidori, M.; Lavorgna, M.; Russo, C.; Kundi, M.; Žegura, B.; Novak, M.; Filipič, M.; Mišïk, M.; Knasmueller, S.; de Alda, M.L.; et al. Chemical and Toxicological Characterisation of Anticancer Drugs in Hospital and Municipal Wastewaters from Slovenia and Spain. Environ. Pollut. 2016, 219, 275–287. [Google Scholar] [CrossRef]
  34. Lenz, K.; Mahnik, S.N.; Weissenbacher, N.; Mader, R.M.; Krenn, P.; Hann, S.; Koellensperger, G.; Uhl, M.; Knasmüller, S.; Ferk, F.; et al. Monitoring, Removal and Risk Assessment of Cytostatic Drugs in Hospital Wastewater. Water Sci. Technol. 2007, 56, 141–149. [Google Scholar] [CrossRef]
  35. Goullé, J.P.; Saussereau, E.; Mahieu, L.; Cellier, D.; Spiroux, J.; Guerbet, M. Importance of Anthropogenic Metals in Hospital and Urban Wastewater: Its Significance for the Environment. Bull. Environ. Contam. Toxicol. 2012, 89, 1220–1224. [Google Scholar] [CrossRef]
  36. Vyas, N.; Turner, A.; Sewell, G. Platinum-Based Anticancer Drugs in Waste Waters of a Major UK Hospital and Predicted Concentrations in Recipient Surface Waters. Sci. Total Environ. 2014, 493, 324–329. [Google Scholar] [CrossRef]
  37. Zimmermann, S.; Wolff, C.; Sures, B. Toxicity of Platinum, Palladium and Rhodium to Daphnia Magna in Single and Binary Metal Exposure Experiments. Environ. Pollut. 2017, 224, 368–376. [Google Scholar] [CrossRef] [PubMed]
  38. Parrella, A.; Kundi, M.; Lavorgna, M.; Criscuolo, E.; Russo, C.; Isidori, M. Toxicity of Exposure to Binary Mixtures of Four Anti-Neoplastic Drugs in Daphnia Magna and Ceriodaphnia Dubia. Aquat. Toxicol. 2014, 157, 41–46. [Google Scholar] [CrossRef] [PubMed]
  39. Grzesiuk, M.; Bednarska, A.; Mielecki, D.; Garbicz, D.; Marcinkowski, M.; Pilžys, T.; Malinowska, A.; Świderska, B.; Grzesiuk, E. Anticancer Agents Found in Environment Affect Daphnia at Population, Individual and Molecular Levels. Aquat. Toxicol. 2019, 215, 105288. [Google Scholar] [CrossRef] [PubMed]
  40. Parrella, A.; Lavorgna, M.; Criscuolo, E.; Russo, C.; Isidori, M. Eco-Genotoxicity of Six Anticancer Drugs Using Comet Assay in Daphnids. J. Hazard. Mater. 2015, 286, 573–580. [Google Scholar] [CrossRef] [PubMed]
  41. Fonseca, T.G.; Morais, M.B.; Rocha, T.; Abessa, D.M.S.; Aureliano, M.; Bebianno, M.J. Ecotoxicological Assessment of the Anticancer Drug Cisplatin in the Polychaete Nereis Diversicolor. Sci. Total Environ. 2017, 575, 162–172. [Google Scholar] [CrossRef]
  42. ICH Harmonised Triopartite Guideline. Validation of Analytical Procedures: Text and Methodology Q2(R1). Available online: https://database.ich.org/sites/default/files/Q2%28R1%29Guideline.pdf (accessed on 13 July 2022).
  43. Suoranta, T.; Bokhari, S.N.H.; Meisel, T.; Niemelä, M.; Perämäki, P. Elimination of Interferences in the Determination of Palladium, Platinum and Rhodium Mass Fractions in Moss Samples Using ICP-MS/MS. Geostand. Geoanalytical Res. 2016, 40, 559–569. [Google Scholar] [CrossRef]
  44. Zhang, T.; Cai, S.; Forrest, W.C.; Mohr, E.; Yang, Q.; Forrest, M.L. Development and Validation of an Inductively Coupled Plasma Mass Spectrometry (ICP-MS) Method for Quantitative Analysis of Platinum in Plasma, Urine, and Tissues. Appl. Spectrosc. 2016, 70, 1529–1536. [Google Scholar] [CrossRef]
  45. Yamanaka, K.; Wilbur, S. Investigations into the Use of Helium Collision Mode and Aerosol Dilution for Ultra-Trace Analysis of Metals in Mineral Reference Materials; Agilent Technologies: Santa Clara, CA, USA, 2013; Available online: https://www.agilent.com/cs/library/whitepaper/public/5991-2811EN.pdf (accessed on 13 July 2022).
  46. World Health Organization. Air Quality Guidelines for Europe, Copenhagen: World Health Organization, Regional Office for Europe; World Health Organization: Geneva, Switzerland, 2000. [Google Scholar]
  47. Hannon, M.J. Metal-Based Anticancer Drugs: From a Past Anchored in Platinum Chemistry to a Post-Genomic Future of Diverse Chemistry and Biology. Pure Appl. Chem. 2007, 79, 2243–2261. [Google Scholar] [CrossRef]
  48. Kümmerer, K.; Helmers, E.; Hubner, P.; Mascart, G.; Milandri, M.; Reinthaler, F.; Zwakenberg, M. European Hospitals as a Source for Platinum in the Environment in Comparison with Other Sources. Sci. Total Environ. 1999, 225, 155–165. [Google Scholar] [CrossRef]
Figure 1. Map of Lebanon with the sample collection sites (green: rivers; red: WWTPs; orange: sewage outfalls).
Water 14 02631 g001
Table 1. Previously reported d-Pt concentrations in environmental and wastewater samples.
Sample SourceDissolved Pt (ng L−1)Ref.
East Asia—Rivers0.035–0.123[24]
France—Gironde estuary0.068–0.164[25]
Japan—Estuary0.936–6.867[26]
Japan—Seawater0.080–1.990[27]
Japan—Seawater0.037–0.049[28]
Japan—Seawater0.078–0.388[29]
Japan—Seawater0.039–0.293[30]
Spain—Estuary0.004–0.121[31]
Spain—Wastewater influent3.95–38.68[17]
Spain—Wastewater effluent56.08–75.79
Spain—Hospital wastewater81.94–13,913
Spain—Hospital wastewater144[32]
Spain—Wastewater treatment plant influent7.9
Spain—Wastewater treatment plant effluent5.9
Slovenia—Hospital wastewater352[32]
Slovenia—Wastewater treatment plant influent23.3
Slovenia—Wastewater treatment plant effluent12.8
Slovenia—Hospital wastewater226–352[33]
Slovenia—Wastewater treatment plant influent23–27
Austria—Hospital wastewater4700–145,000[18]
Austria—Hospital wastewater influent from in-patient ward3240–266,000[34]
Austria—Hospital wastewater effluent1770–144,000
France—Hospital wastewater80–610[35]
France—Wastewater influent10–20
France—Wastewater effluent10
UK—Hospital wastewater20–140,000[36]
UK—Main drain30–100,000
Table 2. Operating parameters of the ICP-MS.
ParameterType/Value
NebuliserMicroMist glass concentric
Spray chamberScott
Nebulizer gas flow1.02 L min−1
Auxiliary gas flow0.9 L min−1
Plasma gas flow15 L min−1
Omega lens voltage11.6 V
ICP RF power1550 W
Isotopes measured195Pt, 185Re
Gas modeNo gas, He: 4 mL min−1
Scan modePeak hopping
Dwell time per isotope0.1 s
Replicates5
Sweeps100 sweeps/replicate
Table 3. ICP-MS operating parameters for the detection of platinum.
ParameterNo Gas ModeHelium Mode
PlasmaPlasma modeLow matrix
LensesExtract 10 V
Extract 2−200 V
Omega bias−90 V
Omega lens10.8 V
Cell entrance−30 V−40 V
Cell exit−50 V−60 V
Deflect14.4 V1.2 V
Plate bias−40 V−55 V
CellHe flow0 mL min−14 mL min−1
OctP bias−8 V−18 V
OctR RF180 V
Energy discrimination5 V3 V
Table 4. Validation parameters of the ICP-MS method.
ParametersValue
Range (ng L−1)10–10,000
Regression coefficient (R2)1
Regression equationy = 0.5022x + 0.001
Accuracy (%)(±SD)99.13 (± 4.35)
Interday precision (%)(±SD)0.54 (± 0.24)
Intraday precision (%)(±SD)2.08 (± 0.91)
LOD (ng L−1)0.56
LOQ (ng L−1)2.35
% Recovery in spiked river and wastewater samples (n = 6)(±SD)106.39 (±6.92)
Table 5. Concentrations of total platinum in Lebanese water samples in ng L−1 (±SD of the concentrations measured).
Sample LocationGeographic CoordinatesTotal Dissolved Platinum Concentration (ng L−1) (±SD)
Antelias RiverLat 33.914801 Long 35.59412738.42 ± 2.88
Al Kalb RiverLat 33.95461 Long 35.6011237.88 ± 4.21
Zahrani RiverLat 33.49531 Long 35.33479537.36 ± 3.15
Hasbani RiverLat 33.40703 Long 35.6673232.61 ± 3.11
Litani RiverLat 33.338889 Long 35.24527834.45 ± 0.94
Wazzani RiverLat 33.274254 Long 35.61813734.59 ± 2.32
Awali RiverLat 33.5888 Long 35.38639.93 ± 3.88
Damour RiverLat 33.705833 Long 35.43944431.63 ± 2.04
Orontes RiverLat 36.045278 Long 35.96361131.04 ± 4.79
Al Bared RiverLat 34.51241 Long 35.9545233.34 ± 2.15
Ibrahim RiverLat 34.062222 Long 35.64222228.74 ± 2.21
Al Jawz RiverLat 34.273804 Long 35.69007230.62 ± 2.70
Ostouene RiverLat 34.58189 Long 36.1062636.38 ± 2.88
Abou Ali RiverLat 34.4579 Long 35.841539.41 ± 2.14
WWTP Joub Jannine InfluentLat 33.637569 Long 35.77651424.91 ± 1.77
WWTP Joub Jannine EffluentLat 33.637569 Long 35.77651427.21 ± 2.20
WWTP Al Ghadir InfluentLat 33.81311 Long 35.4834025.35 ± 2.29
WWTP Al Ghadir EffluentLat 33.81311 Long 35.4834031.79 ± 5.97
WWTP Saida InfluentLat 33.64271 Long 35.3998324.76 ± 1.36
WWTP Saida EffluentLat 33.64271 Long 35.3998322.44 ± 2.19
Ramlet al. Baida OutfallLat 33.895944 Long 35.46791724.57 ± 2.88
Jiyeh OutfallLat 33.661225 Long 35.41734353.32 ± 1.64
Publisher’s Note: MDPI stays neutral with regard to jurisdictional claims in published maps and institutional affiliations.

