Article

A Quantitative Evaluation Method for Xanthan Enhanced Transport Uniformity and Factors Affecting This Process

Key Laboratory for Water and Sediment Sciences of the Ministry of Education, School of Environment, Beijing Normal University, Beijing 100875, China
*
Author to whom correspondence should be addressed.
Water 2022, 14(17), 2630; https://doi.org/10.3390/w14172630
Submission received: 14 July 2022 / Revised: 24 August 2022 / Accepted: 24 August 2022 / Published: 26 August 2022
(This article belongs to the Special Issue Fate and Transport of Pollutants in Soil and Groundwater)

Abstract

:
Strengthening the transmission uniformity of remedial amendments in heterogeneous porous media is important for improving in situ groundwater remediation efficiency. This study developed a characterization method to represent the improvement of transmission uniformity in heterogeneous media using the degree of difference in hydraulic conductivity of porous media between xanthan solution and pure water, which was defined as the transmission uniformity control coefficient U. Research results showed that U of medium sand/fine sand (2.44) was the most ideal among the three medium combinations tested when the concentration of xanthan solution was 100 mg/L. Then, factors that may influence U were analyzed, and the obtained results showed that xanthan’s control ability is affected by permeability contrast (media combinations) and polymer concentration. Generally, when concentrations were in the range of 100~800 mg/L, Umf > Ucf > Ucm. Finally, the actual degree of polymer propulsion under different concentrations and media combinations was analyzed, and the obtained results showed that as different media were varied in permeability change degree, while the migration speed presented an overall decrease as the concentration increased, where the maximum migration front in the low-permeability zone (LPZ) was more obvious than that in the high permeability zone (HPZ). This was consistent with the results characterized by U.

1. Introduction

In situ chemical oxidation (ISCO) is a common technique for groundwater pollution remediation, and many cases have demonstrated its potential [1]. However, formal research suggests that preferential flow paths and irregular plumes exist in heterogeneous media [2], and because the injected amendment shows preferential flow through the highly permeable area in underground heterogeneous media, it leads to uneven coverage in low-permeability areas [3,4,5]. Therefore, the key to this technique is to improve the sweep efficiency and transmission uniformity of oxidant in the target processing zone in heterogeneous media [6,7,8,9]. Previous studies have shown that adding polymers is beneficial to improving the sweep efficiency of amendment and increasing its chance to contact pollutants, thus improving the efficiency of pollutant removal [10,11,12].
Xanthan gum is a polysaccharide water-soluble biopolymer produced by Xanthomonas with unique rheological properties of shear thinning; even at very low concentrations, it maintains high viscosity [13], and its apparent viscosity increases with increasing concentration. A previous study showed that adding xanthan gum to amendments led to the sweep efficiency as high as 90% in the media [14].
Currently, most studies focus on polymers for improving the sweep efficiency of amendments in heterogeneous aquifers. The results of in situ chemical oxidation (PA-ISCO) field experiments using polymers verified the application effect of PA-ISCO in heterogeneous aquifers. Compared with permanganate solution injection, the sweep efficiency was increased to 100% [15]. In addition, through the two-dimensional saturated flow tank experiment, both the enhanced pollutant removal effect and repair effect by adding shear thinning fluid in heterogeneous media remediation were discussed [16]. In general, the addition of polymer increases the viscosity of the amendment and decreases the velocity in the high-permeability region. However, a higher shear rate in the low-permeability region causes a lower viscosity, which is conducive to the uniform transmission of amendments in heterogeneous media. Meanwhile, the permeability of media is reduced due to the mechanical filtration and adsorption of the polymer [17]. However, few studies have focused on the characterization of transmission uniformity, especially on the influence pattern of polymers on the permeability of porous media [11], and an intuitive way of reflecting amendments’ transport uniformity in heterogeneous media is needed. In addition, exploration of the quantitative transmission mechanism of polymer/oxidant mixed amendments in heterogeneous environments has an important guiding significance to practical applications, as it can help select the appropriate concentration and proportion of polymer to achieve the scheme with the most uniform transmission and the highest removal efficiency at a lower cost according to the specific geological conditions of the polluted area.
This study, using artificial simulation of flow in heterogeneous media with a two-dimensional tank experiment, seeks a characterization method for indicating the enhancement degree of transmission uniformity in heterogeneous media. In addition, permeability change patterns are studied while injecting xanthan gum solution in porous media based on the principle of Darcy’s law of seepages to explain why concentration and permeability contrast influence the process that enhances transmission uniformity. Therefore, the reliability of the characterization method is verified. Finally, the transmission law and influencing factors of polymer solutions in heterogeneous media are investigated. The rules for adding polymer to improve the removal efficiency of pollutants in the LPZ are explored, the obtained results provide a theoretical basis for dynamic control in the process of practical application and a quantitative angle for further study on improving the transmission uniformity of amendments in heterogeneous aquifers.

2. Materials and Methods

2.1. Preparation of Xanthan Gum Solution

Xanthan powder (4 g) was weighed in a beaker, and an appropriate amount of water was added. The mixture was stirred with a blender for approximately 4 h and then transferred into a 2 L volumetric flask. Then, a 2 g/L stock solution was prepared overnight to ensure full dissolution and hydration. The stock solution was diluted to the target concentration and allowed to stand for 6 h before use to ensure that the polymer molecules were fully dispersed, and that the system was uniform.
When the solution passes through, it must be subjected to a certain shear force; thus, the study of rheological properties is important for practical applications. Therefore, it is necessary to evaluate the rheological properties of polymer solutions. Table 1 shows that, generally, the higher the concentration of xanthan gum solution is, the greater the viscosity is.
In the measured concentration range, xanthan solution showed shear dilution behavior. With increasing shear rate, the viscosity decreases, and the shear stress increases. Therefore, xanthan gum solution is a non-Newtonian fluid, which reflects the characteristics of the pseudoplastic fluid yield. This is also illustrated by the fitting results of the rheological curves (Table 2). With the increase in the concentration of the xanthan gum solution, the consistency coefficient Kc gradually increases, while the rheological behavior coefficient n gradually decreases, and the internal structure of the liquid becomes weaker. With the increase in the shear flow rate, the resistance formed by the combination of internal molecules decreases due to structural damage.

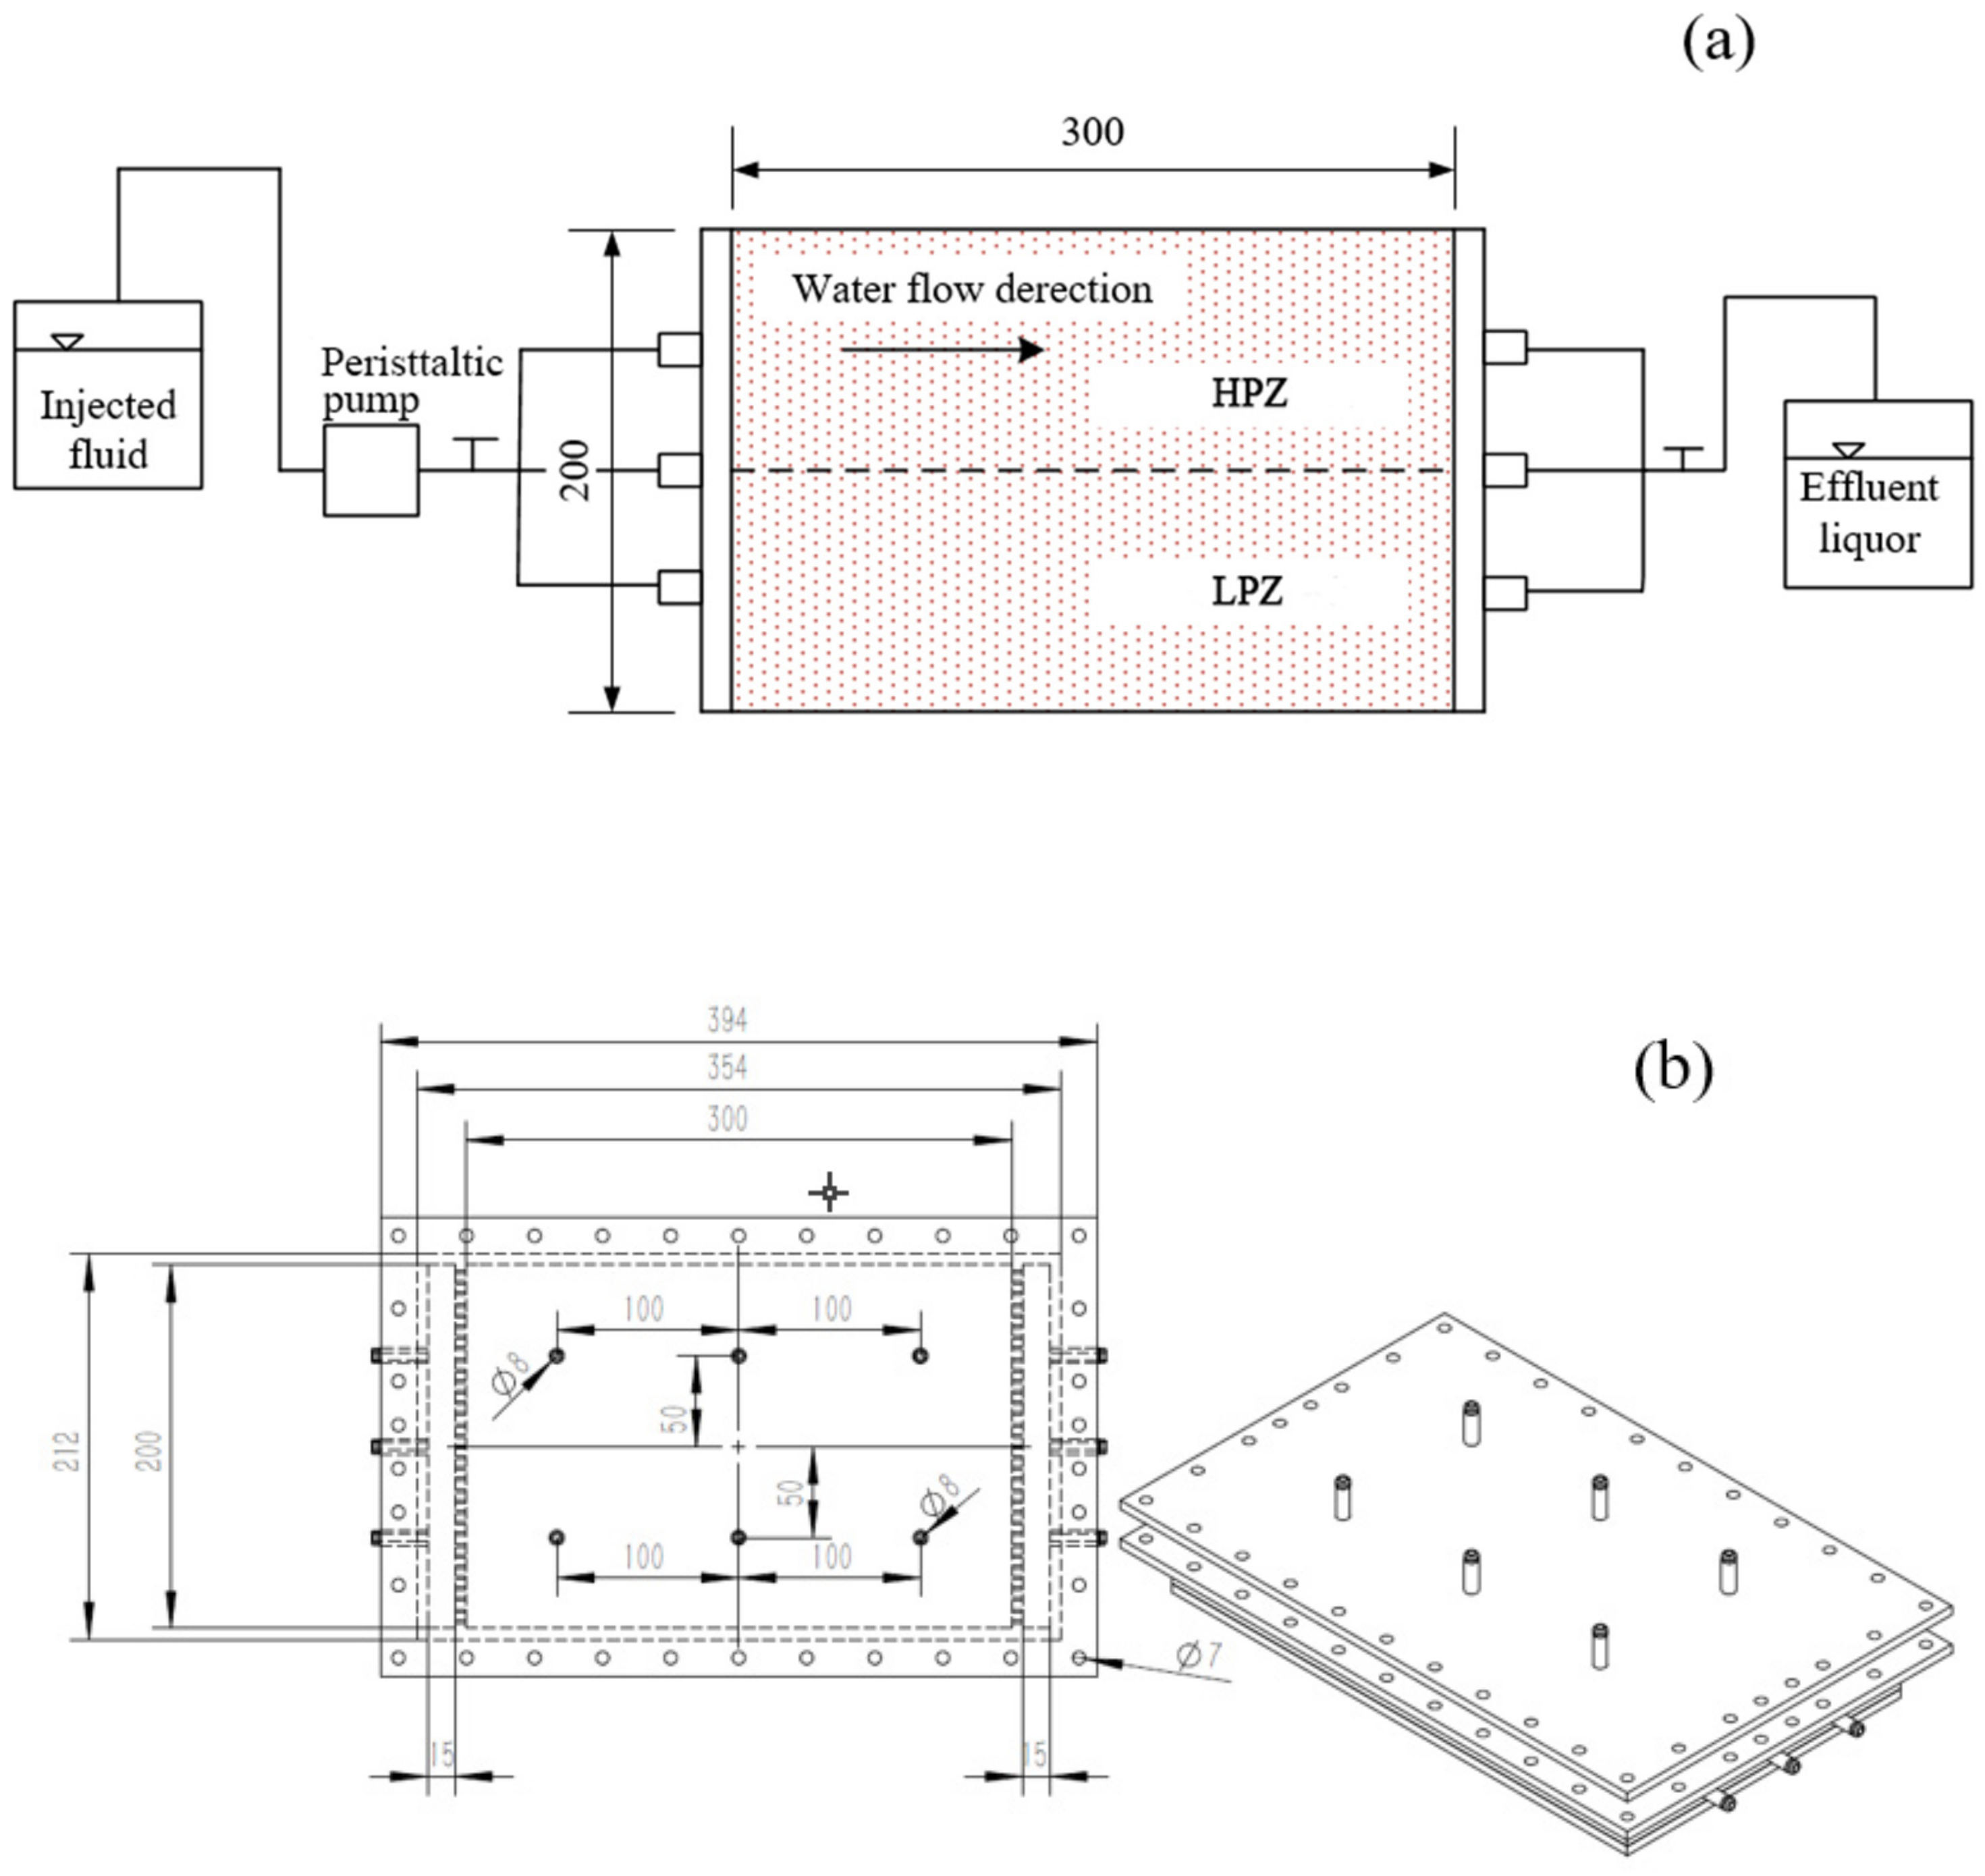
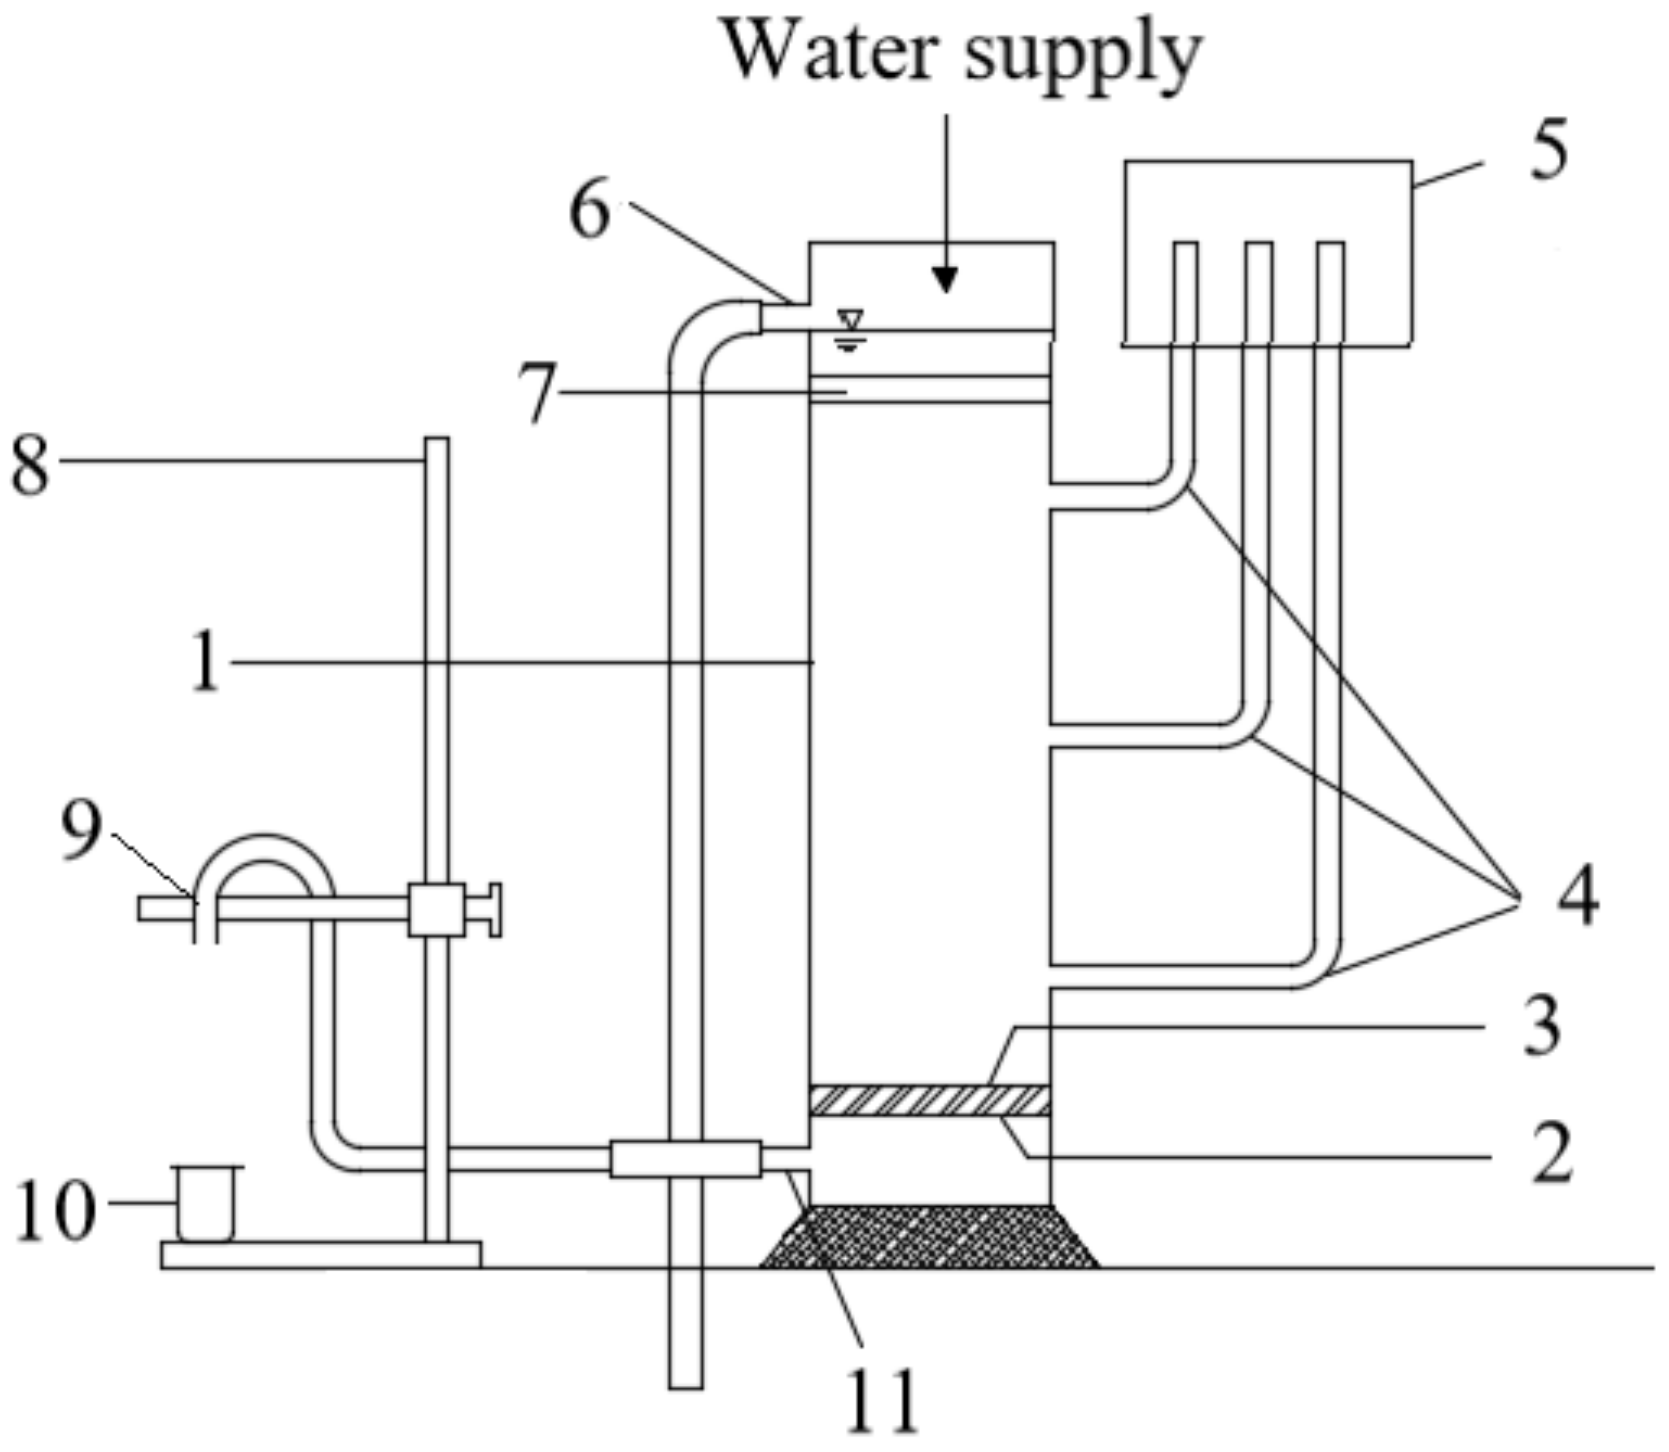
2.2. Experimental Equipment and Process

2.2.1. One-Dimensional Column Experiment

The instrument used in the experiment was a TST-70 permeameter, a column-like device with an inner diameter of 100 mm, a height of 400 mm and a piezometer distance of 100 ± 0.44 mm. A schematic diagram of the experimental device is shown in Figure 1. The quartz sand used in the experiment was 0.841~2 mm coarse sand, 0.42~0.841 mm medium sand and 0.25~0.42 mm fine sand. The water/xanthan gum solution was injected from bottom to top through an outlet hole. The height of the sample loaded in the cylinder (the height from the copper wire mesh to the top of the cylinder minus the height from the surface of the sample to the top of the cylinder) was 26.5 cm. During the water head measurement, water/xanthan gum solution was injected from the top of the instrument into the water surface and flooded to the level of the overflow hole. At this time, the water level in the pressure measuring tube was stable, and the water head could be measured.
The hydraulic conductivities for different concentrations and sand combinations were measured. The calculation formula based on Darcy’s law is as follows:
K = Q × 2 L A Δ h
where K is the hydraulic conductivity of each medium (cm/s), Q is the seepage flow quantity per unit time (cm3/s), L is the length of the sand column between two pressure measurement holes (cm, L = 10 cm), A is the cross-sectional area of the sand column (cm2: A = 78.5 cm2), and Δh is the water head difference between the upper and lower piezometers (cm).
The physical properties of various media used in the experiment are shown in Table 3a, where porosity is measured by the water injection method, hydraulic conductivity for each media under pure water had been measured and displaced in Table 3b:

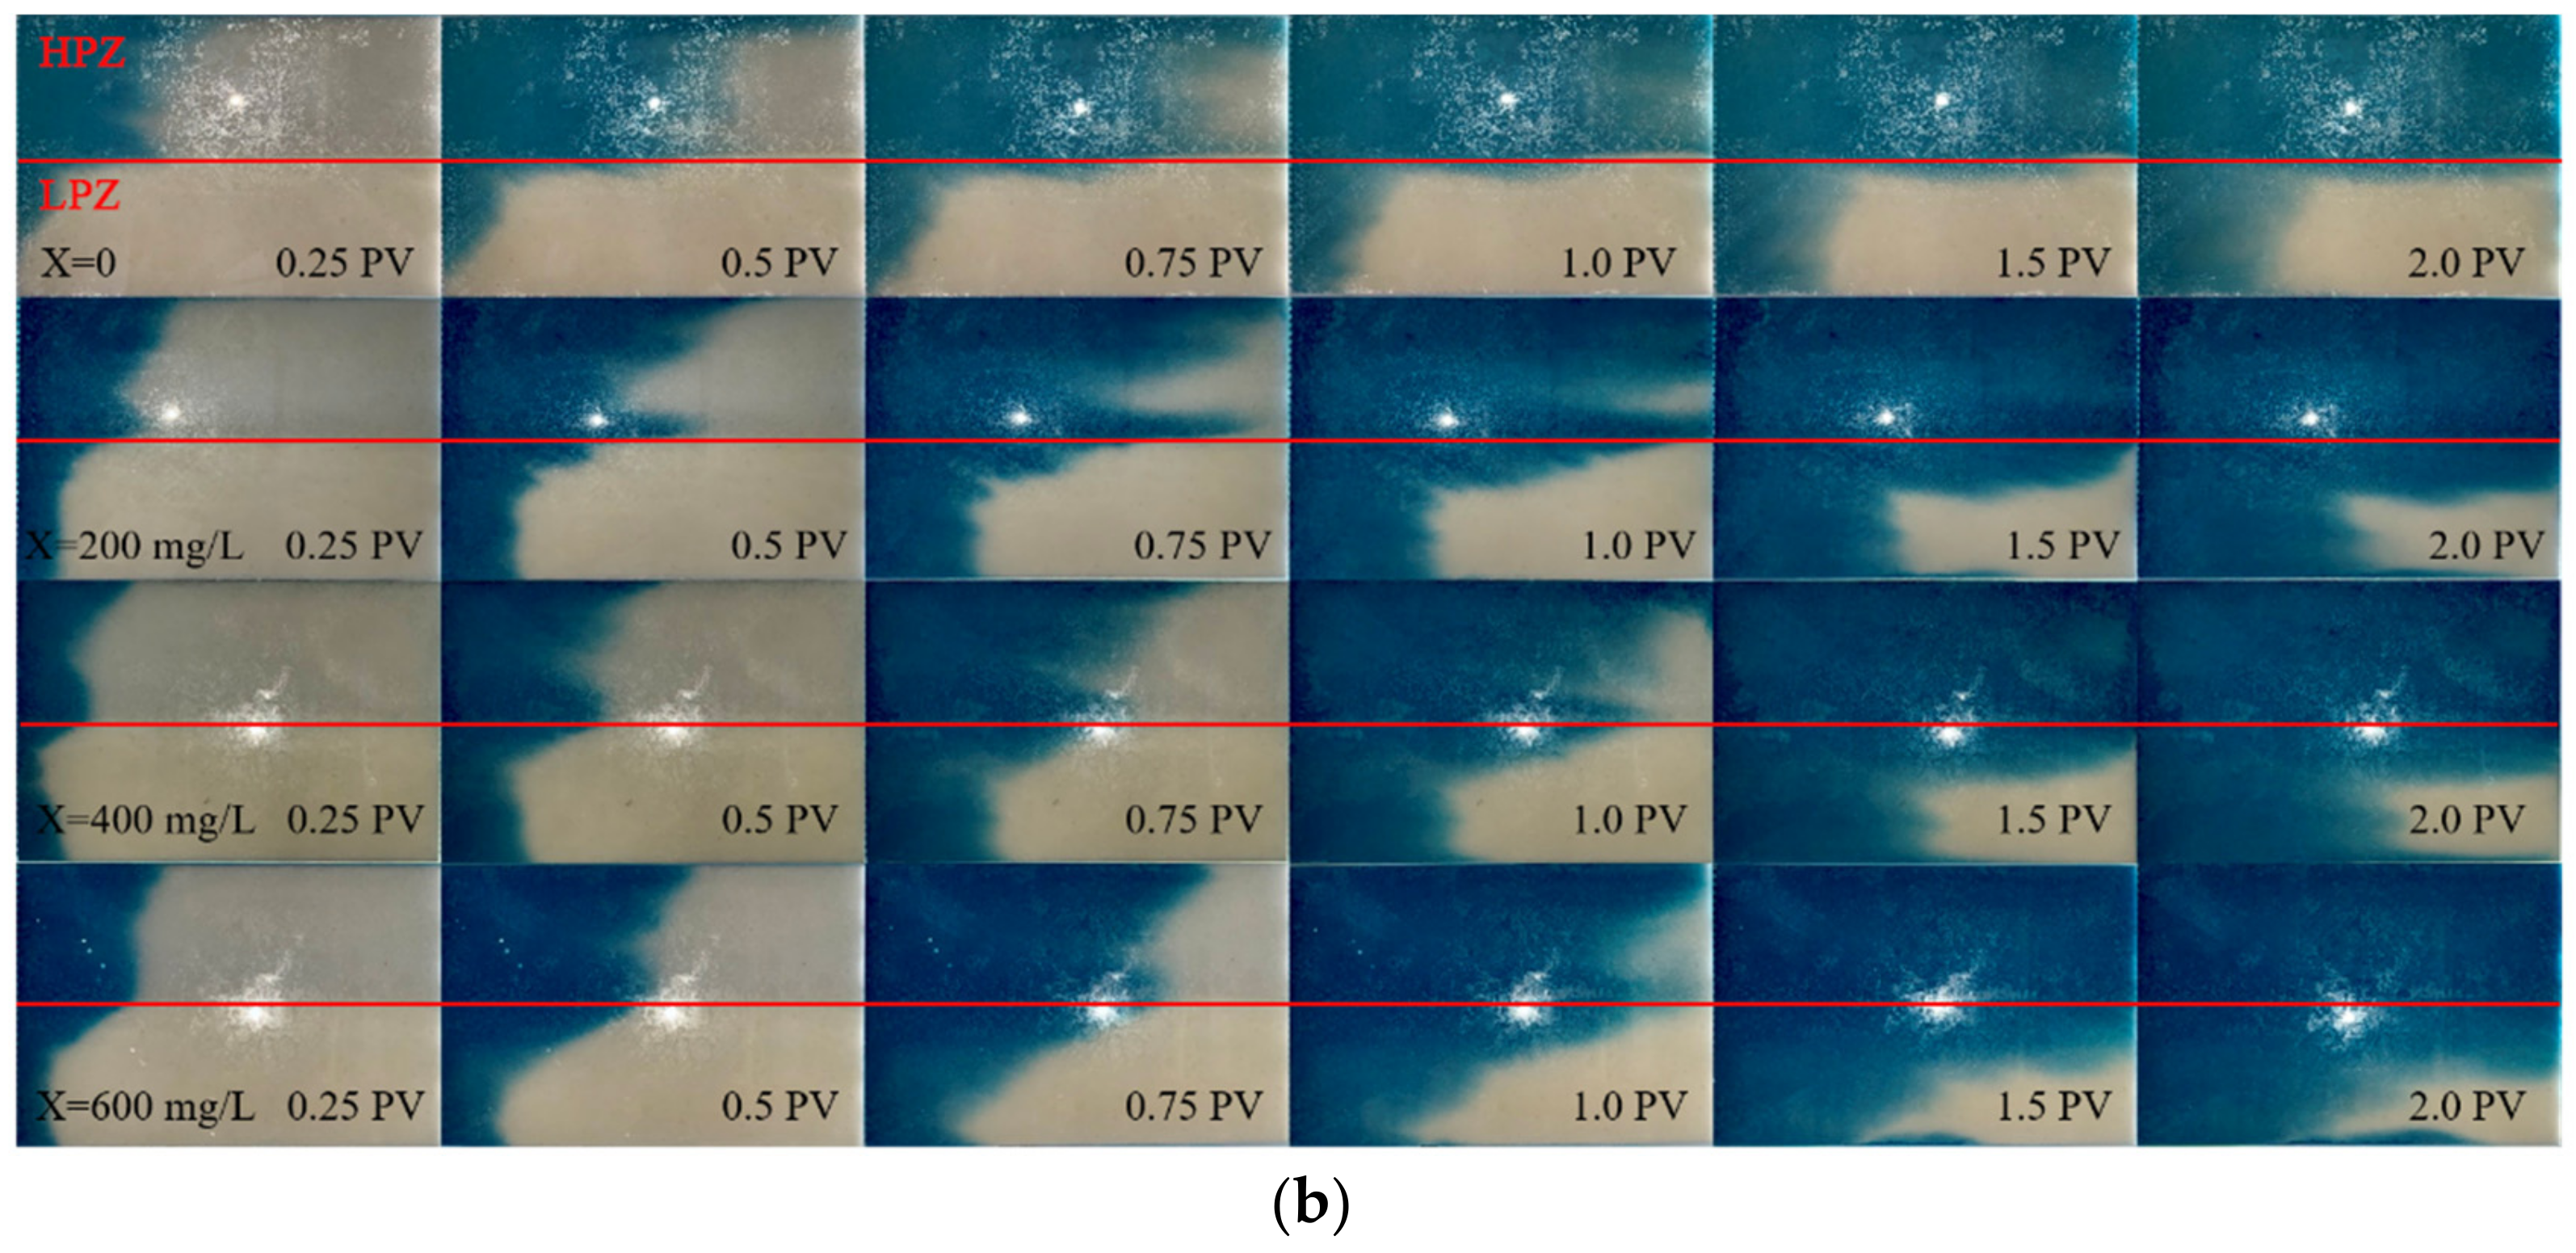
2.2.2. Two-Dimensional Cell Experiment

A two-dimensional flow cell experiment was also set up. Quartz sand media of different particle sizes were laid on the left and right sides to artificially simulate heterogeneous media. The medium was placed strip-like parallel to the flow direction. The experimental process is shown in Figure 2a. The sand tank was placed horizontally, and the solution dyed by chemical pigments was injected into the medium from the left end by a peristaltic pump. The solution flowed out naturally through the medium and was collected in the waste liquid tank at the right end. Small holes with a diameter of 1.5 mm were evenly arranged at the end of the storage tank close to the medium to evenly inject the solution into the medium and ensure that the sand did not overflow. A certain number of pressure-measuring holes were set above the two media, as shown in Figure 2b. During the experiment, when solution was injected, photographs were taken from the bottom of the tank to calculate the transmission distance of the driving fluid front and reflect the uniformity of the solution in the heterogeneous medium.
In the two-dimensional test, the polymer solution transmission when injecting pore volumes of 0.25, 0.50, 0.75, 1.00, 1.25, 1.50, 1.75 and 2.00 was recorded, each group of pictures was input into ImageJ software in turn, and auxiliary lines were added at 25% (middle line of HPZ along the water flow direction), 50% (division line of heterogeneous medium) and 75% (middle line of LPZ along the water flow direction) of the width of the picture in the software. The sizes of the polymer maximum migration fronts in the HPZ and LPZ were and the actual distance between the transmission interface and the injection starting interface under each pore volume were measured.

2.3. Characterization of Transmission Uniformity

The transmission uniformity control coefficient was defined, represented as U, which is equal to the ratio of different mediums’ hydraulic conductivity between two fluids (taking pure water and polymer solution as an example) in porous media. The calculation formula is as follows (taking medium sand/fine sand as an example):
U = R w R p = K h w / K l w K h p / K l p  
where U, R and K represent the transmission uniformity control coefficient, the change ratio of hydraulic conductivities and the hydraulic conductivities, respectively; h and l represent high- and low-permeability media, respectively; and p and w represent polymer solution and pure water, respectively. When U is greater than 1, the polymer solution transmits more uniformly in porous media than pure water does, where the higher U is, the more uniformly the polymer transmits in porous media.

3. Results

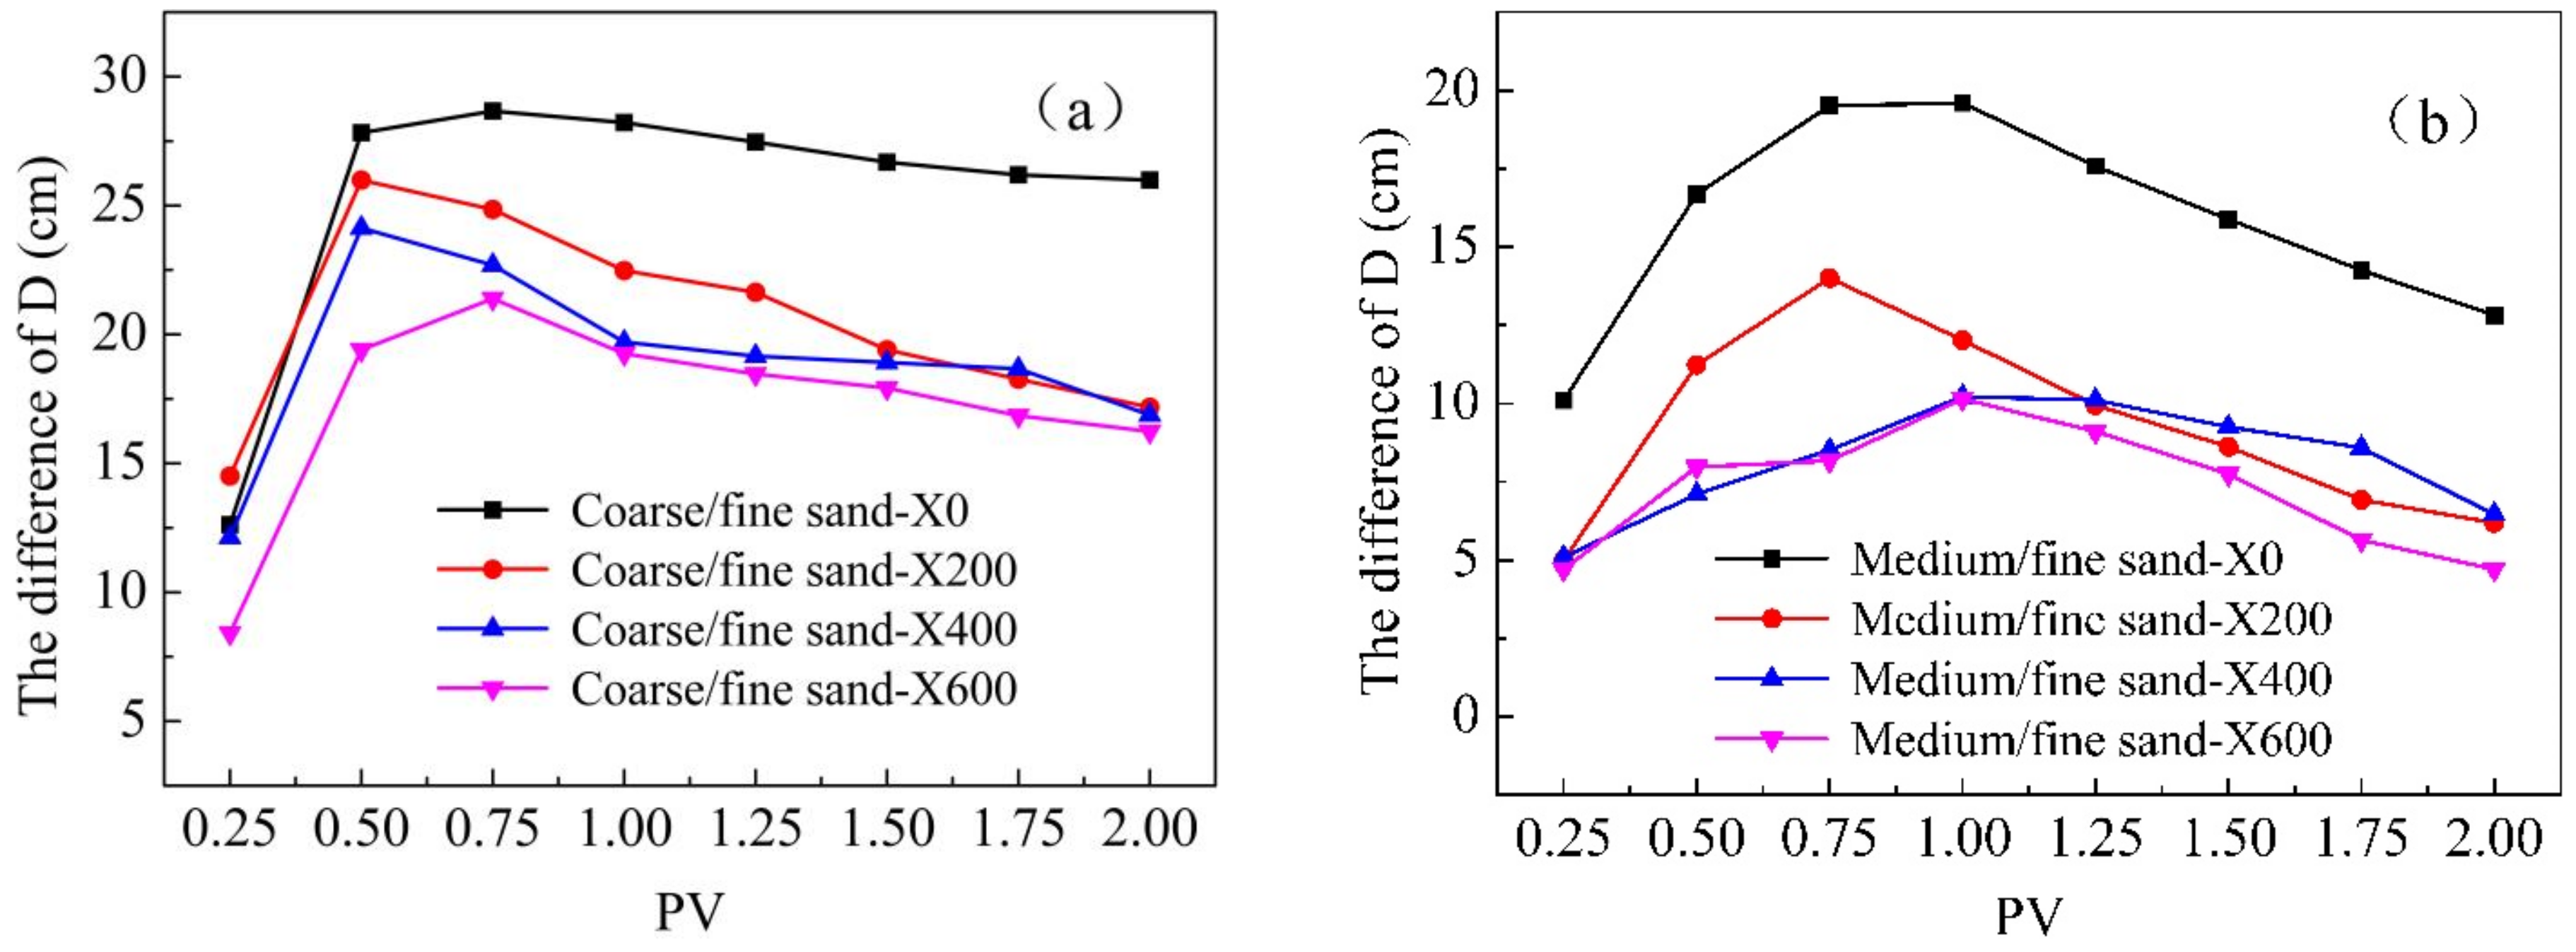
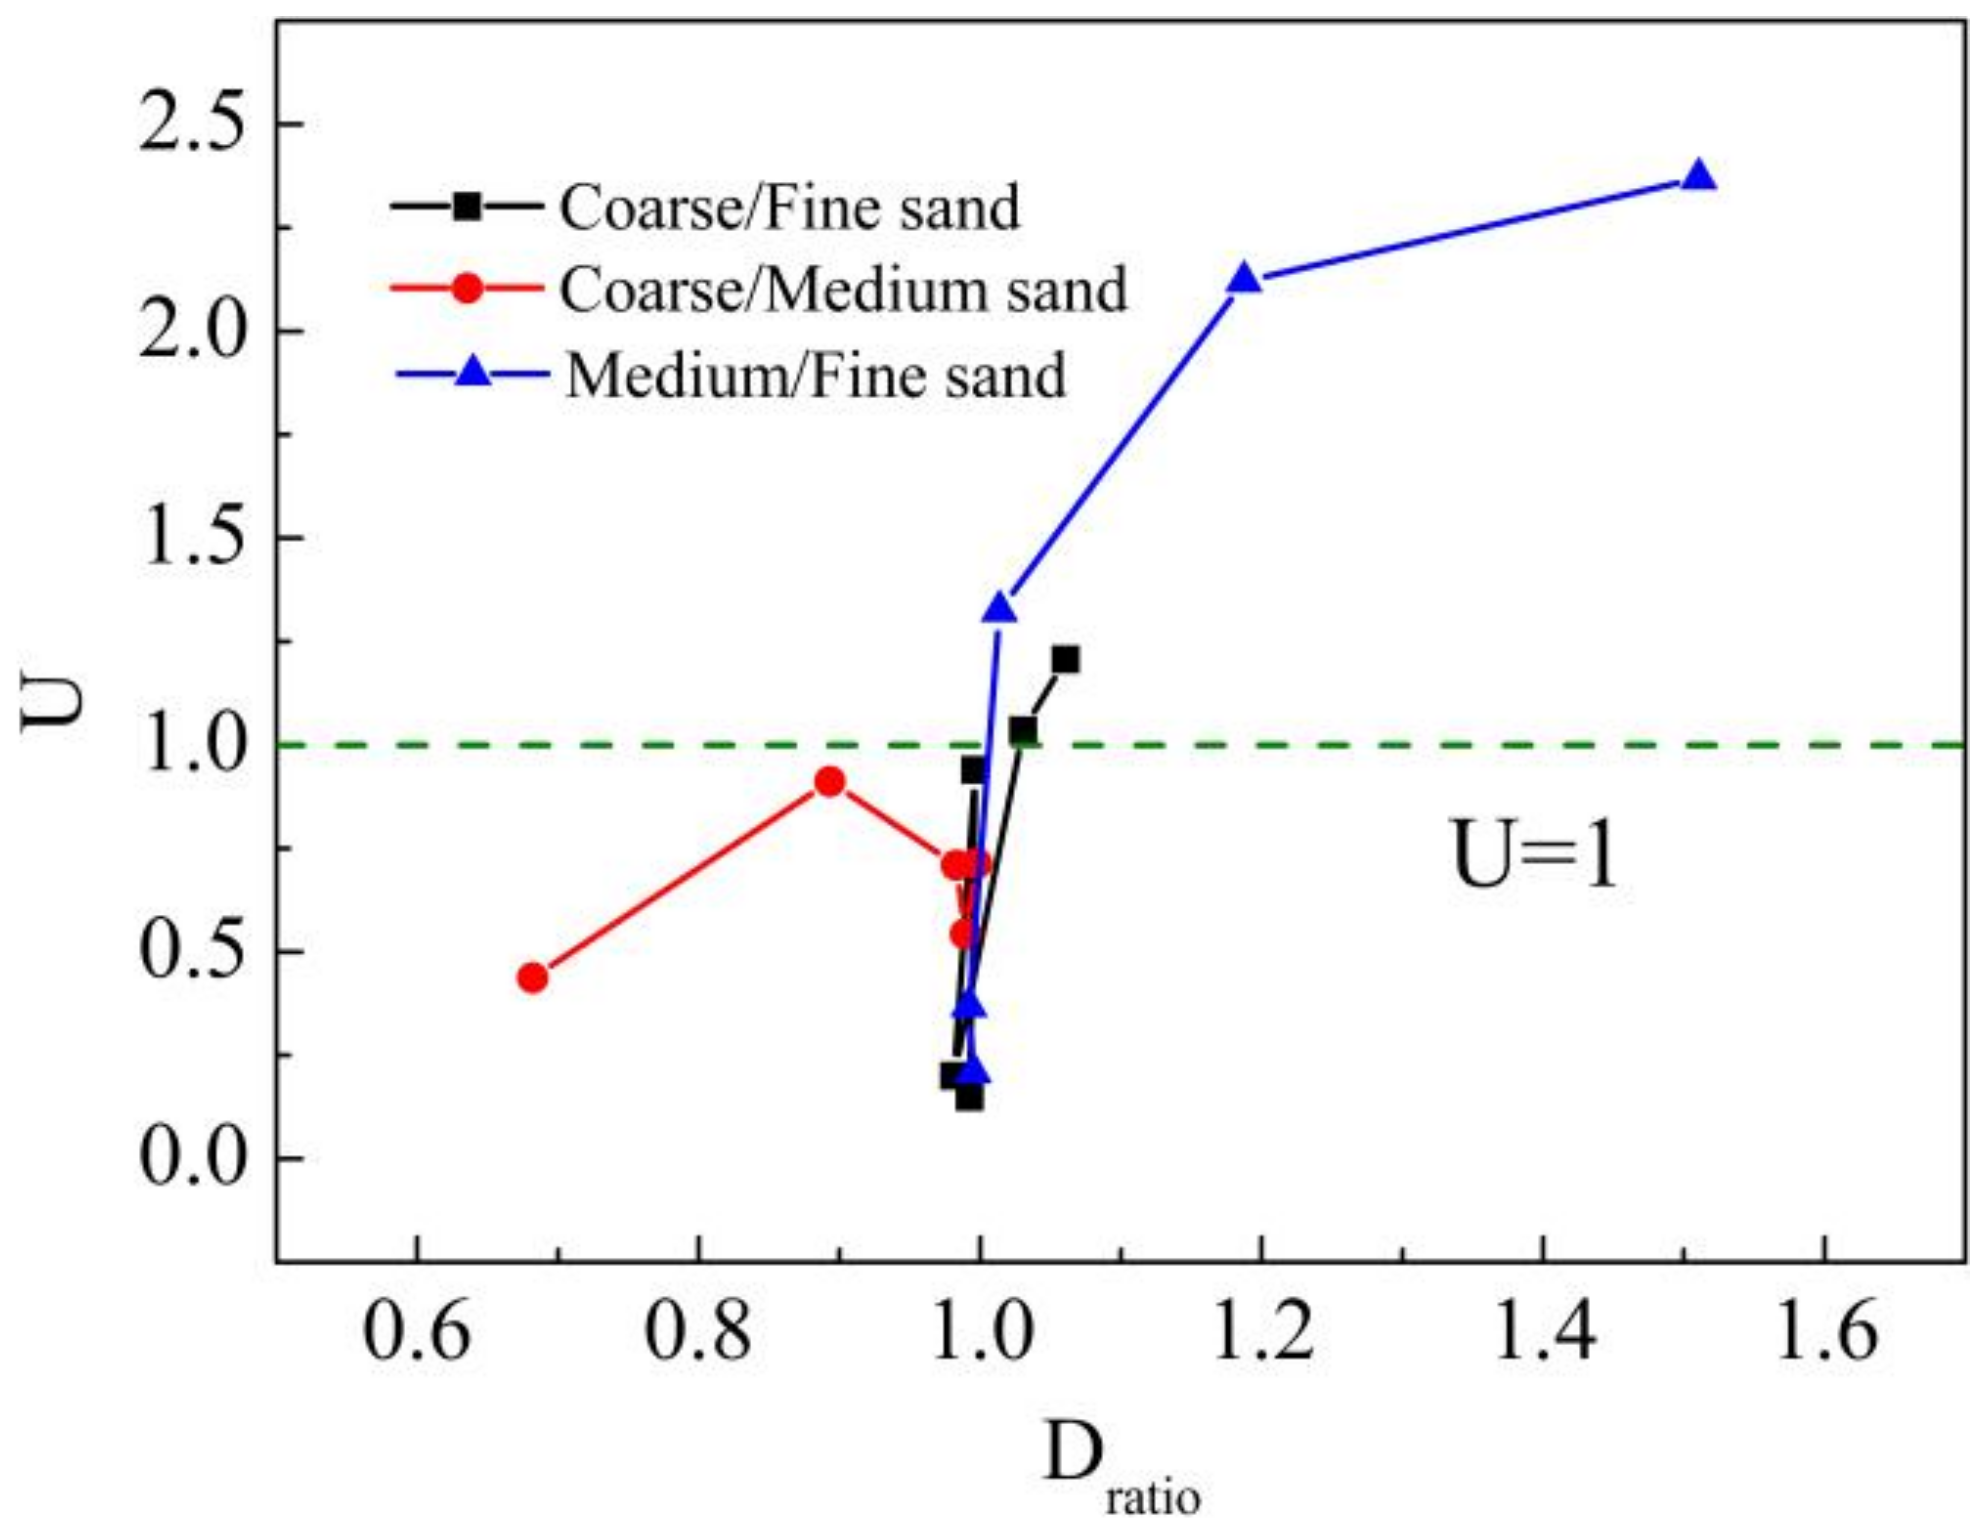
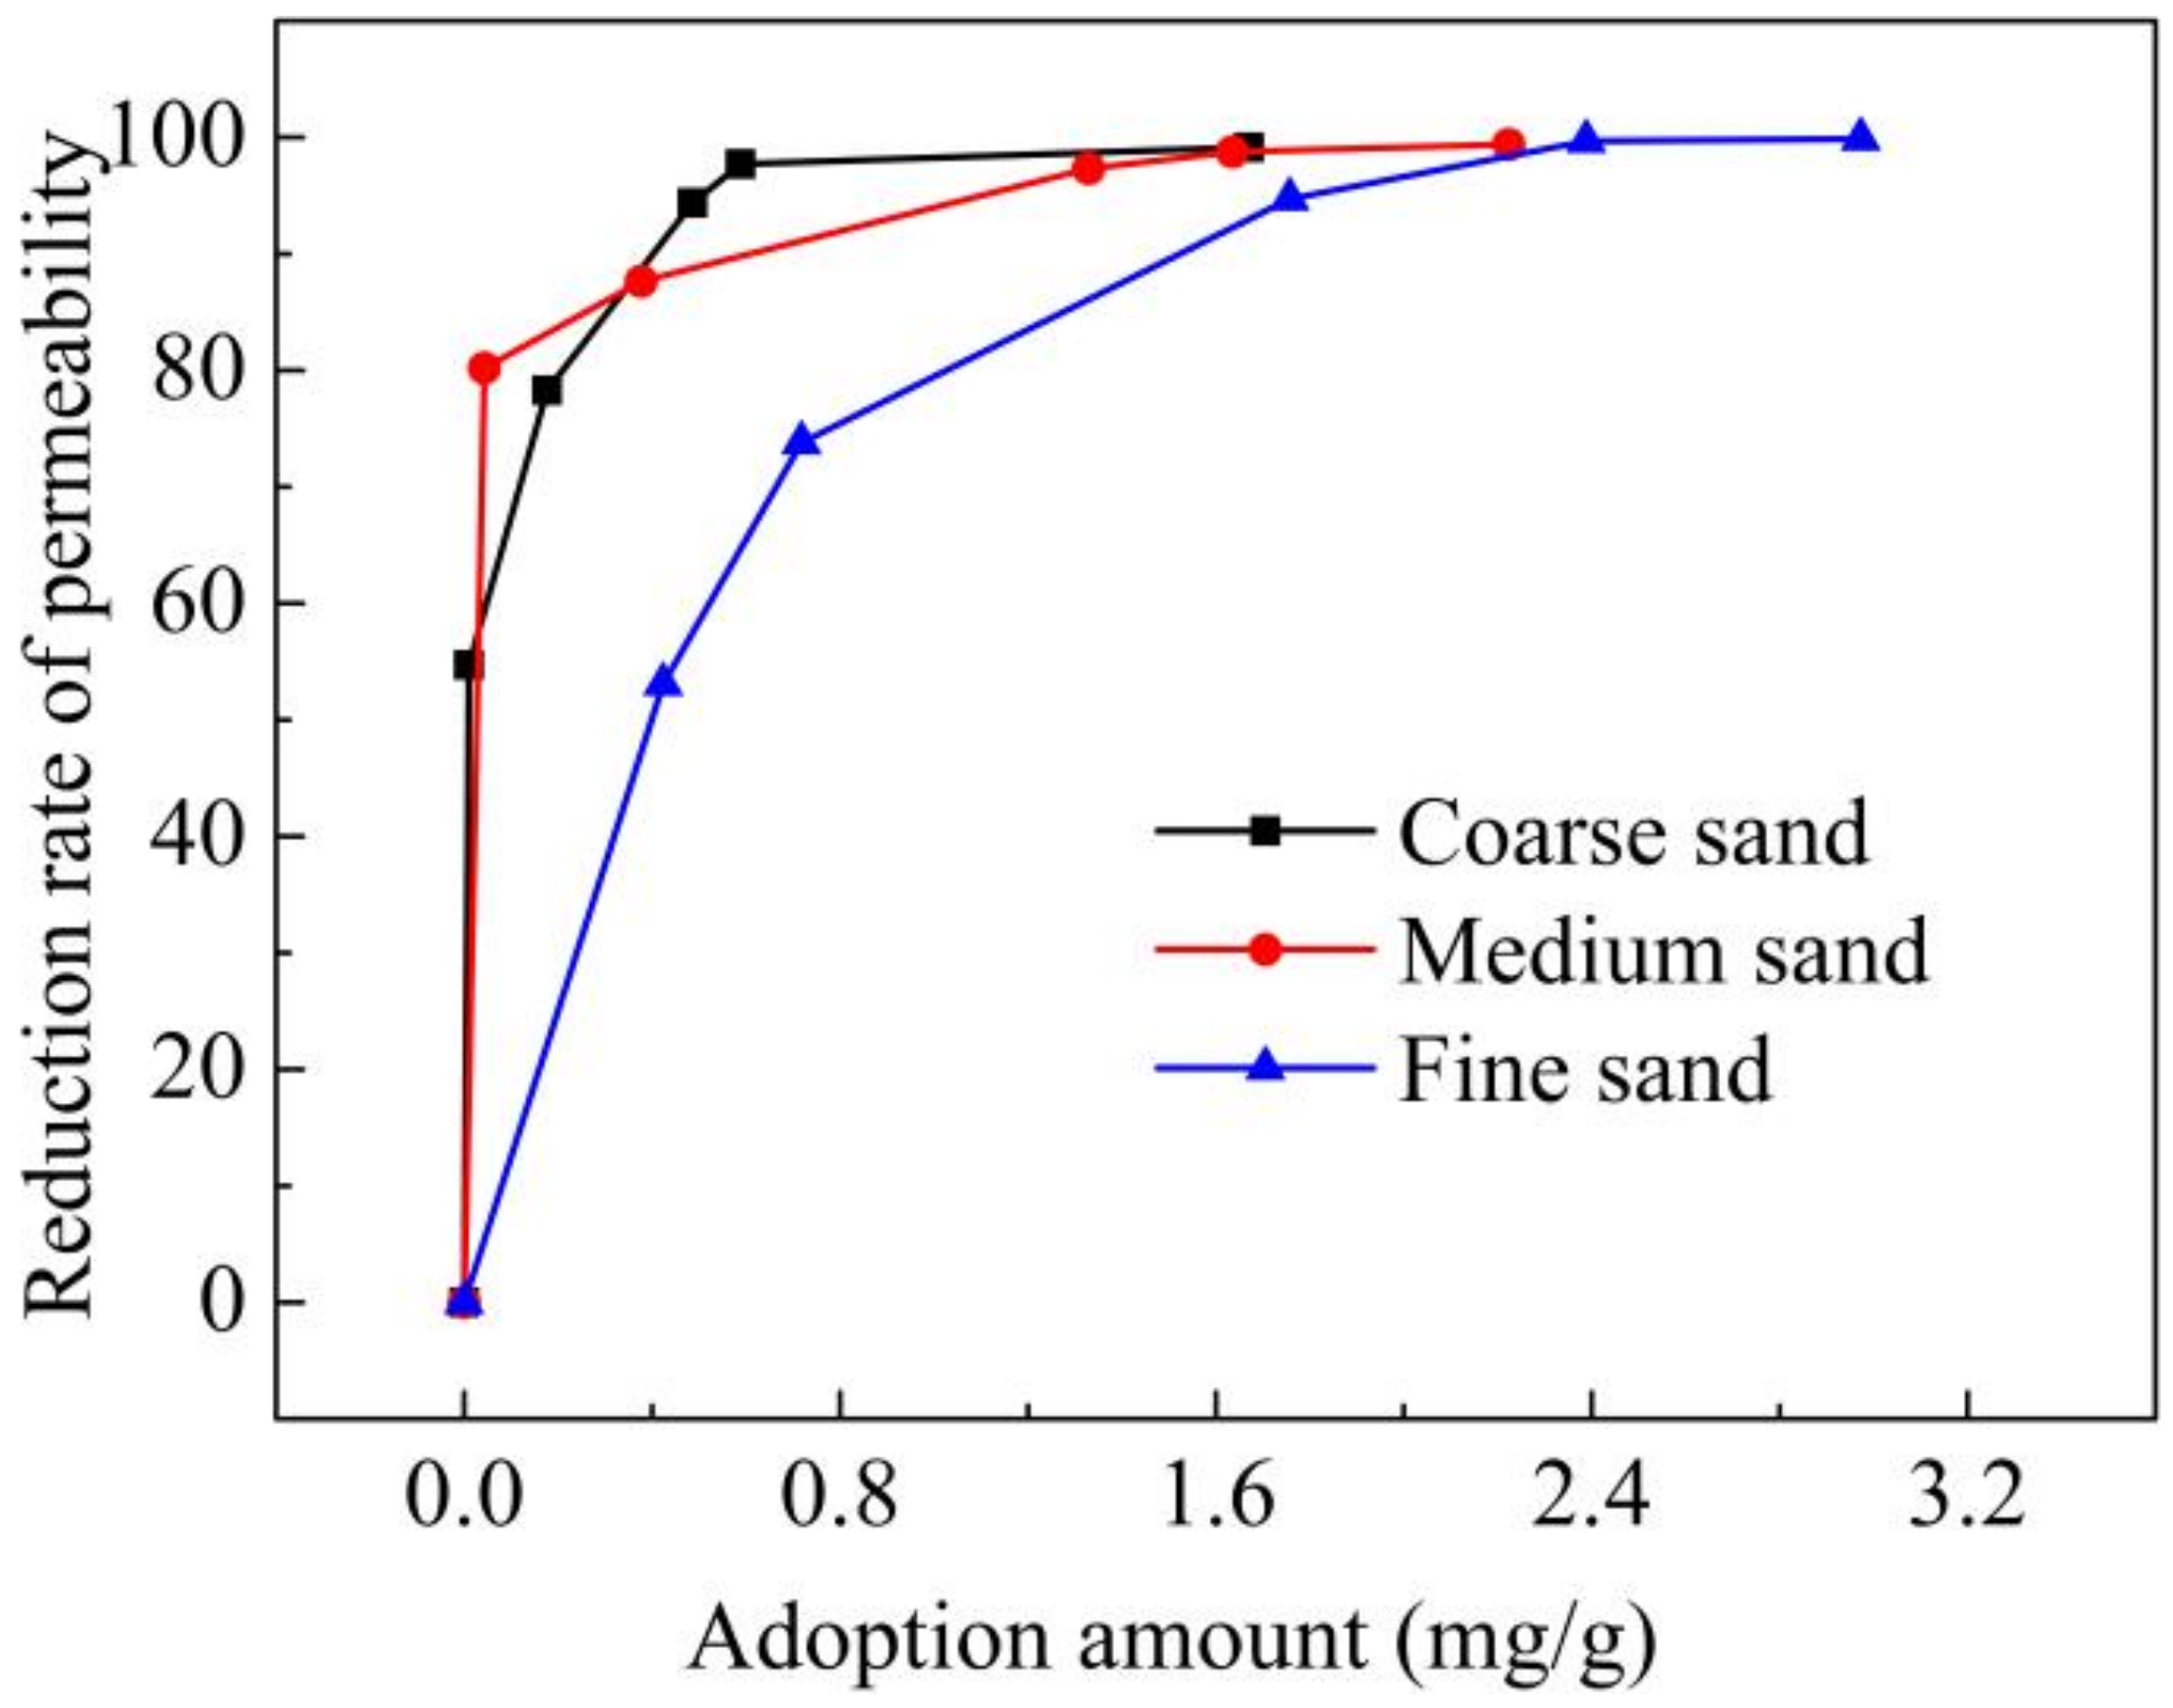
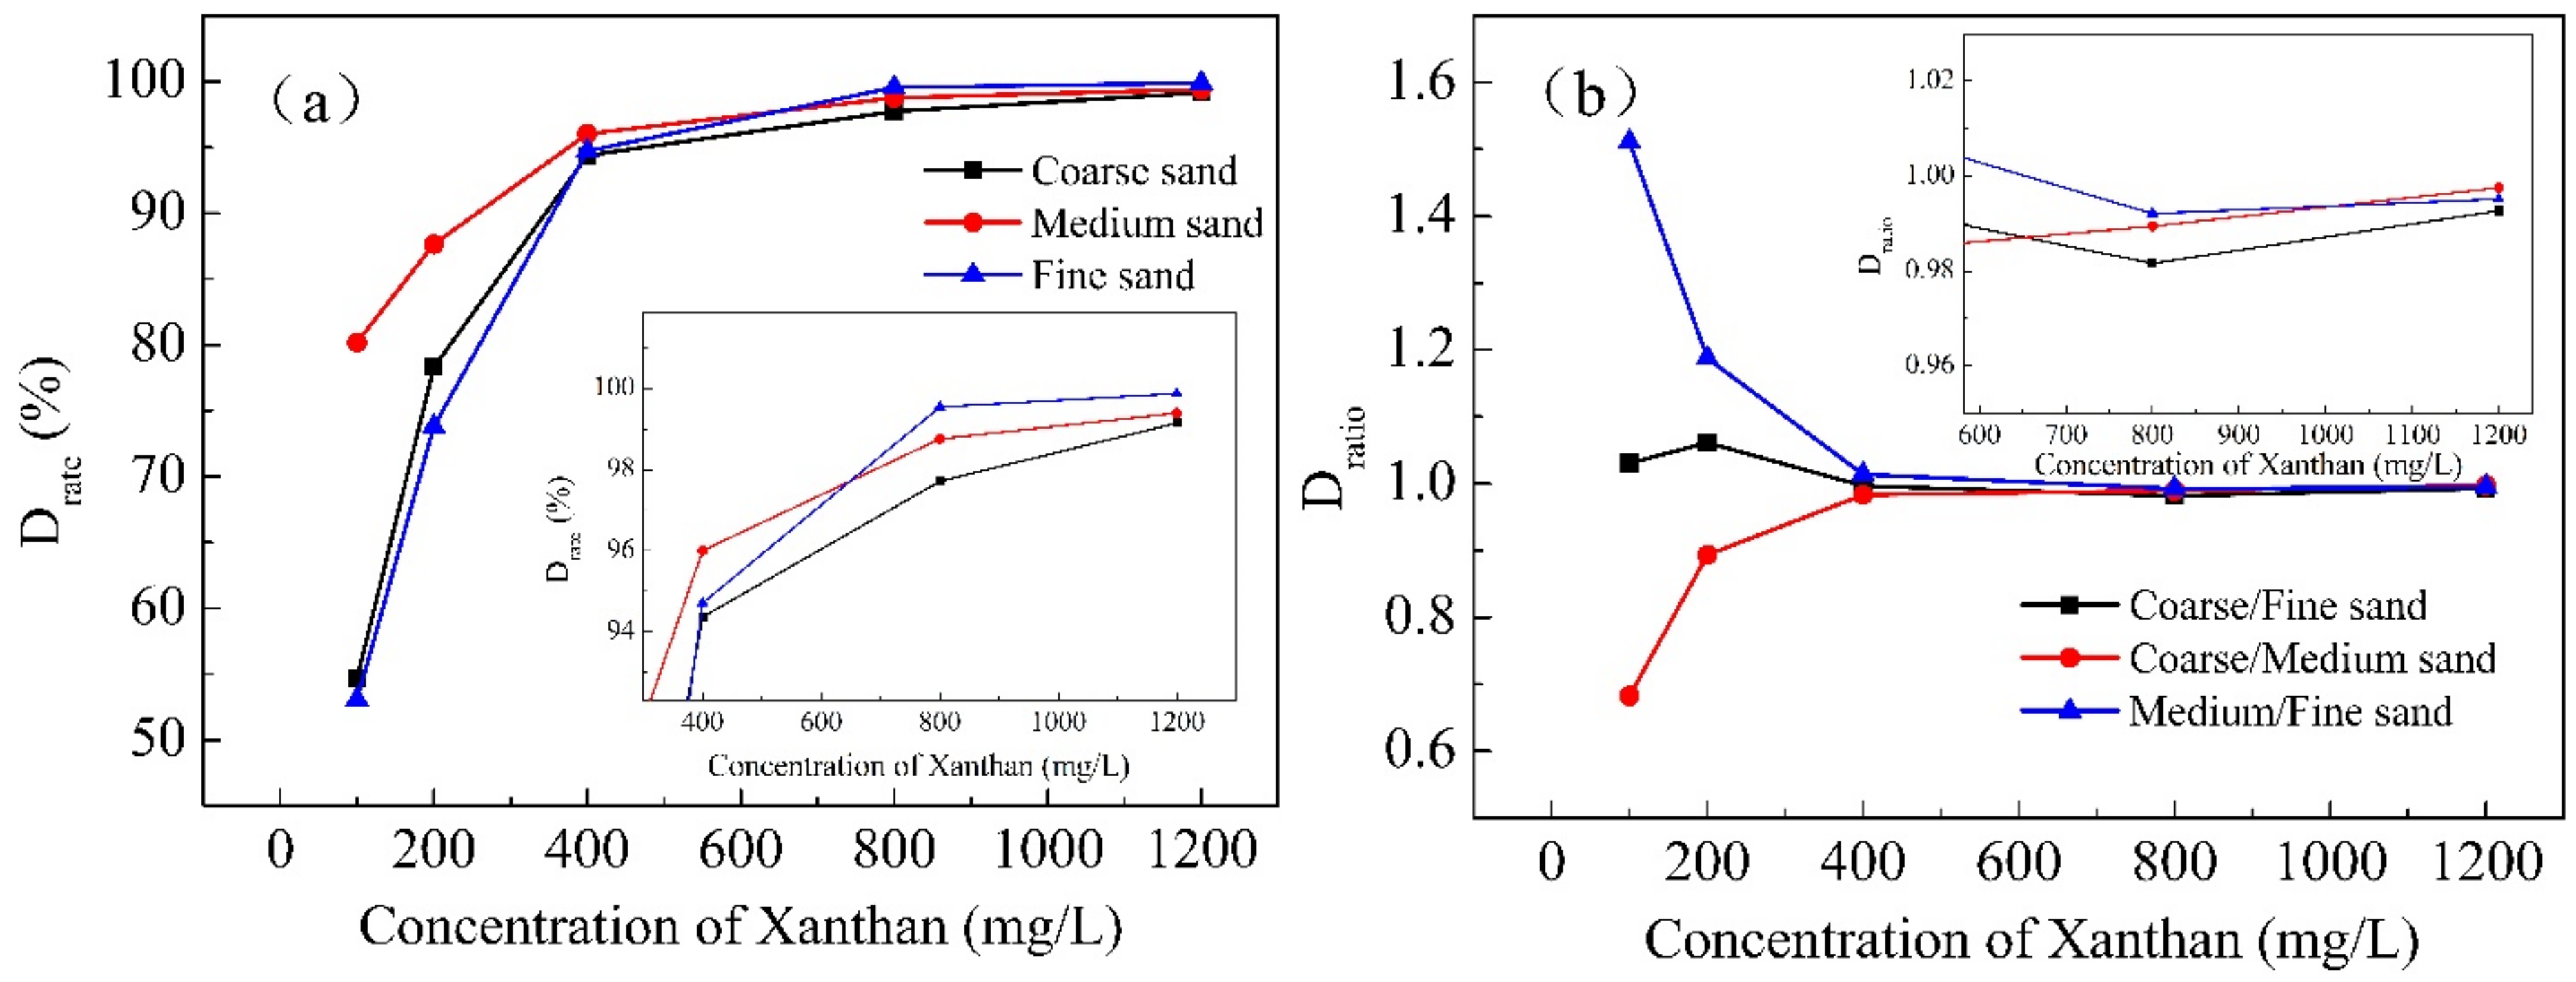
3.1. Factors Influencing U

3.1.1. Permeability Contrast

Permeability contrast ( k b s = k b / k s , where kb represents permeability values in more permeable media, and ks represents less permeable media) indicates the distribution range and degree of permeability difference between media. The permeability contrasts of the media are listed in Table 4 when injecting pure water, where R0 and U0 represent R and U under pure water injection.

3.1.2. Polymer Concentration

The R and U of the three combinations under different concentrations were calculated, and the results (Table 5a) show that the order of R between the three combinations is Rcf > Rcm > Rmf when the concentration of xanthan gum was in the range of 100~800 mg/L, which was similar to the order of permeability contrast (Table 4). However, when injecting pure water or xanthan gum at concentrations greater than 1200 mg/L, Rcm < Rmf, which is inversely related to the order of permeability contrast (Rcf > Rcm > Rmf).
The order of U was Umf > Ucf > Ucm when the concentration of xanthan gum was in the range of 100~800 mg/L. In coarse sand/fine sand, when the concentration of xanthan gum was 200 mg/L, U (1.27) was greater than when the concentration was 100 mg/L (1.22). When the concentration was higher than 200 mg/L, U < 1, indicating that U first increased and then decreased with increasing xanthan gum concentration. Medium sand/fine sand presented a similar trend (the critical concentration is 400 mg/L). U of coarse sand/medium sand remained less than 1 throughout the entire concentration range, which may indicate that xanthan gum has a different degree of influence on different media combinations. Similarly, when the xanthan gum concentration was over 1200 mg/L, there was a reversal between the coarse sand/fine sand and medium sand/fine sand combinations (Ucf < Ucm).
Generally, when the concentration of xanthan is relatively low and the permeability contrast is large, the enhancing effect of transmission uniformity in heterogeneous media is clearer. This possibly occurs because when xanthan gum of an appropriate concentration was injected, the viscosity of the solution increased, reducing the flow speed, improving the consistency of the amendment in the large and small pores, and leading to a more even transmission. As the concentration continued to increase, transmission was lower, which indicates that blockage may have occurred in the LPZ. The addition of xanthan gum with different concentrations showed different degrees of influence on hydraulic conductivities in coarse sand, medium sand and fine sand. According to Formula (2), the order in which media are affected the most was medium sand > coarse sand > fine sand. This explains why the U of coarse sand/medium sand remains less than 1; in this combination, xanthan gum had a much greater influence on medium sand than on fine sand, exacerbating uneven flow in the media. Thus, permeability contrast and polymer concentration jointly play a role in xanthan gum’s effect on flow uniformity.

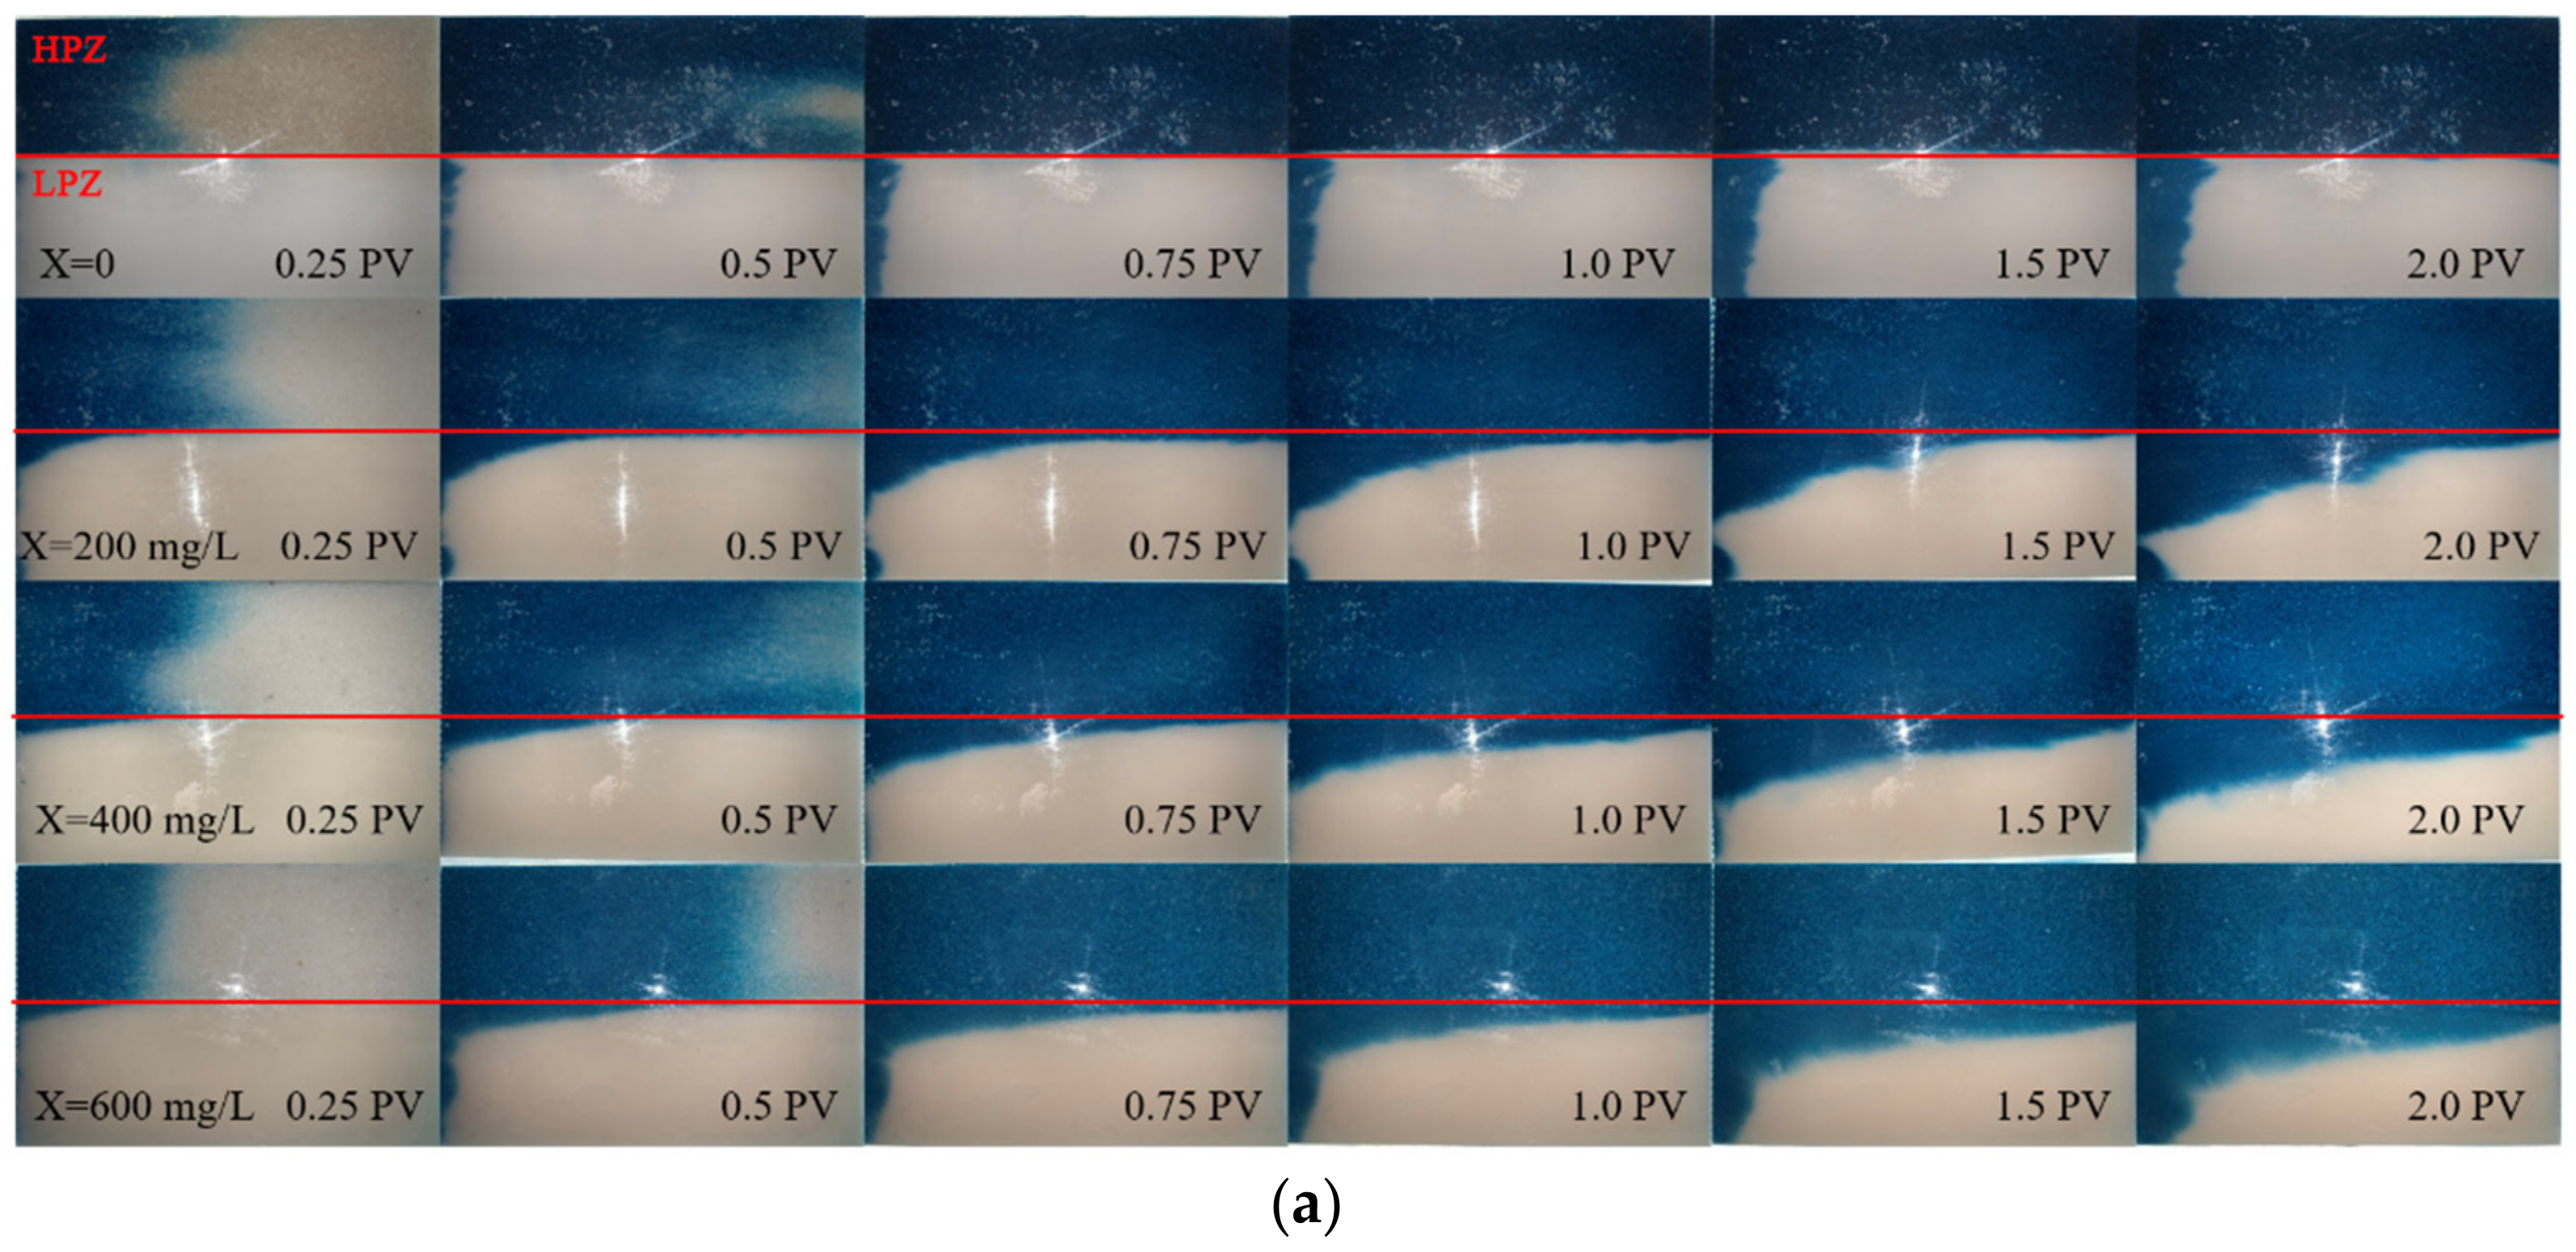
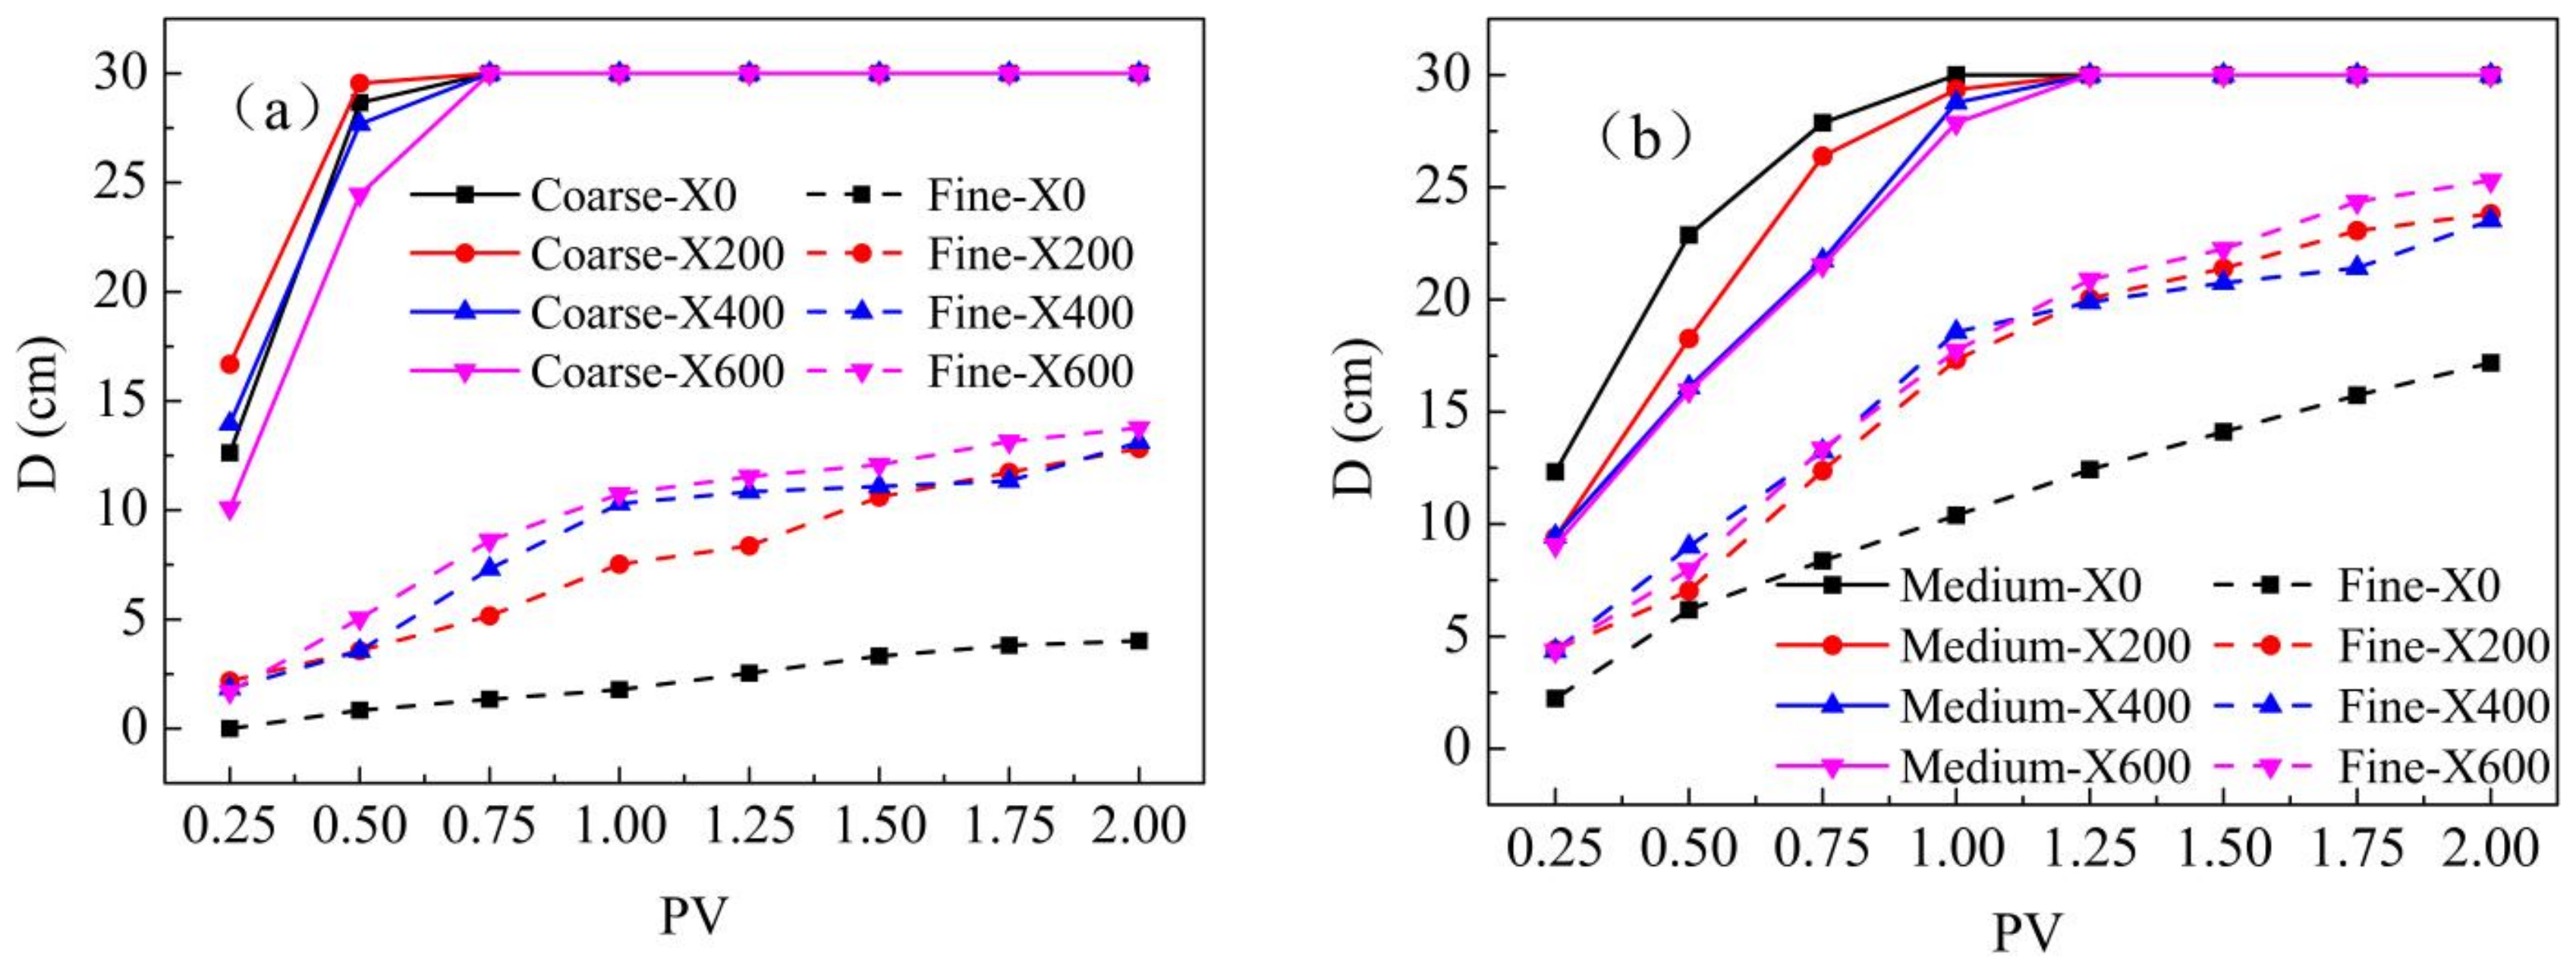
3.2. Polymer Transport in Heterogeneous Media

To intuitively analyze the transmission law of the polymer solution in actual heterogeneous porous media, a two-dimensional transmission experiment was performed, as shown in Figure 2a. The image results are shown in Figure 3a,b, where each row represents the polymer’s transportation process under different concentrations.
As shown in Figure 3a,b, the fluid driving distance between the different media (HPZ, LPZ) gradually decreases with increasing xanthan gum concentration and injected fluid volumes. Xanthan gum’s effect on medium sand/fine sand combination is more obvious than on coarse sand/fine sand combination in which the media are arranged in parallel, where the order is the same as that of U (Umf > Ucf > Ucm).

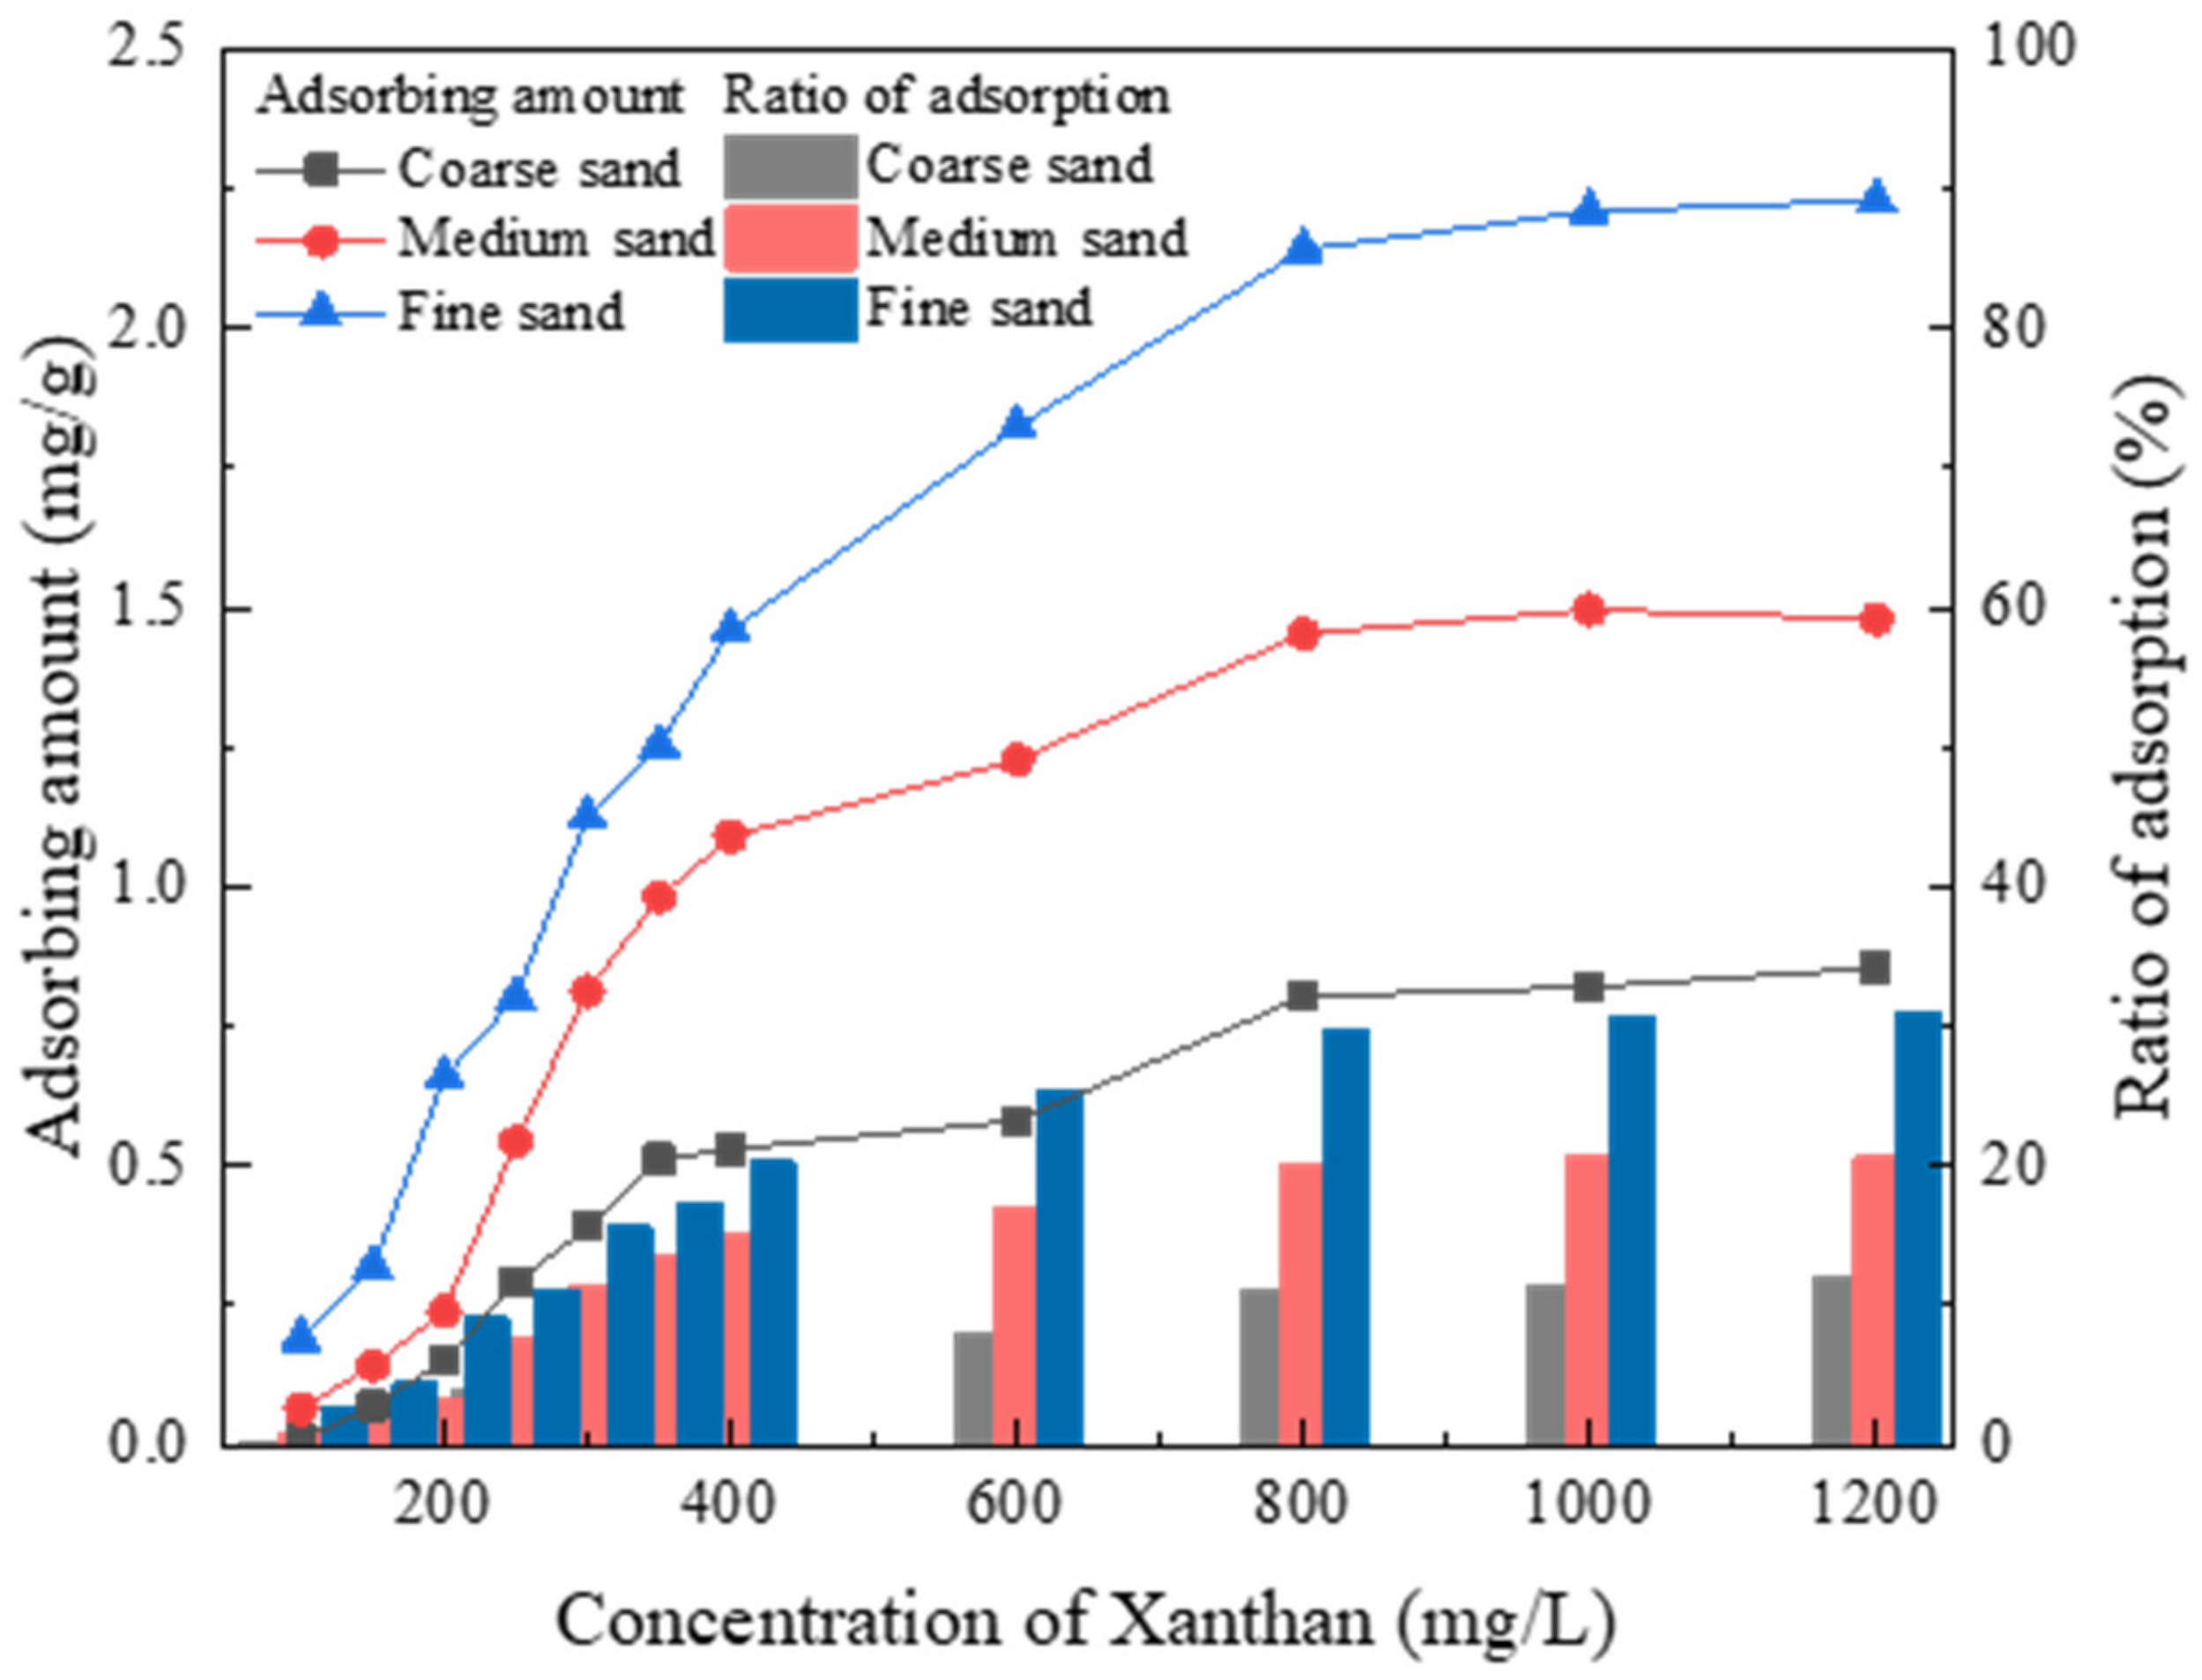
3.3. Migration of Xanthan Gum

Figure 4 shows fluid migration in each medium during injection of xanthan solution into heterogeneous medium, where D represents the migration distance. Generally, the maximum migration front in the heterogeneous medium was clearly uneven in different areas. According to Figure 4a, when 0.75 PV solution was injected in a heterogeneous medium of combined coarse sand/fine sand, the average maximum migration distance reaches 30 cm in the HPZ, which shows little relation to the concentration of xanthan gum. On the other hand, the average maximum migration distance increased significantly in the LPZ; when the xanthan gum concentration was 200, 400 and 600 mg/L, the average maximum migration distance increased by 285.79%, 446.88% and 544.44%, respectively.
Additionally, due to the increase in viscosity, the migration speed in the HPZ decreased. Before 0.75 PV, the higher the concentration was, the slower the migration speed was, which improved the uniformity of solution transmission.
According to Figure 4b, for the medium sand/fine sand combination, injection of xanthan solution also reduced the migration speed of the solution in the HPZ and increases the migration distance in the LPZ compared with pure water. When 1.0 PV of pure water was injected, the entire HPZ was filled with pure water, while 1.25 PV xanthan gum solution reached the same result. At the same time, the average maximum migration distance of xanthan gum solution in LPZ increased by 61.35%, 64.94% and 68.12% from low to high concentrations (200, 400 and 600 mg/L, respectively), and the difference between HPZ and LPZ decreased. Thus, the transmission of xanthan gum solution was different in heterogeneous media with different permeability contrasts. Compared with larger permeability contrast media, the solution was easier to transmit uniformly in heterogeneous media with smaller permeability contrast, i.e., U for the xanthan gum solution was larger in heterogeneous media with a low permeability contrast, which is consistent with the data in Table 5a.
The data in Table 5a are different from those shown in Figure 4, in that when the concentration is increased from 200 to 400 mg/L, Ucf is supposed to decrease, as is shown in Table 5a, but Figure 4 shows an even larger effect. This is because the peristaltic pump plays a pressurizing role in two-dimensional test. However, under specific conditions (PV > 1.25), U still decreased with increasing polymer concentration. Therefore, the conclusions obtained using U are still reasonable, and this error can be reduced by keeping the boundary conditions as consistent as possible during the experiment.
To more intuitively reflect the improvement of transmission uniformity under the injection of polymer solution, in this section, the displacement maximum migration front difference of the solution was calculated, and the results are shown in Figure 5. The maximum migration front of the polymer solution in both the HPZ and LPZ is significantly decreased compared with that of pure water, which indicates a more uniform transmission in a heterogeneous medium.
The obtained results also show that the improvement effect on the front difference in heterogeneity is also related to permeability contrast, and the correlation law is similar to that of U in different permeability contrast combinations. Throughout the whole experimental process, the greater the concentration of xanthan gum solution was, the smaller the difference between the maximum migration fronts was. For coarse sand/fine sand, the differences in maximum migration fronts decreased by 13.33%, 20.84% and 25.99% when injected with concentrations of 200, 400 and 600 mg/L at 0.75 PV, respectively. For medium sand/fine sand, the polymer concentration showed a clearer effect on the maximum migration front difference when xanthan gum solution was injected at 1.25 PV, where the migration front differences of the three concentrations were reduced by 43.28%, 45.91% and 48.17%, respectively. The polymer solution in the LPZ had a greater shear effect, which reduced viscosity and finally weakened preferential flow and improved the transmission of the solution in a heterogeneous media.
In addition, the distribution of the repair agent in the low-permeability zone was very important for the removal of pollutants in the low-permeability zone. The improvement effect on the front difference in heterogeneity could also be related to the removal efficiency of pollutants [18] and U can also play a role in numerical models [19] researching the enhancement of the sweeping efficiency of polymer solution.

4. Discussion

To further analyze how permeability contrast and polymer concentration have an impact on enhancing transmission uniformity, permeability reduction and hydraulic conductivity decline during the process were measured and analyzed.

4.1. Permeability Reduction

The retention mechanisms of polymers, which include surface adsorption, mechanical trapping, fluid dynamics trapping, and interaction between polymer molecules are responsible for the change in the process. In general, the permeability reduction increased with increasing adsorption, as shown in Figure 6. The permeability reductions of the three media were all positive. However, the measured value was lower than the theoretical permeability value. The order of reduction of permeability from the theoretical value while polymer solution with the same viscosity passes through three media was coarse sand > medium sand > fine sand.
Figure 7 shows the adsorption amounts of the media under different polymer concentrations, and Figure 6 shows the degree of permeability reduction for different adsorption amounts. When the adsorption amount in medium sand was ≤1.09 mg/g (adsorption ratio: 15.13%) and ≤1.46 mg/g (adsorption ratio: 20.28%) in fine sand, the permeability reduction of medium sand was greater than that of fine sand, and Umf > 1. This was the same for the coarse sand/fine sand combination when the adsorption amounts were ≤0.15 and 0.66 mg/g, respectively. However, for coarse sand/medium sand media, the degree was nearly close, which explained why for coarse sand/medium sand media, polymers had little help in enhancing transmission uniformity and had a low U.
The obtained experimental results showed that fine sand had a small particle size and large specific surface area, which provided more adsorption points at the same time; thus, the adsorption amount was the largest. However, coarse sand was the lowest. At 800 mg/L, the adsorption amount of xanthan gum in fine sand was much higher than that of medium sand, which caused the reduction of fine sand to exceed that of medium sand, resulting in a U of less than 1 for medium sand/fine sand. This explains why reversal occurred when the concentration was excessive (Table 5a), and helps to supply the change in the effect of xanthan gum caused by changes in permeability and concentration in non-uniform medium with parallel strip distribution, compared to vertical distribution [18,20].
Therefore, in practical situations, the polymer solution should maintain a certain viscosity while driving the oxidant forward to reduce the adsorption of polymer in porous media, thus avoiding a change in permeability caused by the adsorption amount.

4.2. Hydraulic Conductivity Decrease

To further analyze the influence of permeability contrast and polymer concentration on the transmission uniformity control coefficient, the rate and ratio of hydraulic conductivity decrease were introduced. The hydraulic conductivity decrease rate Drate was calculated using Formula (3).
D r a t e = K w K p K w × 100 %            
where Kw and Kp represent the hydraulic conductivity of the medium for water and for the polymer, respectively.
The hydraulic conductivity decrease ratio Dratio represents the comparison of the influence degree of xanthan gum between different media at the same concentration. It was calculated using Formula (4).
D r a t i o = D r a t e h D r a t e l
where h represents a high-permeability medium and l represents a low-permeability medium.
From Figure 8a, it can be concluded that the Drate of porous media follows the order medium sand > coarse sand > fine sand, and when the concentration is higher, it shows the opposite trend. At 400 mg/L, the Drate of fine sand was higher than that of coarse sand. The influence of xanthan solution in coarse sand was lower than that in fine sand, resulting in a low U and even a U of less than 1 (Table 5a) for coarse sand/fine sand. Similarly, when greater than 660 mg/L, the Drate of fine sand exceeded that of medium sand, resulting in a low U for medium sand/fine sand. Because the Drate of medium sand was always greater than that of coarse sand, the U of coarse sand/medium sand remained less than 1.
As shown in Figure 8b, the order of Dratio at low xanthan concentrations (≤400 mg/L) was medium sand/fine sand > coarse sand/fine sand > coarse sand/medium sand, which was also in accordance with U. This confirmed that U was related to Dratio. When the xanthan gum concentration was higher than 400 mg/L, the Drate of the three media were particularly close, and the value of Dratio fluctuated around 1. Therefore, there should be a precondition for the use of Dratio, i.e., the gradient of change in hydraulic conductivity for two media is clearly different and monotonous (one is always greater than or less than the other).
Figure 9 shows the quantitative relationship between U and Dratio. There was a positive correlation between them, where the higher the Dratio was, the greater the U of the polymer solution was in porous media. For the coarse sand/medium sand medium combination, the change pattern of U and Dratio was contrary to that of the other two groups, because the Drate of the coarse sand with high permeability was smaller than that of the medium sand with relatively low permeability.
Generally, with increasing concentration, the adsorption capacity of the polymer on the medium surface increases, which changes the pore structure and size to a greater extent. Additionally, with a greater shear rate, the viscosity decreased more and the hydraulic conductivity decreased relatively less in the LPZ than in the HPZ; thus, the hydraulic conductivity of the solution was closer in the HPZ and LPZ, and finally, the solution is transported more evenly in the heterogeneous medium, which can enhance the mixing of the remediation agent and pollution plume in the LPZ, improving the efficiency of pollutant removal.
Thus, when adding polymer in the practice contaminated site, the physical properties of sand at the treatment site and the polymer concentration should be fully considered. In addition, via the quantitative method discussed in this research, an appropriate xanthan concentration that is both economical and efficient can be selected to cope with different medium conditions. In addition, it can help identifying some special situations in which xanthan has little effect on improving transmission uniformity in heterogeneous media.

5. Conclusions

Based on Darcy’s seepage theory, the seepage characteristics of polymers in porous media and their impact on the permeability of porous media were investigated. A characterization method for polymer transmission uniformity in heterogeneous media was developed. The main conclusions are as follows:
(1)
The transmission uniformity control coefficient is affected by both hydraulic conductivity changes and permeability changes. The characterization method, which uses the U express transmission uniformity control coefficient, is shown to be reasonable and effective based on experimental results.
(2)
The permeability contrast and polymer concentration influence the transmission uniformity in heterogeneous media. Xanthan solution is more easily uniformly transmitted in heterogeneous media with a smaller permeability contrast.
(3)
The adsorption of polymers on the surface of porous media affects the permeability of the media. When the viscosity of polymer is too large, blockage can easily occur in the LPZ, which is not conducive to uniform transmission, thus influencing the degree of U.
This quantitative method is helpful for further studying the removal efficiency of pollutants in heterogeneous media and for selecting polymer inject condition to improve the uniform distribution of the repair agent in the target treatment area.

Author Contributions

Conceptualization, J.C.; methodology, J.C. and Y.W.; software, Y.W.; validation, Y.W., Q.X. and H.Z.; formal analysis, Y.W.; investigation, Y.W. and H.Z.; resources, Y.W. and Q.X.; data curation, H.Z.; writing—original draft preparation, H.Z.; writing—review and editing, H.Z.; visualization, H.Z.; supervision, J.C.; project administration, J.C.; funding acquisition, J.C. All authors have read and agreed to the published version of the manuscript.

Funding

This research was funded by the National Natural Science Foundation of China, grant number 41877184.

Institutional Review Board Statement

Not applicable.

Conflicts of Interest

The authors declare no conflict of interest.

Glossary

SymbolImplication
K (cm/s)Hydraulic conductivity
RcfwRatio of hydraulic conductivity of coarse sand to that of fine sand for water
RmfwRatio of hydraulic conductivity of medium sand to that of fine sand for water
RcmwRatio of hydraulic conductivity of coarse sand to that of medium sand for water
RcfpRatio of hydraulic conductivity of coarse sand to that of fine sand for polymer solution
RmfpRatio of hydraulic conductivity of medium sand to that of fine sand for polymer solution
RcmpRatio of hydraulic conductivity of coarse sand to that of medium sand for polymer solution
UcfTransmission uniformity control coefficient of coarse sand/ fine sand heterogeneous media.
UmfTransmission uniformity control coefficient of medium sand/ fine sand heterogeneous media.
UcmTransmission uniformity control coefficient of coarse sand/medium sand heterogeneous media.

References

  1. Krembs, F.J.; Siegrist, R.L.; Crimi, M.L.; Furrer, R.F.; Petri, B.G. ISCO for Groundwater Remediation: Analysis of Field Applications and Performance. Ground Water Monit. Remediat. 2010, 30, 42–53. [Google Scholar] [CrossRef]
  2. Wu, M.; Yang, Y.; Lin, J.; Wu, J.; Wu, J.; Hu, B.X. The co-effect of heterogeneity and solute concentration on representative elementary volume of DNAPL in groundwater. J. Hydrol. 2020, 585, 124795. [Google Scholar] [CrossRef]
  3. Silva, J.A.; Smith, M.M.; Munakata-Marr, J.; McCray, J.E. The effect of system variables on in situ sweep-efficiency improvements via viscosity modification. J. Contam. Hydrol. 2012, 136–137, 117–130. [Google Scholar] [CrossRef] [PubMed]
  4. Smith, M.M.; Silva, J.A.; Munakata-Marr, J.; McCray, J.E. Using Polymer Floods to Overcome Heterogeneity Effects during Bioremediation and Chemical Oxidation Ground Water Treatments. Ground Water Summit. 2008. Available online: https://ngwa.confex.com/ngwa/2008gws/techprogram/P5026.HTM (accessed on 23 August 2022).
  5. Jackson, R.E.; Dwarakanath, V.; Meinardus, H.W.; Young, C.M. Mobility control: How injected surfactants and biostimulants may be forced into low-permeability unit. Remediat. J. 2003, 13, 59–66. [Google Scholar] [CrossRef]
  6. Algharaib, M.; Alajmi, A.; Gharbi, R. Improving polymer flood performance in high salinity reservoirs. J. Pet. Sci. Eng. 2014, 115, 17–23. [Google Scholar] [CrossRef]
  7. Chokejaroenrat, C.; Kananizadeh, N.; Sakulthaew, C.; Comfort, S.; Li, Y. Improving the Sweeping Efficiency of Permanganate into Low Permeable Zones To Treat TCE: Experimental Results and Model Development. Environ. Sci. Technol. 2013, 47, 13031–13038. [Google Scholar] [CrossRef] [PubMed]
  8. McCray, J.E.; Munakata-Marr, J.; Silva, J.A.; Davenport, S.; Smith, M.M. Multi-Scale Experiments to Evaluate Mobility Control Methods for Enhancing the Sweep Efficiency of Injected Subsurface Remediation Amendments; Colorado School of Mines Golden: Golden, CO, USA, 2010. [Google Scholar]
  9. Martel, R.; Hébert, A.; Lefebvre, R.; Gélinas, P.; Gabriel, U. Displacement and sweep efficiencies in a DNAPL recovery test using micellar and polymer solutions injected in a five-spot pattern. J. Contam. Hydrol. 2004, 75, 1–29. [Google Scholar] [CrossRef] [PubMed]
  10. Liu, Y.S.; Chen, J.J.; Wei, M.; Shi, L.X. Improving the Sweeping Efficiency of Amendment by Using Polymer. Key Eng. Mater. 2017, 744, 525–530. [Google Scholar] [CrossRef]
  11. Truex, M.J.; Vermeul, V.R.; Adamson, D.T.; Oostrom, M.; Zhong, L.; Mackley, R.D.; Fritz, B.G.; Horner, J.A.; Johnson, T.C.; Thomle, J.N.; et al. Field Test of Enhanced Remedial Amendment Delivery Using a Shear-Thinning Fluid. Groundw. Monit. Remediat. 2015, 35, 34–45. [Google Scholar] [CrossRef]
  12. Smith, M.M.; Silva, J.A.; Munakata-Marr, J.; McCray, J.E. Compatibility of Polymers and Chemical Oxidants for Enhanced Groundwater Remediation. Environ. Sci. Technol. 2008, 42, 9296–9301. [Google Scholar] [CrossRef] [PubMed]
  13. Garcıa-Ochoa, F.; Santos, V.E.; Casas, J.A.; Gómez, E. Xanthan gum: Production, recovery, and properties. Biotechnol. Adv. 2000, 18, 549–579. [Google Scholar] [CrossRef]
  14. Chokejaroenrat, C.; Comfort, S.; Sakulthaew, C.; Dvorak, B. Improving the treatment of non-aqueous phase TCE in low permeability zones with permanganate. J. Hazard. Mater. 2014, 268, 177–184. [Google Scholar] [CrossRef] [PubMed]
  15. Silva, J.A.; Crimi, M.; Palaia, T.; Ko, S.; Davenport, S. Field demonstration of polymer-amended in situ chemical oxidation (PA-ISCO). J. Contam. Hydrol. 2017, 199, 36. [Google Scholar] [CrossRef] [PubMed]
  16. Zhong, L.; Szecsody, J.; Oostrom, M.; Truex, M.; Shen, X.; Li, X. Enhanced remedial amendment delivery to subsurface using shear thinning fluid and aqueous foam. J. Hazard. Mater. 2011, 191, 249–257. [Google Scholar] [CrossRef] [PubMed]
  17. Silva, J.A.; Liberatore, M.; McCray, J.E. Characterization of Bulk Fluid and Transport Properties for Simulating Polymer-Improved Aquifer Remediation. J. Environ. Eng. 2013, 139, 149–159. [Google Scholar] [CrossRef]
  18. MacKinnon, L.; Thomson, N. Laboratory-scale in situ chemical oxidation of a perchloroethylene pool using permanganate. J. Contam. Hydrol. 2002, 56, 49–74. [Google Scholar] [CrossRef]
  19. Zhong, L.; Oostrom, M.; Wietsma, T.; Covert, M. Covert, Enhanced remedial amendment delivery through fluid viscosity modifications: Experiments and numerical simulations. J. Contam. Hydrol. 2008, 101, 29–41. [Google Scholar] [CrossRef] [PubMed]
  20. Lian, J.; Fu, Y.; Guo, C.; He, Y.; Qin, C. Performance of polymer-enhanced KMnO4 delivery for remediation of TCE contaminated heterogeneous aquifer: A bench-scale visualization. J. Contam. Hydrol. 2019, 225, 103507. [Google Scholar] [CrossRef] [PubMed]
Figure 1. Schematic diagram of the experimental device. 1. Tank 2. Metal plate with holes 3. Metal mesh 4. Pressure hole 5. Pressure measuring tube. 6. Overflow hole 7. Glass ball, 8. Iron frame 9. Outlet pipe 10. Beaker 11. Outlet hole.
Water 14 02630 g001
Figure 2. 2D-flow cell design. (a) Schematic diagram of the experimental device. (b) Details of the 2D-flow cell design drawing.
Water 14 02630 g002
Figure 3. Transmission of xanthan gum in heterogeneous media. (a) Coarse sand/fine sand; (b) medium sand/fine sand.
Water 14 02630 g003aWater 14 02630 g003b
Figure 4. Variation on average maximum migration distance during injection of xanthan gum solution. (a) Coarse sand/fine sand; (b): medium sand/fine sand.
Water 14 02630 g004
Figure 5. Variation in the migration front difference during injection. (a) Coarse sand/fine sand; (b): medium sand/fine sand.
Water 14 02630 g005
Figure 6. Quantitative relationship between permeability reduction and adsorption amount.
Water 14 02630 g006
Figure 7. Static adsorption of xanthan gum in various media.
Water 14 02630 g007
Figure 8. Hydraulic conductivity decrease rate and hydraulic conductivity decrease ratio vs. xanthan gum concentration. (a) Drate of each media, (b) Dratio of each combination.
Water 14 02630 g008
Figure 9. Relationship between the transmission uniformity control coefficient and hydraulic conductivity decrease ratio.
Water 14 02630 g009
Table 1. Viscosity for xanthan at different concentrations.
Xanthan (mg/L)010015020025030035040060080010001200
Viscosity (cP)1.002.883.664.806.006.667.628.5211.6414.4017.7623.22
Table 2. Rheological equation of xanthan gum solution with different concentrations.
Xanthan (mg/L) τ y   ( Pa ) KcnRheological EquationR2
1000.6060.5980.995 τ = 0.606 + 0.598 γ 0.995 0.99667
2000.5980.5810.988 τ = 0.598 + 0.581 γ 0.988 0.99700
4000.9600.8950.984 τ = 0.960 + 0.895 γ 0.984 0.98821
6001.7471.4960.988 τ = 1.747 + 1.496 γ 0.988 0.99666
12002.6612.2220.978 τ = 2.661 + 2.222 γ 0.978 0.98383
Notes: Kc: Consistency coefficient, n: Rheological behavior coefficient.
Table 3. Physical properties and Hydraulic conductivity of each medium.
(a) Physical properties of each medium
MediaParticle Size (mm)Unit Weight (N/cm3)Pore Volume (mL)Porosity (%)
Coarse sand0.841~20.015571234.2
Medium sand0.42~0.8410.015172034.6
Fine sand0.25~0.420.014675236.2
(b) Hydraulic conductivity of different medium under pure water injection
MediaK (cm/s) K ¯ (cm/s)σ
123456
Coarse sand1.14041.16770.92060.87760.92941.27391.05160.1632
Medium sand0.11950.1080.11220.10870.10620.13670.11520.0115
Fine sand0.02850.0280.02710.02740.0270.02270.02680.0021
Table 4. Permeability contrast of three heterogeneous media combinations.
Combination MediaCoarse Sand/Fine SandCoarse Sand/Medium SandMedium Sand/Fine Sand
kbs41.278.904.63
R039.269.134.30
U01.001.001.00
Table 5. Transmission uniformity control coefficients of each medium.
(a) Transmission uniformity control coefficients corresponding to different xanthan gum concentrations
Xanthan (mg/L)01002004008001200
Rcfp41.2733.7432.6142.29216.26262.48
Ucf1.001.221.270.980.190.16
Rmfp4.631.902.033.2911.3820.53
Umf1.002.442.281.410.410.23
Rcmp2.2617.7916.0812.8719.0012.79
Ucm1.000.500.140.180.120.18
(b) Standard deviations for medias’ hydraulic conductivity under different xanthan concentration
Mediaσ
0 mg/L100 mg/L200 mg/L400 mg/L800 mg/L1200 mg/L
Coarse sand 1.63 × 10 1 1.42 × 10 1 6.12 × 10 2 8.64 × 10 3 5.34 × 10 3 2.35 × 10 3
Medium sand 1.15 × 10 2 2.98 × 10 3 1.91 × 10 3 1.31 × 10 2 4.85 × 10 4 4.85 × 10 4
Fine sand 2.10 × 10 3 6.13 × 10 4 4.02 × 10 4 1.95 × 10 4 2.89 × 10 5 3.21 × 10 6
Publisher’s Note: MDPI stays neutral with regard to jurisdictional claims in published maps and institutional affiliations.

