
Impact of Data Temporal Resolution on Quantifying Residential End Uses of Water


Abstract
:1. Introduction
2. Materials and Methods
2.1. Study Sites
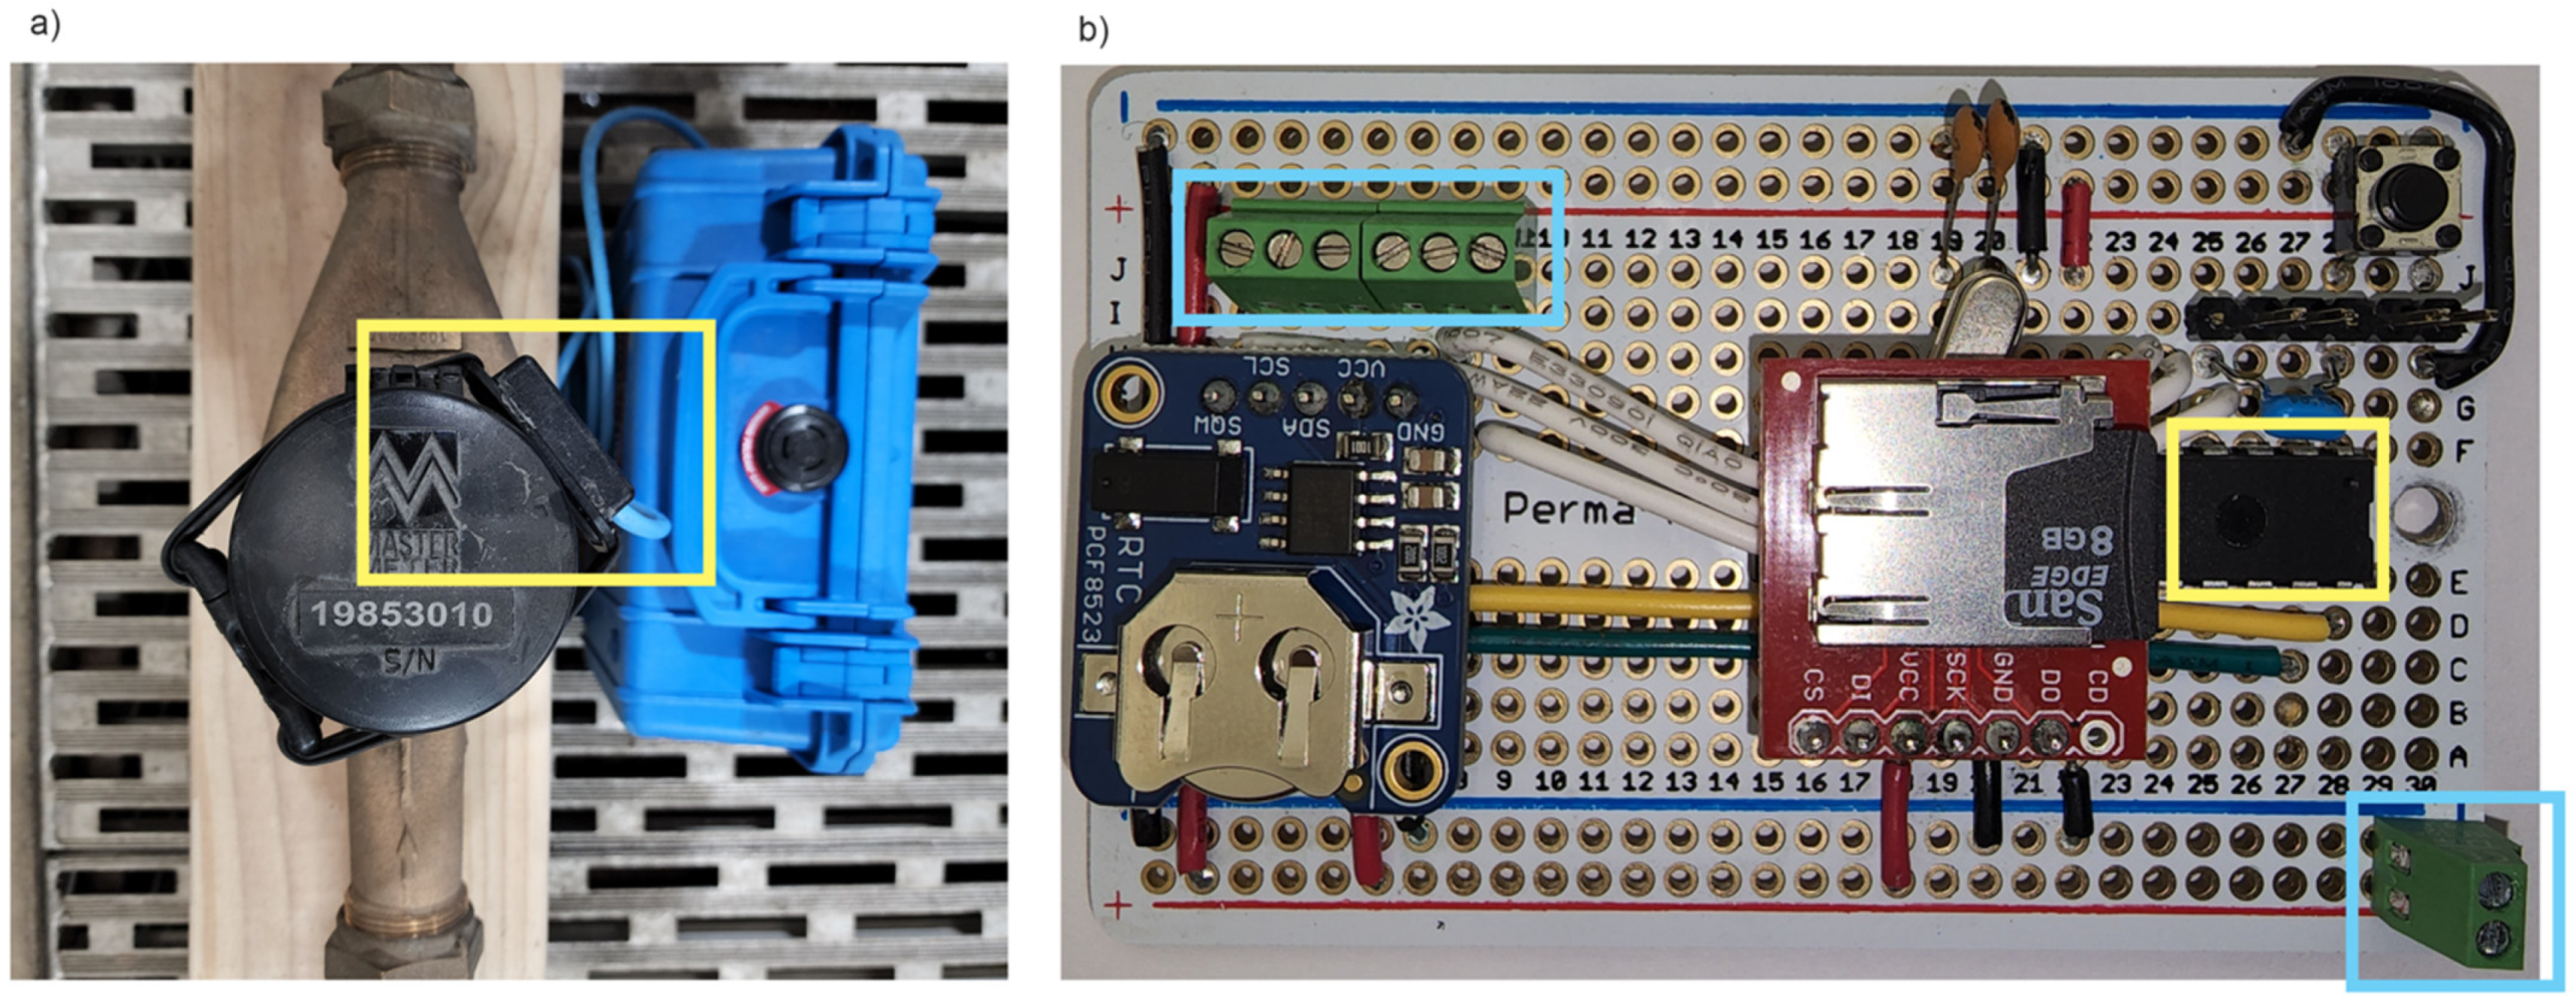
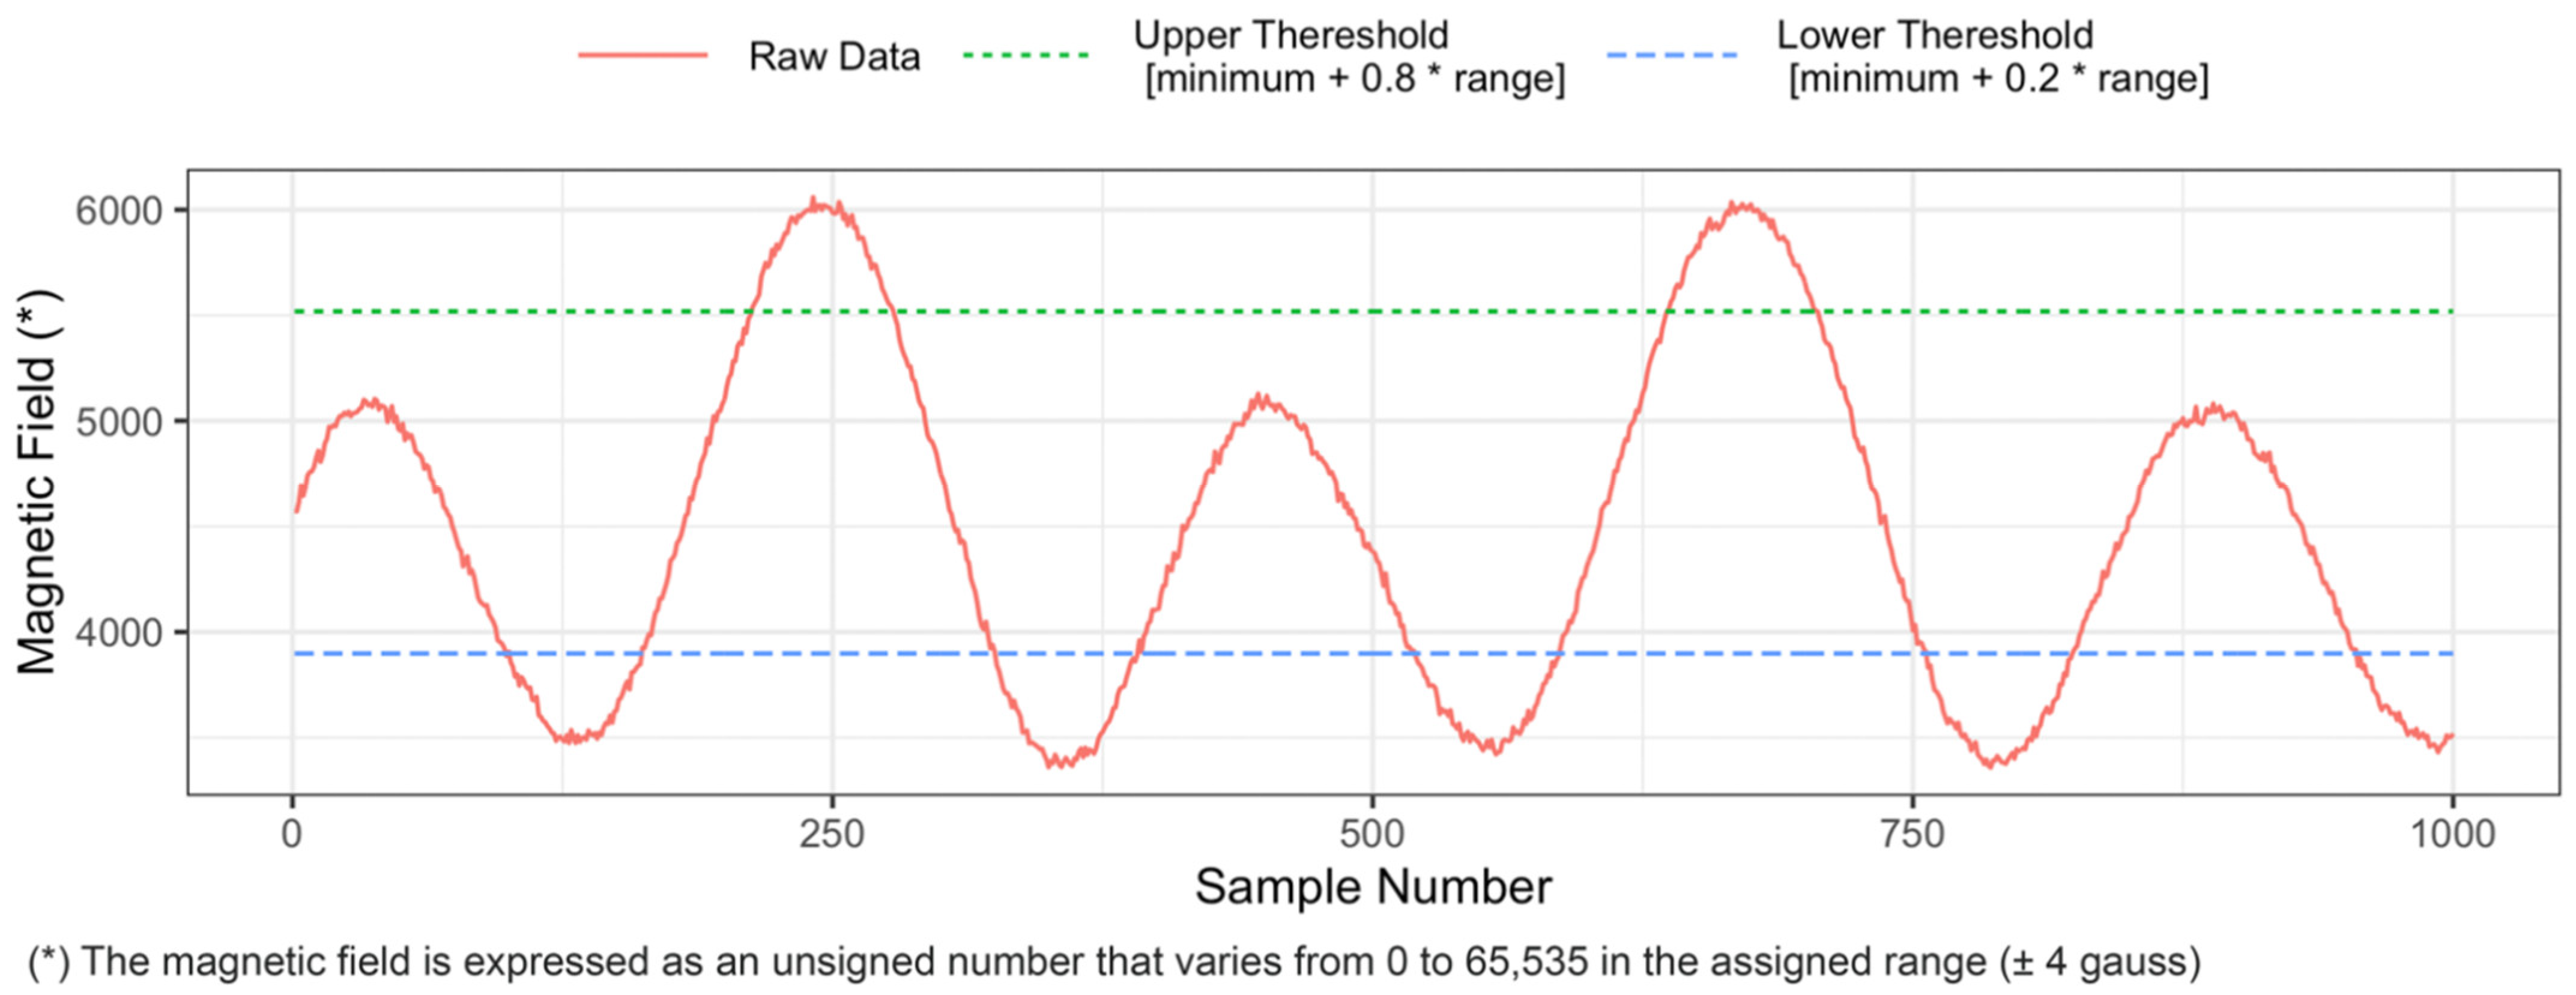
2.2. Data Collection
2.3. Data Analyses
3. Results and Discussion
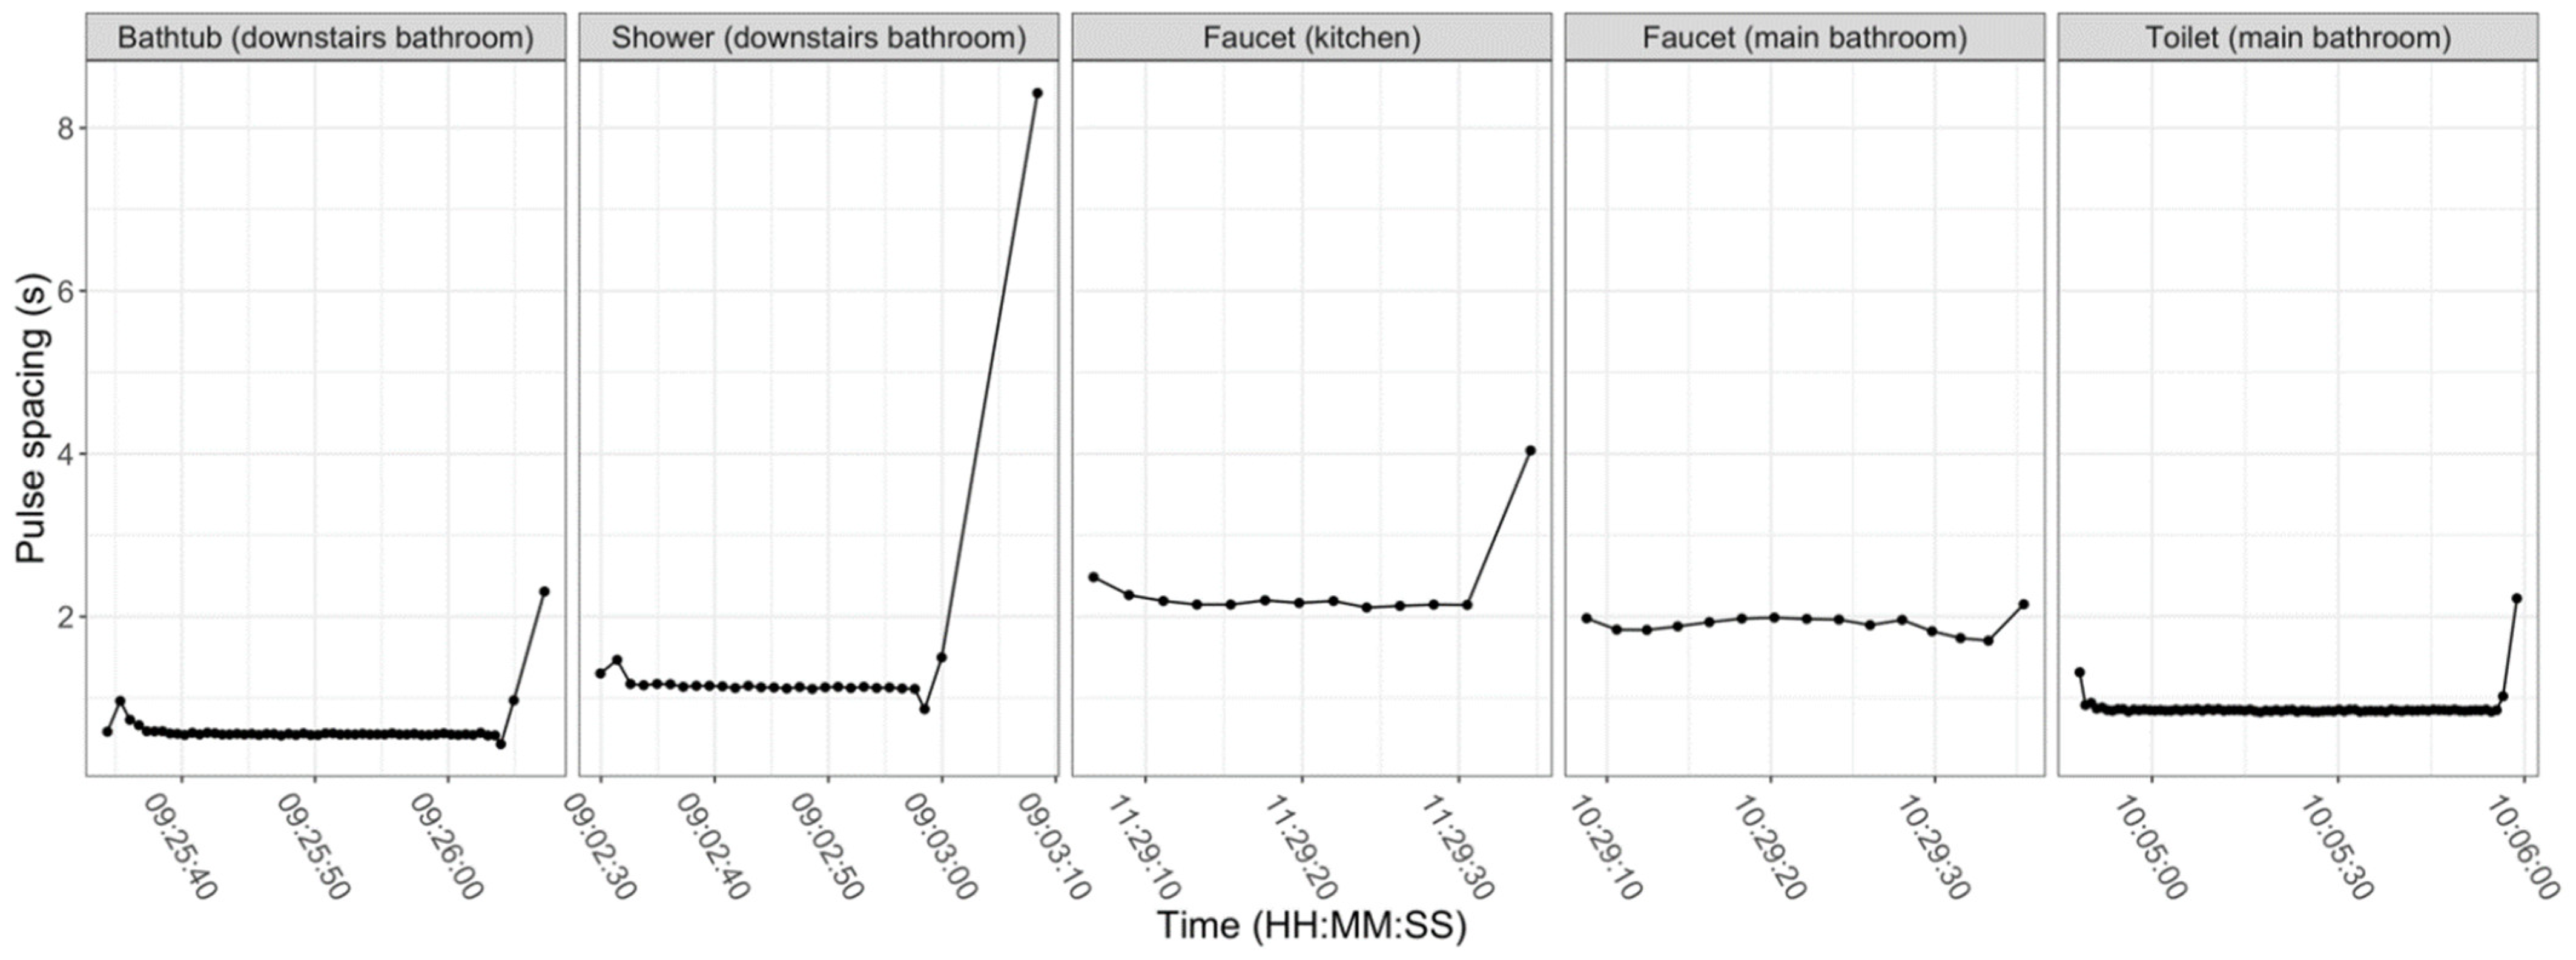
3.1. Separation of Events
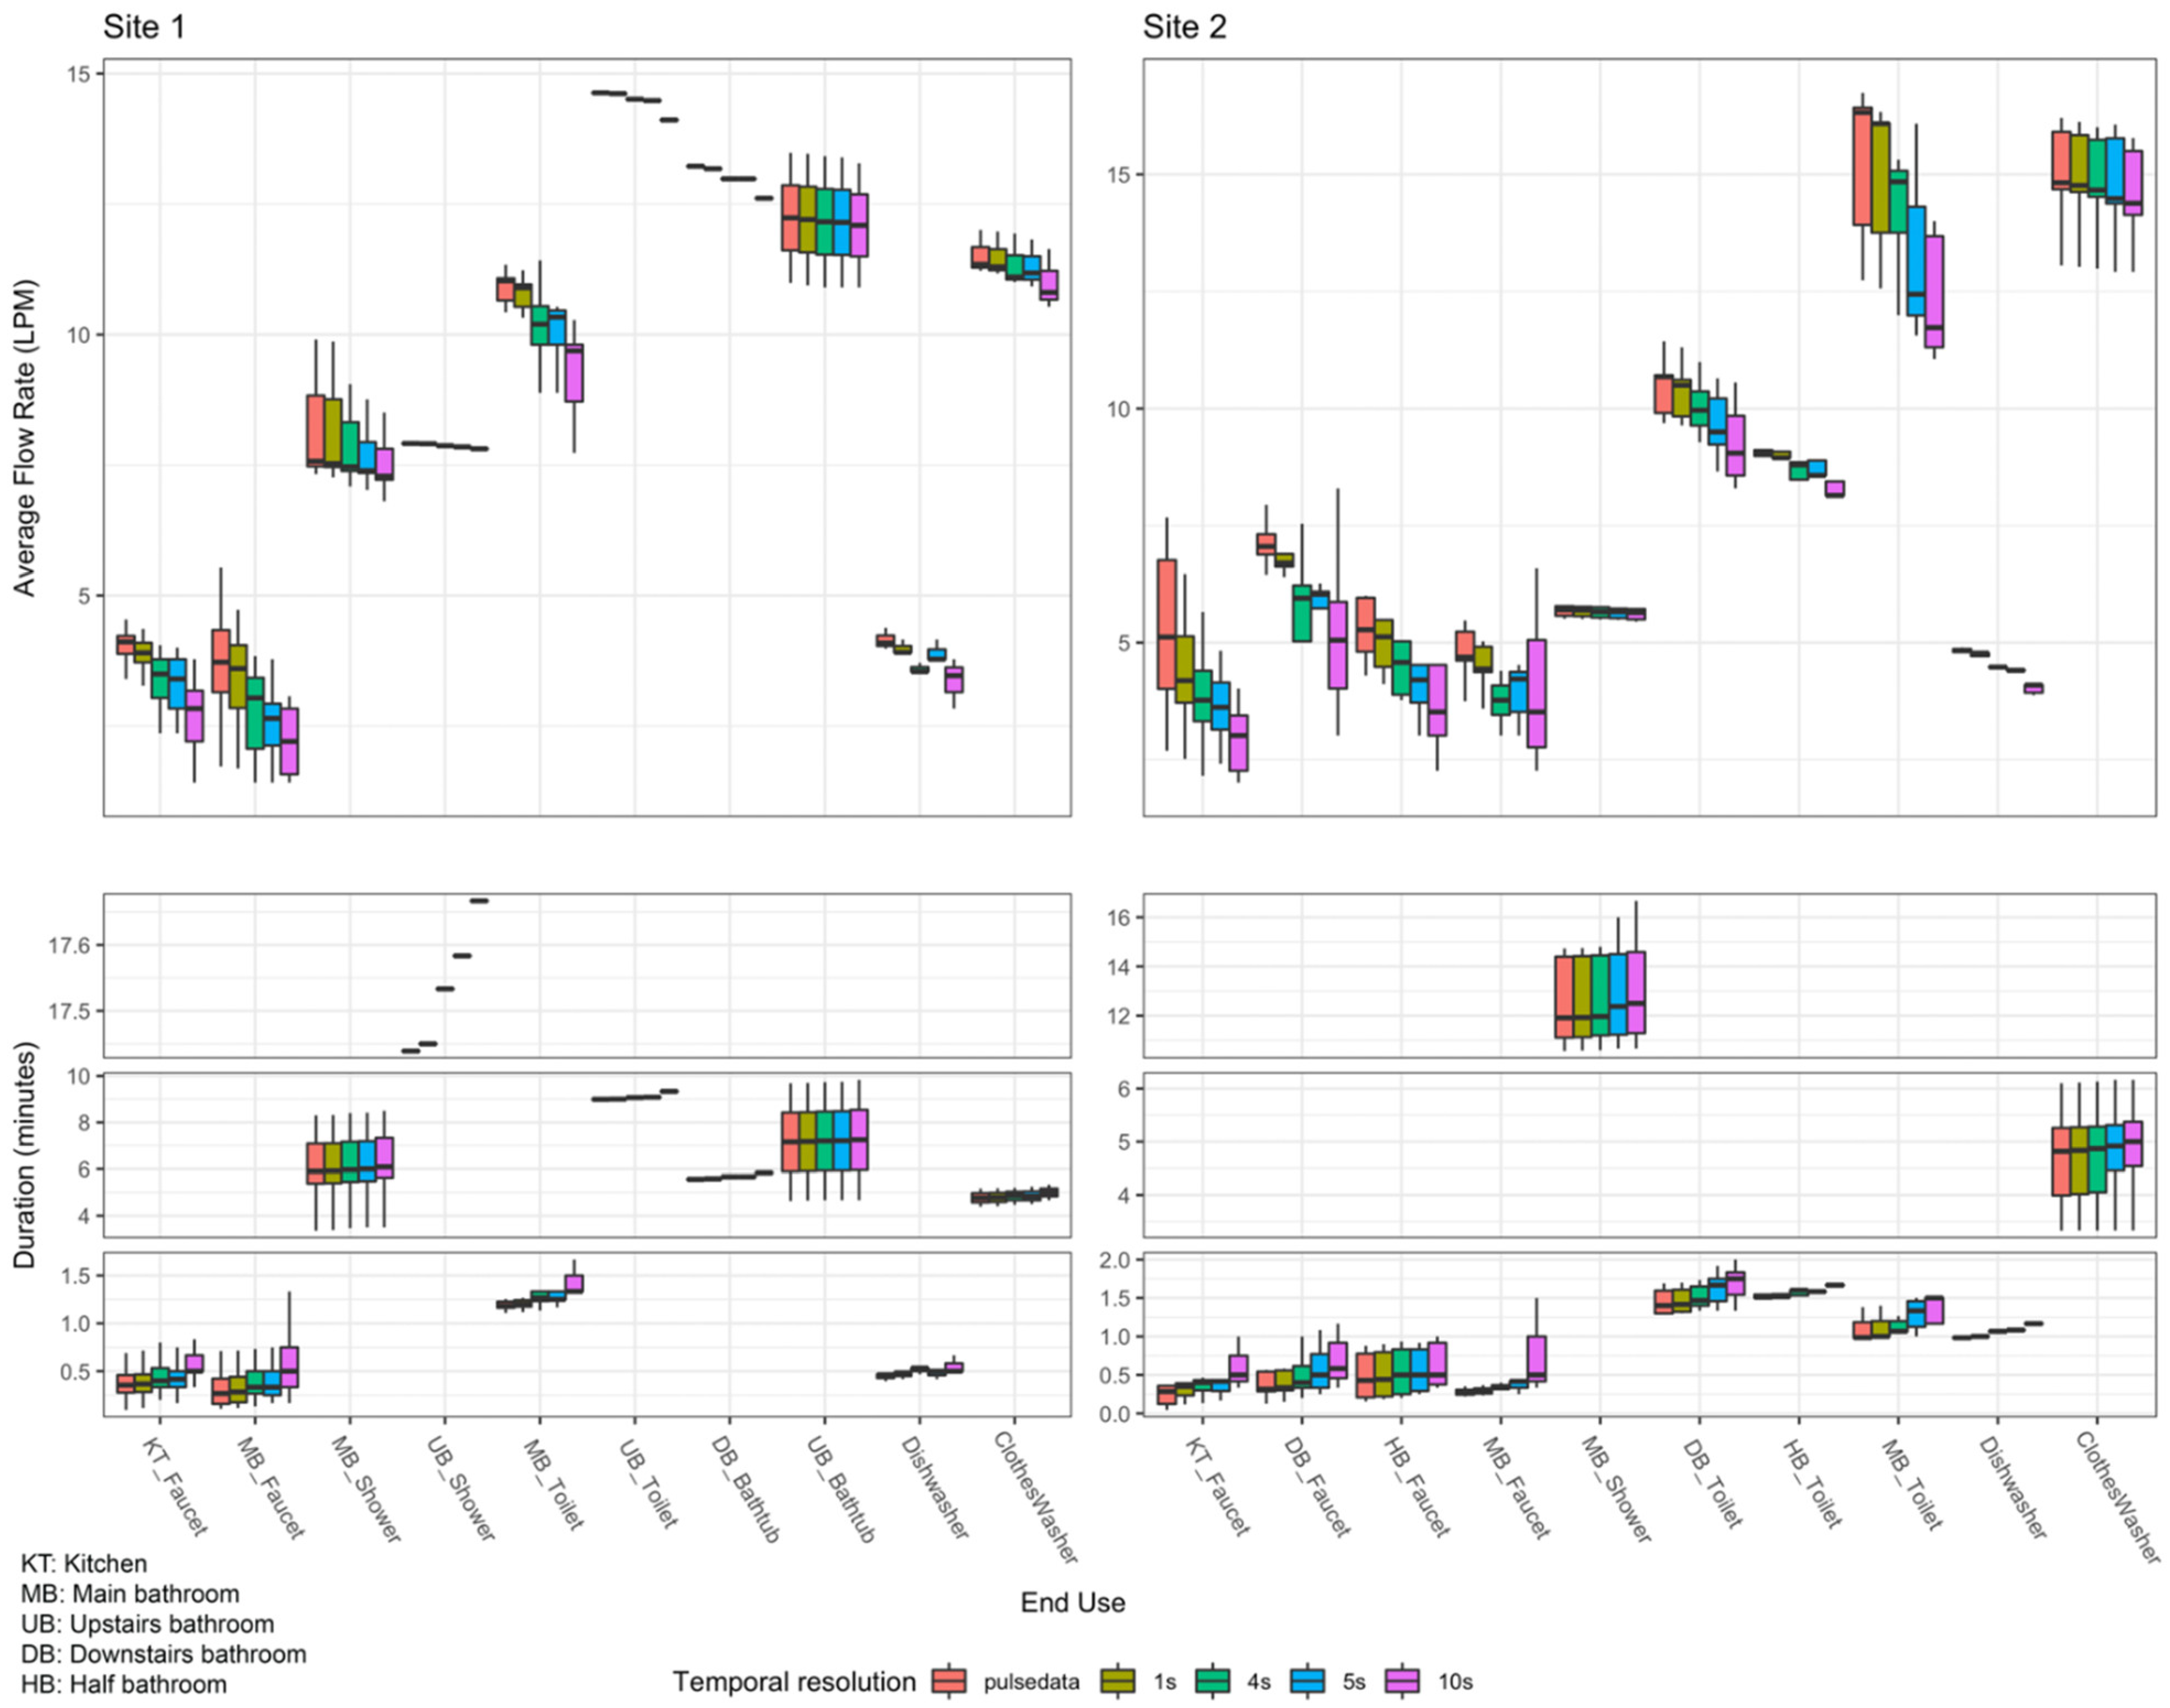
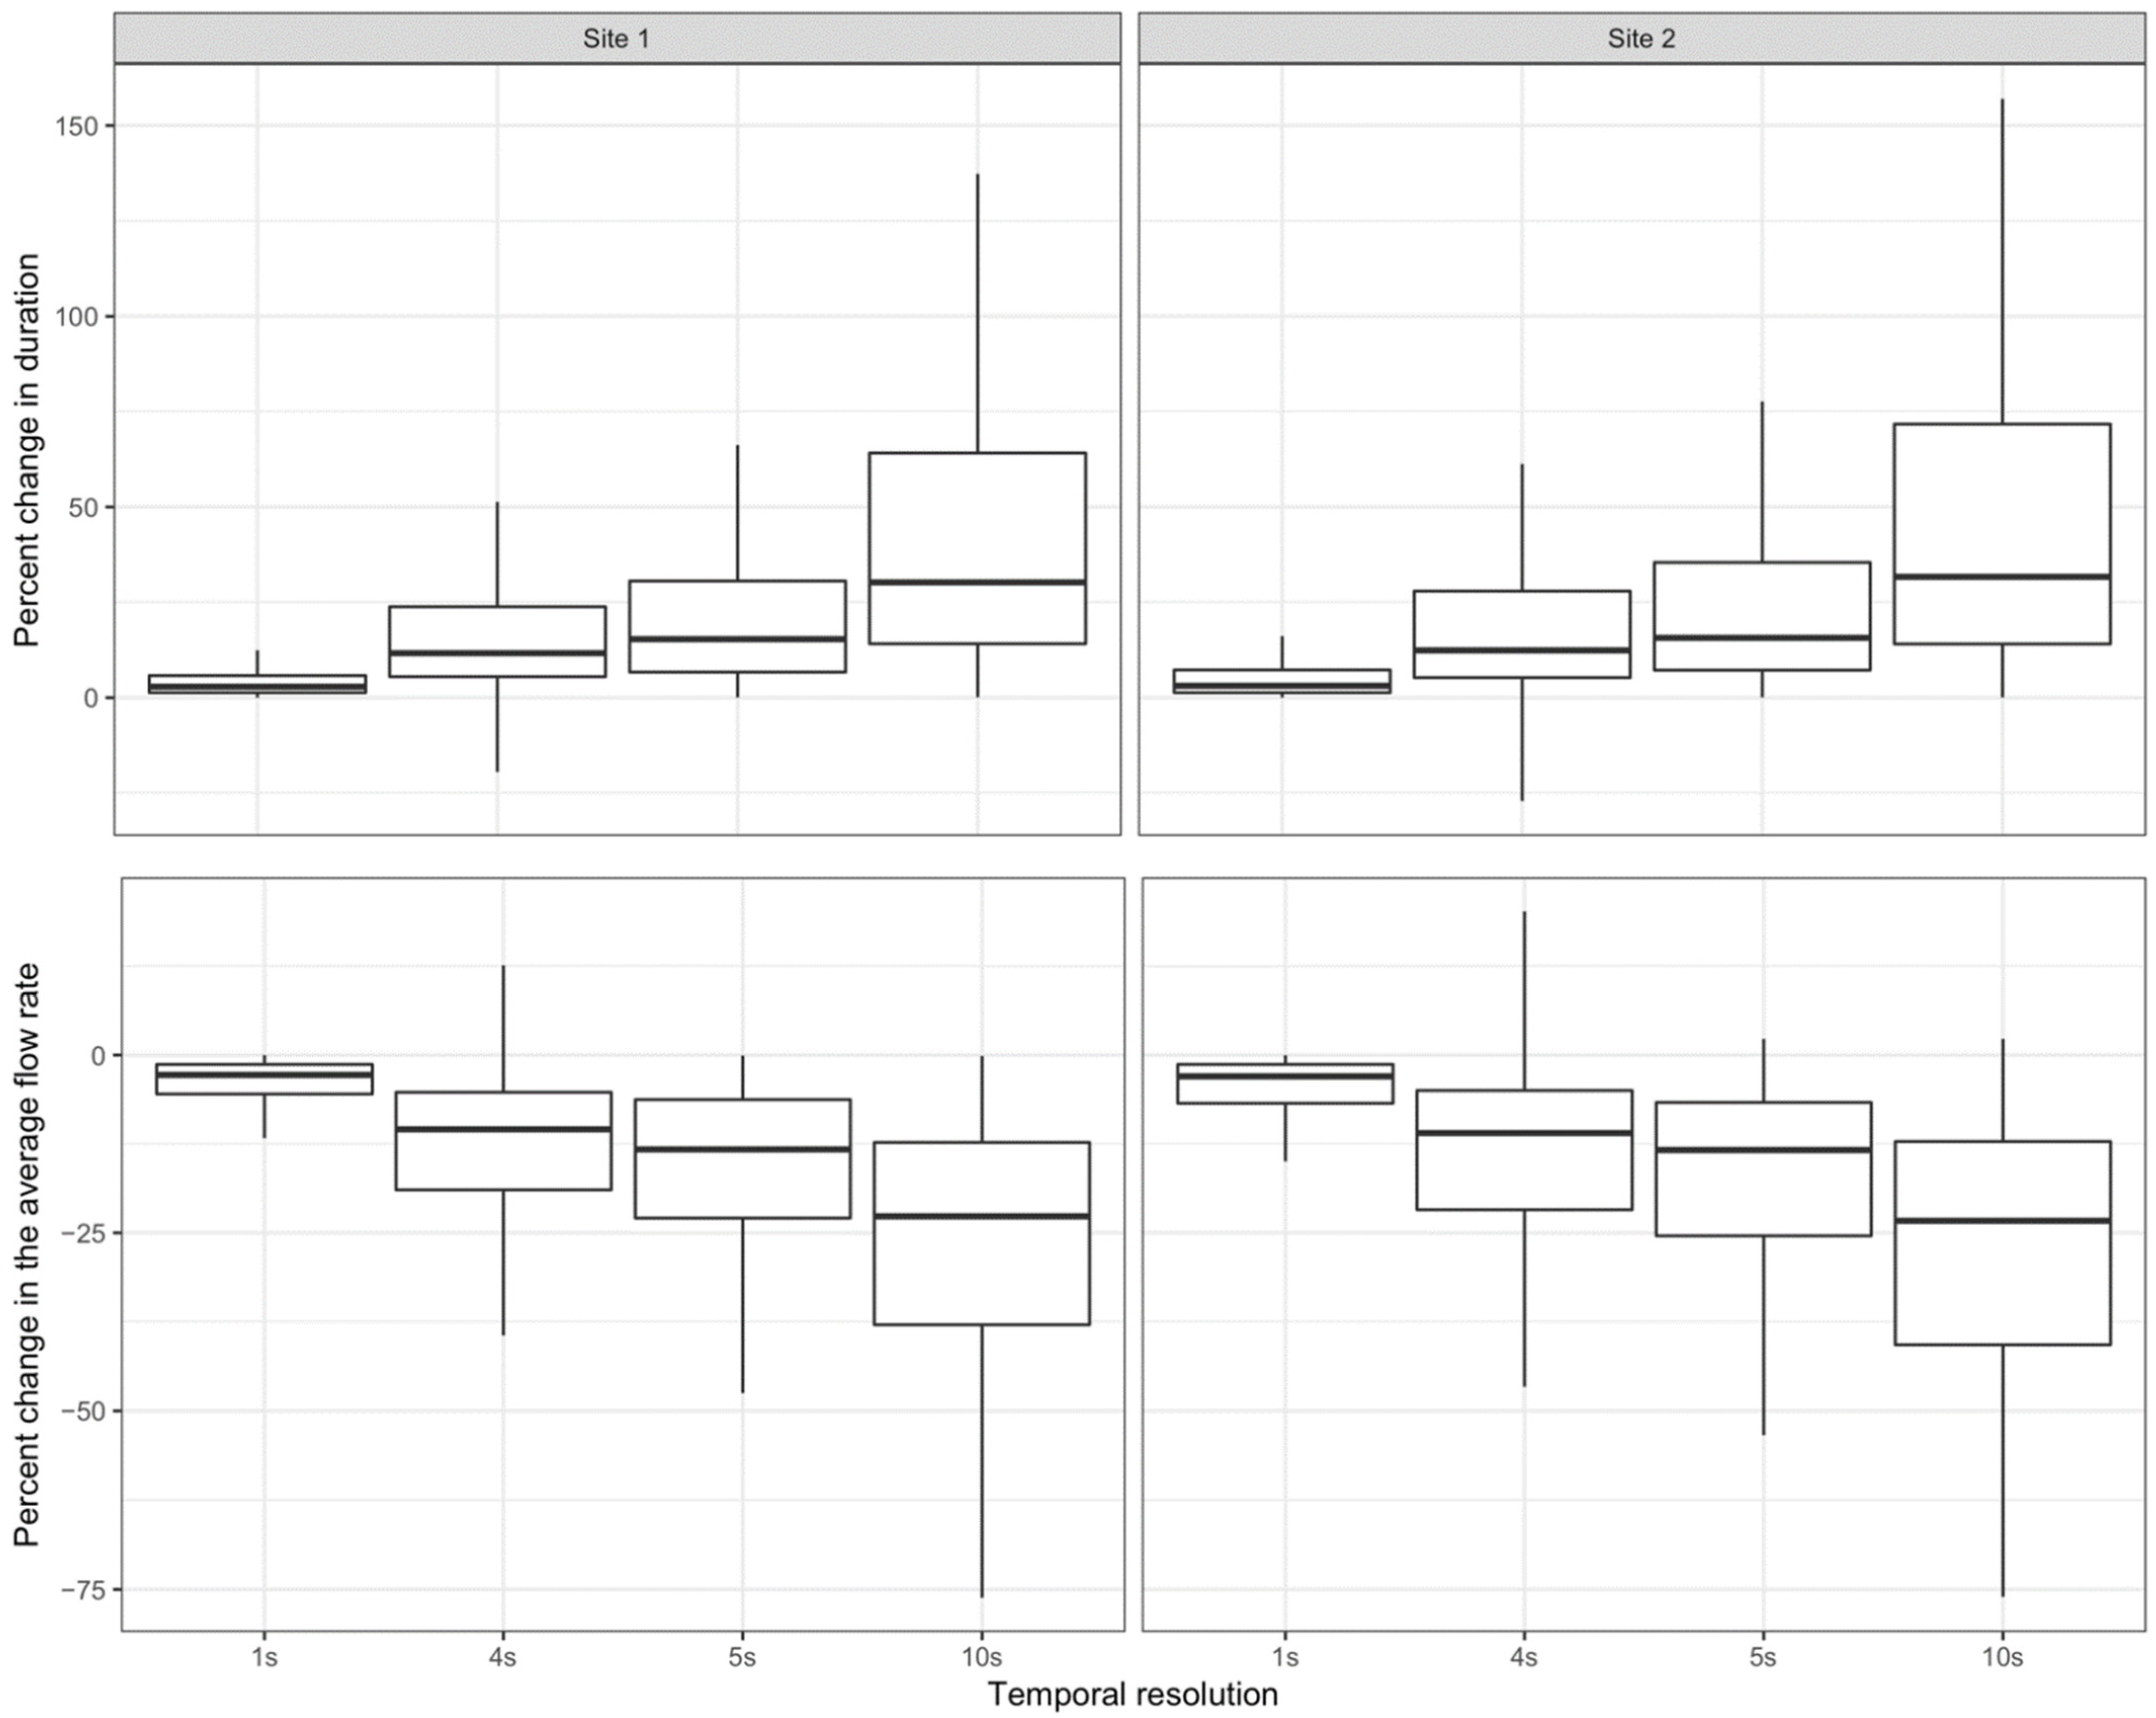
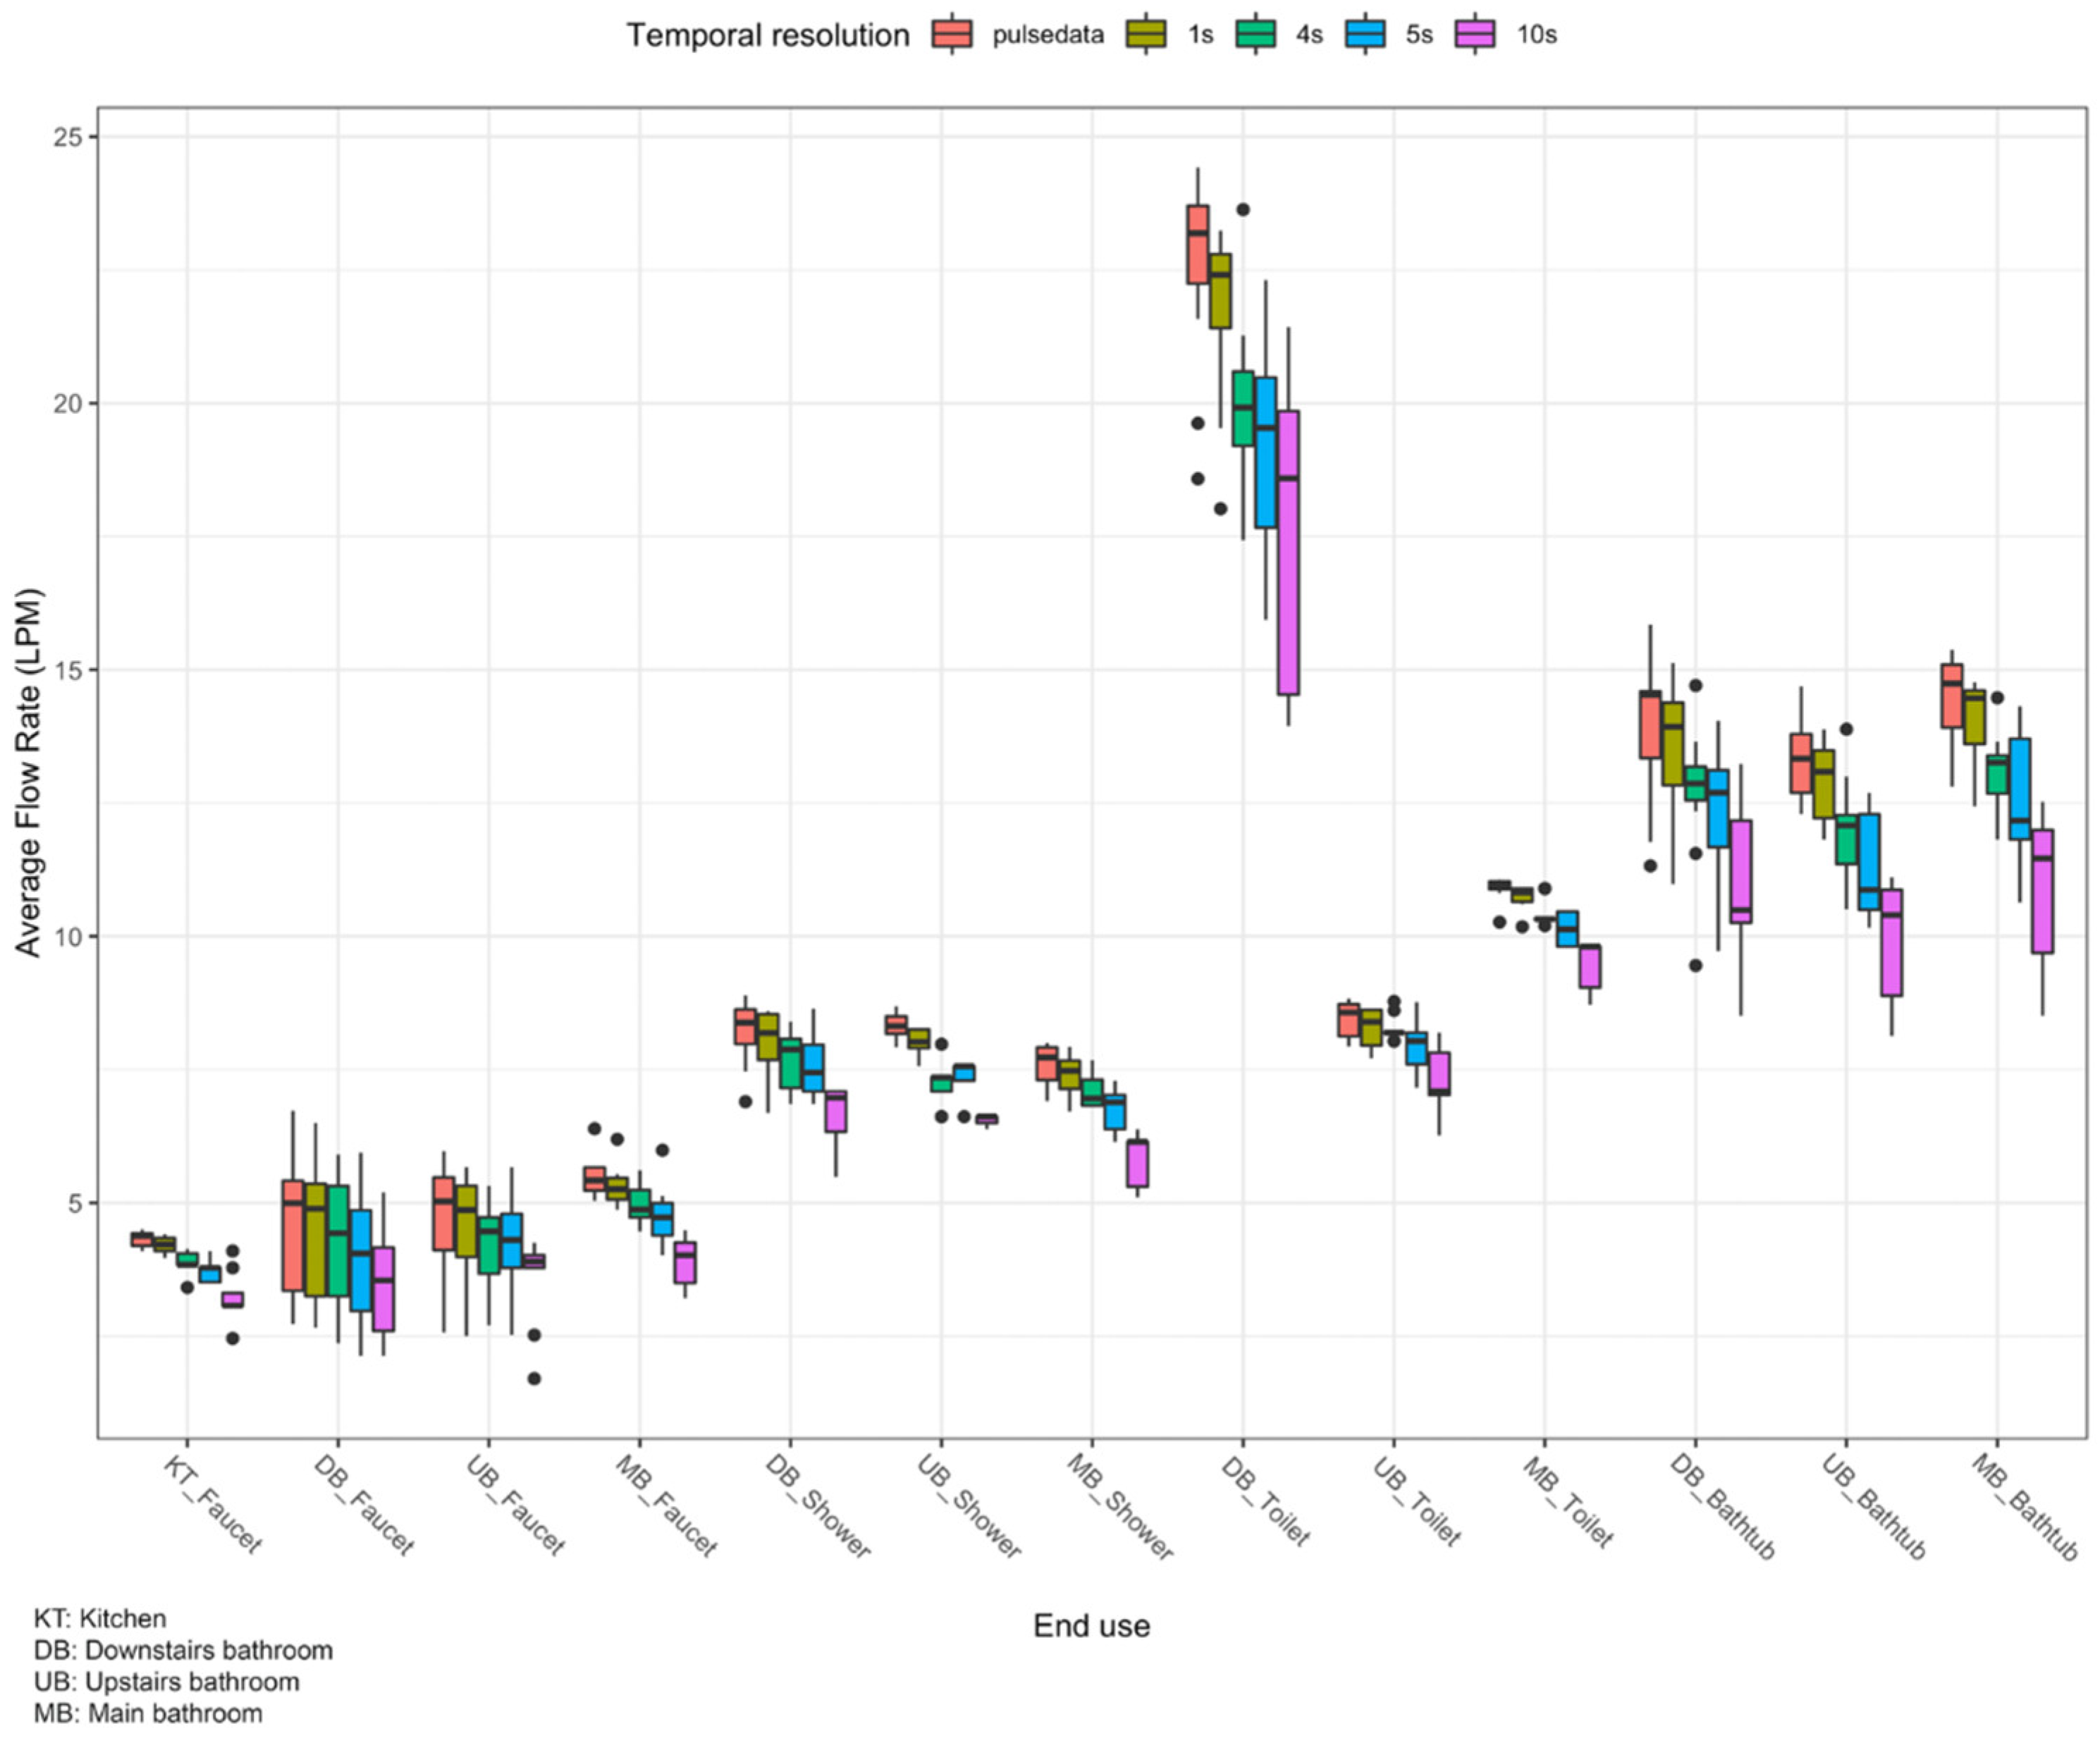
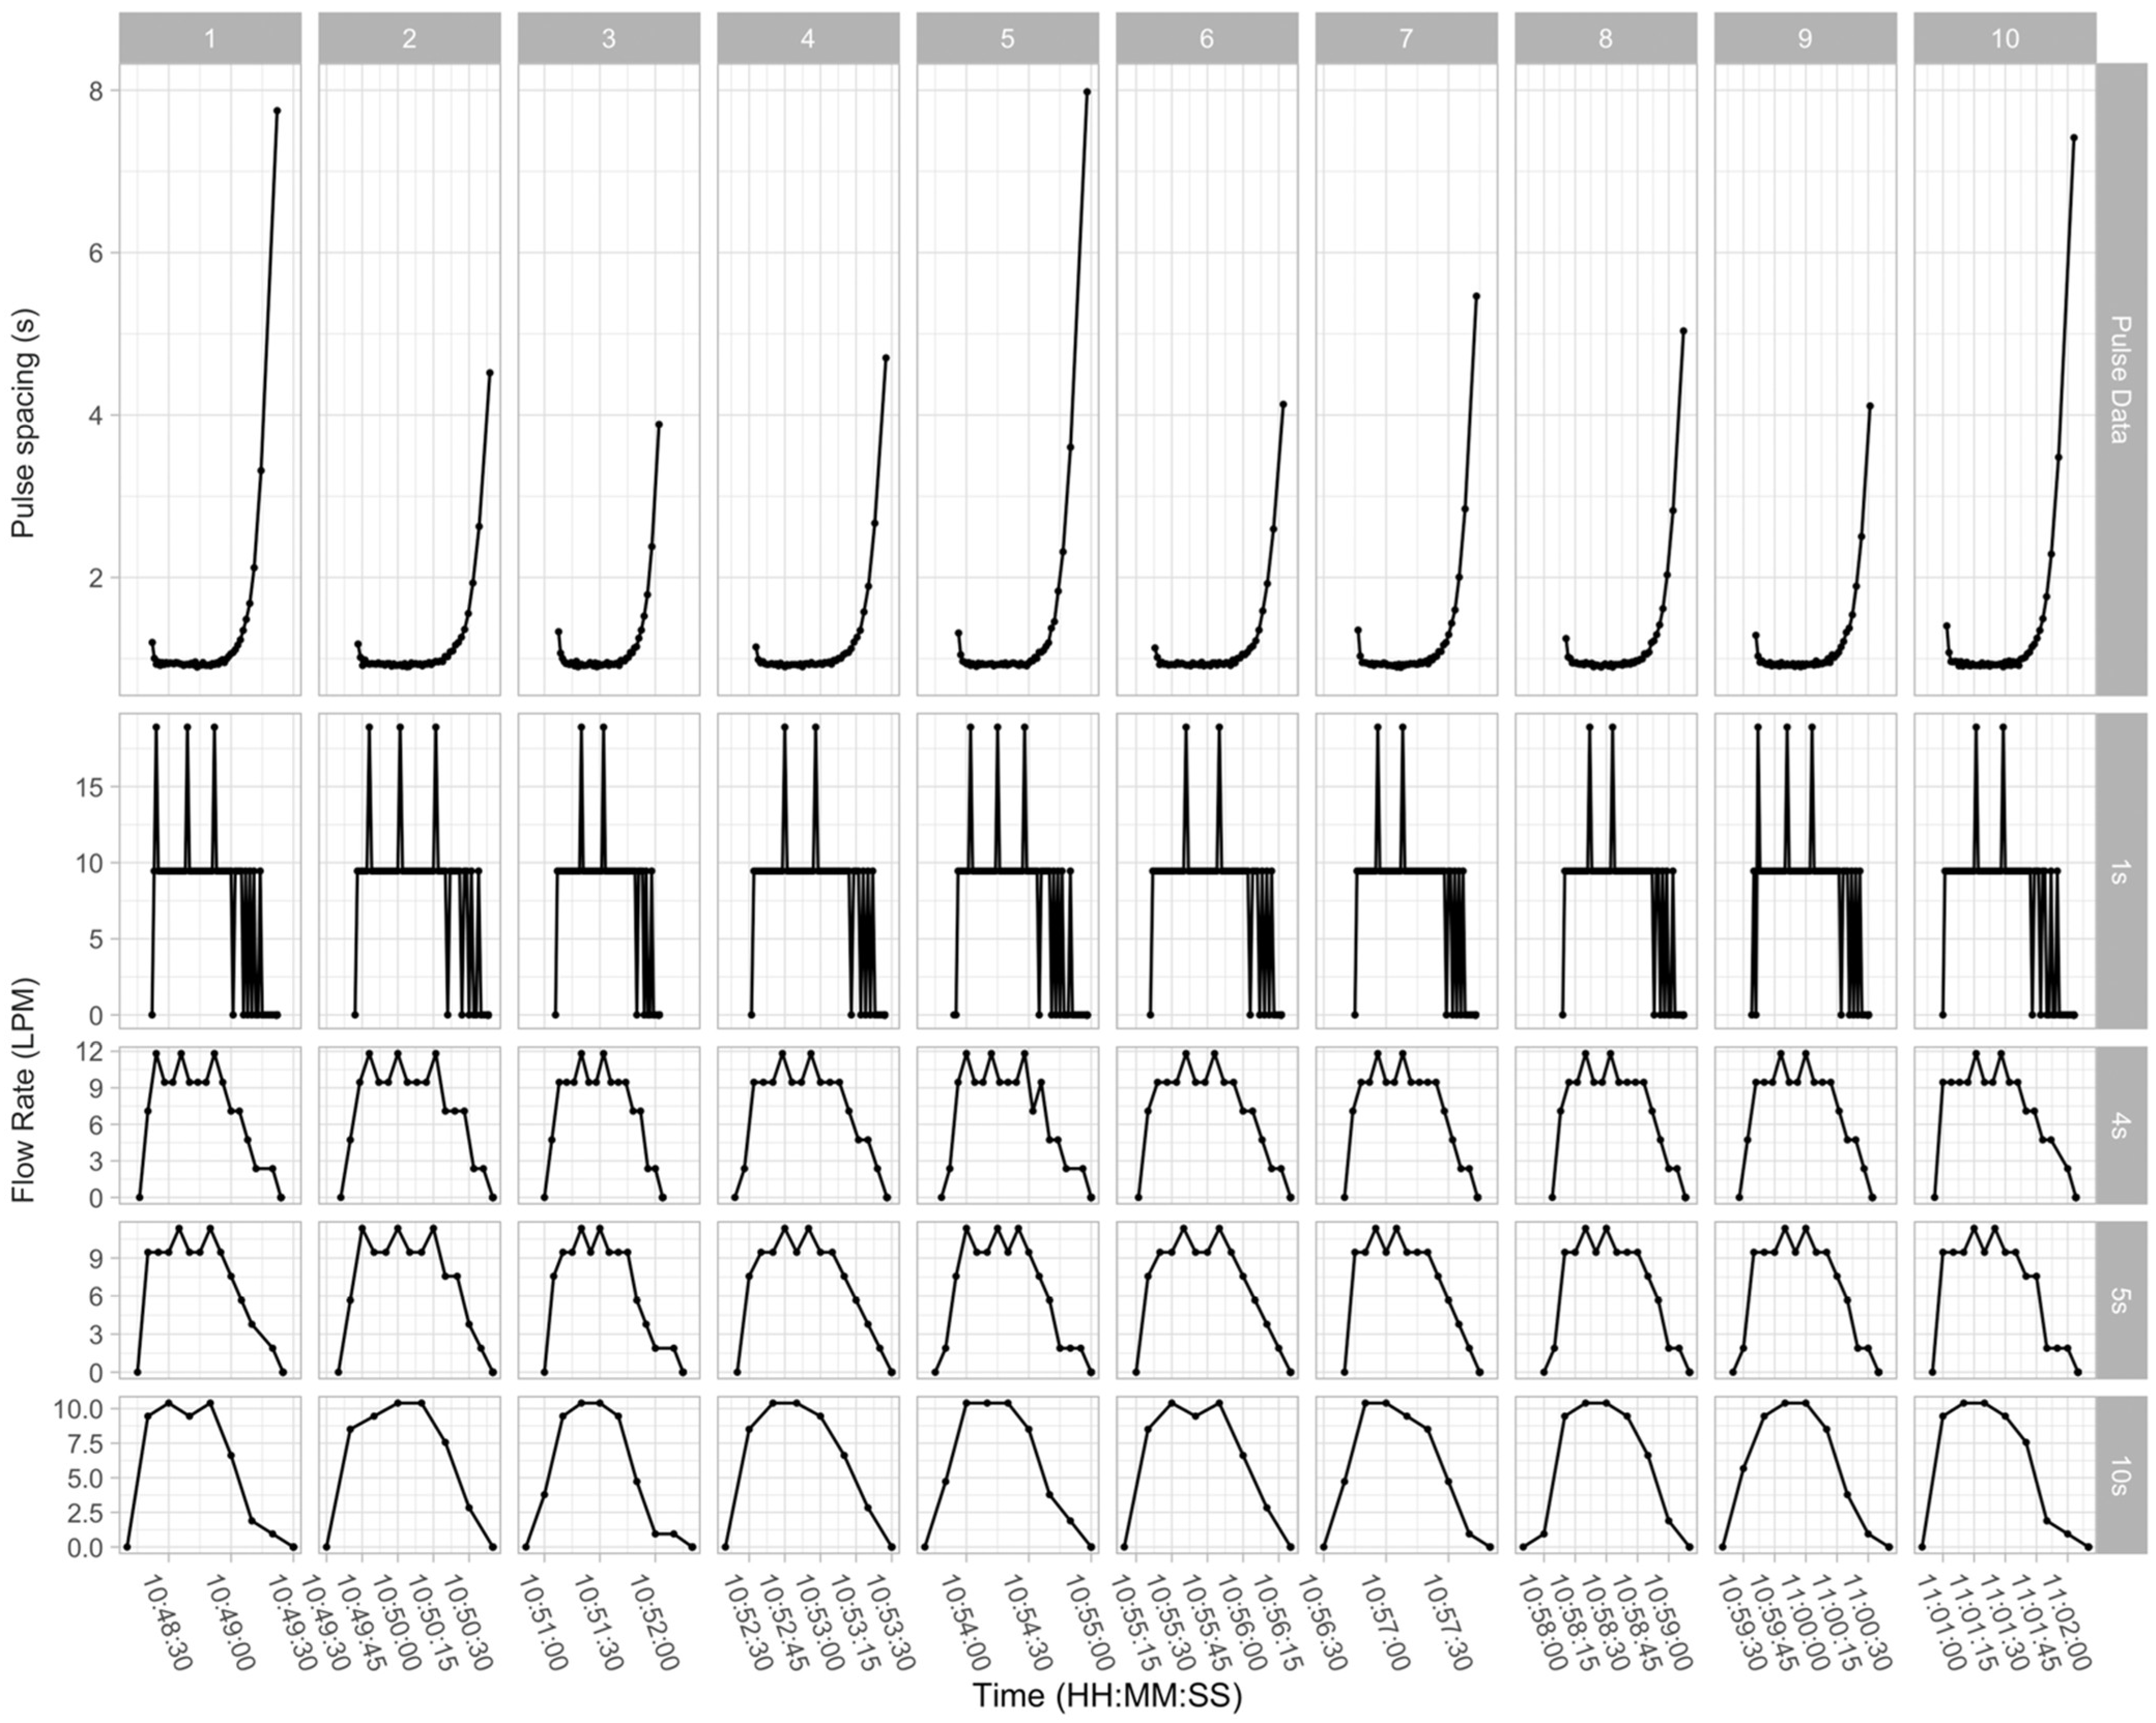
3.2. Analysis of Event Features
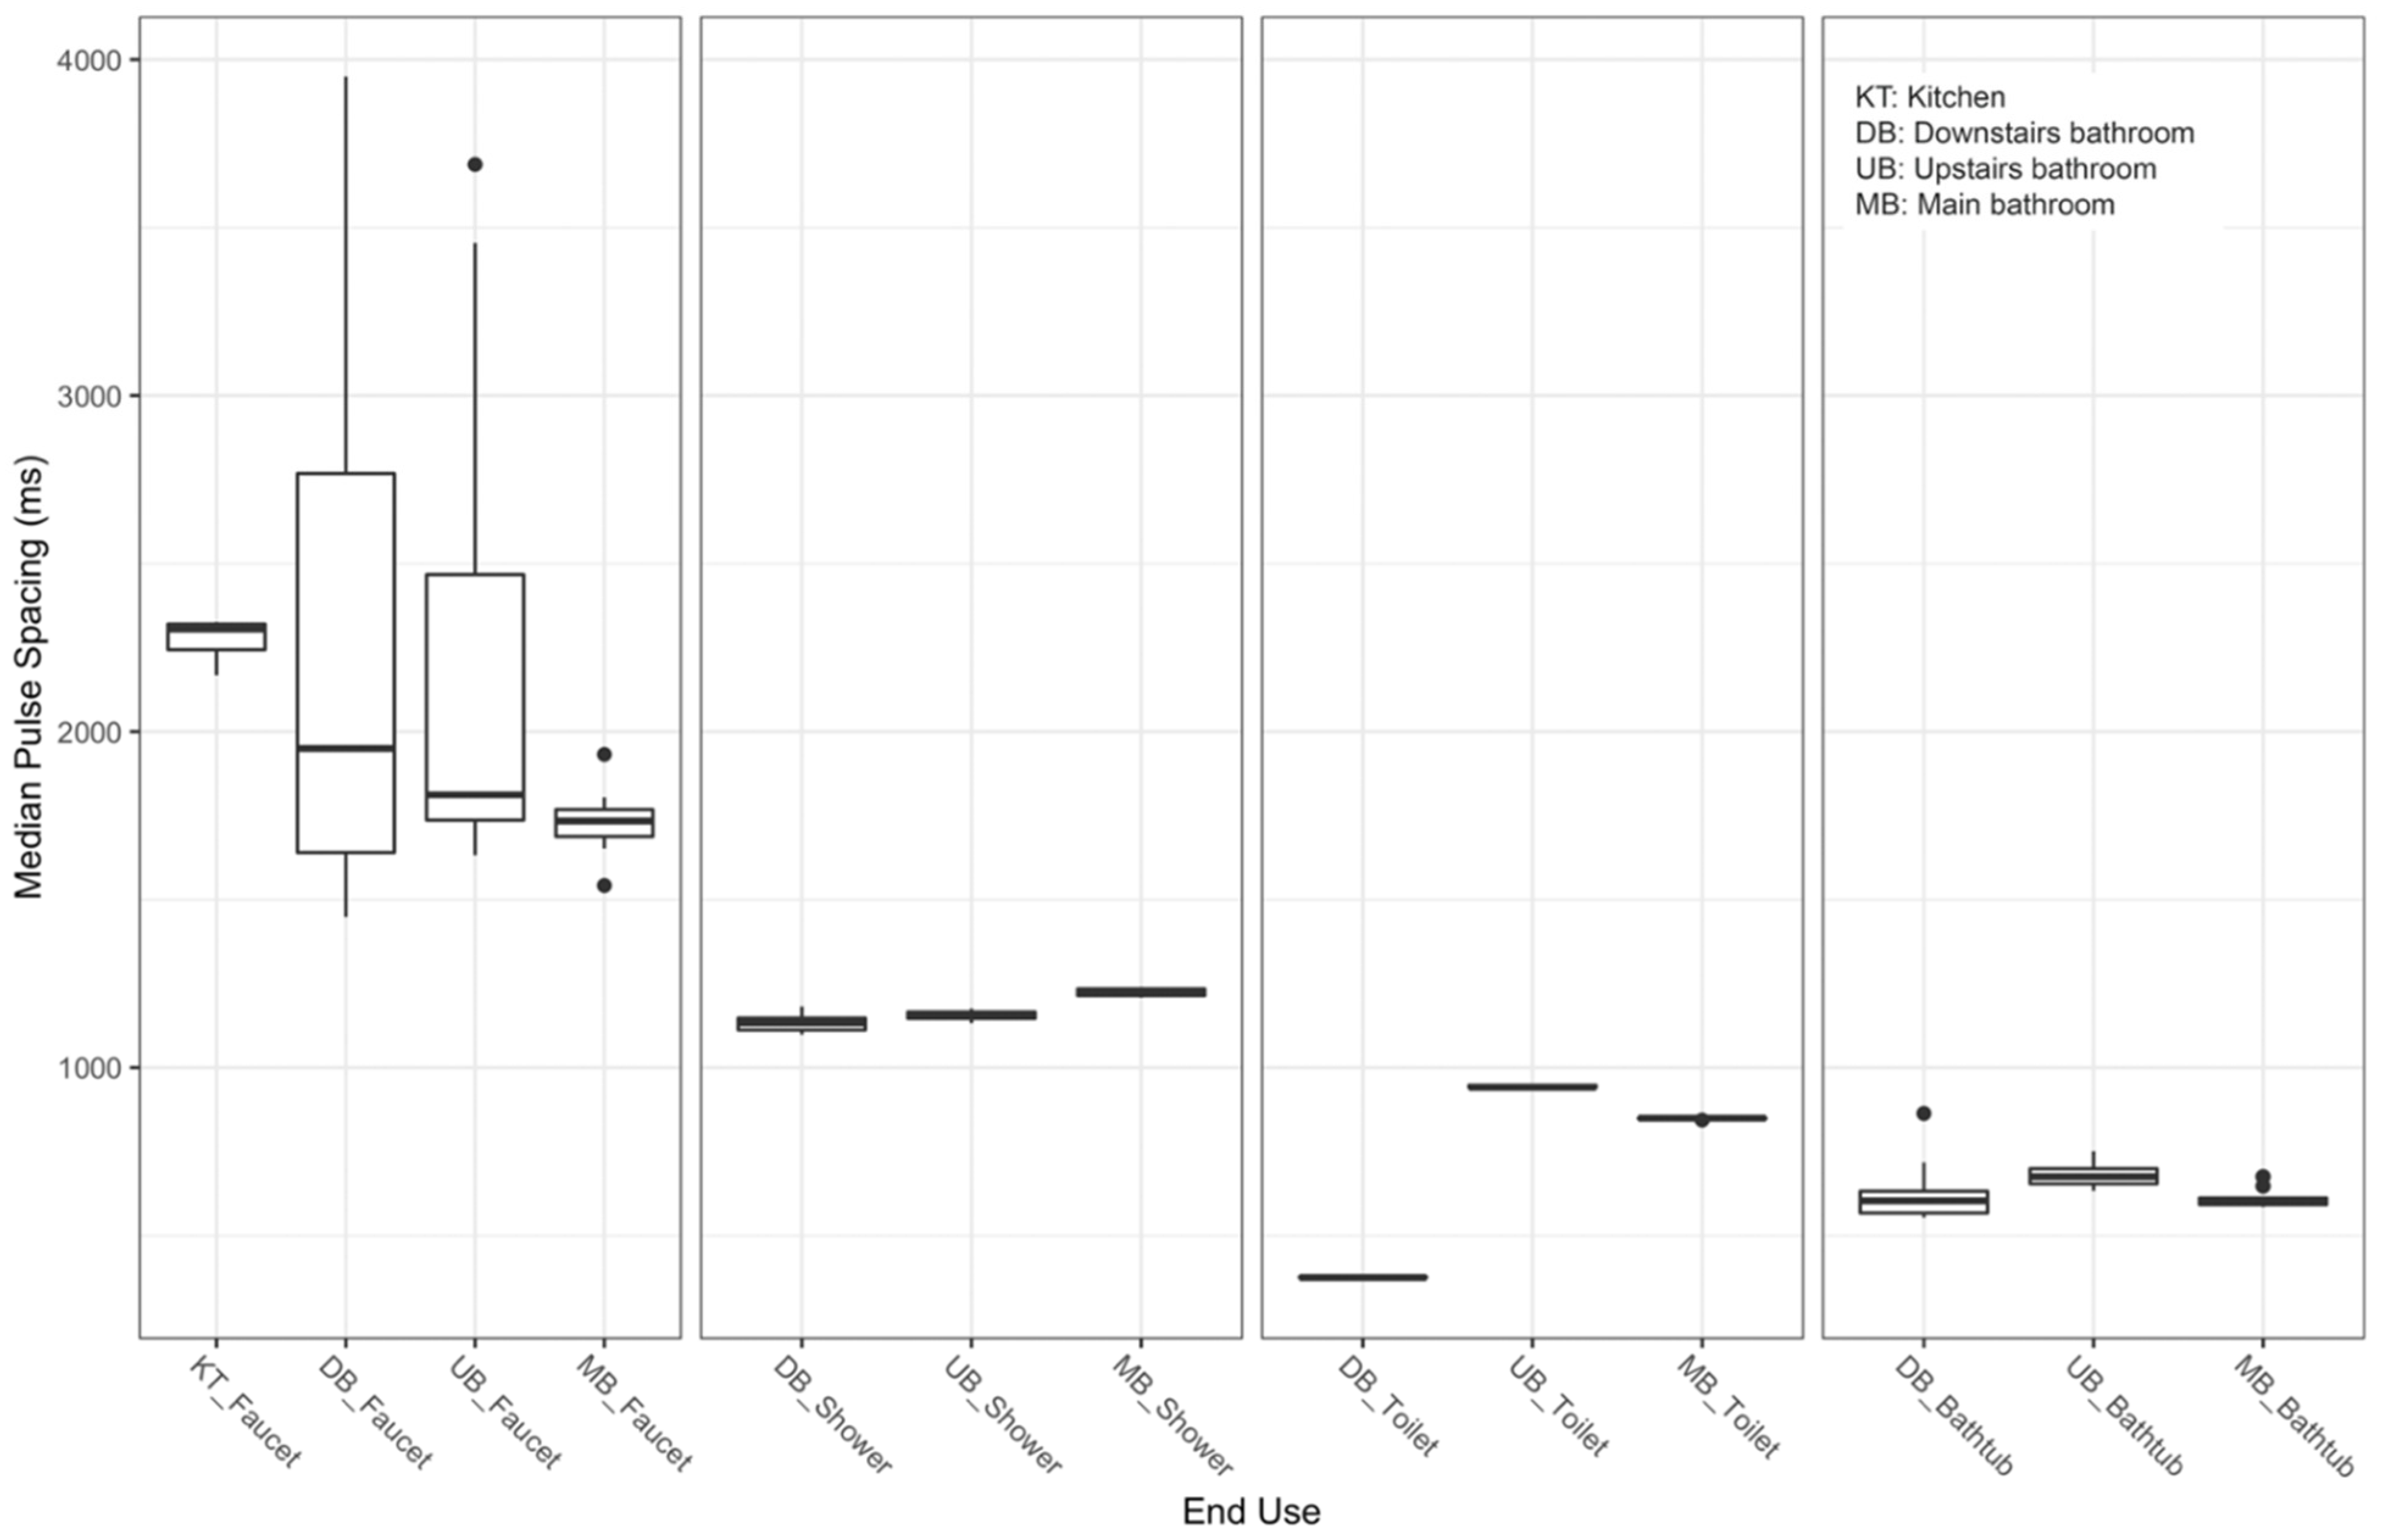
3.3. Event Features Extracted from Pulse Data
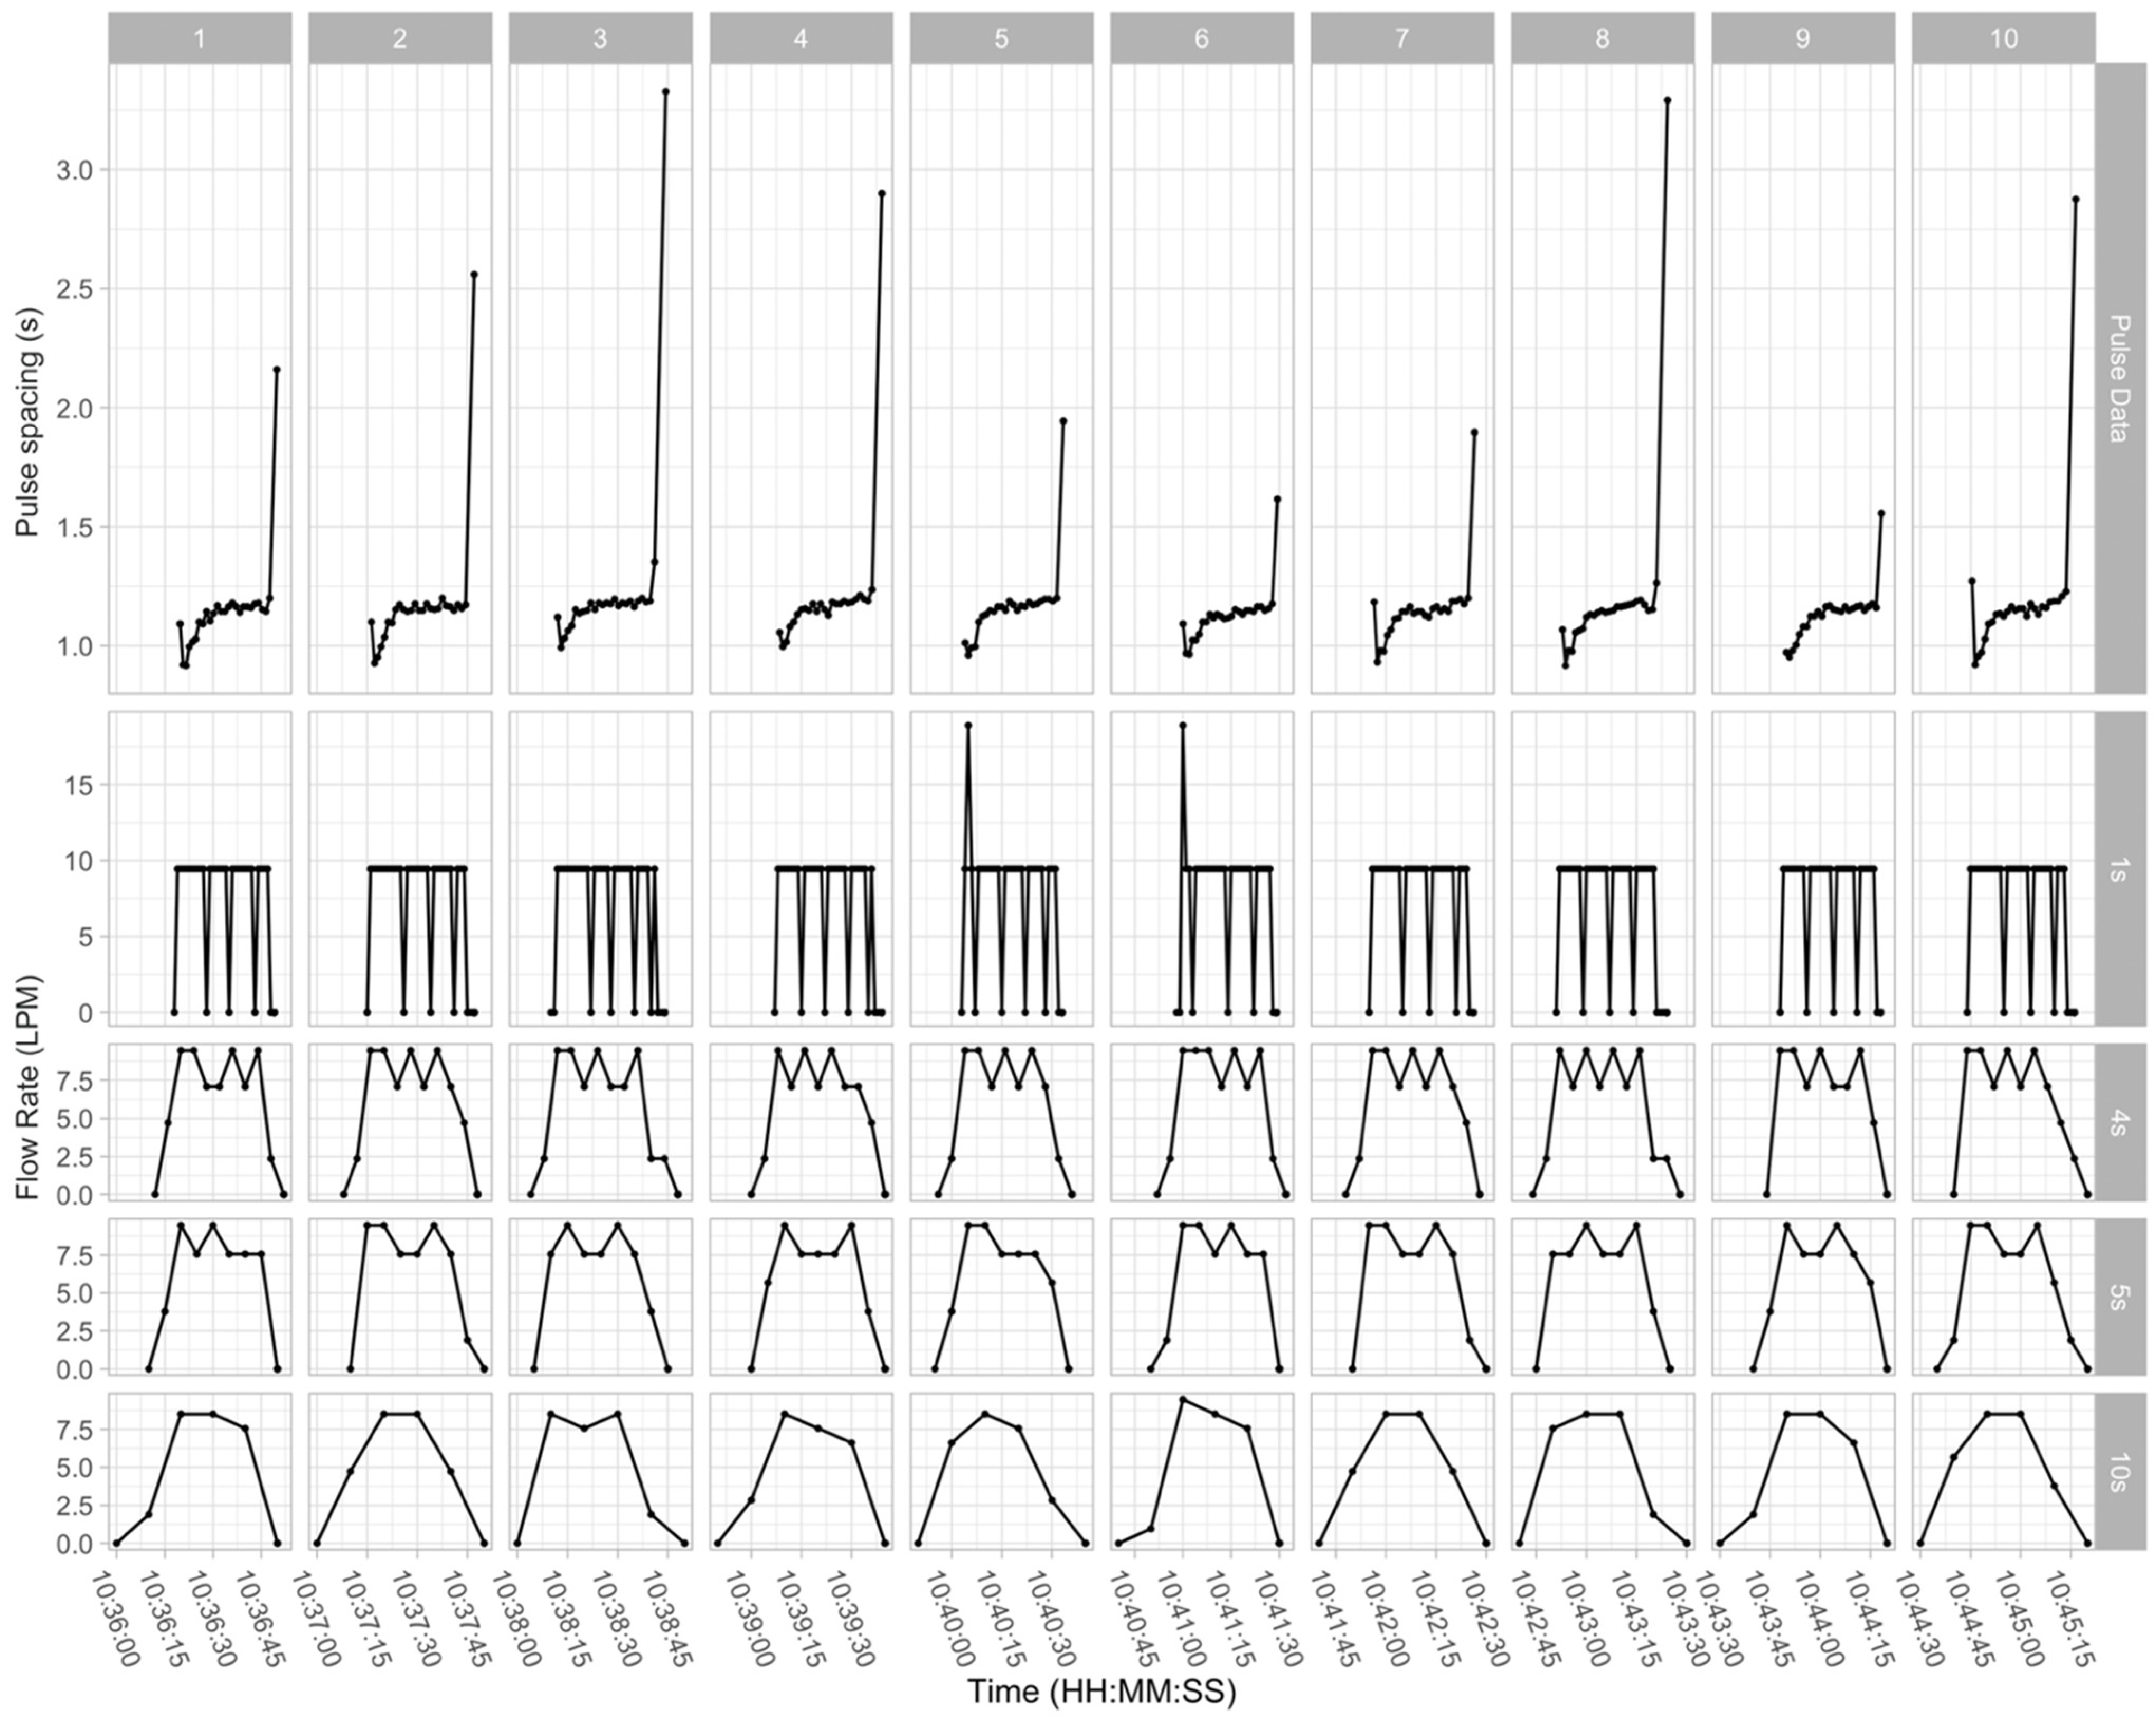
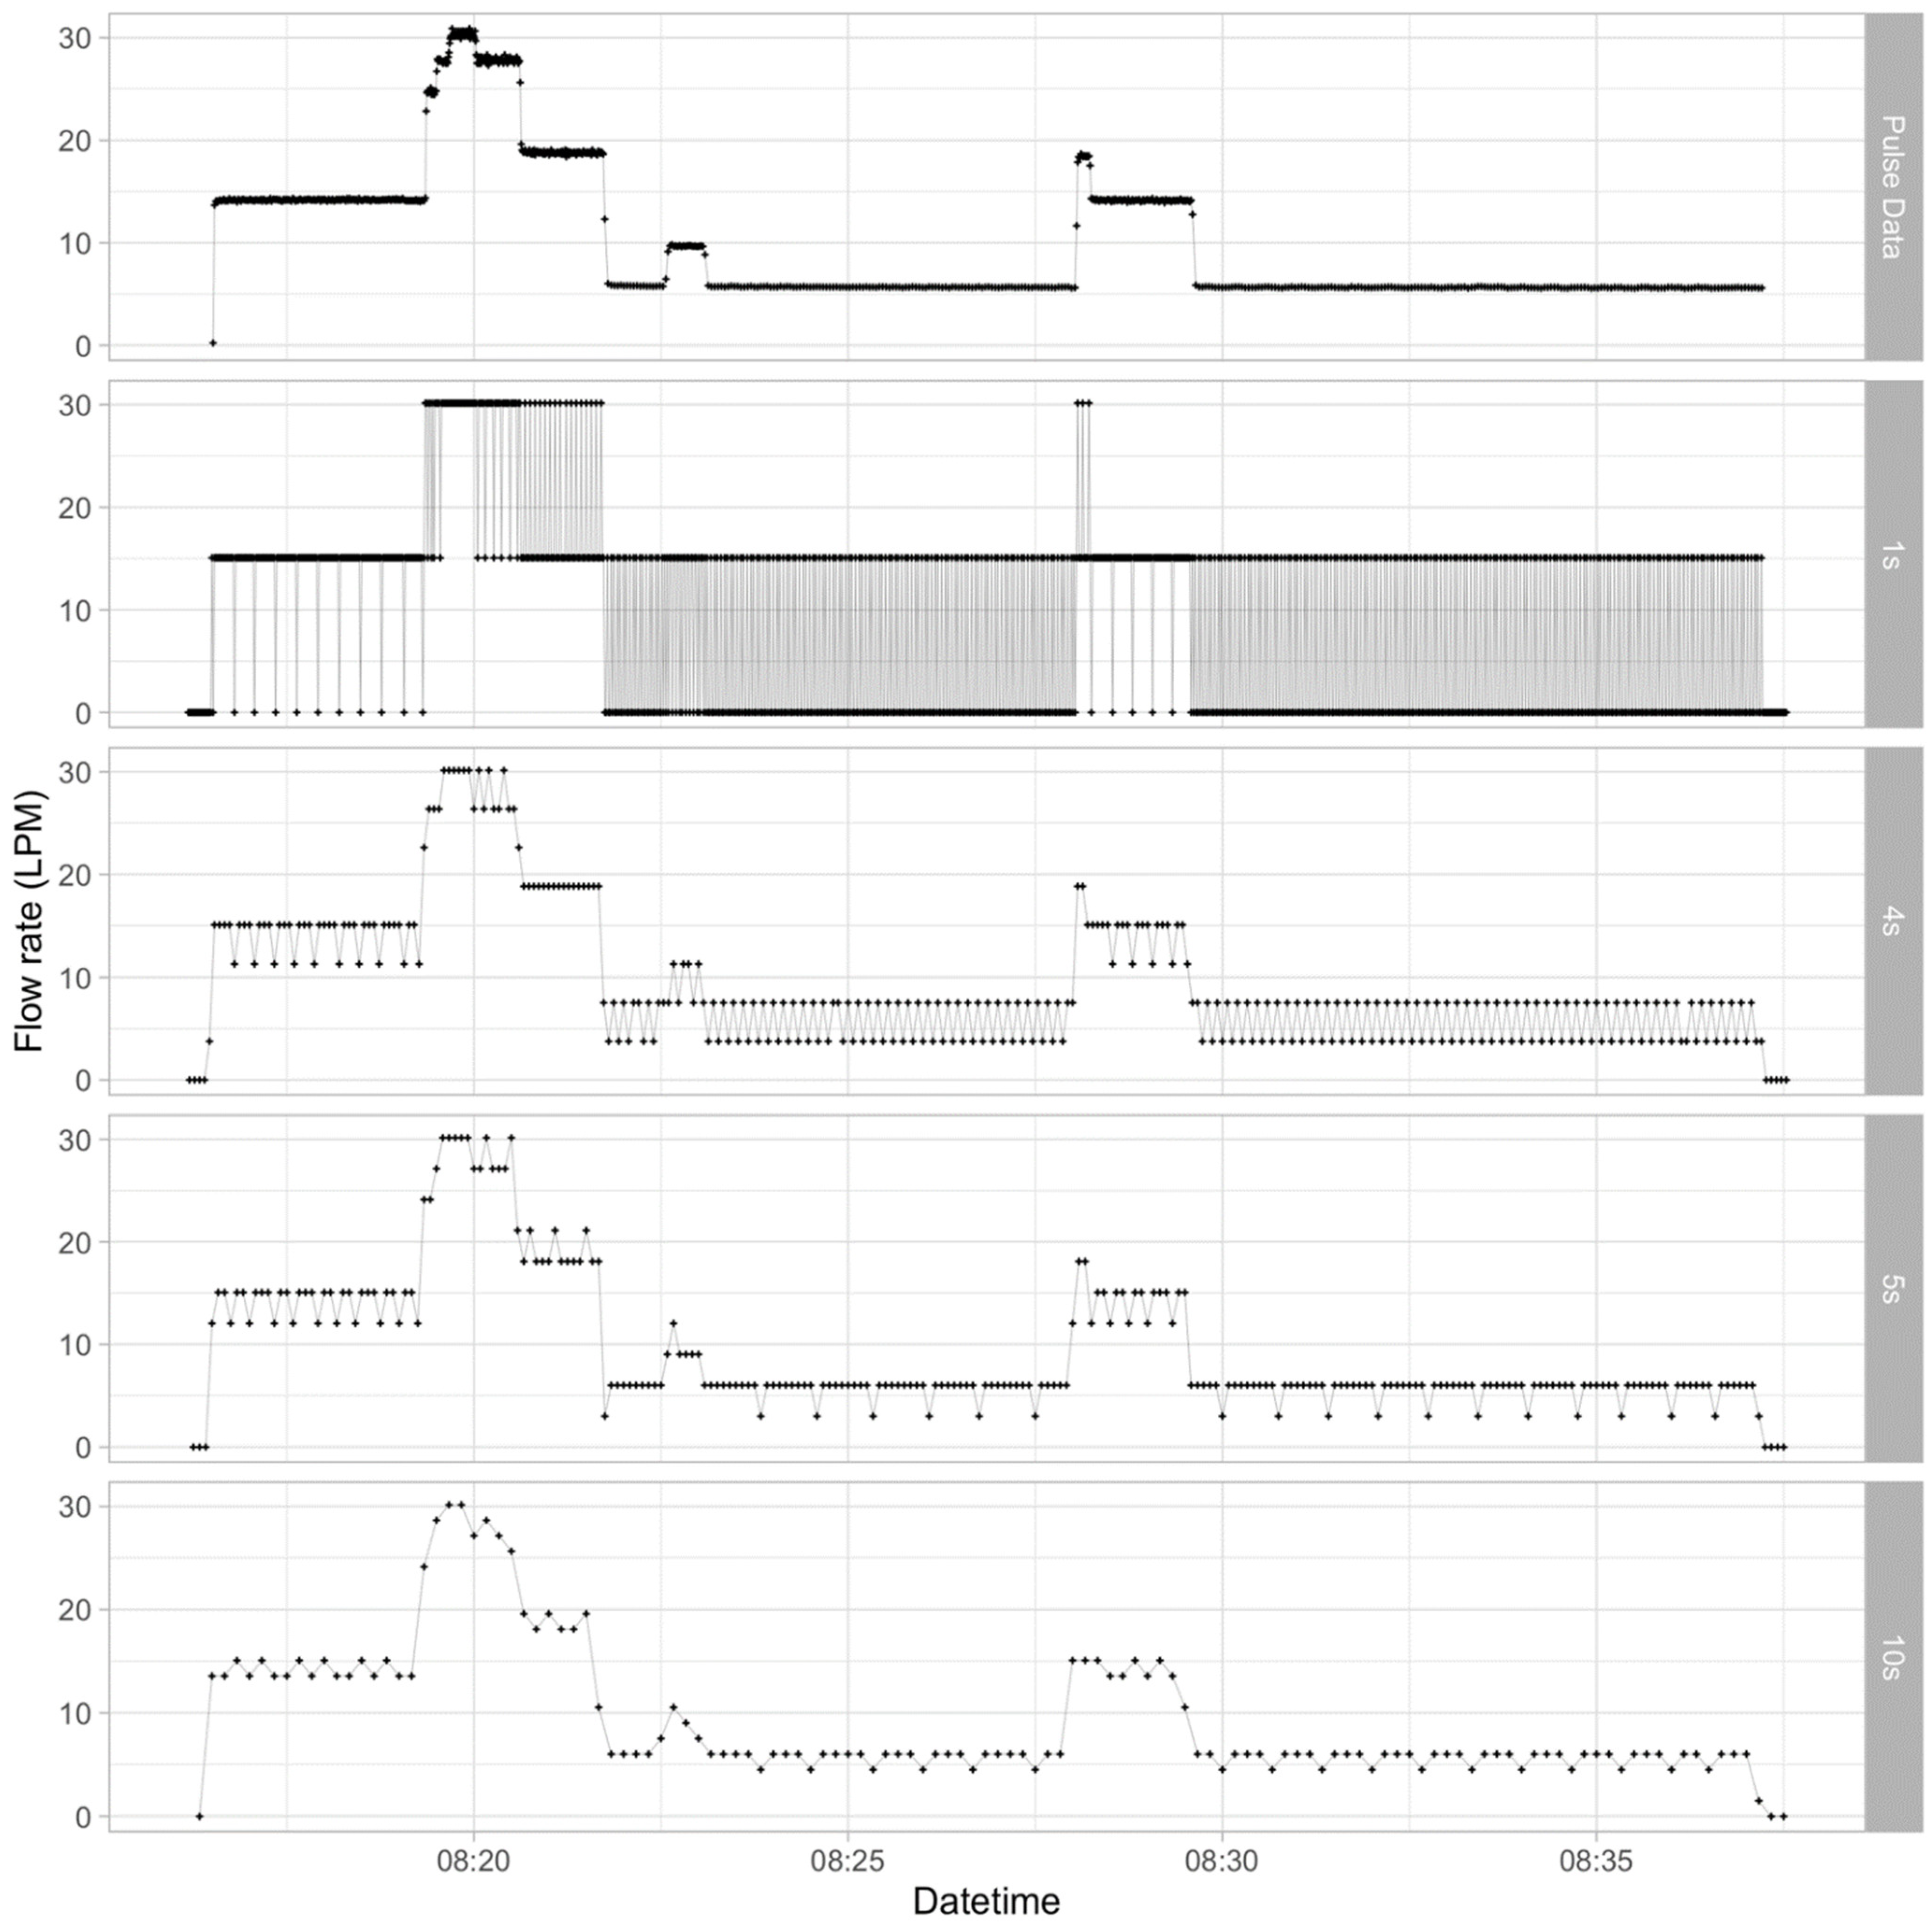
3.4. Analysis of Overlapping Events
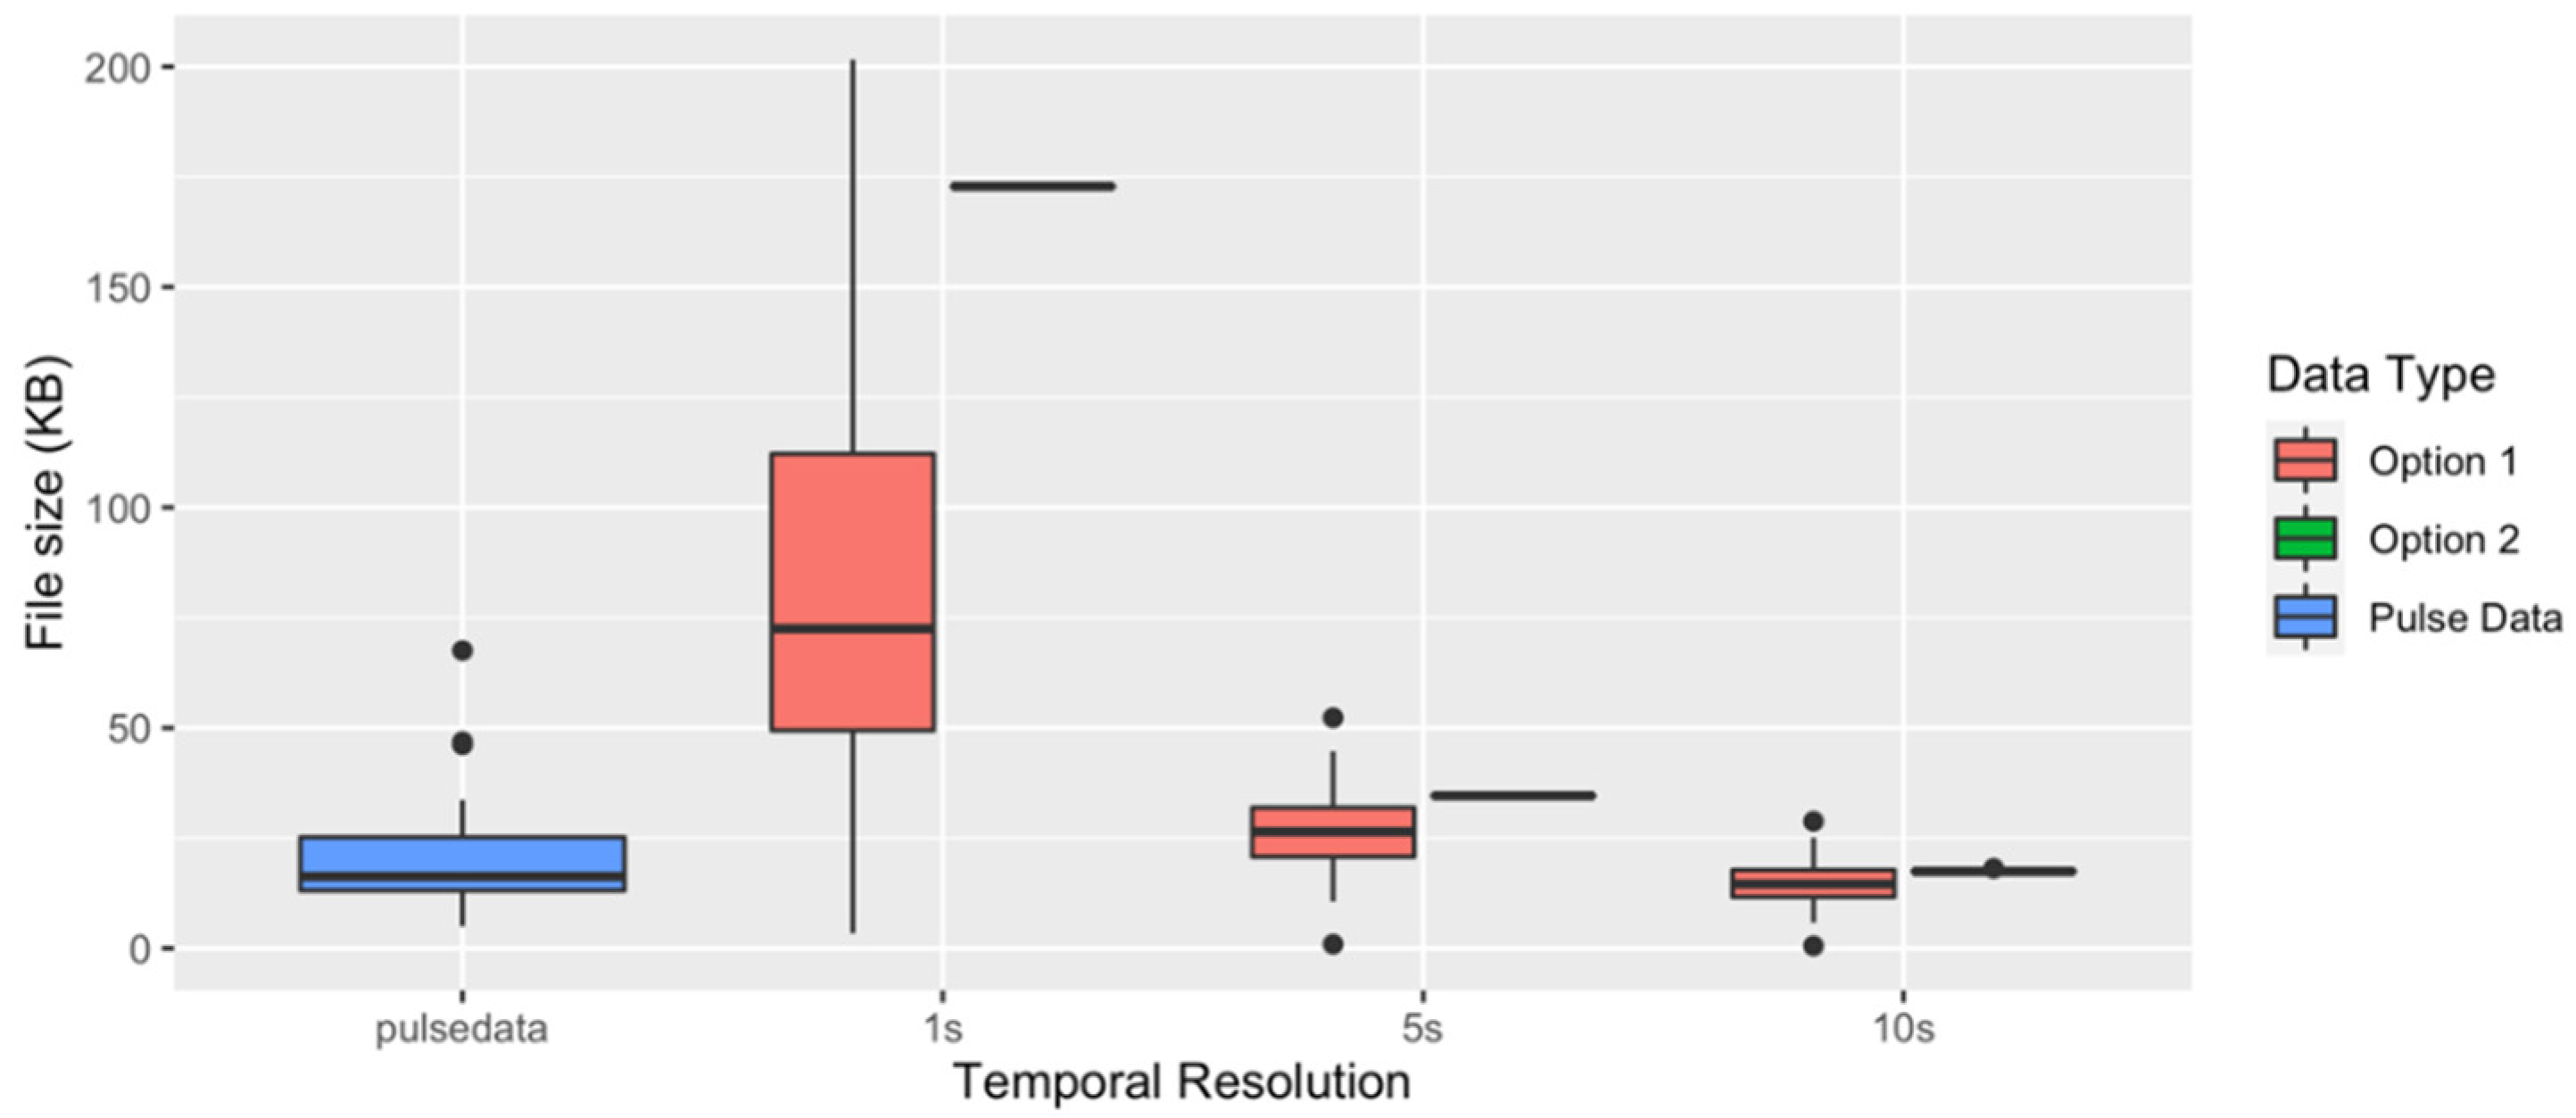
3.5. Data Volumes
4. Conclusions
Author Contributions
Funding
Institutional Review Board Statement
Informed Consent Statement
Data Availability Statement
Acknowledgments
Conflicts of Interest
References
- Boyle, T.; Giurco, D.; Mukheibir, P.; Liu, A.; Moy, C.; White, S.; Stewart, R. Intelligent Metering for Urban Water: A Review. Water 2013, 5, 1052–1081. [Google Scholar] [CrossRef] [Green Version]
- Cominola, A.; Giuliani, M.; Castelletti, A.; Rosenberg, D.E.; Abdallah, A.M. Implications of Data Sampling Resolution on Water Use Simulation, End-Use Disaggregation, and Demand Management. Environ. Model. Softw. 2018, 102, 199–212. [Google Scholar] [CrossRef] [Green Version]
- Bastidas Pacheco, C.J.; Horsburgh, J.S.; Tracy, R.J. A Low-Cost, Open Source Monitoring System for Collecting High Temporal Resolution Water Use Data on Magnetically Driven Residential Water Meters. Sensors 2020, 20, 3655. [Google Scholar] [CrossRef] [PubMed]
- F.S. Brainard & Company Meter-Master. 2022. Available online: https://meter-master.com/product/model-100el-100af/ (accessed on 10 June 2020).
- Attallah, N.A.; Horsburgh, J.S.; Beckwith, A.S.; Tracy, R.J. Residential Water Meters as Edge Computing Nodes: Disaggregating End Uses and Creating Actionable Information at the Edge. Sensors 2021, 21, 5310. [Google Scholar] [CrossRef] [PubMed]
- Pastor-Jabaloyes, L.; Arregui, F.J.; Cobacho, R. Water End Use Disaggregation Based on Soft Computing Techniques. Water 2018, 10, 46. [Google Scholar] [CrossRef] [Green Version]
- Attallah, N.A.; Horsburgh, J.S.; Bastidas Pacheco, C.J. An Open-Source, Semi-Supervised Water End Use Disaggregation and Classification Tool. J. Water Resour. Plan. Manag. 2022. submitted for publication. [Google Scholar]
- Aquacraft Trace Wizard Description. 1996. Available online: http://www.aquacraft.com/downloads/trace-wizard-description/ (accessed on 15 June 2022).
- Nguyen, K.A.; Stewart, R.A.; Zhang, H.; Sahin, O. An Adaptive Model for the Autonomous Monitoring and Management of Water End Use. Smart Water 2018, 3, 5. [Google Scholar] [CrossRef] [Green Version]
- DeOreo, W.B.; Mayer, P.W.; Dziegielewski, B.; Kiefer, J.; Foundation, W.R. Residential End Uses of Water, Version 2; Water Research Foundation: Denver, CO, USA, 2016; ISBN 9781605732350. Available online: https://www.waterrf.org/research/projects/residential-end-uses-water-version-2 (accessed on 15 March 2022).
- Mayer, P.W.; DeOreo, W.B.; Optiz, E.M.; Kiefer, J.C.; Davis, W.Y.; Dziegielewski, B.; Nelson, J.O. Residential End Uses of Water; American Water Works Association: Denver, CO, USA, 1999. [Google Scholar]
- Heinrich, M. Water End Use and Efficiency Project (WEEP); Final Report; BRANZ: Judgeford, New Zealand, 2007. [Google Scholar]
- Suero, F.J.; Mayer, P.W.; Rosenberg, D.E. Estimating and Verifying United States Households’ Potential to Conserve Water. J. Water Resour. Plan. Manag. 2012, 138, 299–306. [Google Scholar] [CrossRef]
- Beal, C.; Stewart, R.A. South East Queensland Residential End Use Study; Final Report. 2011. Available online: http://www.urbanwateralliance.org.au/publications/UWSRA-tr47.pdf (accessed on 20 February 2022).
- Gato-Trinidad, S.; Jayasuriya, N.; Roberts, P. Understanding Urban Residential End Uses of Water. Water Sci. Technol. 2011, 64, 36–42. [Google Scholar] [CrossRef] [PubMed]
- Bastidas Pacheco, C.J.; Brewer, J.C.; Horsburgh, J.S.; Caraballo, J. An Open Source Cyberinfrastructure for Collecting, Processing, Storing and Accessing High Temporal Resolution Residential Water Use Data. Environ. Model. Softw. 2021, 144, 105137. [Google Scholar] [CrossRef]
- Bastidas Pacheco, C.J.; Horsburgh, J.S.; Attallah, N.A. Variability in Consumption and End Uses of Water for Residential Users in Logan and Providence, Utah, USA. J. Water Resour. Plan. Manag. 2022. submitted for publication. [Google Scholar]
- CIWS-Pulse-Logger. Available online: https://github.com/UCHIC/CIWS-Pulse-Logger (accessed on 3 May 2022).
- Bastidas Pacheco, C.J.; Horsburgh, J.S.; Beckwith, A.S., Jr. Supporting Data and Tools for “Impact of Temporal Resolution on Data for Quantifying Residential End Uses of Water”. HydroShare. 2022. Available online: https://doi.org/10.4211/hs.6625bdbde41c45c2b906f32be7ea70f0 (accessed on 16 May 2022).
- Deb, K.; Pratap, A.; Agarwal, S.; Meyarivan, T. A Fast and Elitist Multiobjective Genetic Algorithm: NSGA-II. IEEE Trans. Evol. Comput. 2002, 6, 182–197. [Google Scholar] [CrossRef] [Green Version]
- Bastidas Pacheco, C.J.; Attallah, N.A.; Horsburgh, J.S. High Resolution Residential Water Use Data in Cache County, Utah, USA. 2021. HydroShare. Available online: https://www.hydroshare.org/resource/0b72cddfc51c45b188e0e6cd8927227e (accessed on 16 May 2022).


| Site | Length of Record (Days 1) | Number of Occupants | Meter Brand | Meter Size (in) | Volumetric Pulse Resolution (L/Pulse) | Year Built | Number of Bathrooms 2 |
|---|---|---|---|---|---|---|---|
| 1 | 26 | 4 | Master Meter | 1 | 0.16 | 2006 | 3 |
| 2 | 18 | 2 | Neptune | 1 | 0.25 | 1968 | 2 ½ |
| Site | Total Labeled Events | Shower | Faucet | Toilet | Bathtub | Clothes Washer | Dishwasher |
|---|---|---|---|---|---|---|---|
| 1 | 89 | 17 | 46 | 17 | 3 | 3 | 3 |
| 2 | 92 | 10 | 36 | 26 | 0 | 10 | 10 |
| Authors | Temporal Resolution (s) | Event Features | Broad Methodology |
|---|---|---|---|
| Attallah et al. [7] | 4 | Volume; duration; average, mode, maximum, and root mean square flow rate, shape | Low pass filtering, supervised classification |
| Nguyen et al. [9] | 10 | Volume; duration; average and maximum flow rate; shape | Decision tree, dynamic time warping, self-organizing map, hidden Markov model |
| Pastor-Jabaloyes et al. [6] | 3, 0.02 | Volume; duration; average and maximum flow rate; shape | NSGA-II [20] filtering, unsupervised classification |
| De Oreo et al. [8] | 10 | Start and end time; duration; volume; average, maximum, and mode flow rate | Manual and visual inspection by an analyst assisted by a decision tree algorithm |
| Site | Temporal Resolution (s) | Number of Events Detected | Single Pulse Events | Events with More Than One Pulse |
|---|---|---|---|---|
| 1 | Pulse data | 1605 | 225 | 1380 |
| 1 | 1590 | 210 | 1380 | |
| 4 | 1578 | 203 | 1375 | |
| 5 | 1536 | 166 | 1370 | |
| 10 | 1513 | 153 | 1360 | |
| 15 | 1401 | 132 | 1269 | |
| 30 | 1158 | 86 | 1072 | |
| 60 | 960 | 55 | 905 | |
| 2 | Pulse data | 2118 | 590 | 1528 |
| 1 | 2072 | 554 | 1518 | |
| 4 | 2054 | 483 | 1571 | |
| 5 | 1878 | 355 | 1523 | |
| 10 | 1797 | 319 | 1478 | |
| 15 | 1648 | 272 | 1376 | |
| 30 | 1373 | 184 | 1189 | |
| 60 | 1072 | 125 | 947 |
Publisher’s Note: MDPI stays neutral with regard to jurisdictional claims in published maps and institutional affiliations. |
© 2022 by the authors. Licensee MDPI, Basel, Switzerland. This article is an open access article distributed under the terms and conditions of the Creative Commons Attribution (CC BY) license (https://creativecommons.org/licenses/by/4.0/).
Share and Cite
Bastidas Pacheco, C.J.; Horsburgh, J.S.; Beckwith, A.S., Jr. Impact of Data Temporal Resolution on Quantifying Residential End Uses of Water. Water 2022, 14, 2457. https://doi.org/10.3390/w14162457
Bastidas Pacheco CJ, Horsburgh JS, Beckwith AS Jr. Impact of Data Temporal Resolution on Quantifying Residential End Uses of Water. Water. 2022; 14(16):2457. https://doi.org/10.3390/w14162457
Chicago/Turabian StyleBastidas Pacheco, Camilo J., Jeffery S. Horsburgh, and Arle S. Beckwith, Jr. 2022. "Impact of Data Temporal Resolution on Quantifying Residential End Uses of Water" Water 14, no. 16: 2457. https://doi.org/10.3390/w14162457
APA StyleBastidas Pacheco, C. J., Horsburgh, J. S., & Beckwith, A. S., Jr. (2022). Impact of Data Temporal Resolution on Quantifying Residential End Uses of Water. Water, 14(16), 2457. https://doi.org/10.3390/w14162457