Article

Evaluation of Three High-Resolution Remote Sensing Precipitation Products on the Tibetan Plateau

1
State Key Laboratory of Simulation and Regulation of Water Cycle in River Basin, China Institute of Water Resources and Hydropower Research, Beijing 100038, China
2
School of Resources and Earth Science, China University of Mining and Technology, Xuzhou 221116, China
3
School of Hydraulic and Environmental Engineering, Changsha University of Science & Technology, Changsha 410114, China
*
Author to whom correspondence should be addressed.
Water 2022, 14(14), 2169; https://doi.org/10.3390/w14142169
Submission received: 7 June 2022 / Revised: 30 June 2022 / Accepted: 6 July 2022 / Published: 8 July 2022
(This article belongs to the Special Issue Vulnerability of Mountainous Water Resources and Hydrological Regimes)

Abstract

:
Remote sensing precipitation products provide rich data for ungauged basins. Evaluating the accuracy and detection capability of remote sensing precipitation products is crucial before application. In this study, an index system in terms of quantitative differences, capturing capacity and precipitation distribution was constructed to evaluate three precipitation products, TRMM 3B42 V7, GPM IMERGE Final and CMORPH V1.0, at various temporal and spatial scales on the Tibetan Plateau from 2001 to 2016. The results show that the correlations among the three products were larger at the monthly scale than at the annual scale. The lowest correlations between the products and observation data were found in December. GPM performed the best at the monthly and annual scales. Particularly, the GPM product presented the best capability of detection of both precipitation and non-precipitation events among the three products. All three precipitation products overestimated 0.1~1 mm/day precipitation, which occurred most frequently. An underestimation of precipitation at 10~20 mm/day was observed, and this intensity accounted for the majority of the precipitation. All three precipitation products showed an underestimation in terms of the annual maximum daily precipitation. The accuracy of the same product varied in different regions of the Tibetan Plateau, such as the south, the southeast, eastern–central region and the northeast, and there was a certain clustering of the accuracies of neighboring stations. GPM was superior to TRMM and CMORPH in the southern Tibetan Plateau, making it recommended for applications.

1. Introduction

Precipitation plays a crucial role in the water cycle [1,2]. As the output of weather systems and the main source of runoff, precipitation not only acts as an important bridge and link between the atmosphere and land, but also controls the availability of water [3,4,5]. The quantitative observation of precipitation is the basis for hydrological research. There are three main ways to obtain precipitation information: rain gauges, weather radar and meteorological satellites. Rain gauges can obtain precipitation directly. However, due to the limitation of observation-station planning and construction, it is still difficult to obtain precipitation information in key regions of climate change, such as polar regions and high mountains [6]. Remote sensing technology represented by weather radar and meteorological satellites has progressed in recent decades, and it has been gradually applied to various fields, such as meteorology and water resources. Weather radar can capture the spatial and temporal precipitation distribution in a short period by detecting instantaneous precipitation. However, it is difficult to carry out a large-scale regionalization of radar construction due to its limited monitoring range and high cost [7]. Satellites can continuously obtain precipitation information with a certain spatial and temporal resolution under various geographical conditions, especially at high altitudes. A large number of satellite-based remote sensing precipitation products have been developed in recent years. At present, satellite precipitation products include Tropical Rainfall Measuring Mission (TRMM) [8], Integrated Multi-satellite Retrievals for the Global Precipitation Measurement (GPM IMERGE) [9], Climate Prediction Center morphing technique (CMORPH) [10], Precipitation Estimation from Remotely Sensed Information using Artificial Neural Networks-Climate Data Record (PESIANN-CDR) [11], Global Satellite Mapping of Precipitation (GSMaP) [12], etc. However, various satellite products still make estimates of precipitation based on inversion algorithms. The applicability of products is limited by the selection of the study area [13,14,15], and the accuracy is influenced by the temporal scale [16,17,18], precipitation intensity [19,20,21], topographic conditions [4,22,23], etc. Therefore, there is a significant need to conduct regionalized precipitation-product evaluation studies.
The Tibetan Plateau (TP) is the most unique geological–geographical–ecological unit on Earth and is a natural laboratory for research on the evolution of the Earth and life, the interaction of circles and human–earth relations [24]. However, due to the wide area, high altitude and sparse rain gauges of the TP, knowledge about precipitation characteristics is still insufficient. In order to apply remote sensing products to precipitation research on the TP, many scholars have carried out studies to evaluate the quality of satellite precipitation products. In the Yellow River source area, the deviation of TRMM was positively correlated with rainfall intensity [25]. In the Yarlung Tsangpo River basin, the accuracy of TRMM at the monthly scale was high (correlation coefficient of 0.902), but the product overestimated weak precipitation and underestimated strong precipitation [26,27]. In addition, TRMM was also considered to have better accuracy in summer than in winter [28]. As an improvement to the previous generation of TRMM, GPM had less deviation and a stronger correlation with measured precipitation [29]. The detection capability of weak precipitation events of GPM was significantly better than that of TRMM, but both had shortcomings in the detection performance of strong precipitation events [30]. CMORPH could describe the spatial pattern and temporal variation of precipitation in China [31]. The product of CMORPH performed better in summer than in winter, but it overestimated the frequency of rainfall events with low intensity [32].
Evaluation studies for satellite products on the TP have mainly focused on sub-basins within the TP in the past, such as the Yellow River source and Yarlung Zangpo River, and less work has been performed to evaluate the entire plateau. The evaluation methods used were also limited. For example, the commonly used evaluation indexes were mainly correlation coefficient, relative deviation, root-mean-square error, probability of detection, false alarm ratio, critical success index, etc. [33,34,35,36,37]. Previous studies have mainly focused on the evaluation of the detection ability of precipitation events with little consideration of non-precipitation events. The contribution of different intensities of precipitation to total precipitation has also been rarely evaluated. Therefore, this study constructed a precipitation-product evaluation system, including the three aspects of quantitative differences, capturing capacity and precipitation distribution. In this evaluation system, we took into account the detection accuracy of no-rain events and the contribution of different intensities of precipitation to the total precipitation, which can comprehensively reflect the regional applicability of different precipitation products.
The constructed index system was used to compare the accuracy of three precipitation products (TRMM, GPM and CMORPH) considering multiple time scales. We also analyzed the ability to capture precipitation events and non-precipitation events by using the refined detection indexes. The evaluation in terms of frequency of occurrence, precipitation contribution and extreme precipitation was carried out, and the inversion accuracy of each station was also spatially explored. It is hoped that this study can provide a reference for the application of precipitation products on the TP.

2. Materials and Methods
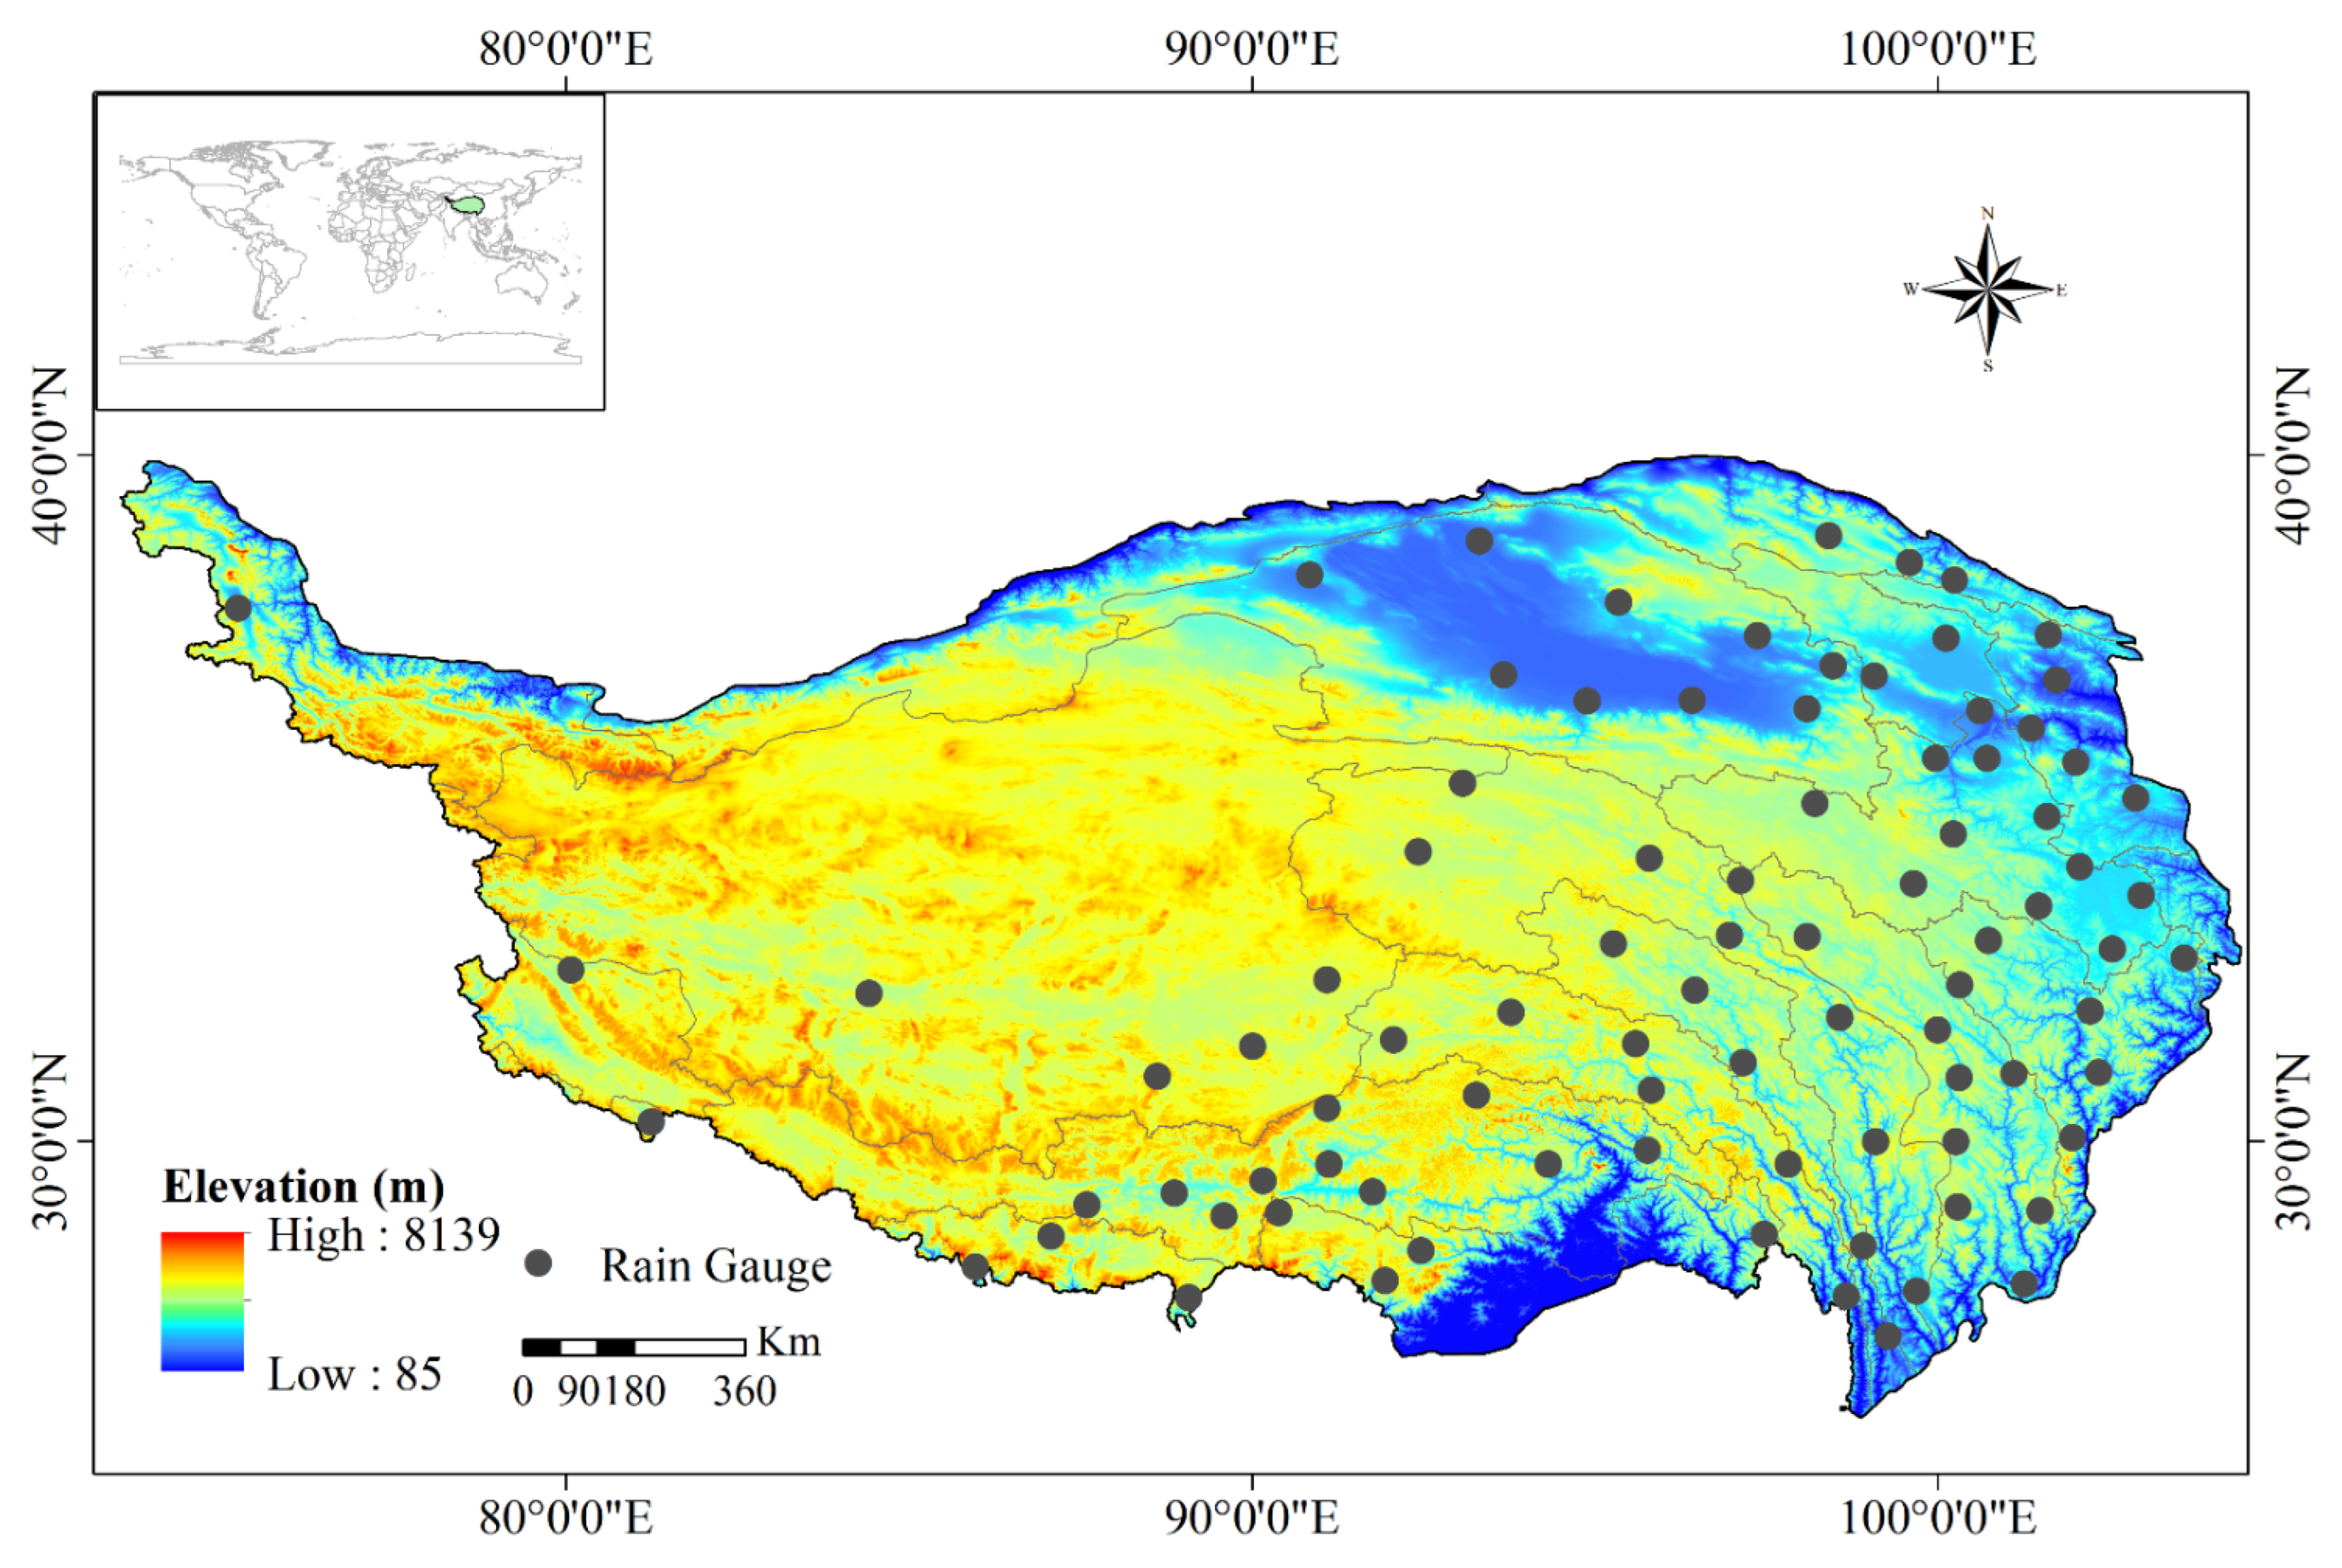
2.1. Study Area

Most of the TP is located in southwest China, with a total area of about 2.5 million km2 and an average altitude of more than 4000 m. It is the largest plateau in China and is located at the highest altitude in the world. The TP is known as the “Water Tower of Asia”, the “Roof of the World” and the “third Pole”. Many major rivers in Asia, such as Yangtze, Yellow, Lancang, Nu-Salween and Yarlung Zangpo, originate here. As shown in Figure 1, the boundary of the TP in China extends from the Pamir Plateau in the west to the Hengduan Mountains in the east and from the southern edge of the Himalayas in the south to the northern side of the Kunlun–Qilian Mountains in the north [38,39,40]. The precipitation on the TP decreases from southeast to northwest, and it is mainly concentrated in summer, which accounts for about 60% of annual precipitation. The annual precipitation of the TP shows an increasing trend of 3.8 mm/10a. The increasing rate of the mean annual temperature is 0.30 °C/10a [41,42].

2.2. Data

Although precipitation information can be obtained through satellites and atmospheric model simulations, the most direct and accurate way to measure precipitation is still the use of ground-based gauge measurements [43,44,45]. In this study, the daily precipitation data of 87 rain gauges (Figure 1) from 2001 to 2016 were selected for product validation and were provided by China Meteorological Administration. TRMM 3B42 V7 and GPM IMERG Final products were obtained from the National Aeronautics and Space Administration with a spatial resolution of 0.25° × 0.25° and 0.1° × 0.1°, respectively. CMORPH V1.0 was acquired from the Climate Prediction Center with a spatial resolution of 0.25° ×0.25°. The temporal resolution of all three products was daily resolution.
Figure 2 shows the annual and monthly precipitation variations in precipitation products and gauge data from the past 16 years. In general, the annual precipitation for each product showed fluctuating variations consistent with observation precipitation. TRMM and GPM had different levels of overestimations at annual scale throughout the study period, while that of the GPM was relatively small. CMORPH underestimated annual precipitation from 2001 to 2006. The overestimation of monthly precipitation for the three products tended to occur in the summer when the intensity of precipitation was high on the TP. The accumulation of overestimated precipitation during the flood season largely led to the deviation of annual precipitation between precipitation products and rain gauges.

3. Methods

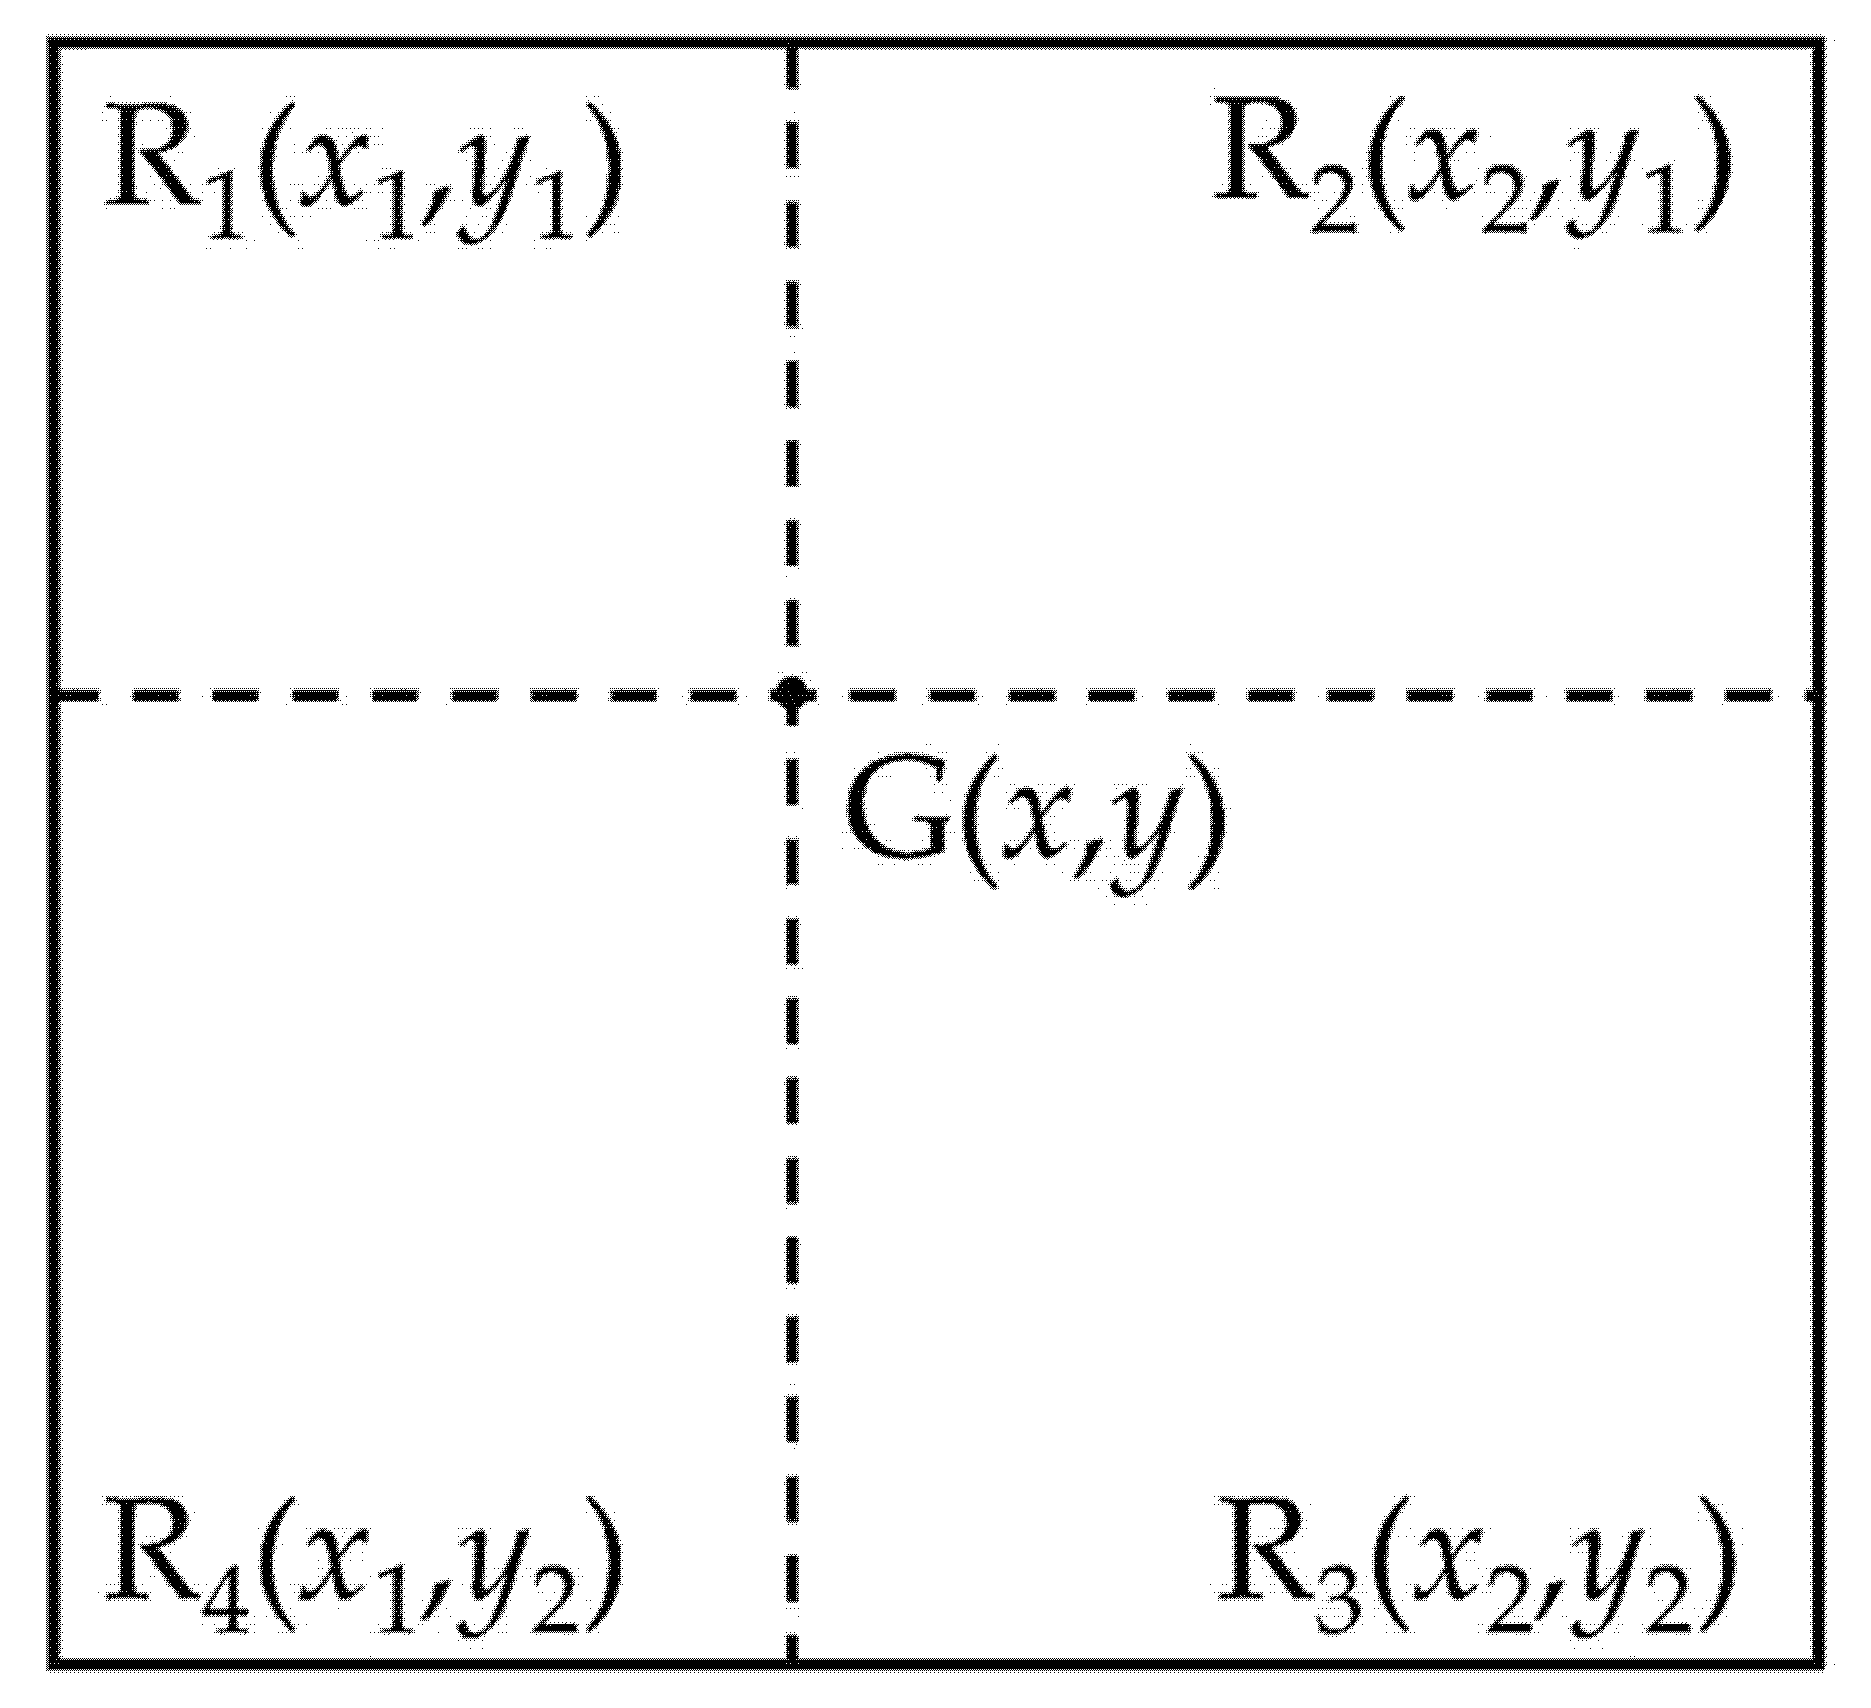
3.1. Data Processing

A common pre-processing approach to evaluate remote sensing precipitation products is to use the precipitation at the grid of the precipitation product where the station is located to represent the inversion precipitation for that station [46,47]. However, the inversion precipitation obtained by this method has large uncertainties because of the strong spatial heterogeneity of precipitation. In this study, we used bilinear interpolation to interpolate the precipitation products with different resolutions to specific spatial locations where the rain gauges were located. This interpolation method takes into account the influence of geographical location on precipitation extraction and is common in meteorological studies [48,49]. The calculation principle can be seen in Figure 3, in which G(x,y) denotes the location of the gauge to be interpolated, and R1(x1,y1), R2(x2,y1), R3(x2,y2) and R4(x1,y2) denote the four vertices within the raster of remote sensing products where gauge G was located. The relevant calculation equations are as follows [50]:
P G = ( 1 w x ) ( 1 w y ) P 1 + w x ( 1 w y ) P 2 + w x w y P 3 + ( 1 w x ) w y P 4
w x = x x 1 x 2 x 1
w y = y y 1 y 2 y 1
where wx and wy denote the weight used for interpolation ( 0 w x 1 ,   0 w y 1 ); PG denotes the remote sensing precipitation corresponding to the gauge; P1, P2, P3 and P4 denote the remote sensing precipitation corresponding to points R1, R2, R3 and R4, respectively.

3.2. Evaluation Index System

To comprehensively compare the inversion capability of each product at different time scales, an evaluation system in terms of quantitative differences, capturing capability and precipitation distribution was constructed. Four common statistical indexes, correlation coefficient (CC), relative bias (BIAS), root-mean-square error (RMSE) and standard deviation (SD), were included. We also used seven capturing-capability indexes: probability of detection (POD), false alarm ratio (FAR), probability of false detection (POFD), missing alarm ratio (MAR) and Heidke skill score (HSS). In addition, two distribution indexes, probability distribution function by occurrence (PDFc) and probability distribution function by volume (PDFv), were involved. The equation of each index is shown in Table 1.
CC indicates the degree of linear correlation between the precipitation products and gauge data. Its value varies between 1 and −1. The positive and negative values indicate positive and negative correlations, respectively. When the absolute value of CC is 1, the correlation is optimal. BIAS is used to verify the degree of systematic deviation between the precipitation products and gauge data, and the perfect value is 0. RMSE describes the overall deviation between the precipitation products and gauge data, and the optimal value is 0. SD reflects the degree of dispersion of the data, and the closer its value is to 0, the closer the data are to the mean of the sample.
Referring to the relevant literature [15,50], this study classified the capturing events of remote sensing products into precipitation events and non-precipitation events, and the critical threshold for both types of events was set to 1 mm/day. PODrain describes the ratio of the detected precipitation events to the number of precipitation events observed by the gauges, while PODnorain indicates the ratio of the detected non-precipitation events to the number of non-precipitation events observed by the gauges. The optimal values of PODrain and PODnorain are both 1. FARrain indicates the ratio of the incorrectly detected precipitation events to the total number of the detected precipitation events, while FARnorain indicates the ratio of the incorrectly detected non-precipitation events to the total number of the detected non-precipitation events. FARrain and FARnorain values close to 0 indicate the good detection capability of the satellite product. POFD and MAR further reflect the proportion of misreporting by the precipitation products for actual non-precipitation events and precipitation events, respectively, and their optimal value is 0. HSS can reflect the comprehensive estimation level of a precipitation product, and the range of its value is [−1, 1], where its largest value indicates the best detection capability. An HSS value of 1 represents that the satellite perfectly detects gauge precipitation. A positive value of HSS indicates that the detection capability is good, while a negative value means that the detection capability is not good enough.
In terms of the indexes of precipitation distribution, PDFc and PDFv reflect the differences in the frequency of precipitation occurrence and precipitation contribution between the products and gauge data in different intensity ranges, respectively. The former describes the distribution of the frequency of daily precipitation occurrence within different precipitation intensities, while the latter describes the distribution of the relative contribution of daily precipitation to the total precipitation within each precipitation intensity range [51,52,53].
Figure 4 depicts the framework of this study. After the work of remote sensing precipitation data extraction was completed, we analyzed the accuracy of precipitation products at different time scales and spatially explored their accuracy differences at the gauge scale under the constructed evaluation system.

4. Results

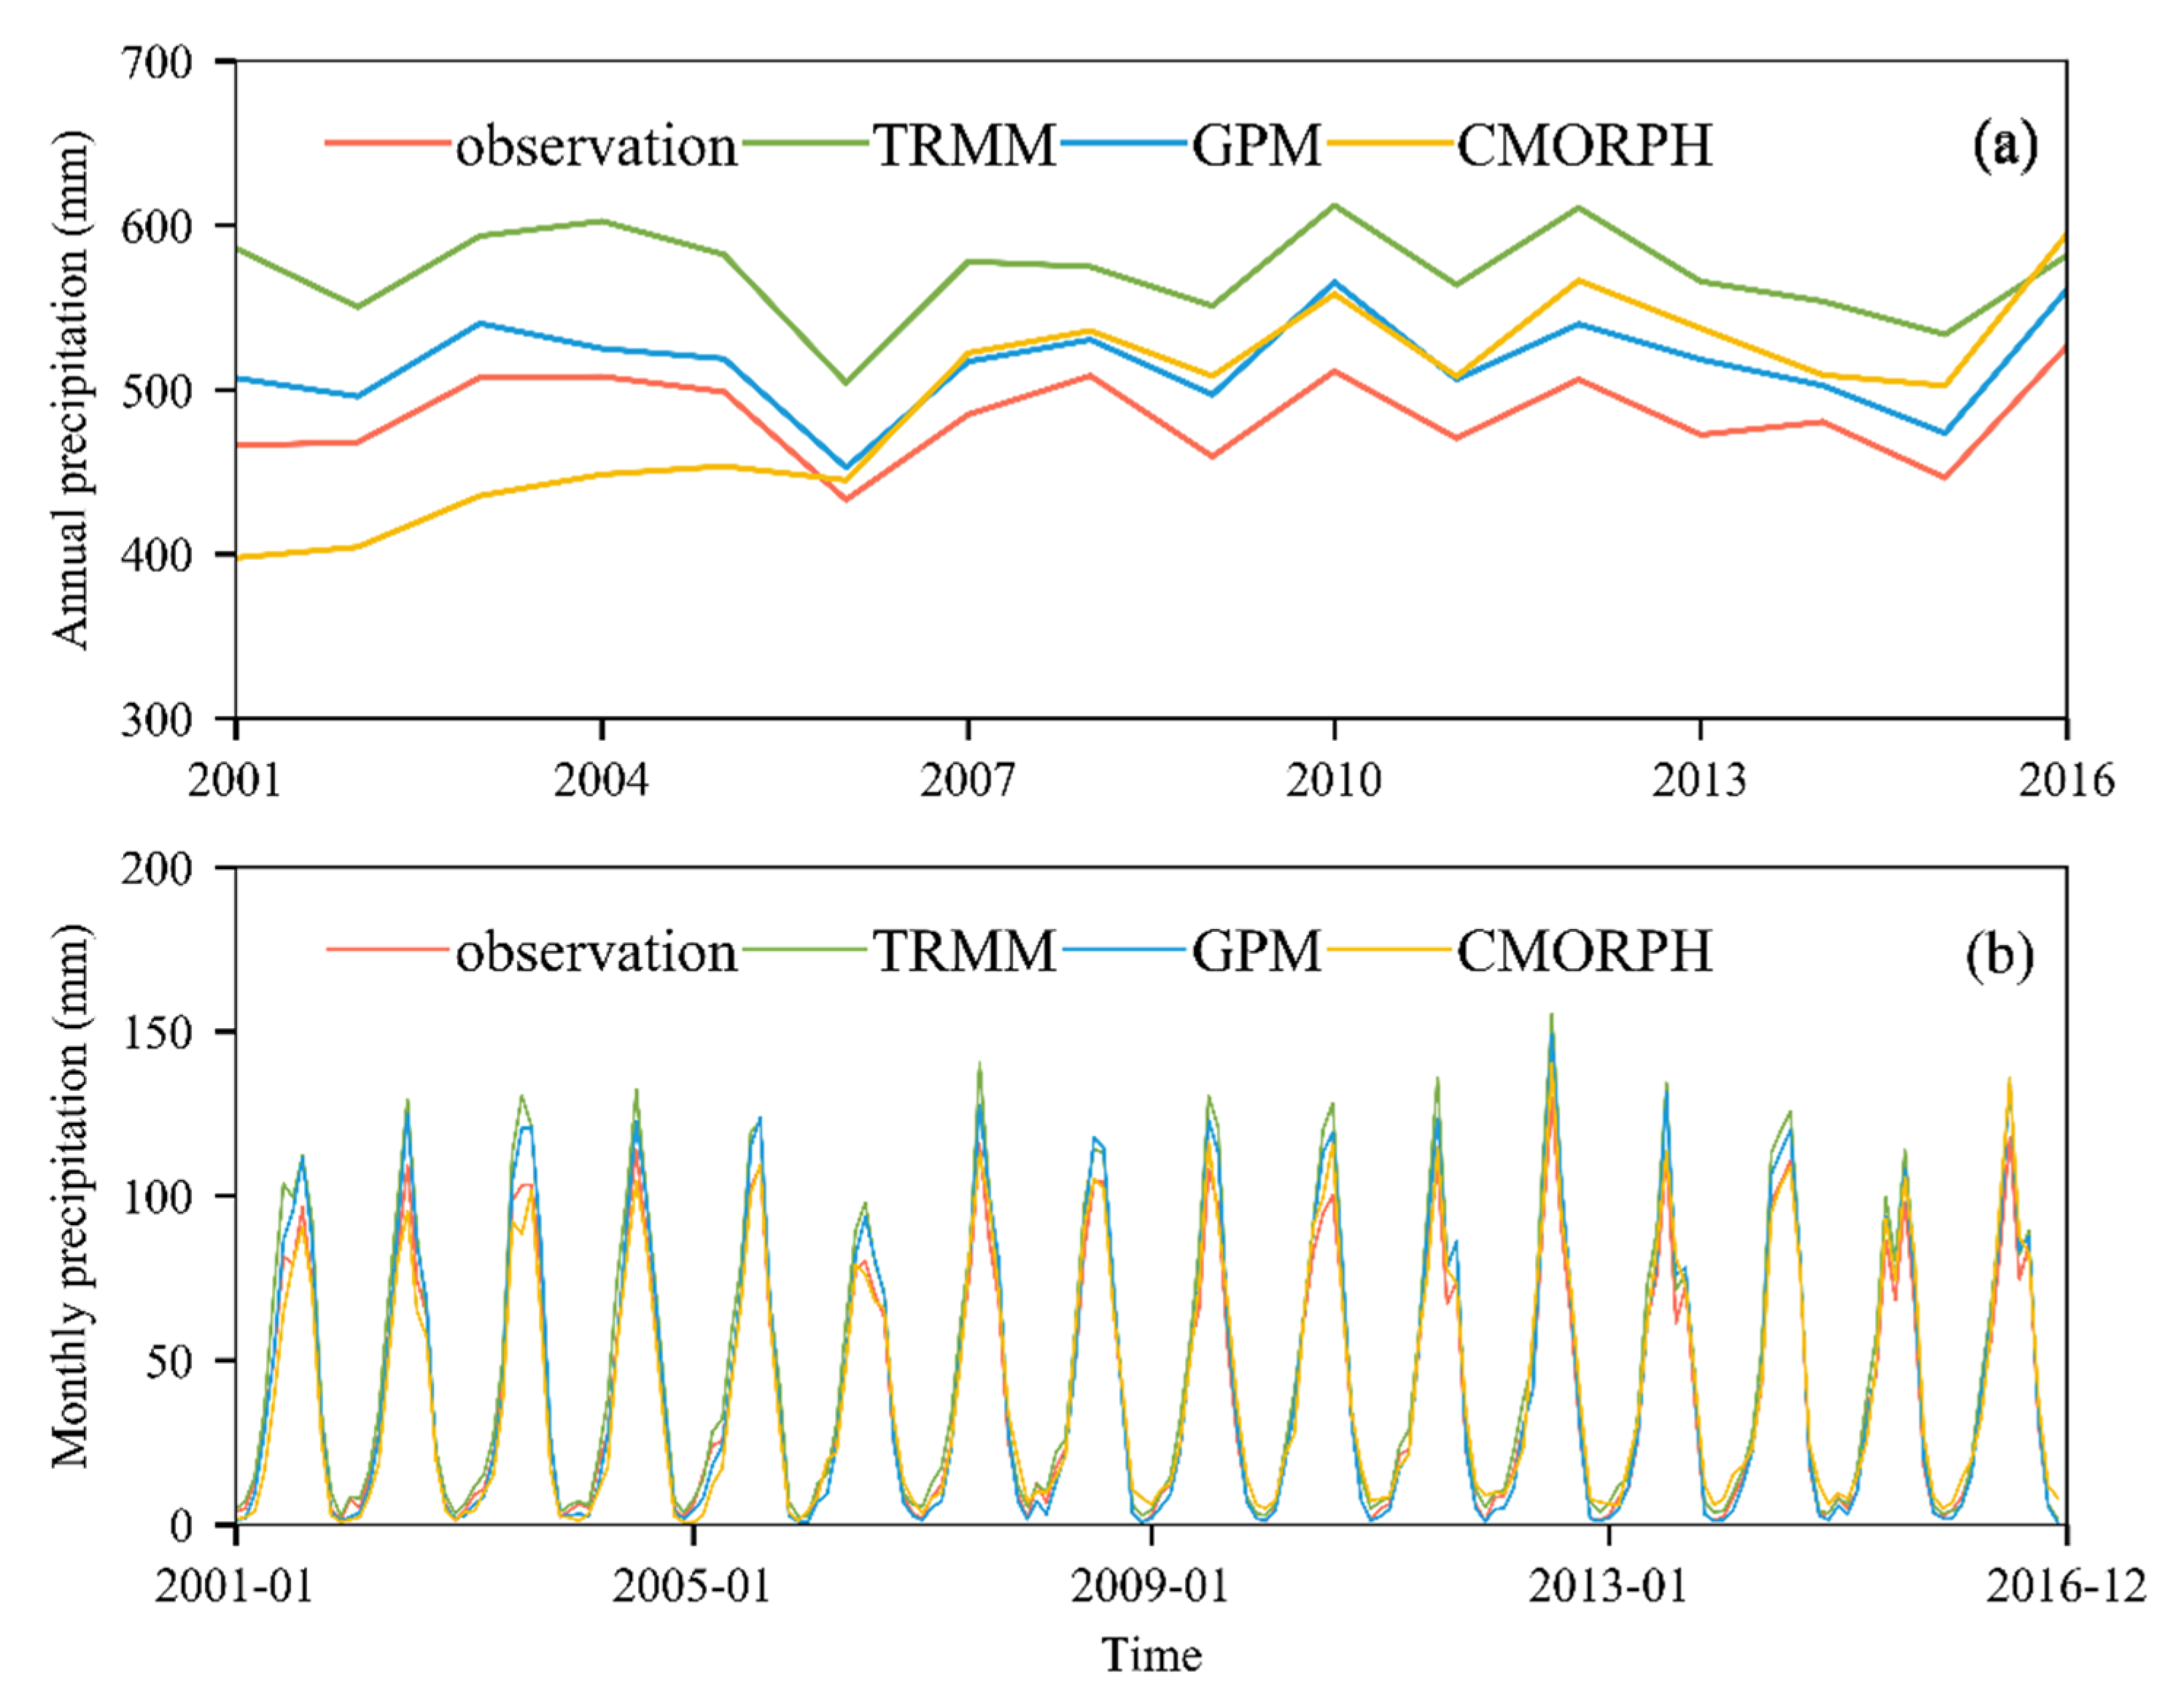
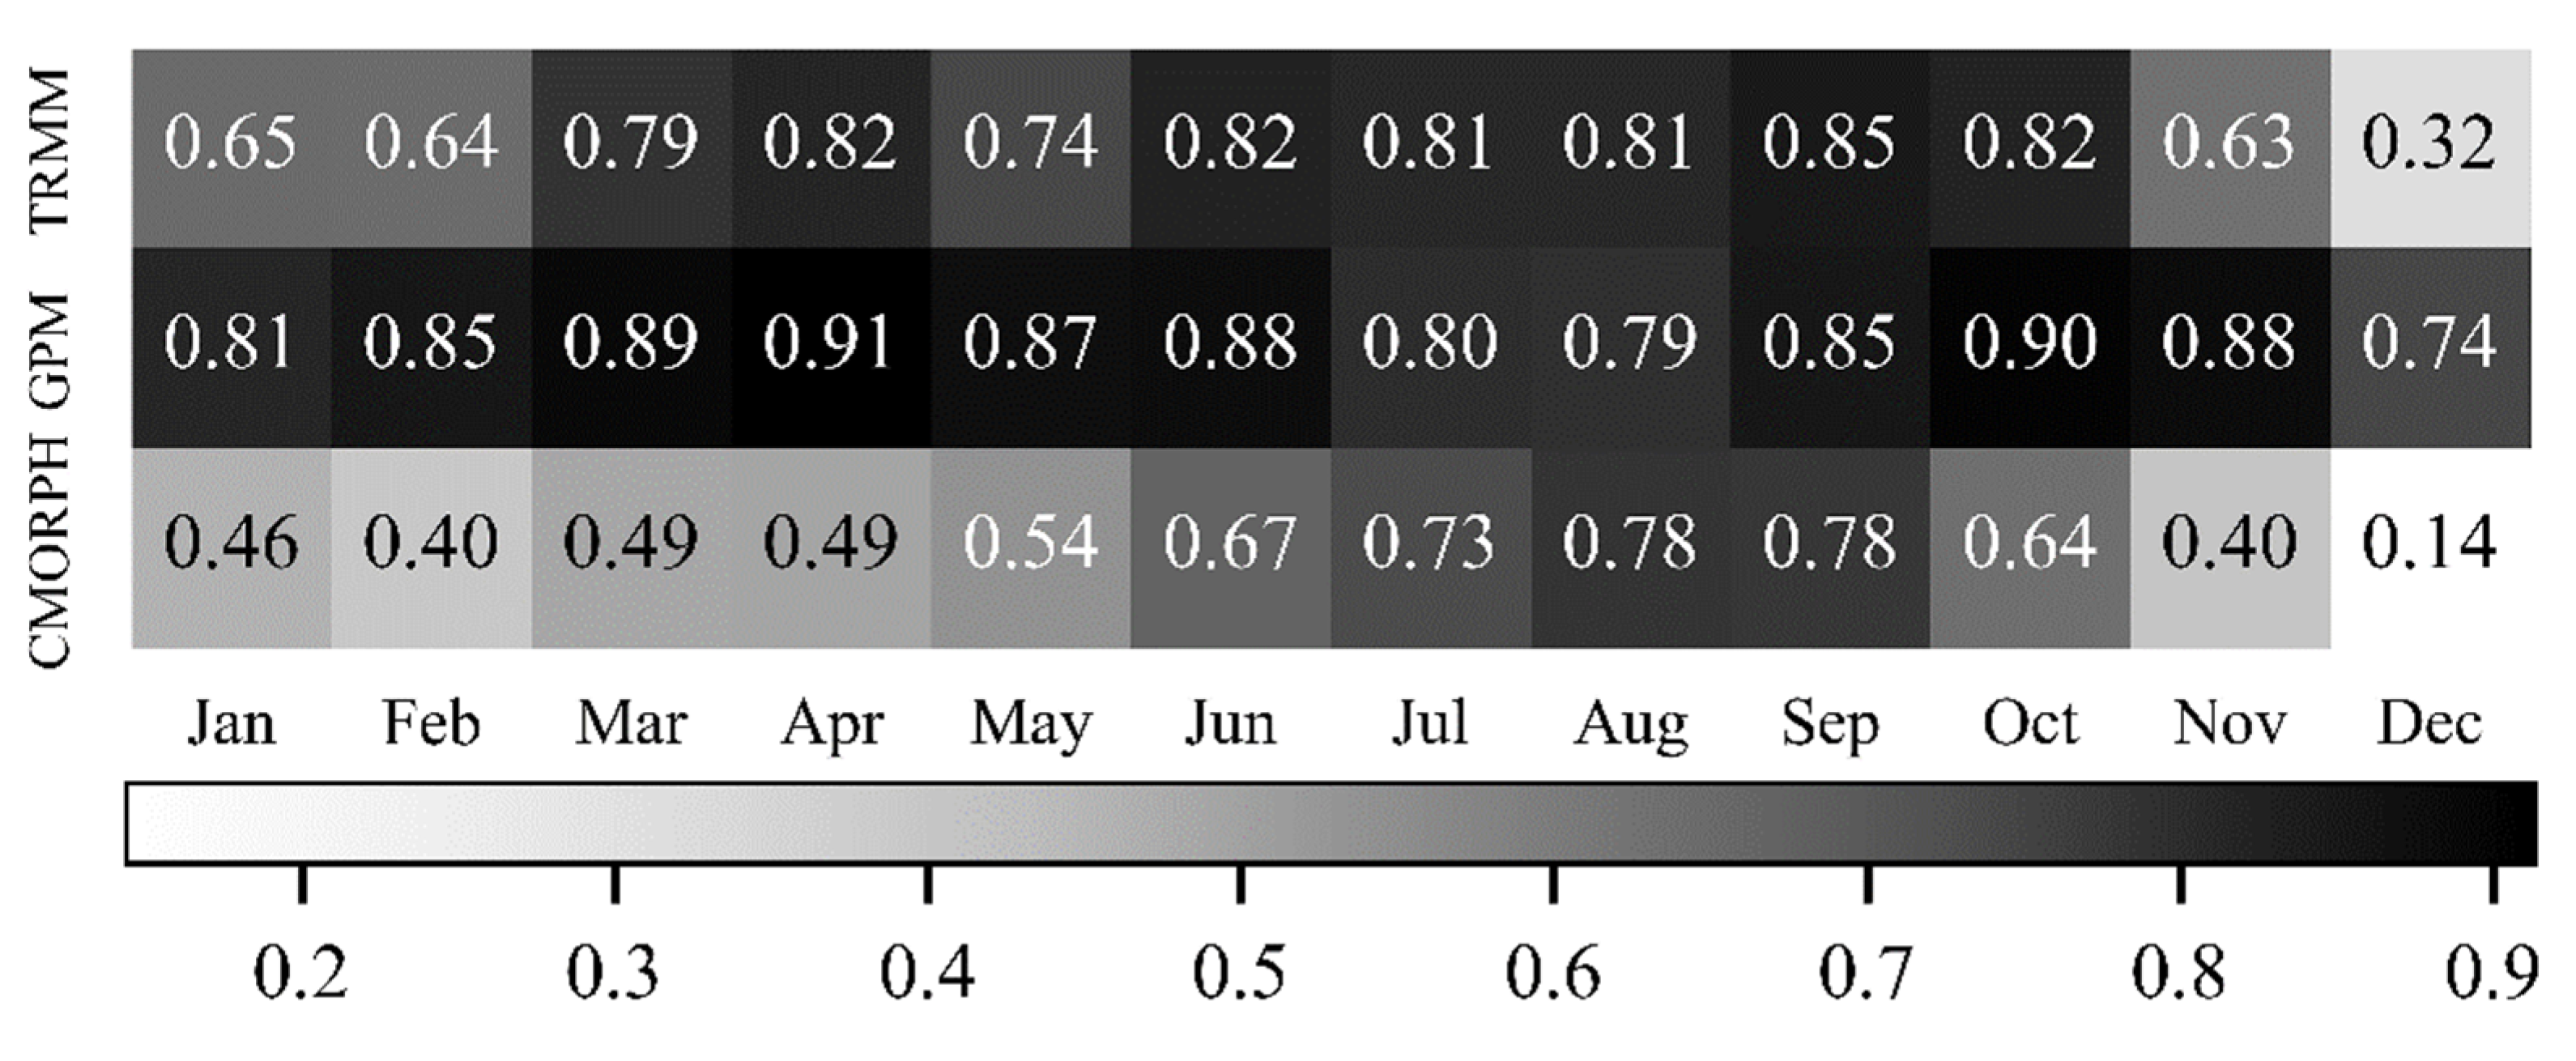
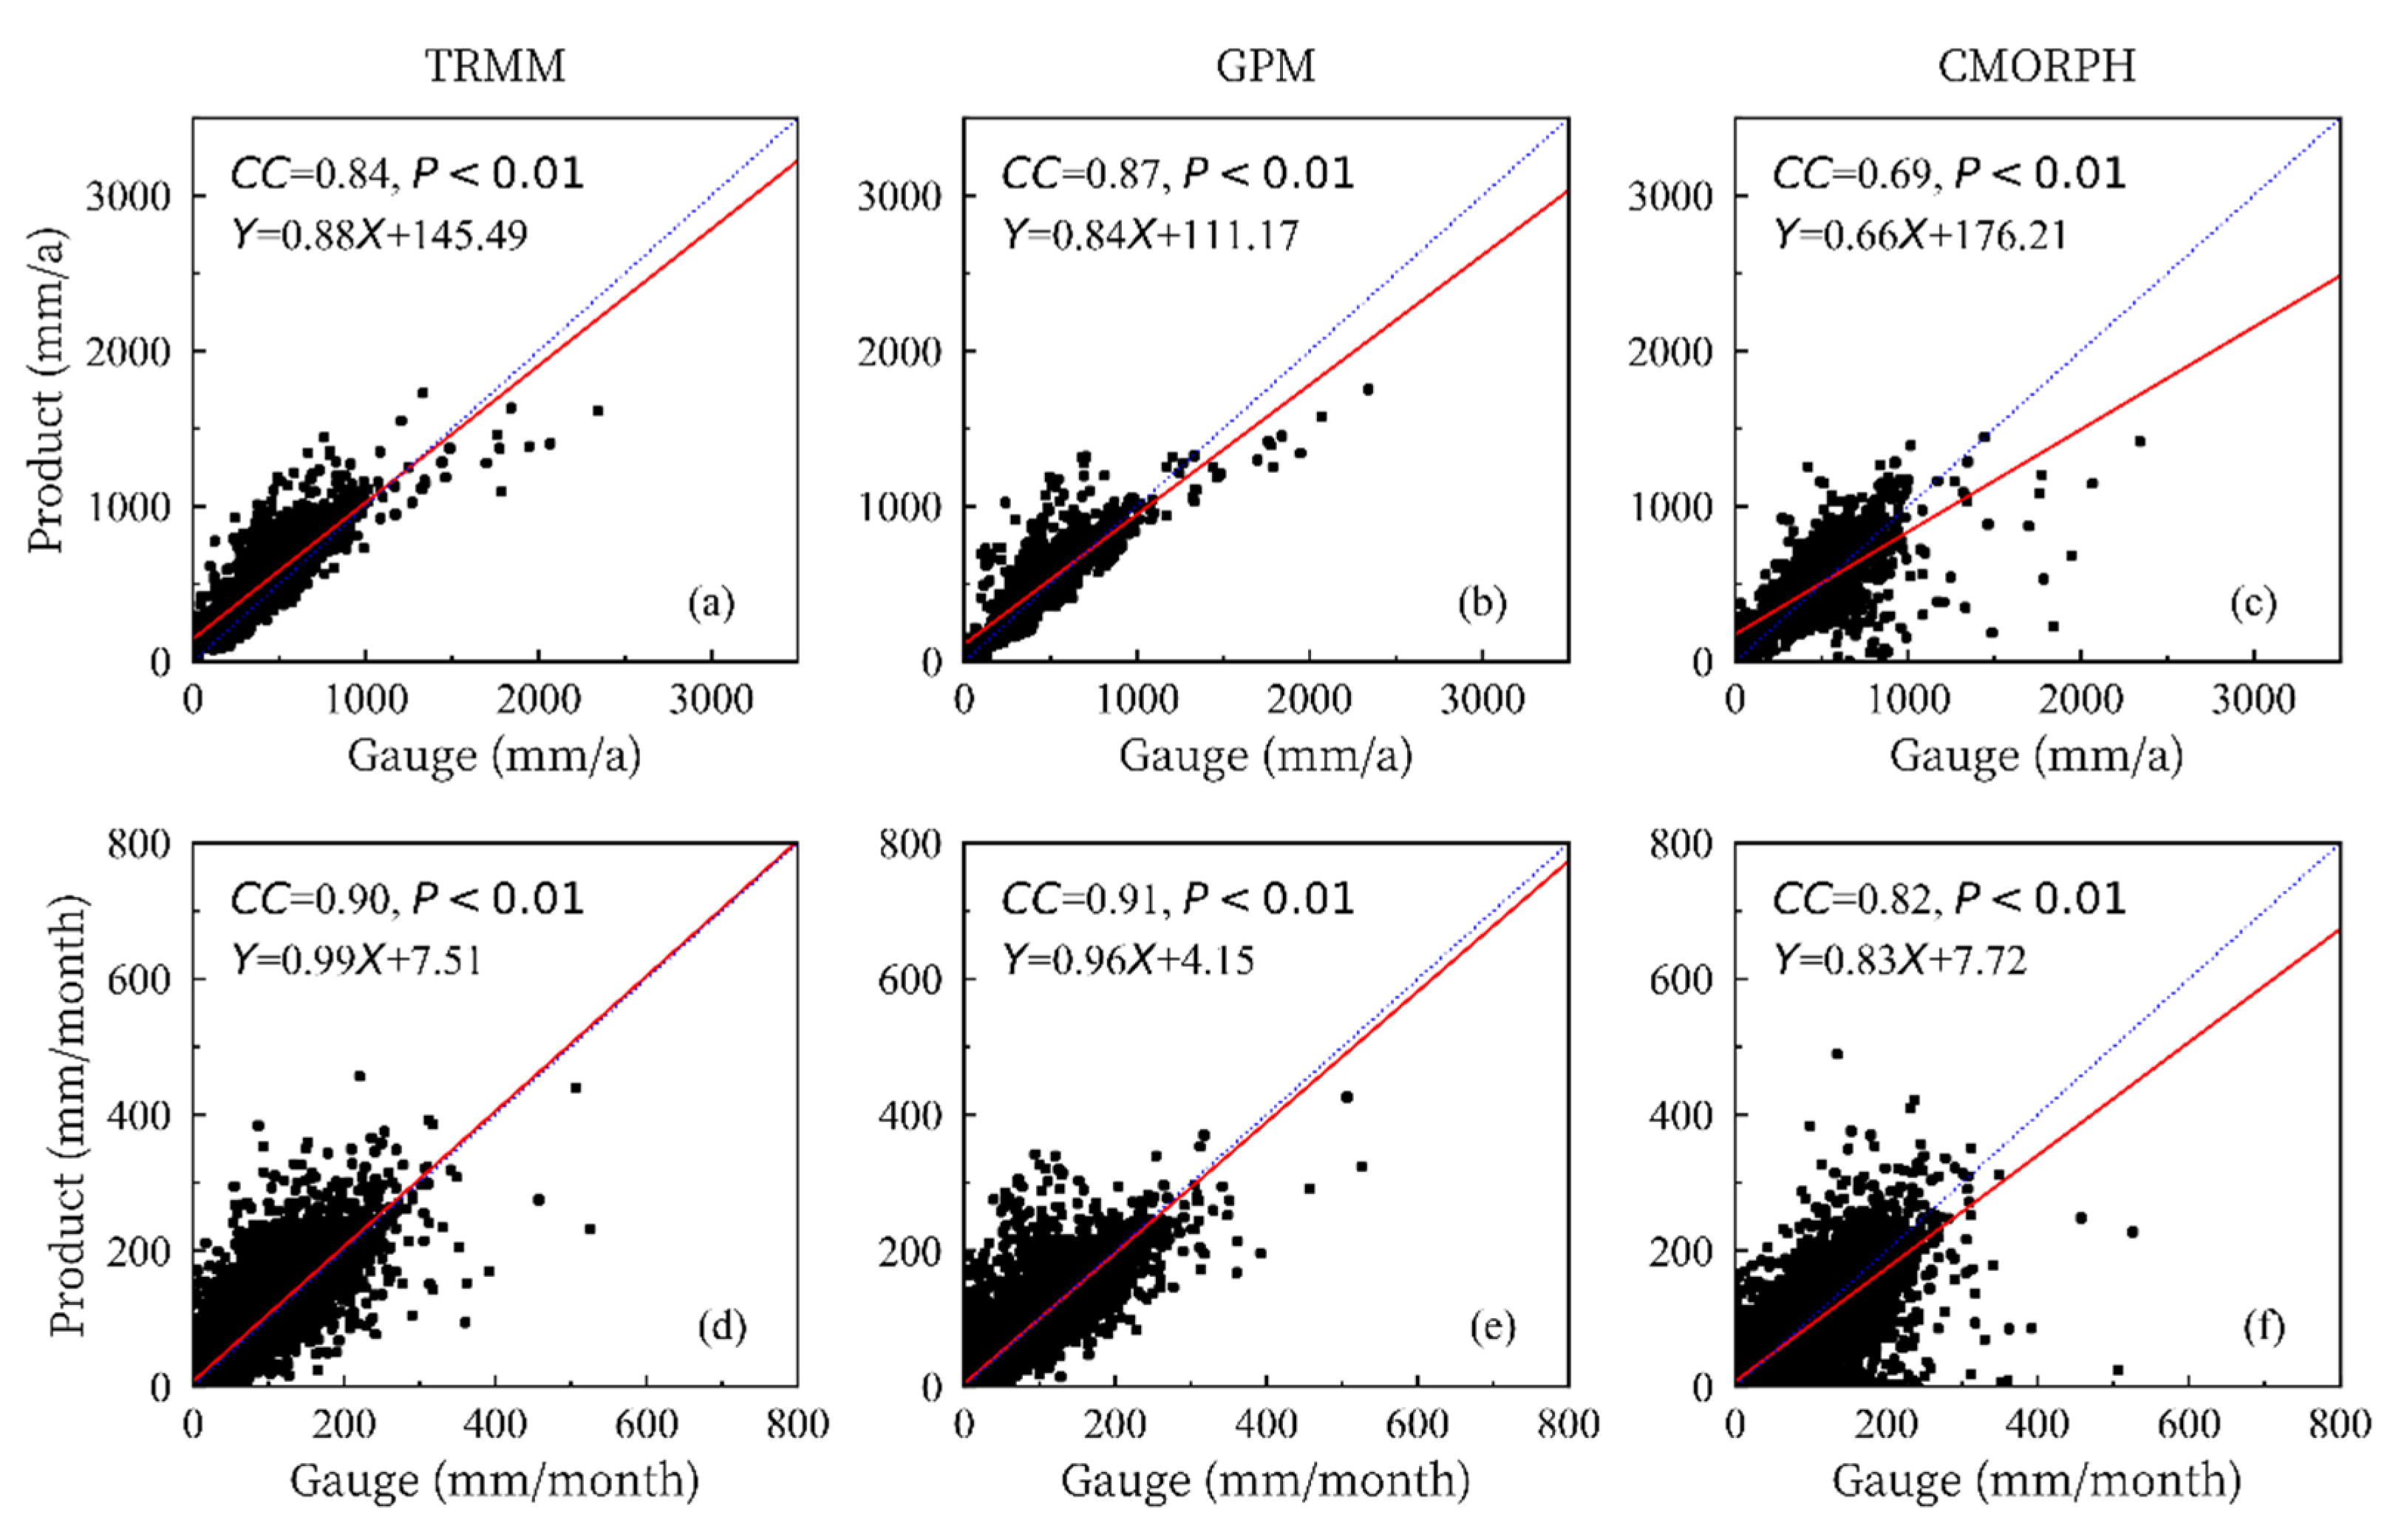
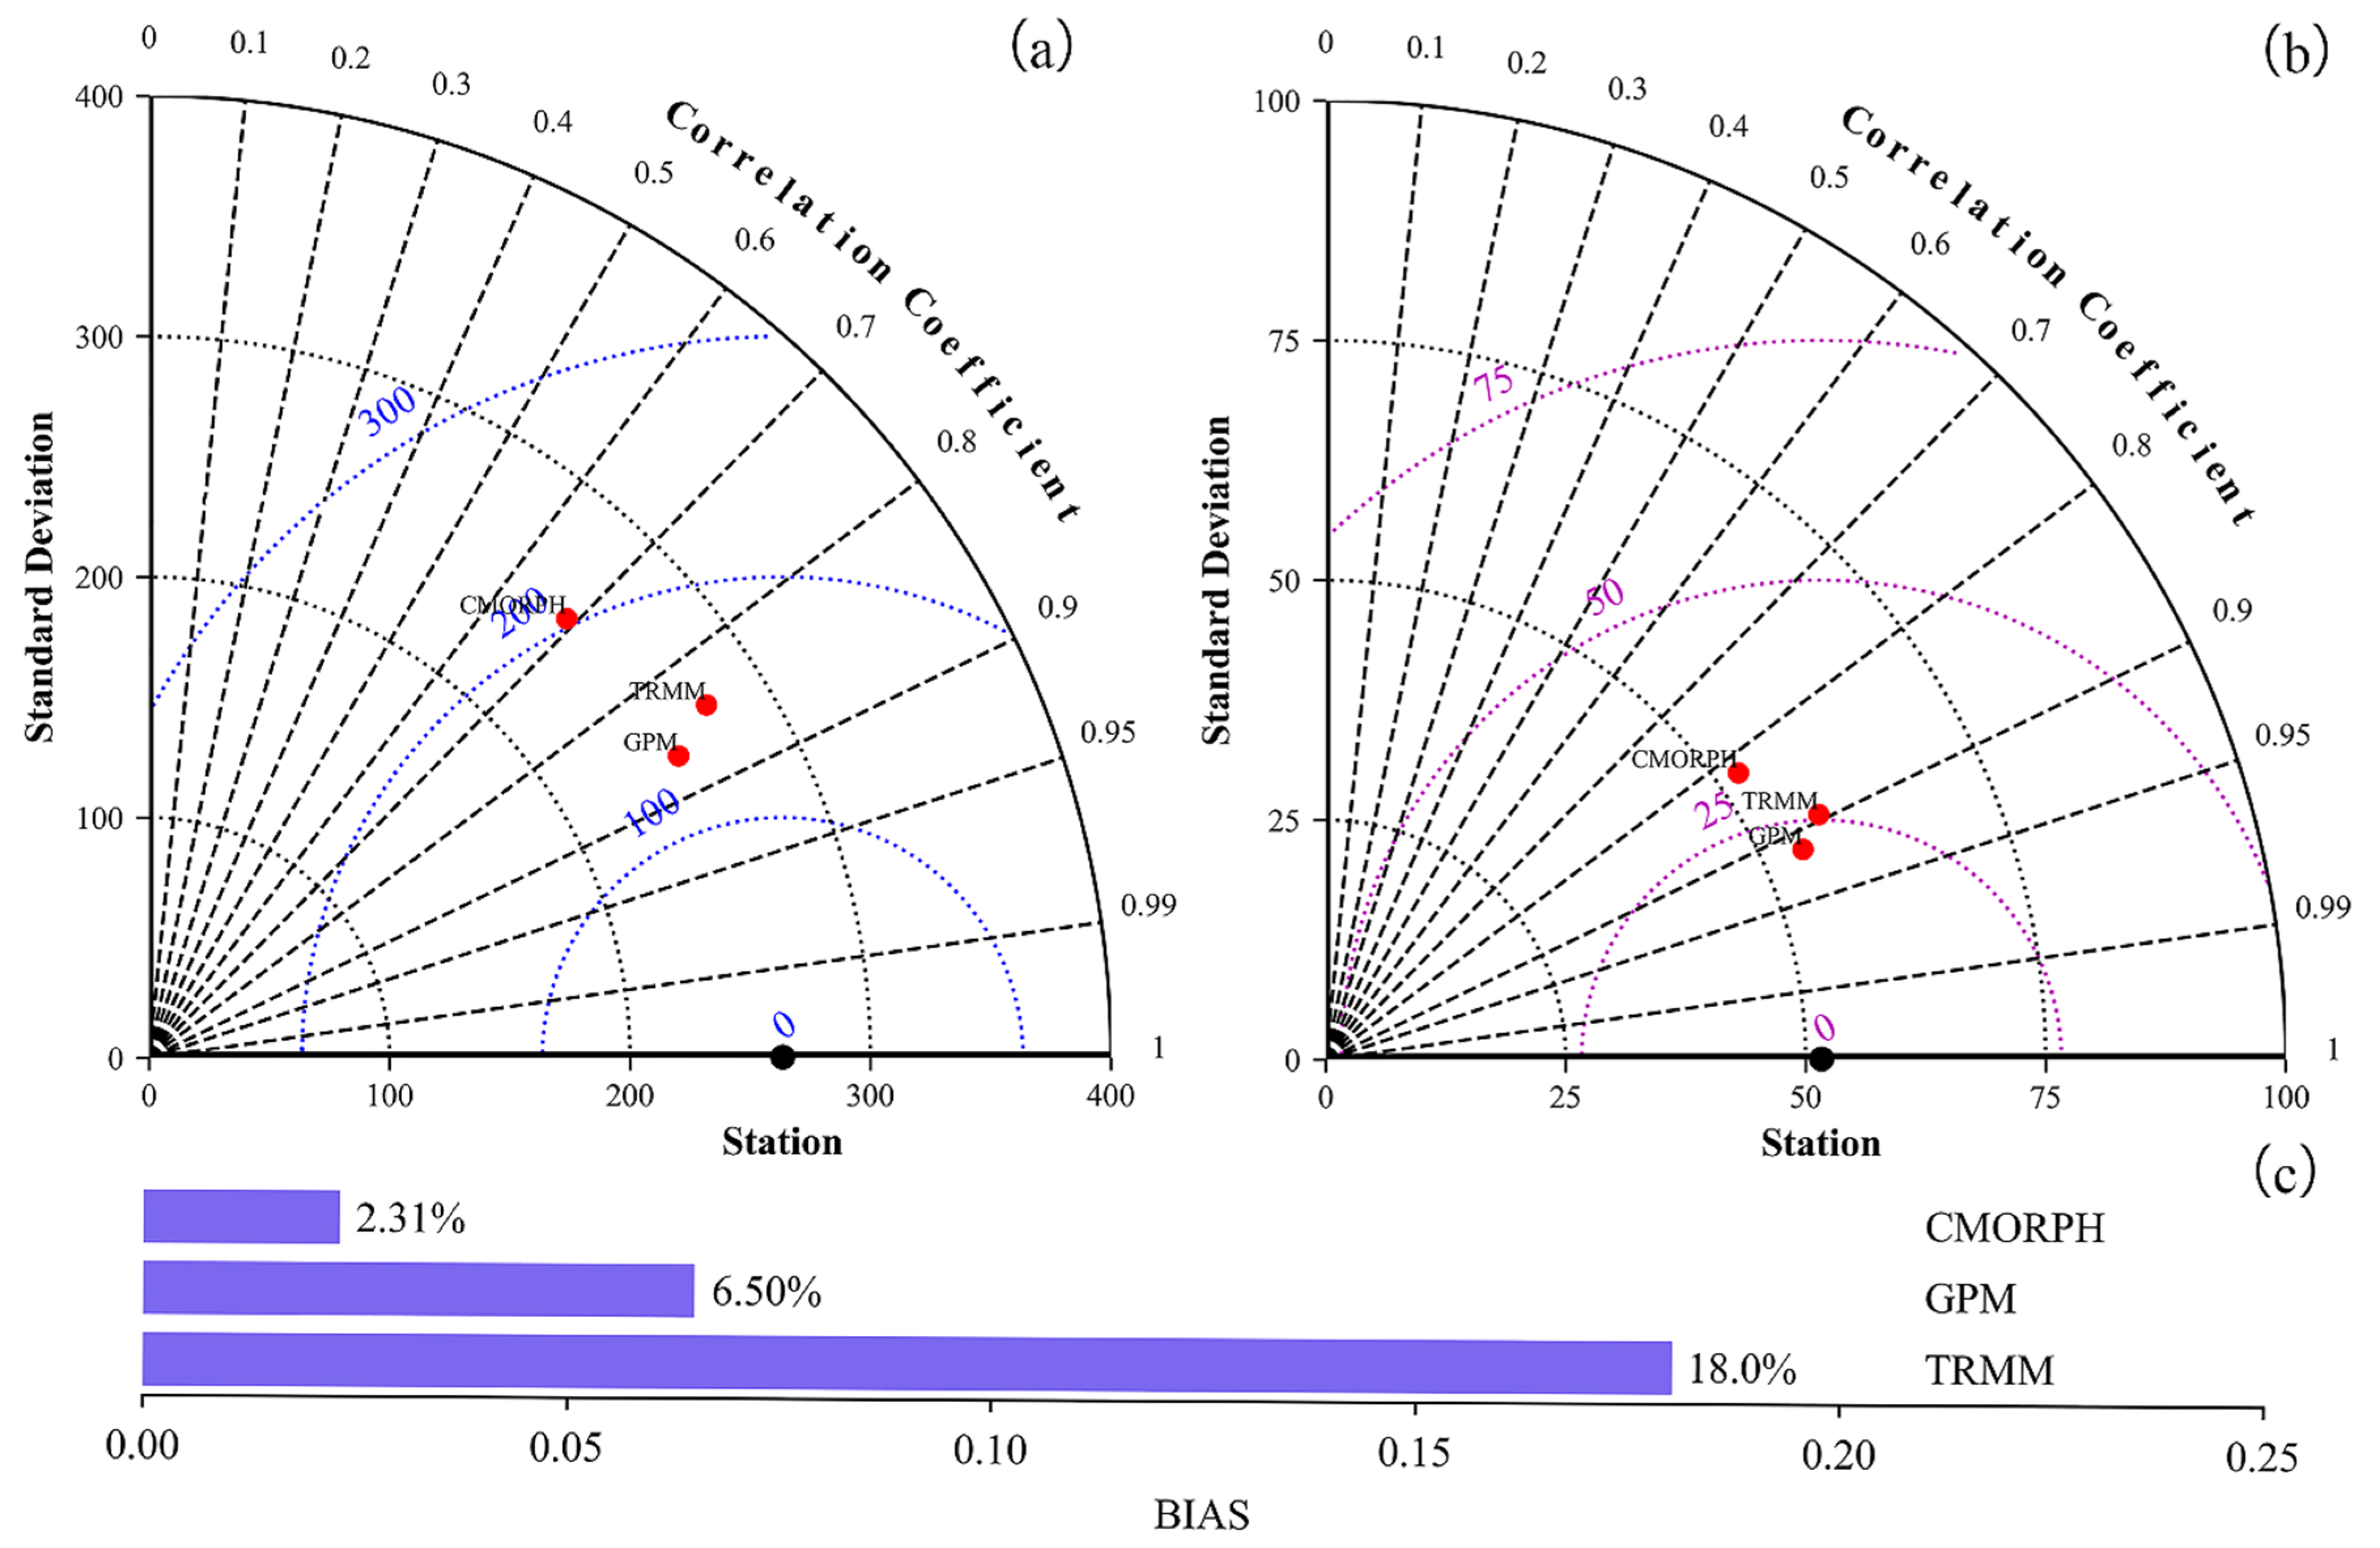
4.1. Evaluation of Precipitation Products at Annual and Monthly Scales

Figure 5 shows the correlation (with CC as the evaluation index) between the three precipitation products and gauge data at the annual and monthly scales. The fitted lines of all three products at the annual and monthly scales were biased to the right of the 1:1 straight line, indicating that in general, the remote sensing products underestimated the precipitation observed at the gauges. The correlations at the monthly scale were better than those at the annual scale for all three precipitation products. The correlations of TRMM and GPM at both time scales (CC > 0.8) were higher than that of CMORPH, but GPM had a higher correlation than TRMM at the annual (CC = 0.87) and monthly scales (CC = 0.91).
Based on the monthly precipitation series composed of all ground stations on the TP, the correlation differences among different products each month were further analyzed (as shown in Figure 6). Overall, GPM showed the best inversion performance. Except for CMORPH, the correlation between precipitation products and gauge data for most months was above 0.6, except for that of TRMM in December. There were five months (June, July, August, September and October) with CC values above 0.6 for CMORPH. The maximum values of monthly precipitation correlations for TRMM, GPM and CMORPH occurred in September (CC = 0.85), April (CC = 0.91) and August/September (CC = 0.78), respectively. The minimum values of CC all occurred in December, indicating that the improvement of the inversion capability of each product needs to be focused on December. The improvement of GPM over TRMM was particularly evident in the monthly precipitation assessment. Except for July and August when the CC values decreased, all other months showed different degrees of improvement, with the most significant improvements in December.
Figure 7 shows the precipitation Taylor plots at the annual and monthly scales and the bar plot that could simultaneously represent the differences in the relative deviation of the three products. The smaller the distance between the precipitation product and the gauge data in the Taylor plot was, the better the performance of the precipitation product was [15]. The results show that the best-performing product at both time scales was GPM, and the inversion differences at the monthly scale among the three precipitation products were smaller than those at the annual scale. The relative deviation showed that CMORPH had the smallest error with gauge precipitation, followed by GPM and TRMM.

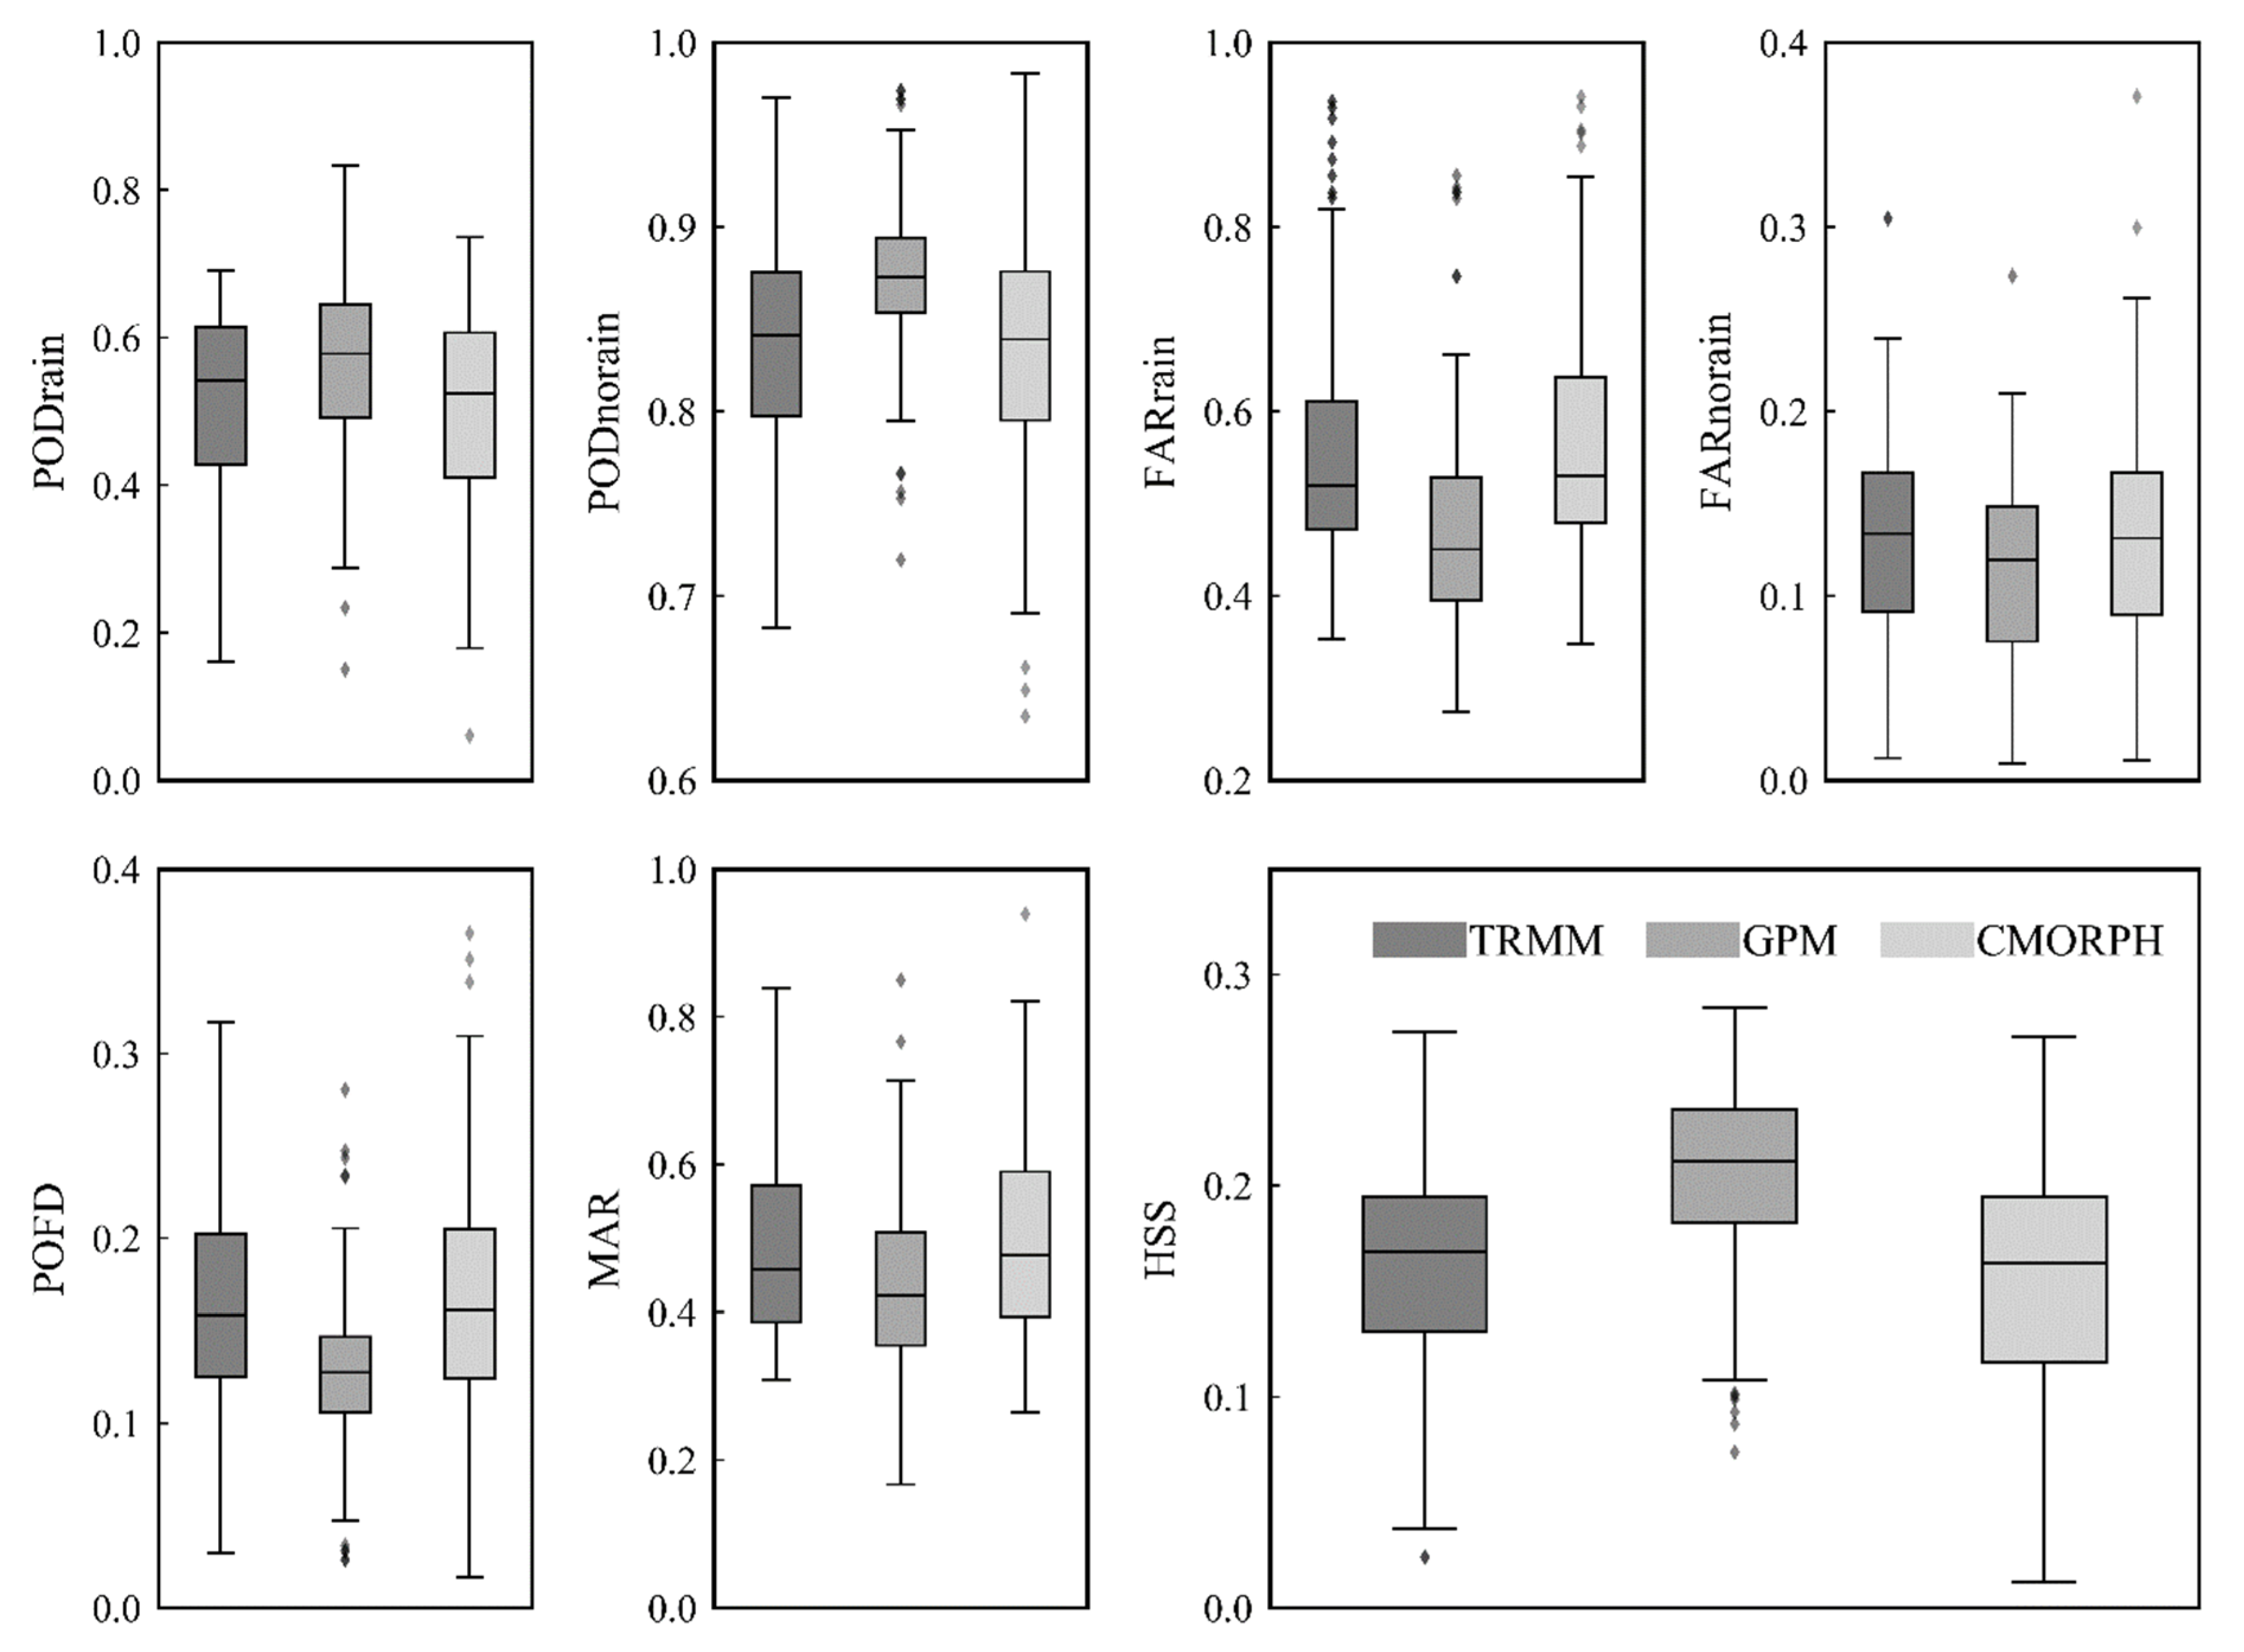
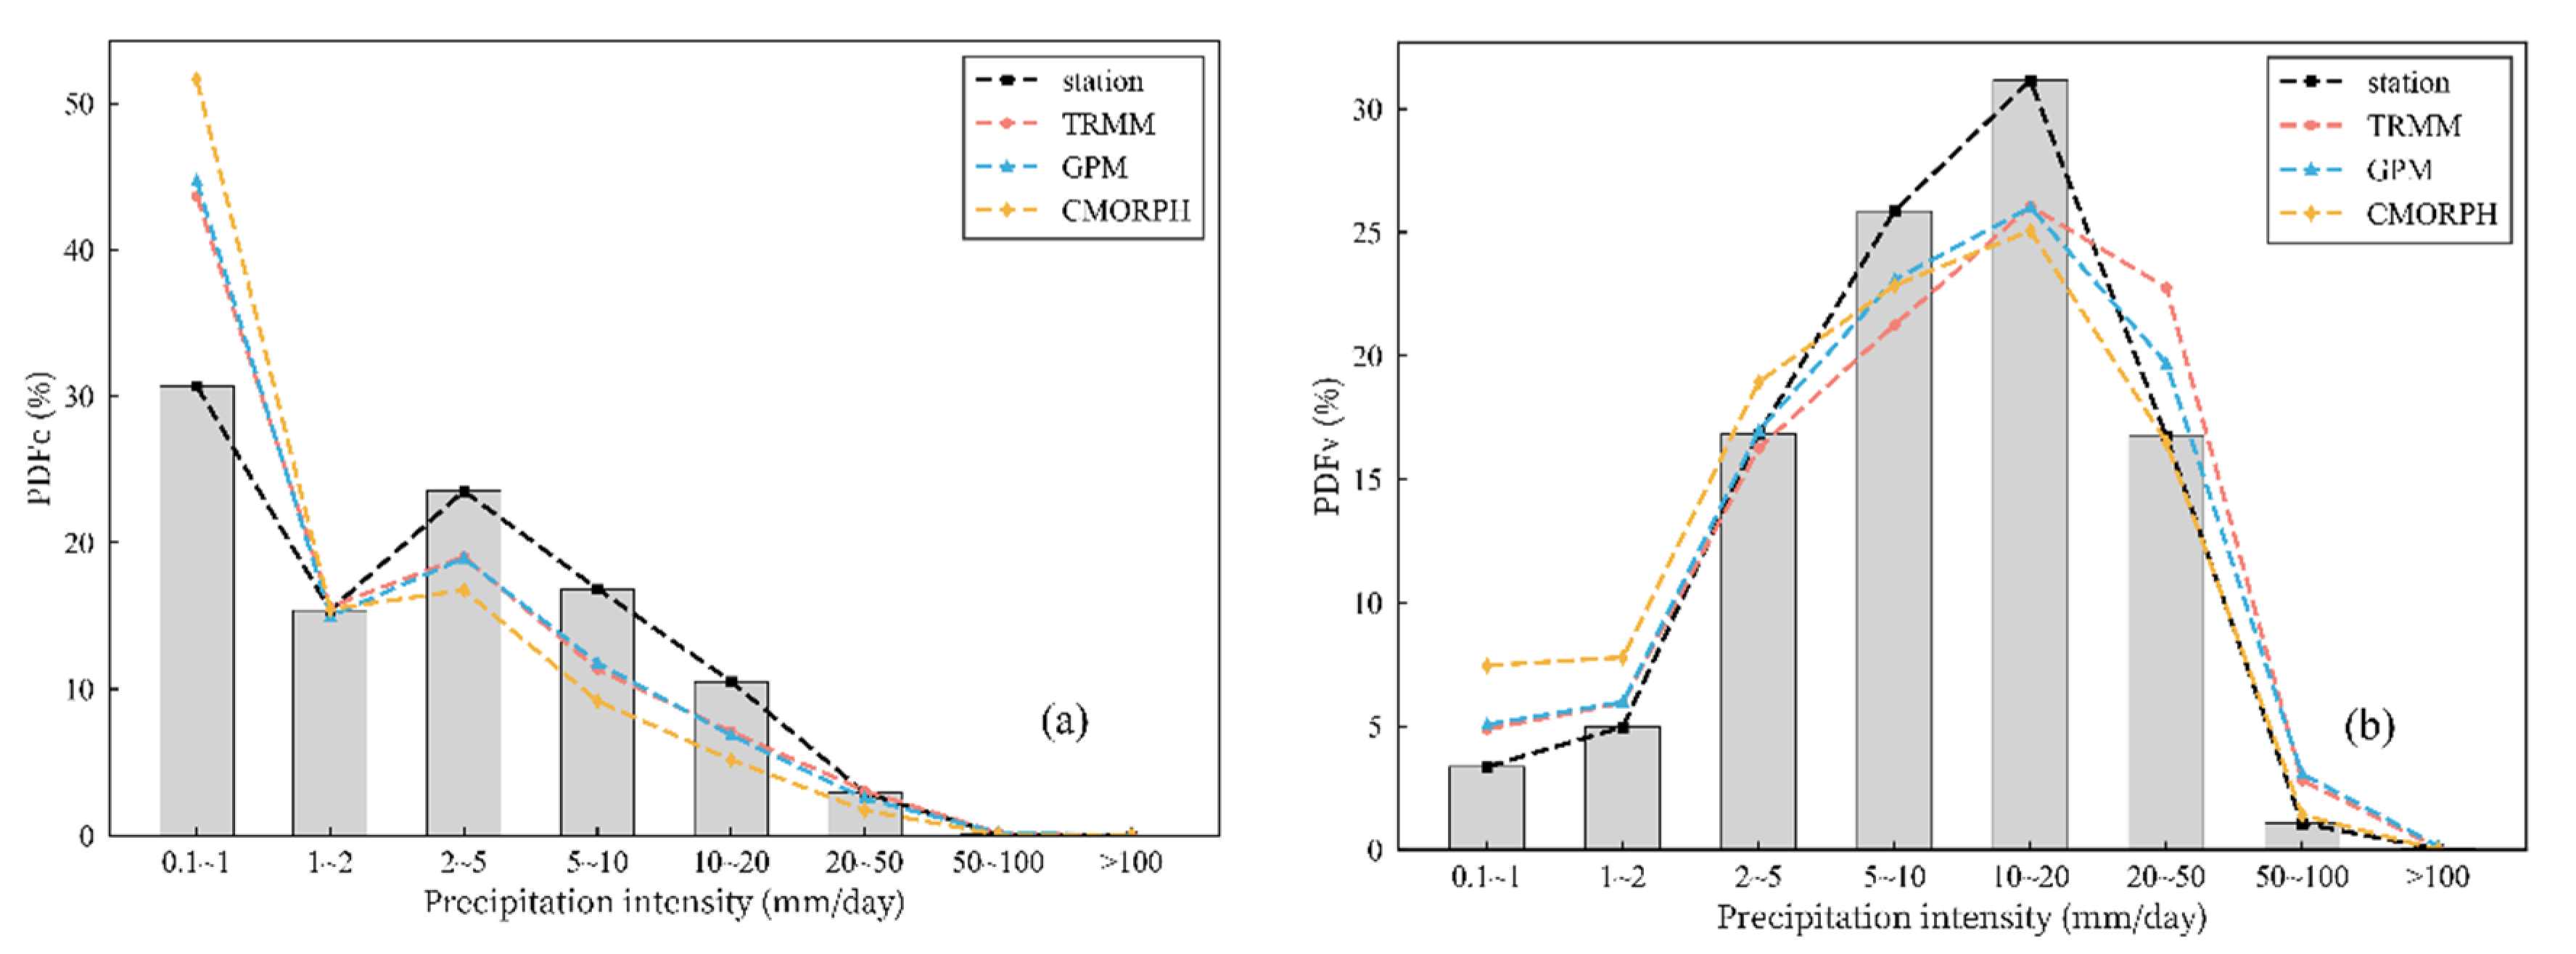
4.2. Daily Precipitation Capturing Capacity and Distribution

Based on the daily precipitation data from all rain gauges during the study period on the TP, the capturing capabilities of the three precipitation products were evaluated according to the described indexes in this study. The box plots of each detection capability index are shown in Figure 8. The detection capabilities of both precipitation and non-precipitation events of GPM were better than those of the other products, as shown by the median, upper and lower quartiles of PODrain and PODnorain being greater than those of the other products. Compared with PODrain and PODnorain, FARrain and FARnorain of GPM showed the opposite variation, indicating that GPM could reduce the maximum degree of error for detected events. POFD and MAR represented the misreporting ratios for actual non-precipitation and actual precipitation events, and the box plots of POFD and MAR indicated that GPM had fewer detection errors than the other two products. The high score and the low dispersion of data distribution range for HSS indicated the performance of GPM was the best one, while TRMM and CMORPH had approximately equal detection capabilities.
To evaluate the inversion capability of the precipitation products for different levels of precipitation, this study divided the precipitation intensity into eight interval ranges [37]. The ranges included 0.1~1 mm/day, 1~2 mm/day, 2~5 mm/day, 5~10 mm/day, 10~20 mm/day, 20~50 mm/day, 50~100 mm/day and >100 mm/day. Figure 9 shows the probability distribution of the precipitation products and gauge data under the evaluation modes of PDFc and PDFv using gauge data as the reference standard. The precipitation on the TP was more frequent in the intensity intervals of 0.1~1 mm/day and 2~5 mm/day than in the other intervals, and the probability of occurrence in the range of 0.1~1 mm/day was the largest. All three products overestimated the number of precipitation occurrences at 0.1~1 mm/day and underestimated the number of occurrences at 2~20 mm/day. This estimation error was the largest for CMORPH among all products, while those of TRMM and GPM were not significantly different. Although the number of low-intensity precipitation occurrences in the 0.1~1 mm/day range was high, the overall quantity was small. On the other hand, the frequency of high-intensity precipitation above 50 mm/day on the TP was small, causing the PDFv curve to exhibit a low end and a high middle and to peak in the 10~20 mm/day precipitation range. It indicates that precipitation at 10~20 mm/day produced the maximum contribution.
The study of the inversion capability of extreme precipitation was useful for analyzing the application potential of the different precipitation products in disaster prevention and mitigation. Using the annual maximum daily precipitation as a characterization indicator of extreme precipitation, we also analyzed the inversion status of the three products on the actual precipitation values when the annual maximum daily precipitation was observed at each ground station. The results in Figure 10 show that the correlation of annual maximum daily precipitation between precipitation products and gauge data was poor, with CC values ranging from 0.22 to 0.41. The best correlation was found for GPM, with a CC value of 0.41. The data points of all products were biased to the right side of the 1:1 straight line, indicating that the precipitation products underestimated the annual maximum daily precipitation. The maximum underestimation value could reach more than 100 mm (partial point data of TRMM and CMORPH), and GPM performed relatively well in this respect.

4.3. Regional Differences and Proportion of Evaluation Points with Different Precisions

The inversion effect of regional precipitation at the annual and monthly scales ultimately depended on the estimated status of daily precipitation at each station. We analyzed the differences in the spatial distribution of the daily precipitation inversion performance of each product and counted the percentage of the number of evaluation points within the different index intervals described in Table 2. The indicated ranges of the different intervals for each index correspond to the color scale shown on the right side of Figure 11 and Figure 12.
Figure 11 shows the differences in the spatial distribution of CC, BIAS and RMSE for the precipitation products and the proportion of evaluation points within the different intervals of the three indexes. The correlation between precipitation products and gauge data was generally better in the southeastern region than in the other areas, with most CC values lying between 0.15 and 0.45. GPM showed more stations with high CC values (>0.3) than the other two products, with an average CC value of 0.36. The BIAS values of the three products mainly lay below 1.5. All products had negative deviation values for about 30% of evaluation points, with TRMM having the smallest number of negative deviation values among all products. For the three precipitation products, RMSE values showed the distribution characteristics of being larger in the southeast and smaller in the northeast than in the other areas. Their RMSE range mainly lay between 2.5 and 7.5 mm/day, accounting for about 90% of all evaluation points. On average, CMORPH had the smallest RMSE value among all products, but its average RMSE value was not significantly different from that of GPM.
Figure 12 shows the spatial distribution of PODrain, PODnorain, FARrain, FARnorain, POFD, MAR and HSS for the three precipitation products and the percentage of evaluation points in the different intervals of each index. For the three products, PODrain and PODnorain values of more than half of the stations ranged from 0.50 to 0.75 and from 0.80 to 0.90, respectively. At some stations in the northeastern part of the TP, the PODnorain and FARrain values were higher for all three products than in other areas, while the opposite was true for the FARnorain and POFD values. The spatial distribution of PODrain, MAR and HSS differed significantly among all products. In the south, GPM had higher PODrain and lower MAR than the other products. In the northeast, TRMM had higher MAR than the other products. Stations with high HSS scores of TRMM and CMORPH were mainly located in the southeast, while HSS values of GPM were higher in the south and southeast than in the other areas. The mean HSS score of GPM was 0.2, while those of TRMM and CMORPH were 0.16 and 0.15, respectively. In general, GPM had the best detection capability among the three products, while TRMM and CMORPH were not very different, which was confirmed by the box plots of detectability indexes shown in Figure 6.

5. Conclusions and Discussion

Based on daily precipitation data from 87 rain gauges on the TP, we comprehensively evaluated the accuracy of three precipitation products (TRMM, GPM and CMORPH) at multiple time scales. The index system was constructed from three aspects of quantitative differences, capturing capacity and precipitation distribution. The regional differences between each product and the proportion of stations with different accuracy were also analyzed. The main conclusions are as follows:
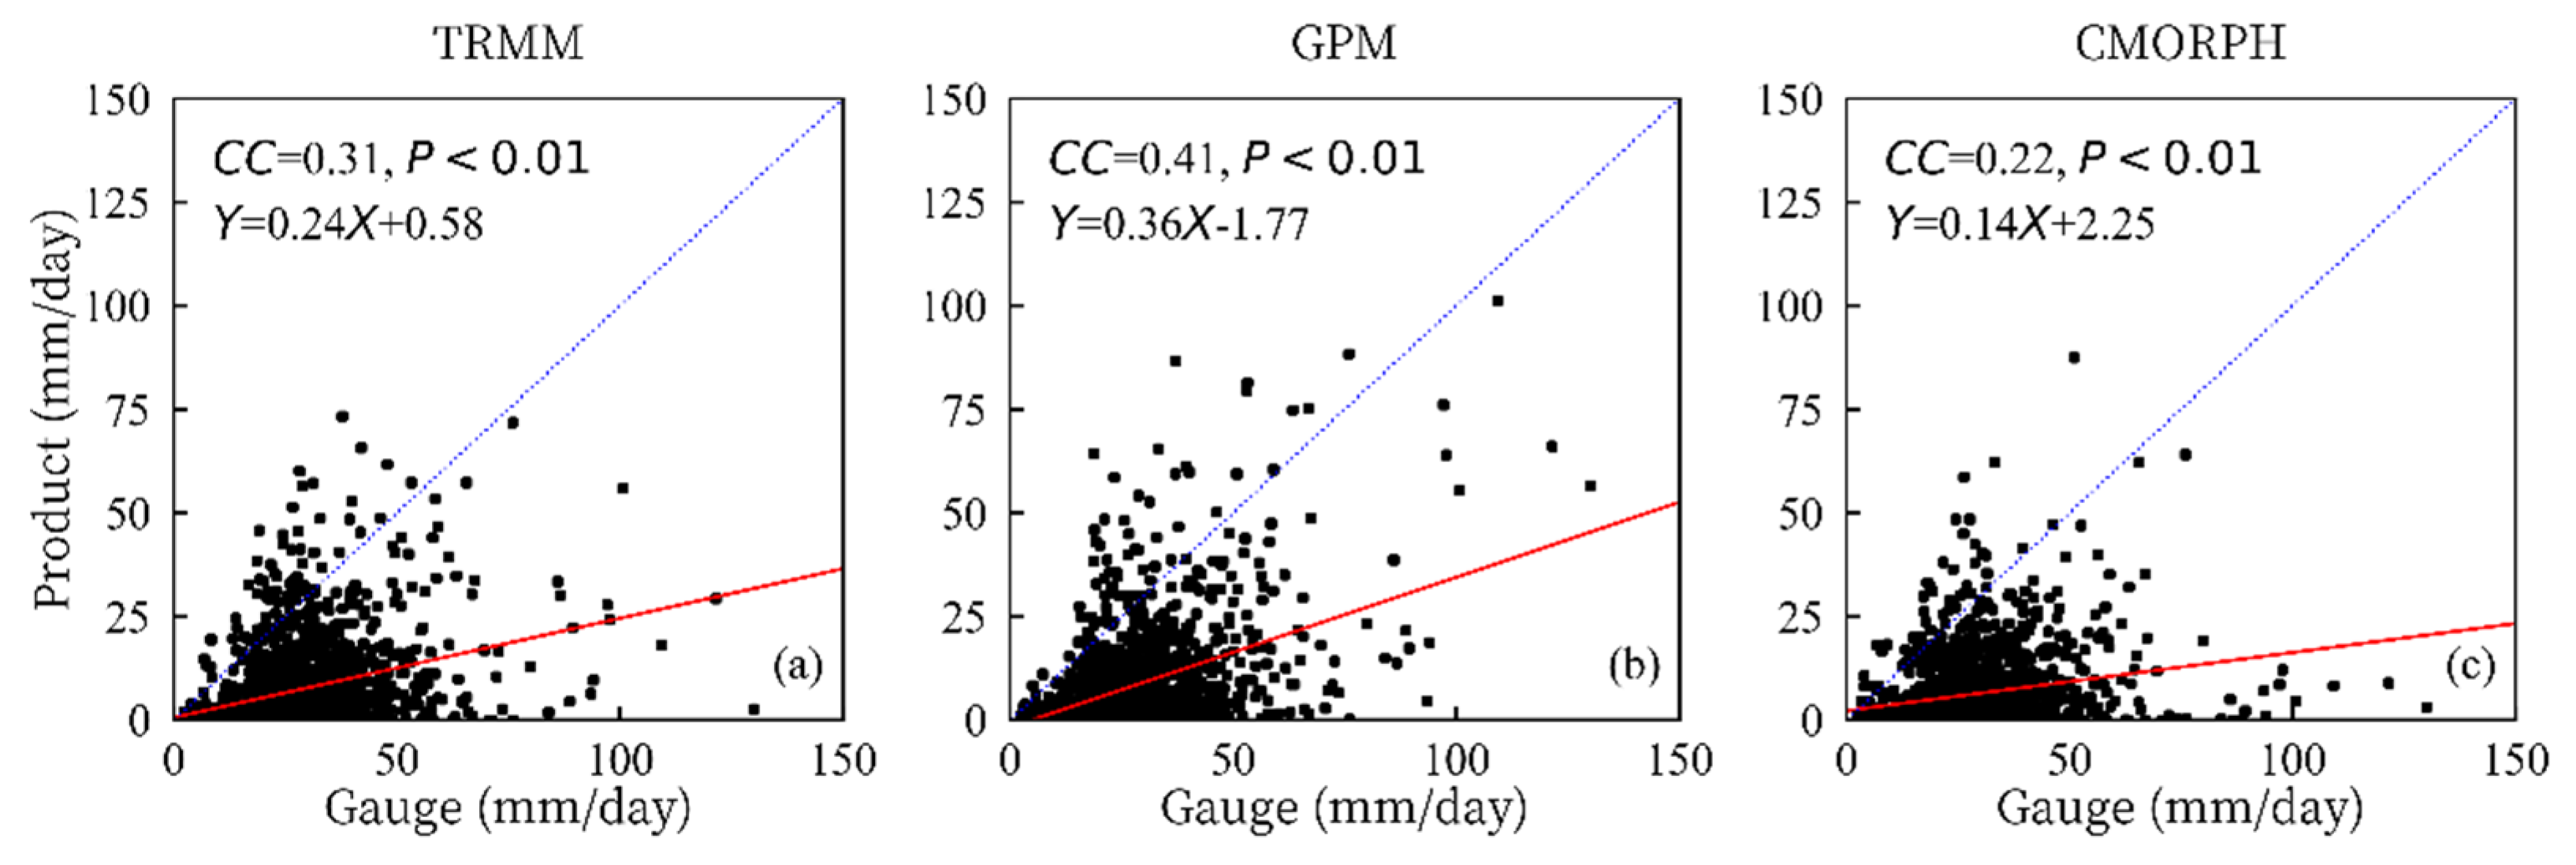
  • For all three products, the correlation was always higher at the monthly scale than at the annual scale, with the correlation in December being the lowest among all months. The correlations at the annual scale, at the monthly scale and in December of GPM were higher than those of the other products. In general, GPM performed best at both the annual and monthly scales, followed by TRMM and CMORPH;
  • GPM had the best detection accuracy for both precipitation and non-precipitation events, while TRMM and CMORPH had comparable capturing capabilities. The three products overestimated 0.1~1 mm/day precipitation, which occurred most frequently; underestimated precipitation at 10~20 mm/day, which contributed the largest proportion for precipitation of the TP; and underestimate the annual maximum daily precipitation;
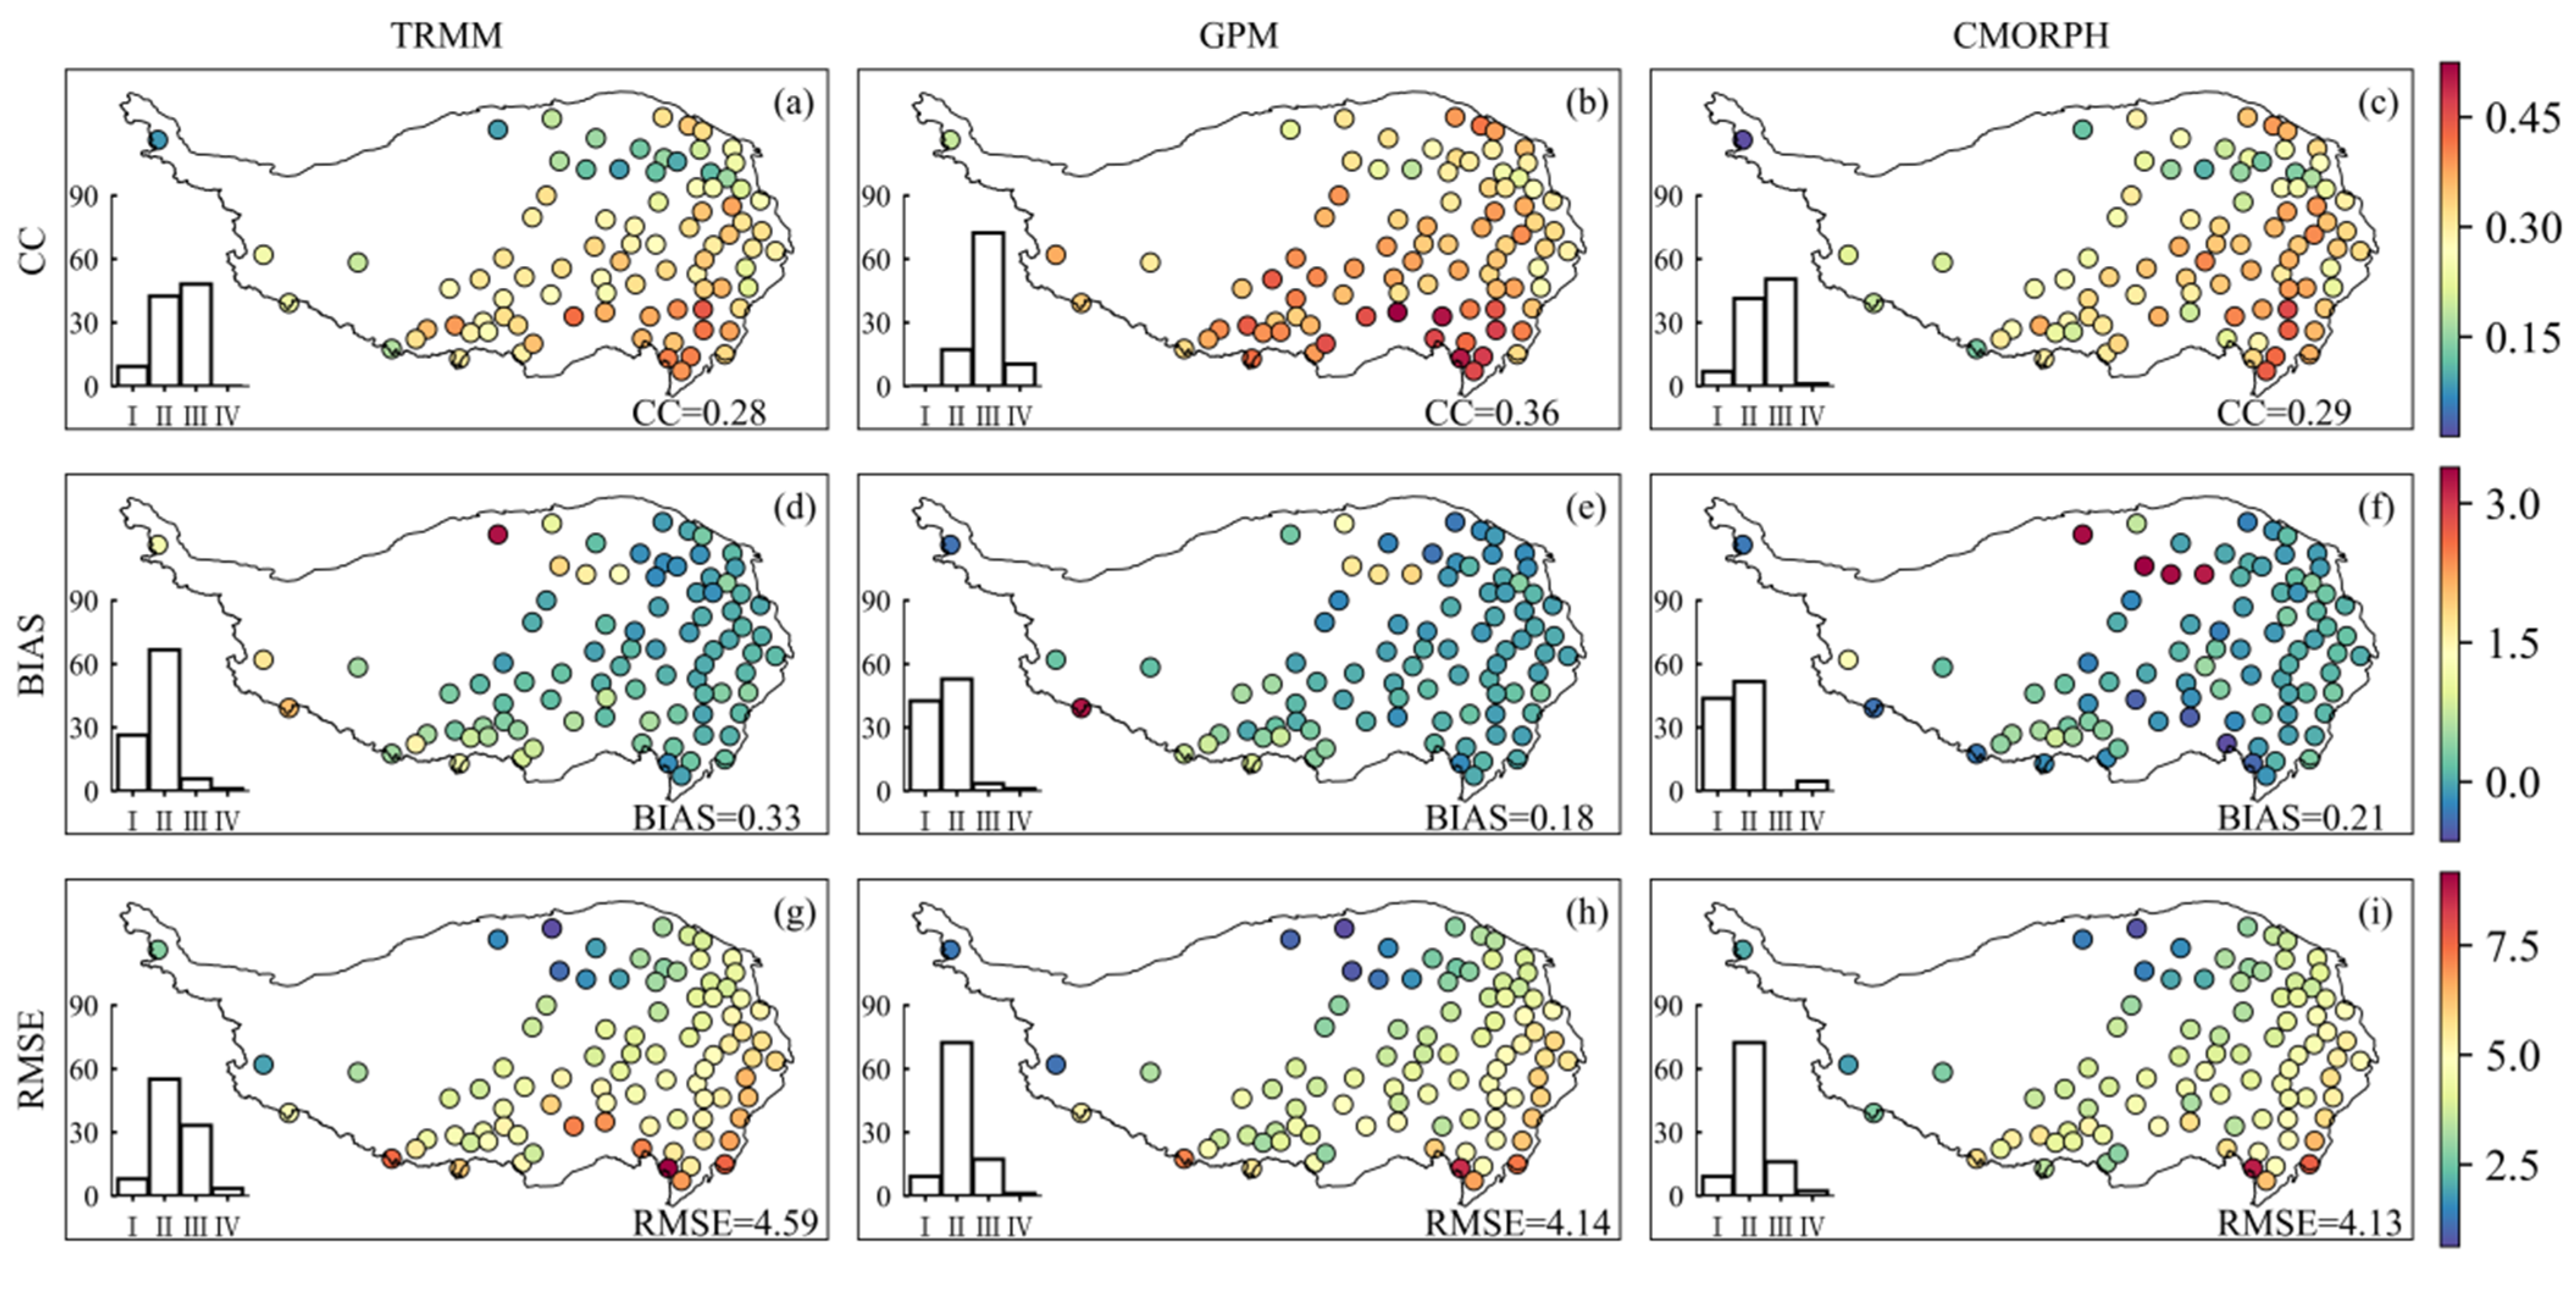
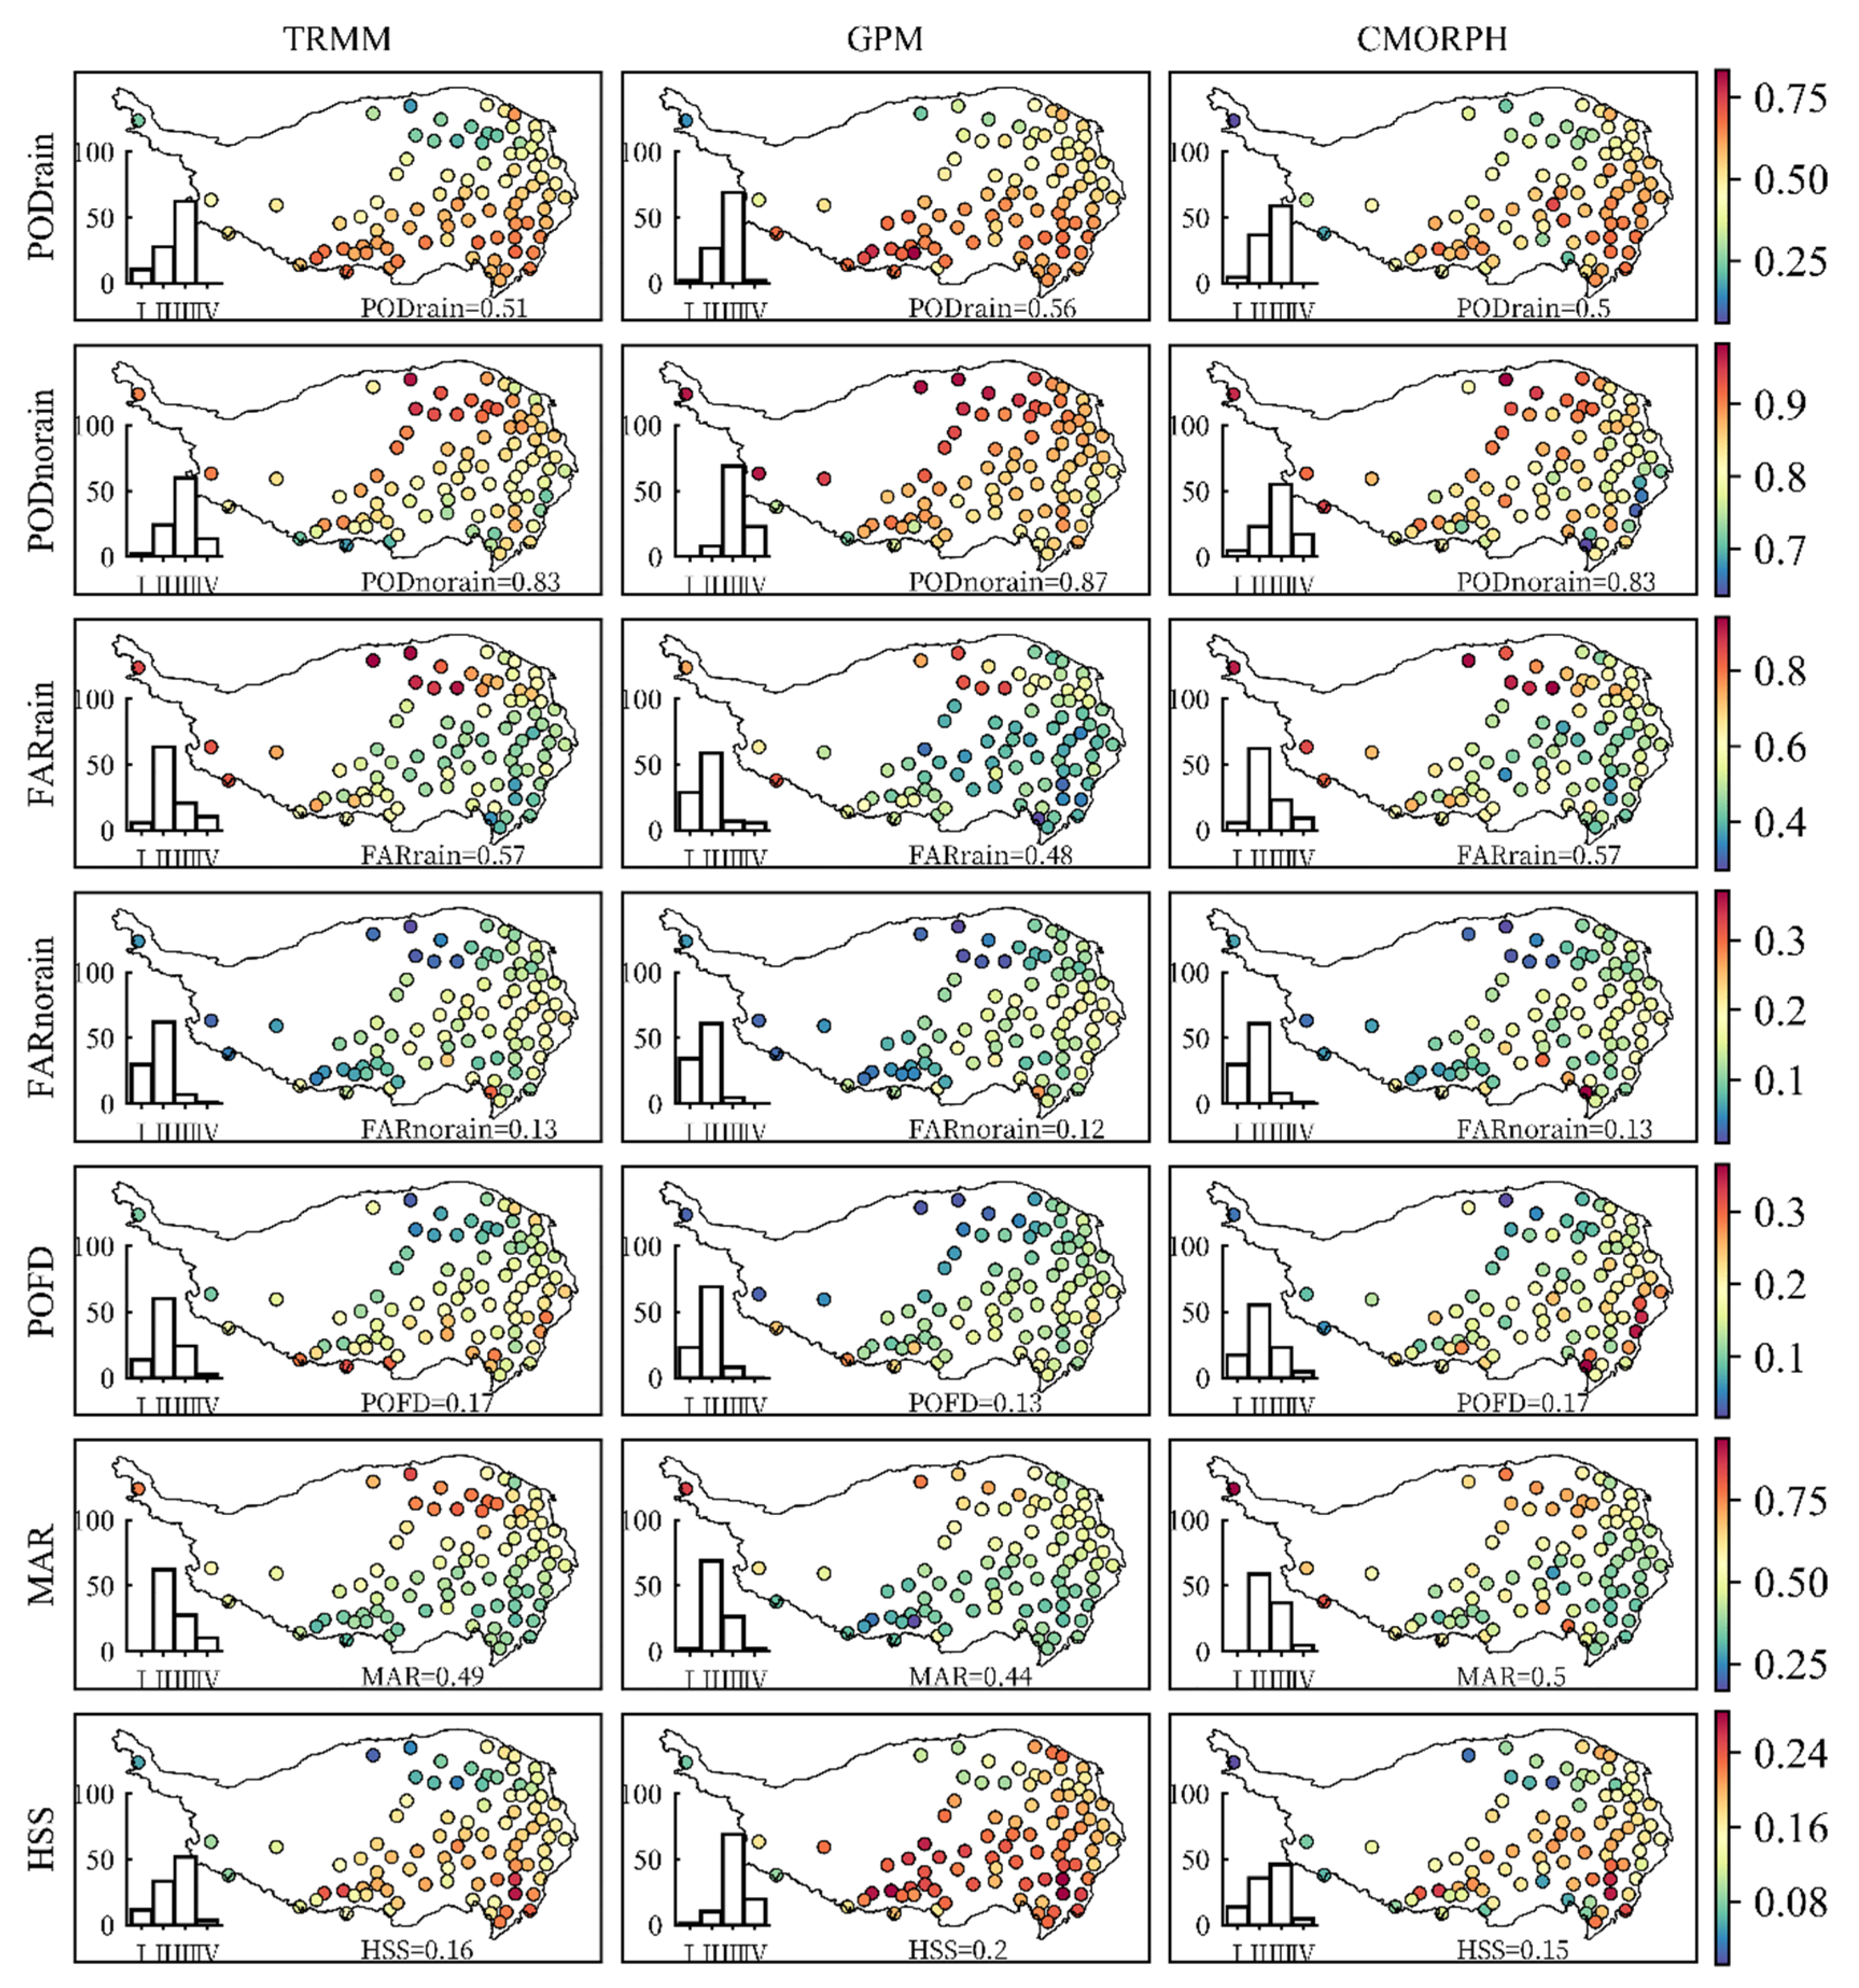
  • Compared with TRMM and CMORPH, GPM had higher CC in the southeast, higher PODrain in the south, higher HSS in the southern and central–eastern regions, and lower MAR in the southern part of the TP. The mean values of CC, BIAS, PODrain, PODnorain, FARrain, FARnorain, POFD, MAR and HSS of all stations showed that GPM had the best performance among the three products.
In this study, we evaluated the accuracy of three precipitation products on the TP using a variety of indexes. The timely evaluation of newly released products is important for the practical application of the products and the improvement of their inversion algorithms. However, due to the large topographic gradient and sparse gauges in the western part of the TP and the drastic changes in precipitation in the southeastern part of the plateau, it is necessary to further strengthen the precipitation monitoring network in the above regions. In addition, the remote sensing precipitation products have the advantages of wide coverage and long time series, and we aim to continue to apply remote sensing precipitation products in the TP in the future studies. There are two aspects to be considered in our future studies. One is to further analyze the trend of precipitation changes in the TP in recent years. The other one is to combine the inversion characteristics of different products for multi-source precipitation data fusion to provide a set of precipitation data with high accuracy for the TP.

Author Contributions

Conceptualization, F.L., Y.Z. and S.Y.; data curation, S.Y., X.W. and M.Z.; formal analysis, S.Y. and F.L.; funding acquisition, F.L. and Y.Z.; methodology, S.Y. and F.L.; software, S.Y., X.S., X.W. and K.W.; writing—original draft, S.Y.; writing—review and editing, F.L., Y.Z. and S.Y. All authors have read and agreed to the published version of the manuscript.

Funding

This research study was financially supported by Second Tibetan Plateau Scientific Expedition and Research Program (STEP) (grant No. 2019QZKK0207), National Natural Science Foundation of China (Nos. U2240201 and 51909275) and IWHR Research and Development Support Program (WR110145B0052021).

Conflicts of Interest

The authors declare no conflict of interest.

References

  1. Elhamid, A.M.; Eltahan, A.M.; Mohamed, L.M.; Hamouda, I.A. Assessment of the two satellite-based precipitation products TRMM and RFE rainfall records using ground based measurements. Alex. Eng. J. 2020, 59, 1049–1058. [Google Scholar] [CrossRef]
  2. Ren, M.; Xu, Z.; Pang, B.; Liu, W.; Liu, J.; Du, L.; Wang, R. Assessment of Satellite-Derived Precipitation Products for the Beijing Region. Remote Sens. 2018, 10, 1914. [Google Scholar] [CrossRef] [Green Version]
  3. Hou, A.Y.; Kakar, R.K.; Neeck, S.; Azarbarzin, A.A.; Kummerow, C.D.; Kojima, M.; Oki, R.; Nakamura, K.; Iguchi, T. The global precipitation measurement mission. Bull. Am. Meteorol. Soc. 2014, 95, 701–722. [Google Scholar] [CrossRef]
  4. Zhang, C.; Chen, X.; Shao, H.; Chen, S.; Liu, T.; Chen, C.; Ding, Q.; Du, H. Evaluation and Intercomparison of High-Resolution Satellite Precipitation Estimates-GPM, TRMM, and CMORPH in the Tianshan Mountain Area. Remote Sens. 2018, 10, 1543. [Google Scholar] [CrossRef] [Green Version]
  5. Fallah, A.; Oh, S.; Orth, R. Climate-Dependent Propagation of Precipitation Uncertainty into the Water Cycle. Hydrol. Earth Syst. Sci. 2020, 24, 3725–3735. [Google Scholar] [CrossRef]
  6. Wang, C.; Hong, Y. Review on Inversion, Verification and Application of Satellite Remote Sensing of Precipitation. Water Resour. Hydropower Eng. 2018, 49, 1–9. [Google Scholar]
  7. Xiong, L.; Liu, C.; Cheng, S.; Zha, X.; Ma, Q. Review of Post-Processing Research for Remote-Sensing Precipitation Products. Adv. Water Sci. 2021, 32, 627–637. [Google Scholar]
  8. Huffman, G.J.; Bolvin, D.T.; Nelkin, E.J.; Wolff, D.B.; Adler, R.F.; Gu, G.; Hong, Y.; Bowman, K.P.; Stocker, E.F. The TRMM Multisatellite Precipitation Analysis (TMPA): Quasi-Global, Multiyear, Combined-Sensor Precipitation Estimates at Fine Scales. J. Hydrometeorol. 2007, 8, 38–55. [Google Scholar] [CrossRef]
  9. Skofronick-Jackson, G.; Petersen, W.A.; Berg, W.; Kidd, C.; Stocker, E.F.; Kirschbaum, D.B.; Kakar, R.; Braun, S.A.; Huffman, G.J.; Iguchi, T.; et al. The Global Precipitation Measurement (GPM) Mission for Science and Society. Bull. Am. Meteorol. Soc. 2017, 98, 1679–1695. [Google Scholar] [CrossRef]
  10. Joyce, R.J.; Janowiak, J.E.; Arkin, P.A.; Xie, P. CMORPH: A Method That Produces Global Precipitation Estimates from Passive Microwave and Infrared Data at High Spatial and Temporal Resolution. J. Hydrometeorol. 2004, 5, 487–503. [Google Scholar] [CrossRef]
  11. Hsu, K.-L.; Gao, X.; Sorooshian, S.; Gupta, H.V. Precipitation Estimation from Remotely Sensed Information Using Artificial Neural Networks. J. Appl. Meteorol. 1997, 36, 1176–1190. [Google Scholar] [CrossRef]
  12. Okamoto, K.; Ushio, T.; Iguchi, T.; Takahashi, N.; Iwanami, K. The Global Satellite Mapping of Precipitation (GSMaP) Project. In Proceedings of the International Geoscience and Remote Sensing Symposium (IGARSS), Seoul, Korea, 29 July 2005; Volume 5, pp. 3414–3416. [Google Scholar]
  13. Derin, Y.; Anagnostou, E.; Berne, A.; Borga, M.; Boudevillain, B.; Buytaert, W.; Chang, C.-H.; Delrieu, G.; Hong, Y.; Hsu, Y.C.; et al. Multiregional Satellite Precipitation Products Evaluation over Complex Terrain. J. Hydrometeorol. 2016, 17, 1817–1836. [Google Scholar] [CrossRef]
  14. Wang, H.; Yuan, Y.; Zeng, S.; Li, W.; Tang, X. Evaluation of Satellite-Based Precipitation Products from GPM IMERG and GSMaP over the Three-River Headwaters Region, China. Hydrol. Res. 2021, 52, 1328–1343. [Google Scholar] [CrossRef]
  15. Peng, Z.; Li, Y.; Yu, W.; Xing, Y.; Feng, A. Research on the Applicability of Remote Sensing Precipitation Products in Different Climatic Regions of China. J. Geo-Inf. Sci. 2021, 23, 1296–1311. [Google Scholar]
  16. Tan, M.L.; Ibrahim, A.L.; Duan, Z.; Cracknell, A.P.; Chaplot, V. Evaluation of Six High-Resolution Satellite and Ground-Based Precipitation Products over Malaysia. Remote Sens. 2015, 7, 1504–1528. [Google Scholar] [CrossRef] [Green Version]
  17. Yu, L.; Ma, L.; Li, H.; Zhang, Y.; Kong, F.; Yang, Y. Assessment of high-resolution satellite rainfall products over a gradually elevating mountainous terrain based on a high-density rain gauge network. Int. J. Remote Sens. 2020, 41, 5620–5644. [Google Scholar] [CrossRef]
  18. Peng, F.; Zhao, S.; Chen, C.; Cong, D.; Wang, Y.; Ouyang, H. Evaluation and comparison of the precipitation detection ability of multiple satellite products in a typical agriculture area of China. Atmos. Res. 2020, 236, 104814. [Google Scholar] [CrossRef]
  19. Liu, J.; Shangguan, D.; Liu, S.; Ding, Y.; Wang, S.; Wang, X. Evaluation and Comparison of CHIRPS and MSWEP Daily-Precipitation Products in the Qinghai-Tibet Plateau during the Period of 1981–2015. Atmos. Res. 2019, 230, 104634. [Google Scholar] [CrossRef]
  20. Duan, Z.; Liu, J.; Tuo, Y.; Chiogna, G.; Disse, M. Evaluation of eight high spatial resolution gridded precipitation products in Adige Basin (Italy) at multiple temporal and spatial scales. Sci. Total Environ. 2016, 573, 1536–1553. [Google Scholar] [CrossRef] [Green Version]
  21. Hosseini-Moghari, S.-M.; Tang, Q. Validation of GPM IMERG V05 and V06 Precipitation Products over Iran. J. Hydrometeorol. 2020, 21, 1011–1037. [Google Scholar] [CrossRef] [Green Version]
  22. Li, G.; Yu, Z.; Wang, W.; Ju, Q.; Chen, X. Analysis of the spatial Distribution of precipitation and topography with GPM data in the Tibetan Plateau. Atmos. Res. 2021, 247, 105259. [Google Scholar] [CrossRef]
  23. Wang, S.; Liu, J.; Wang, J.; Qiao, X.; Zhang, J. Evaluation of GPM IMERG V05B and TRMM 3B42V7 Precipitation Products over High Mountainous Tributaries in Lhasa with Dense Rain Gauges. Remote Sens. 2019, 11, 2080. [Google Scholar] [CrossRef] [Green Version]
  24. Yao, T.; Chen, F.; Cui, P.; Ma, Y.; Xu, B.; Zhu, L.; Zhang, F.; Wang, W.; Ai, L.; Yang, X. From Tibetan Plateau to Third Pole and Pan-Third Pole. Bull. Chin. Acad. Sci. 2017, 32, 924–931. [Google Scholar]
  25. Liu, Z.; Yang, M.; Wang, X.; Cheng, L. The GPM and TRMM Satellite-Based Precipitation Products Applied in the Source Regions of the Yellow River. J. Glaciol. Geocryol. 2020, 42, 575–586. [Google Scholar]
  26. Liu, J.; Xu, Z.; Zhao, H.; He, J. Accuracy Assessment for Two Satellite Precipitation Products: Case Studies in the Yarlung Zangbo River Basin. Plateau Meteorol. 2019, 38, 386–396. [Google Scholar]
  27. Lv, Y.; Yang, S.; Cai, M.; Zhou, Q.; Dong, G. The Applicability Analysis of TRMM Precipitation Data in the Yarlung Zangbo River Basin. J. Nat. Resour. 2013, 28, 1414–1425. [Google Scholar]
  28. Zhang, M.; Huang, A.; Ji, X.; Wang, M.; Tan, Y. Validation of Satellite Precipitation Products over Qinghai-Xizang Plateau Region. Plateau Meteorol. 2016, 35, 34–42. [Google Scholar]
  29. Jiang, X.; Liu, Y.; Wu, Y.; Wang, G.; Wu, W.; Jin, J.; He, R.; Liu, C. Research on the Quality Evaluation of GPM Satellite Precipitation Data Products Taking the Yarlung Zangbo River as an Example. China Rural Water Hydropower 2021, 6, 91–97. [Google Scholar]
  30. Yu, K.; Zhang, Y.; Ma, N.; Guo, Y. Applicability of GPM and TRMM Remote Sensing Precipitation Products in the Central Tibet Plateau. Arid Zone Res. 2018, 35, 1373–1381. [Google Scholar]
  31. Shen, Y.; Xiong, A.; Wang, Y.; Xie, P. Performance of High-Resolution Satellite Precipitation Products over China. J. Geophys. Res. Atmos. 2010, 115, D2. [Google Scholar] [CrossRef]
  32. Qin, Y.; Chen, Z.; Shen, Y.; Zhang, S.; Shi, R. Evaluation of Satellite Rainfall Estimates over the Chinese Mainland. Remote Sens. 2014, 6, 11649–11672. [Google Scholar] [CrossRef] [Green Version]
  33. Bai, P.; Liu, X. Evaluation of Five Satellite-Based Precipitation Products in Two Gauge-Scarce Basins on the Tibetan Plateau. Remote Sens. 2018, 10, 1316. [Google Scholar] [CrossRef] [Green Version]
  34. Wang, G.; Zhang, P.; Liang, L.; Zhang, S. Evaluation of precipitation from CMORPH, GPCP-2, TRMM 3B43, GPCC, and ITPCAS with ground-based measurements in the Qinling-Daba Mountains, China. PLoS ONE 2017, 12, e0185147. [Google Scholar]
  35. Tan, M.L.; Duan, Z. Assessment of GPM and TRMM Precipitation Products over Singapore. Remote Sens. 2017, 9, 720. [Google Scholar] [CrossRef] [Green Version]
  36. Yan, D.; Liu, S.; Qin, T.; Weng, B.; Li, C.; Lu, Y.; Liu, J. Evaluation of TRMM Precipitation and Its Application to Distributed Hydrological Model in Naqu River Basin of the Tibetan Plateau. Hydrol. Res. 2017, 48, 822–839. [Google Scholar] [CrossRef] [Green Version]
  37. Xu, F.; Guo, B.; Ye, B.; Ye, Q.; Chen, H.; Ju, X.; Guo, J.; Wang, Z. Systematical Evaluation of GPM IMERG and TRMM 3B42V7 Precipitation Products in the Huang-Huai-Hai Plain, China. Remote Sens. 2019, 11, 697. [Google Scholar] [CrossRef] [Green Version]
  38. Zhang, Y.; Li, B.; Liu, L.; Zheng, D. Redetermine the Region and Boundaries of Tibetan Plateau. Geogr. Res. 2021, 40, 1543–1553. [Google Scholar]
  39. Zhang, Y.; Li, B.; Zheng, D. A Discussion on the Boundary and Area of the Tibetan Plateau in China. Geogr. Res. 2002, 21, 1–8. [Google Scholar]
  40. Zhang, Y.; Ren, H.; Pan, X. Integration Dataset of Tibet Plateau Boundary. Available online: https://data.tpdc.ac.cn/en/data/61701a2b-31e5-41bf-b0a3-607c2a9bd3b3/ (accessed on 3 June 2022).
  41. Liu, Z.; Yang, M.; Wan, G.; Wang, X. The Spatial and Temporal Variation of Temperature in the Qinghai-Xizang (Tibetan) Plateau during 1971–2015. Atmosphere 2017, 8, 214. [Google Scholar] [CrossRef] [Green Version]
  42. Wan, G.; Yang, M.; Liu, Z.; Wang, X.; Liang, X. The Precipitation Variations in the Qinghai-Xizang (Tibetan) Plateau during 1961–2015. Atmosphere 2017, 8, 80. [Google Scholar] [CrossRef] [Green Version]
  43. Li, X.; Sun, Y. Accuracy Verification and Error-Component Analysis on Multi-Satellite Precipitation Products in Sichuan-Chongqing Region. Yangtze River 2022, 53, 97–103. [Google Scholar]
  44. New, M.; Todd, M.; Hulme, M.; Jones, P. Precipitation Measurements and Trends in the Twentieth Century. Int. J. Climatol. 2001, 21, 1889–1922. [Google Scholar] [CrossRef]
  45. Xie, P.; Arkin, P.A. Global Precipitaion: A 17-Year Monthly Analysis Based on Gauge Observations, Satellite Estimates, and Numerical Model Outputs. Bull. Am. Meteorol. Soc. 1997, 78, 2539–2558. [Google Scholar] [CrossRef]
  46. Hamal, K.; Sharma, S.; Khadka, N.; Baniya, B.; Ali, M.; Shrestha, M.S.; Xu, T.; Shrestha, D.; Dawadi, B. Evaluation of MERRA-2 Precipitation Products Using Gauge Observation in Nepal. Hydrology 2020, 7, 70. [Google Scholar] [CrossRef]
  47. Li, Z.; Yang, D.; Hong, Y. Multi-scale evaluation of high-resolution multi-sensor blended global precipitation products over the Yangtze River. J. Hydrol. 2013, 500, 157–169. [Google Scholar] [CrossRef]
  48. Hu, Z.; Ni, Y.; Shao, H.; Yin, G.; Yan, Y.; Jia, C. Applicability Study of CFSR, ERA-Interim and MERRA Precipitation Estimates in Central Asia. Arid Land Geogr. 2013, 36, 700–708. [Google Scholar]
  49. Wang, G.; Zhang, X.; Zhang, S. Performance of Three Reanalysis Precipitation Datasets over the Qinling-Daba Mountains, Eastern Fringe of Tibetan Plateau, China. Adv. Meteorol. 2019, 2019, 7698171. [Google Scholar] [CrossRef] [Green Version]
  50. Kumar, B.; Patra, K.C.; Lakshmi, V. Daily rainfall statistics of TRMM and CMORPH: A case for trans-boundary Gandak River basin. J. Earth Syst. Sci. 2016, 125, 919–934. [Google Scholar] [CrossRef] [Green Version]
  51. Li, Z. Multi-Source Precipitation Observations and Fusion for Hydrological Applications in the Yangtze River Basin. Ph.D. Thesis, Tsinghua University, Beijing, China, 2015. [Google Scholar]
  52. Kirstetter, P.E.; Hong, Y.; Gourley, J.J.; Chen, S.; Flamig, Z.; Zhang, J.; Schwaller, M.; Petersen, W.; Amitai, E. Toward a Framework for Systematic Error Modeling of Spaceborne Precipitation Radar with NOAA/NSSL Ground Radar–Based National Mosaic QPE. J. Hydrometeorol. 2012, 13, 1285–1300. [Google Scholar] [CrossRef]
  53. Chen, S.; Hong, Y.; Cao, Q.; Gourley, J.J.; Kirstetter, P.E.; Yong, B.; Tian, Y.; Zhang, Z.; Shen, Y.; Hu, J.; et al. Similarity and Difference of the Two Successive V6 and V7 TRMM Multisatellite Precipitation Analysis Performance over China. J. Geophys. Res. Atmos. 2013, 118, 13060–13074. [Google Scholar] [CrossRef]
Figure 1. Location of the Tibetan Plateau and spatial distribution of rain gauges.
Water 14 02169 g001
Figure 2. (a) Annual and (b) monthly precipitation time series of three remote sensing precipitation products and gauge data during the study period on the Tibetan Plateau.
Water 14 02169 g002
Figure 3. Schematic diagram of bilinear interpolation.
Water 14 02169 g003
Figure 4. Flowchart of evaluation of remote sensing precipitation products.
Water 14 02169 g004
Figure 5. The scattered distribution between the three remote sensing precipitation products and gauge data at the (ac) annual and (df) monthly scales during the study period. The red line and the blue dashed line represent the linear fitted line and the 1:1 line, respectively. If the p-value is less than 0.01, the linear correlation between the precipitation products and gauge measurement data is well fitted and passes the 99% confidence level test.
Water 14 02169 g005
Figure 6. Correlation coefficient differences in each month among three remote sensing precipitation products.
Water 14 02169 g006
Figure 7. Taylor plots between three remote sensing precipitation products and ground station data at the (a) annual and (b) monthly scales and (c) the bar plot of relative deviation.
Water 14 02169 g007
Figure 8. Box plots of each detection capability index for three remote sensing precipitation products. The points outside the box boundary indicate outliers.
Water 14 02169 g008
Figure 9. Probability distribution function by (a) occurrence and probability distribution function by (b) volume for three remote sensing precipitation products and ground stations.
Water 14 02169 g009
Figure 10. The scattered distribution diagrams of annual maximum daily precipitation between (a) TRMM, (b) GPM, (c) CMORPH and gauge. The red line and the blue dashed line represent the linear fitted line and the 1:1 line, respectively.
Water 14 02169 g010
Figure 11. Spatial distribution of (ac) CC, (df) BIAS and (gi) RMSE for the three remote sensing precipitation products and the percentage of evaluation points in different intervals. I, II, III and IV indicate the different intervals of the indexes (see Table 2), and the marked numbers represent the average values of the evaluation indexes.
Water 14 02169 g011
Figure 12. Spatial distribution of capturing-capability indexes from the three remote sensing precipitation products and the percentage of evaluation points in different intervals. I, II, III and IV indicate the different intervals of the indexes (see Table 2), and the marked numbers represent the average values of the evaluation indexes.
Water 14 02169 g012
Table 1. Evaluation indexes for remote sensing precipitation products.
Evaluation IndexEquationNumber
Correlation coefficient (CC) CC = i = 1 n ( P s i P s i ¯ ) ( P o i P o i ¯ ) i = 1 n ( P s i P s i ¯ ) 2 i = 1 n ( P o i P o i ¯ ) 2 (1)
Relative bias (BIAS) BIAS = i = 1 n ( P s i P o i ) i = 1 n P o i (2)
Root-mean-square error (RMSE) RMSE = 1 n i = 1 n ( P s i P o i ) 2 (3)
Standard deviation (SD) SD = i = 1 n ( P i P i ¯ ) n (4)
Probability of detection (POD) PODrain = a a + c (5)
PODnorain = d b + d (6)
False alarm ratio (FAR) FARrain = b a + b (7)
FARnorain = c c + d (8)
Probability of false detection (POFD) POFD = b b + d (9)
Missing alarm ratio (MAR) MAR = c a + c (10)
Heidke skill score (HSS) HSS = 2 ( a d b c ) ( a + b ) ( b + d ) + ( a + c ) ( c + d ) (11)
Probability distribution function by occurrence (PDFc) n p j = 1 k n p (12)
Probability distribution function by volume (PDFv) v p j = 1 k v p (13)
Table 2. The indicted range for each evaluation index interval.
IndexDivision of Index Intervals
IIIIIIIV
CC<0.150.15~0.300.30~0.45>0.45
BIAS<00~1.51.5~3>3
RMSE<2.52.5~55~7.5>7.5
PODrain<0.250.25~0.500.50~0.75>0.75
PODnorain<0.70.7~0.80.8~0.9>0.9
FARrain<0.40.4~0.60.6~0.8>0.8
FARnorain<0.10.1~0.20.2~0.3>0.3
POFD<0.10.1~0.20.2~0.3>0.3
MAR<0.250.25~0.500.50~0.75>0.75
HSS<0.080.08~0.160.16~0.24>0.24
Publisher’s Note: MDPI stays neutral with regard to jurisdictional claims in published maps and institutional affiliations.

