
Abundant Precipitation in Qilian Mountains Generated from the Recycled Moisture over the Adjacent Arid Hexi Corridor, Northwest China


Abstract
:1. Introduction
2. Data and Methods
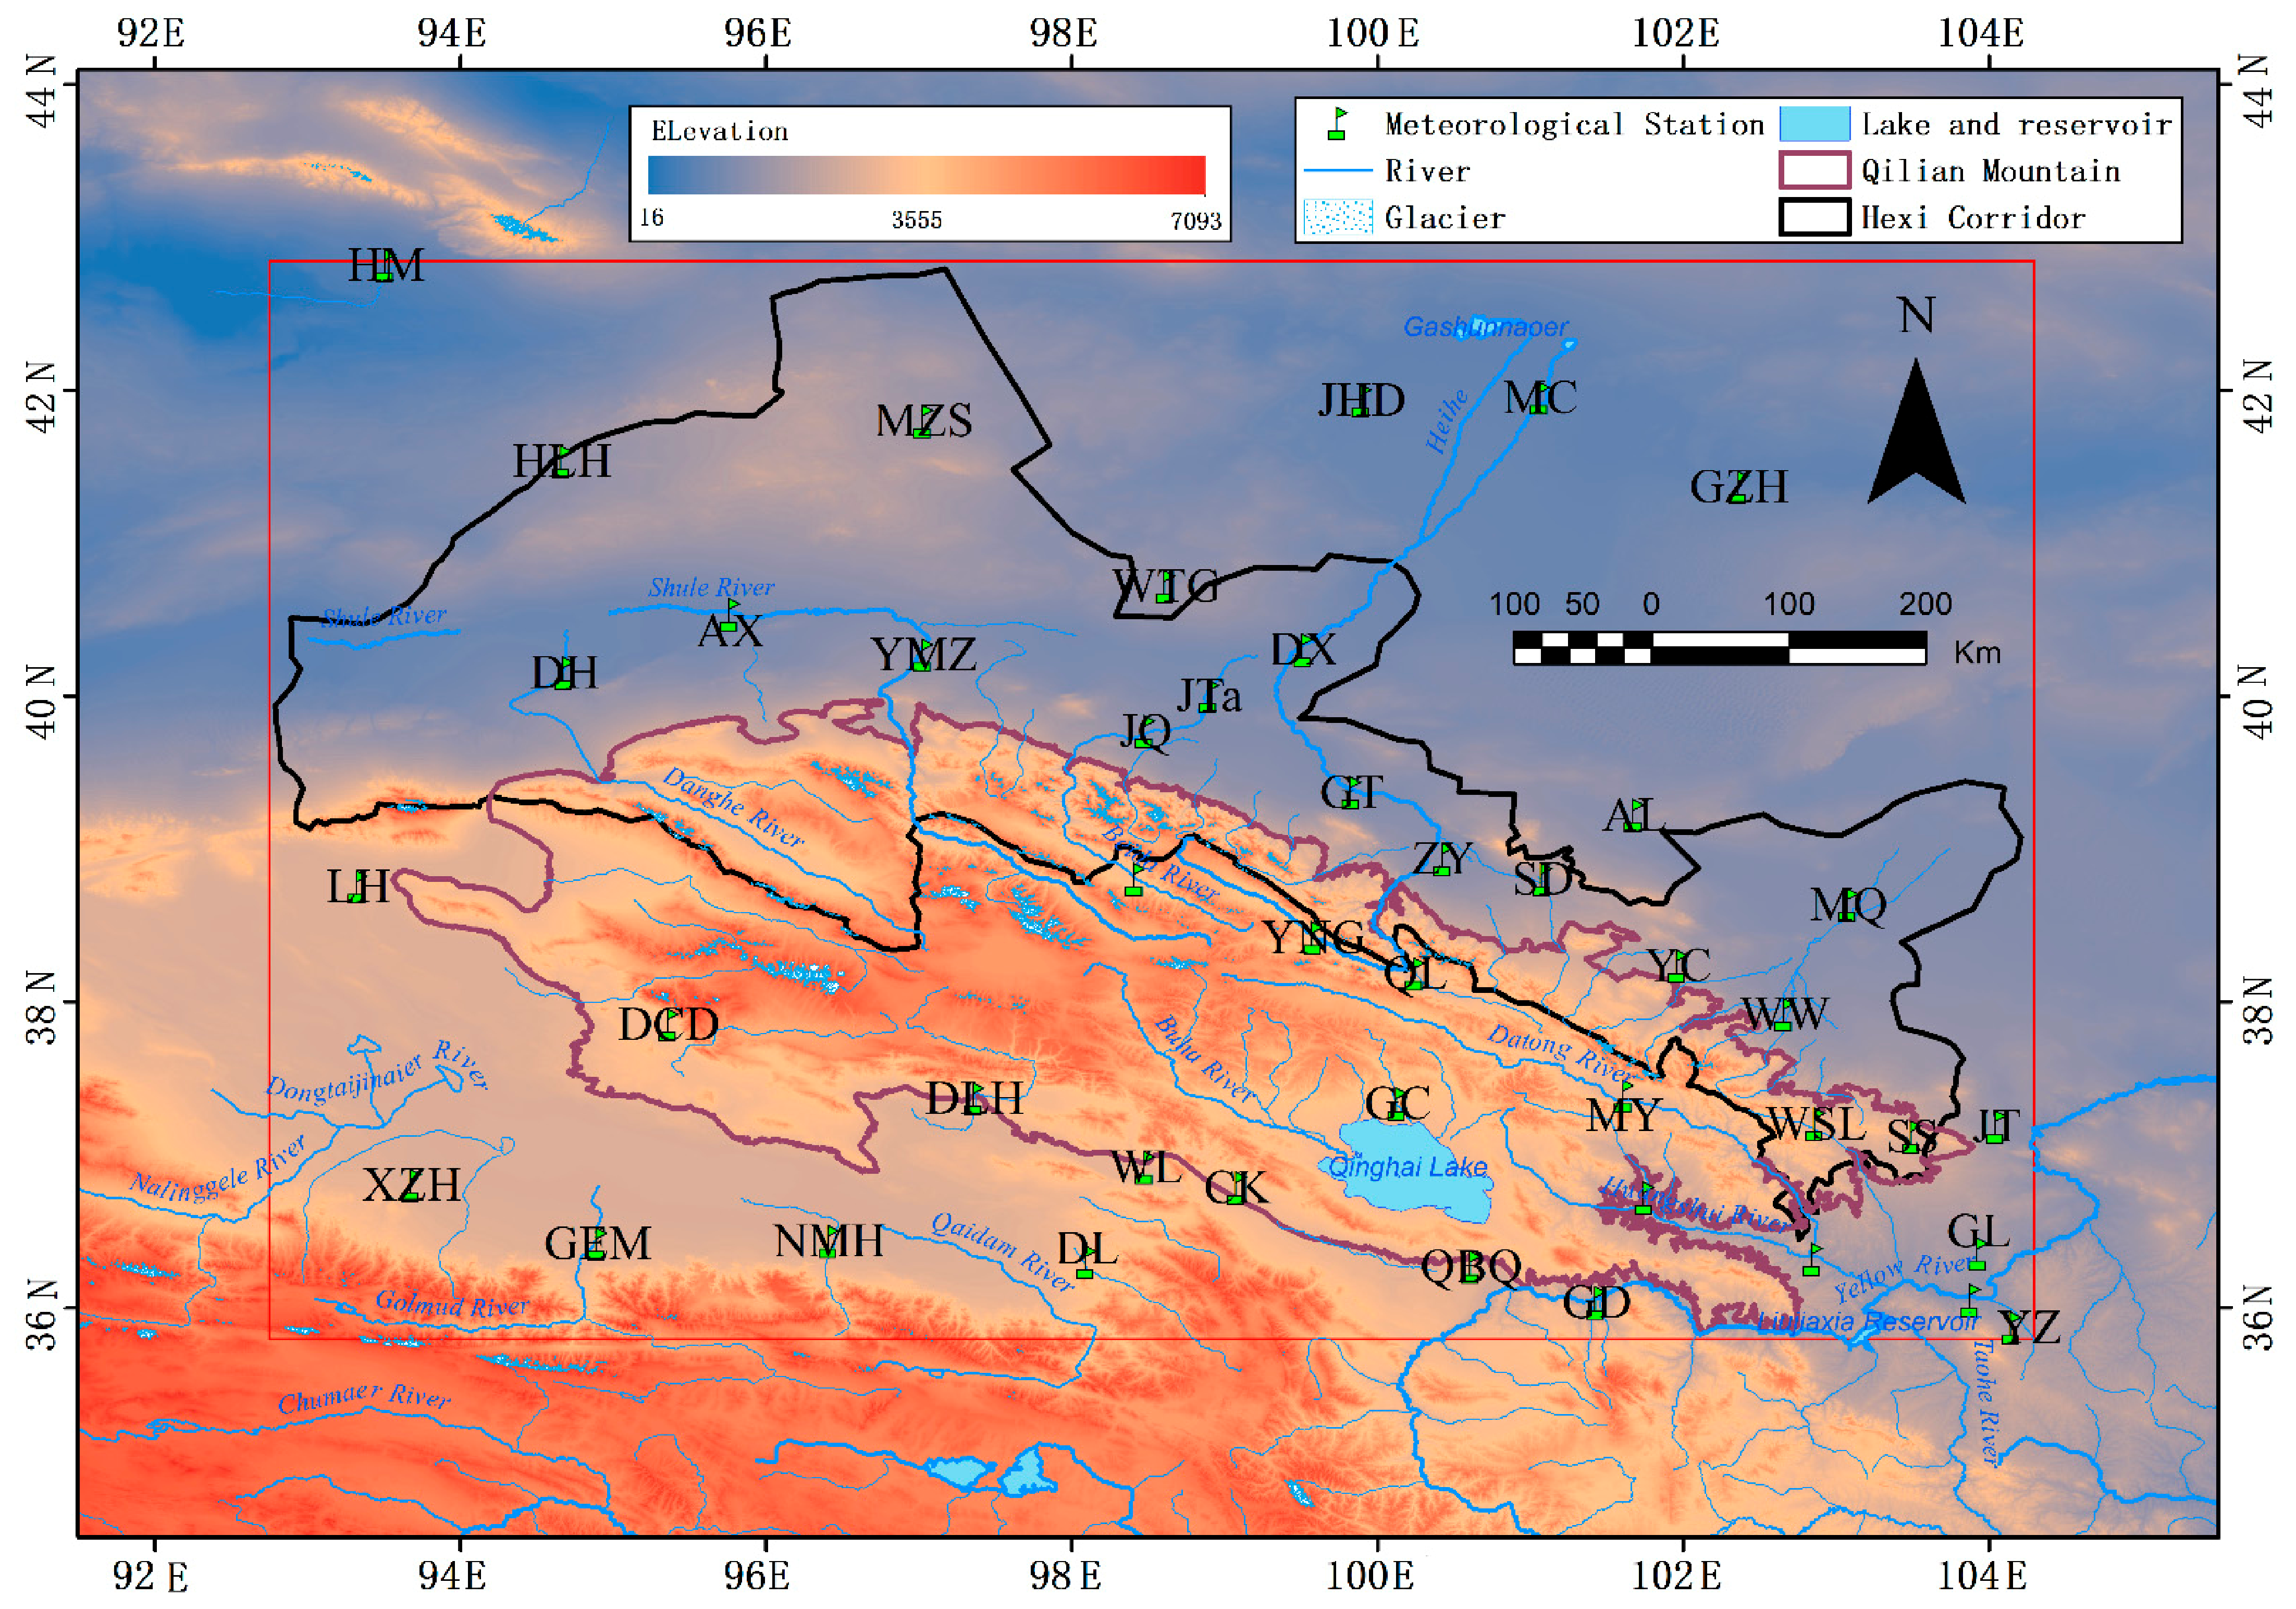
2.1. Study Area
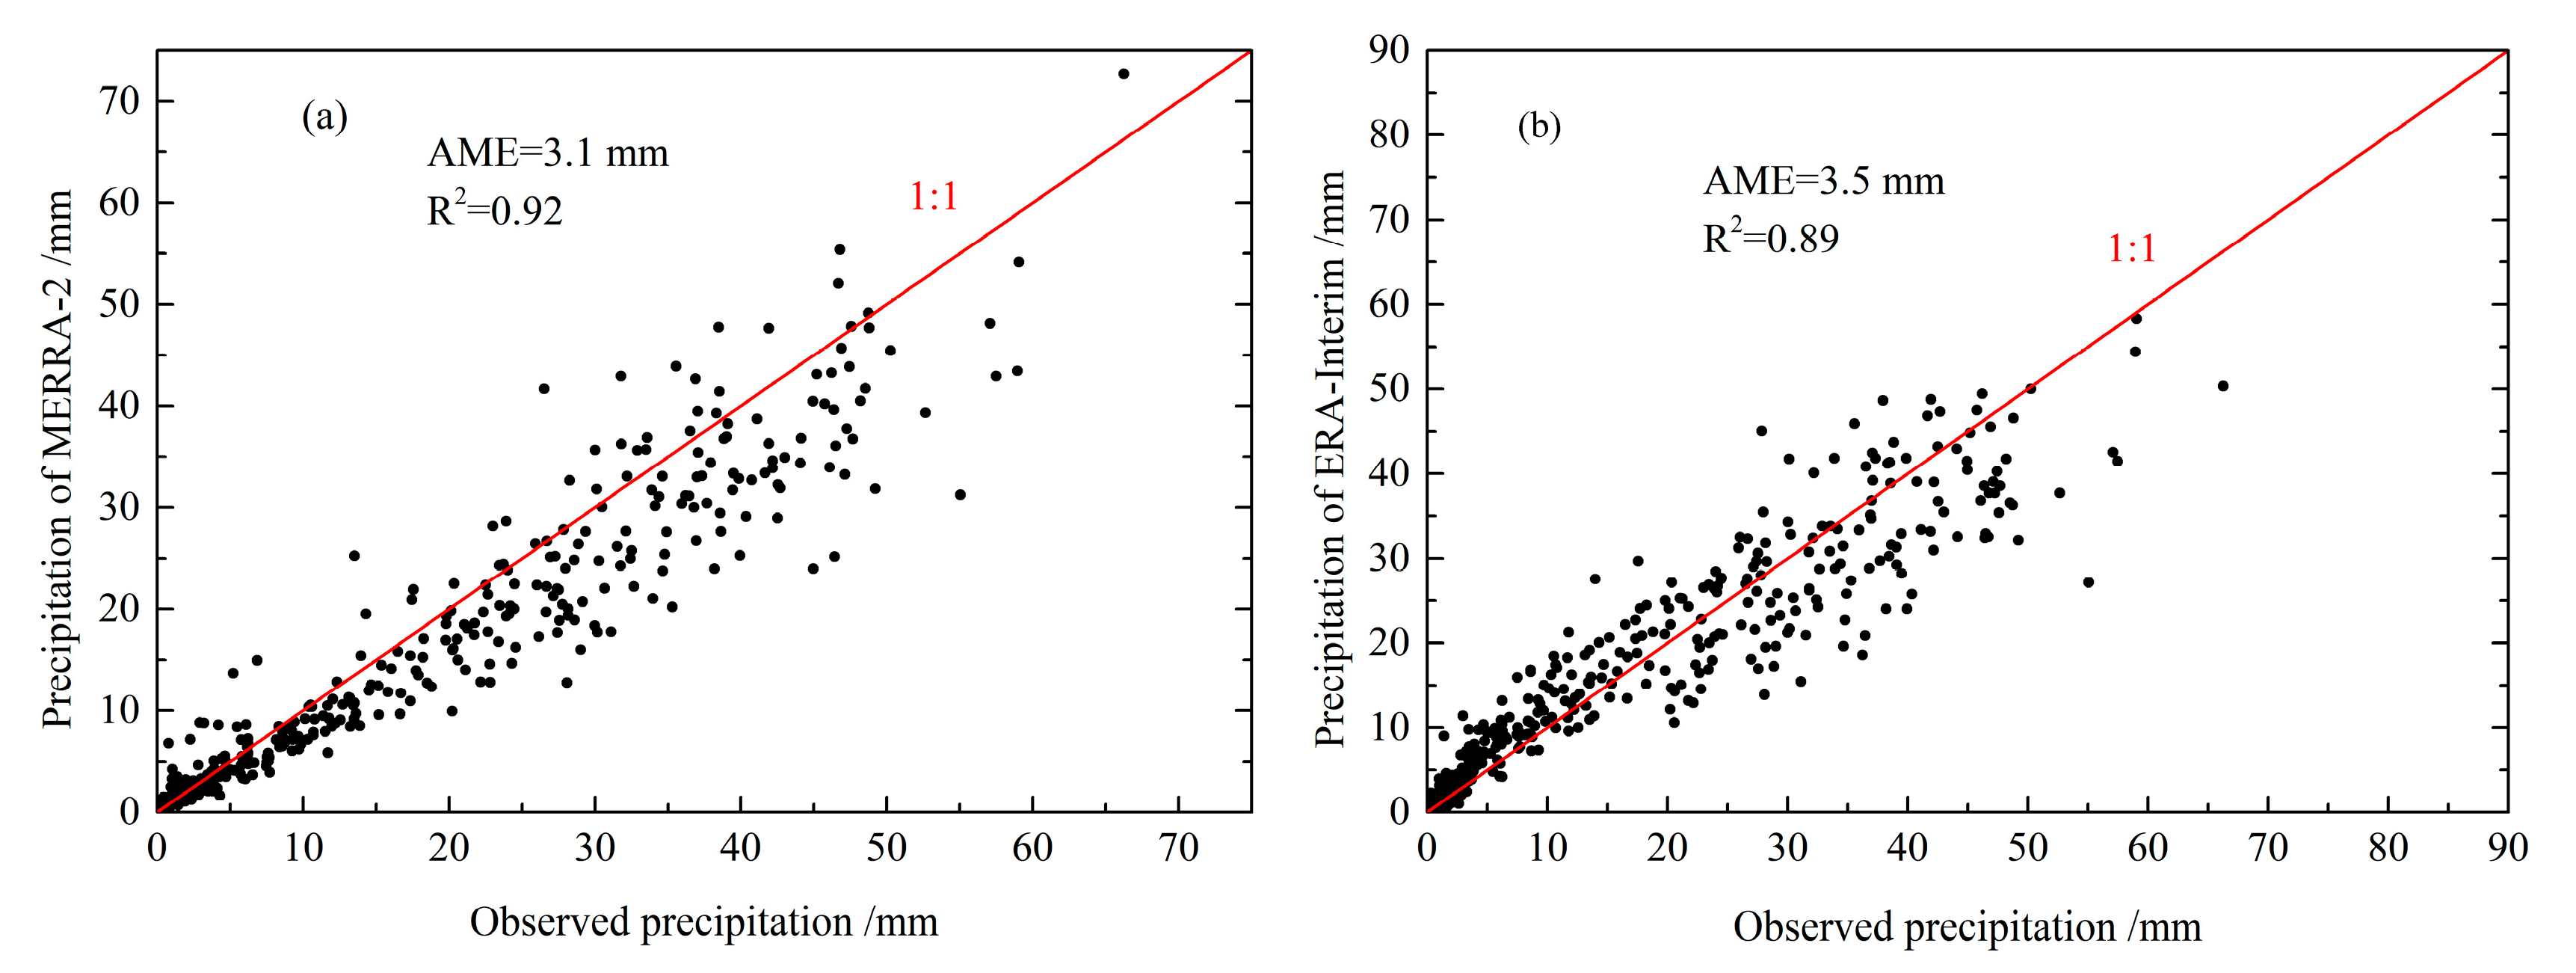
2.2. Data
2.3. Methods
3. Results
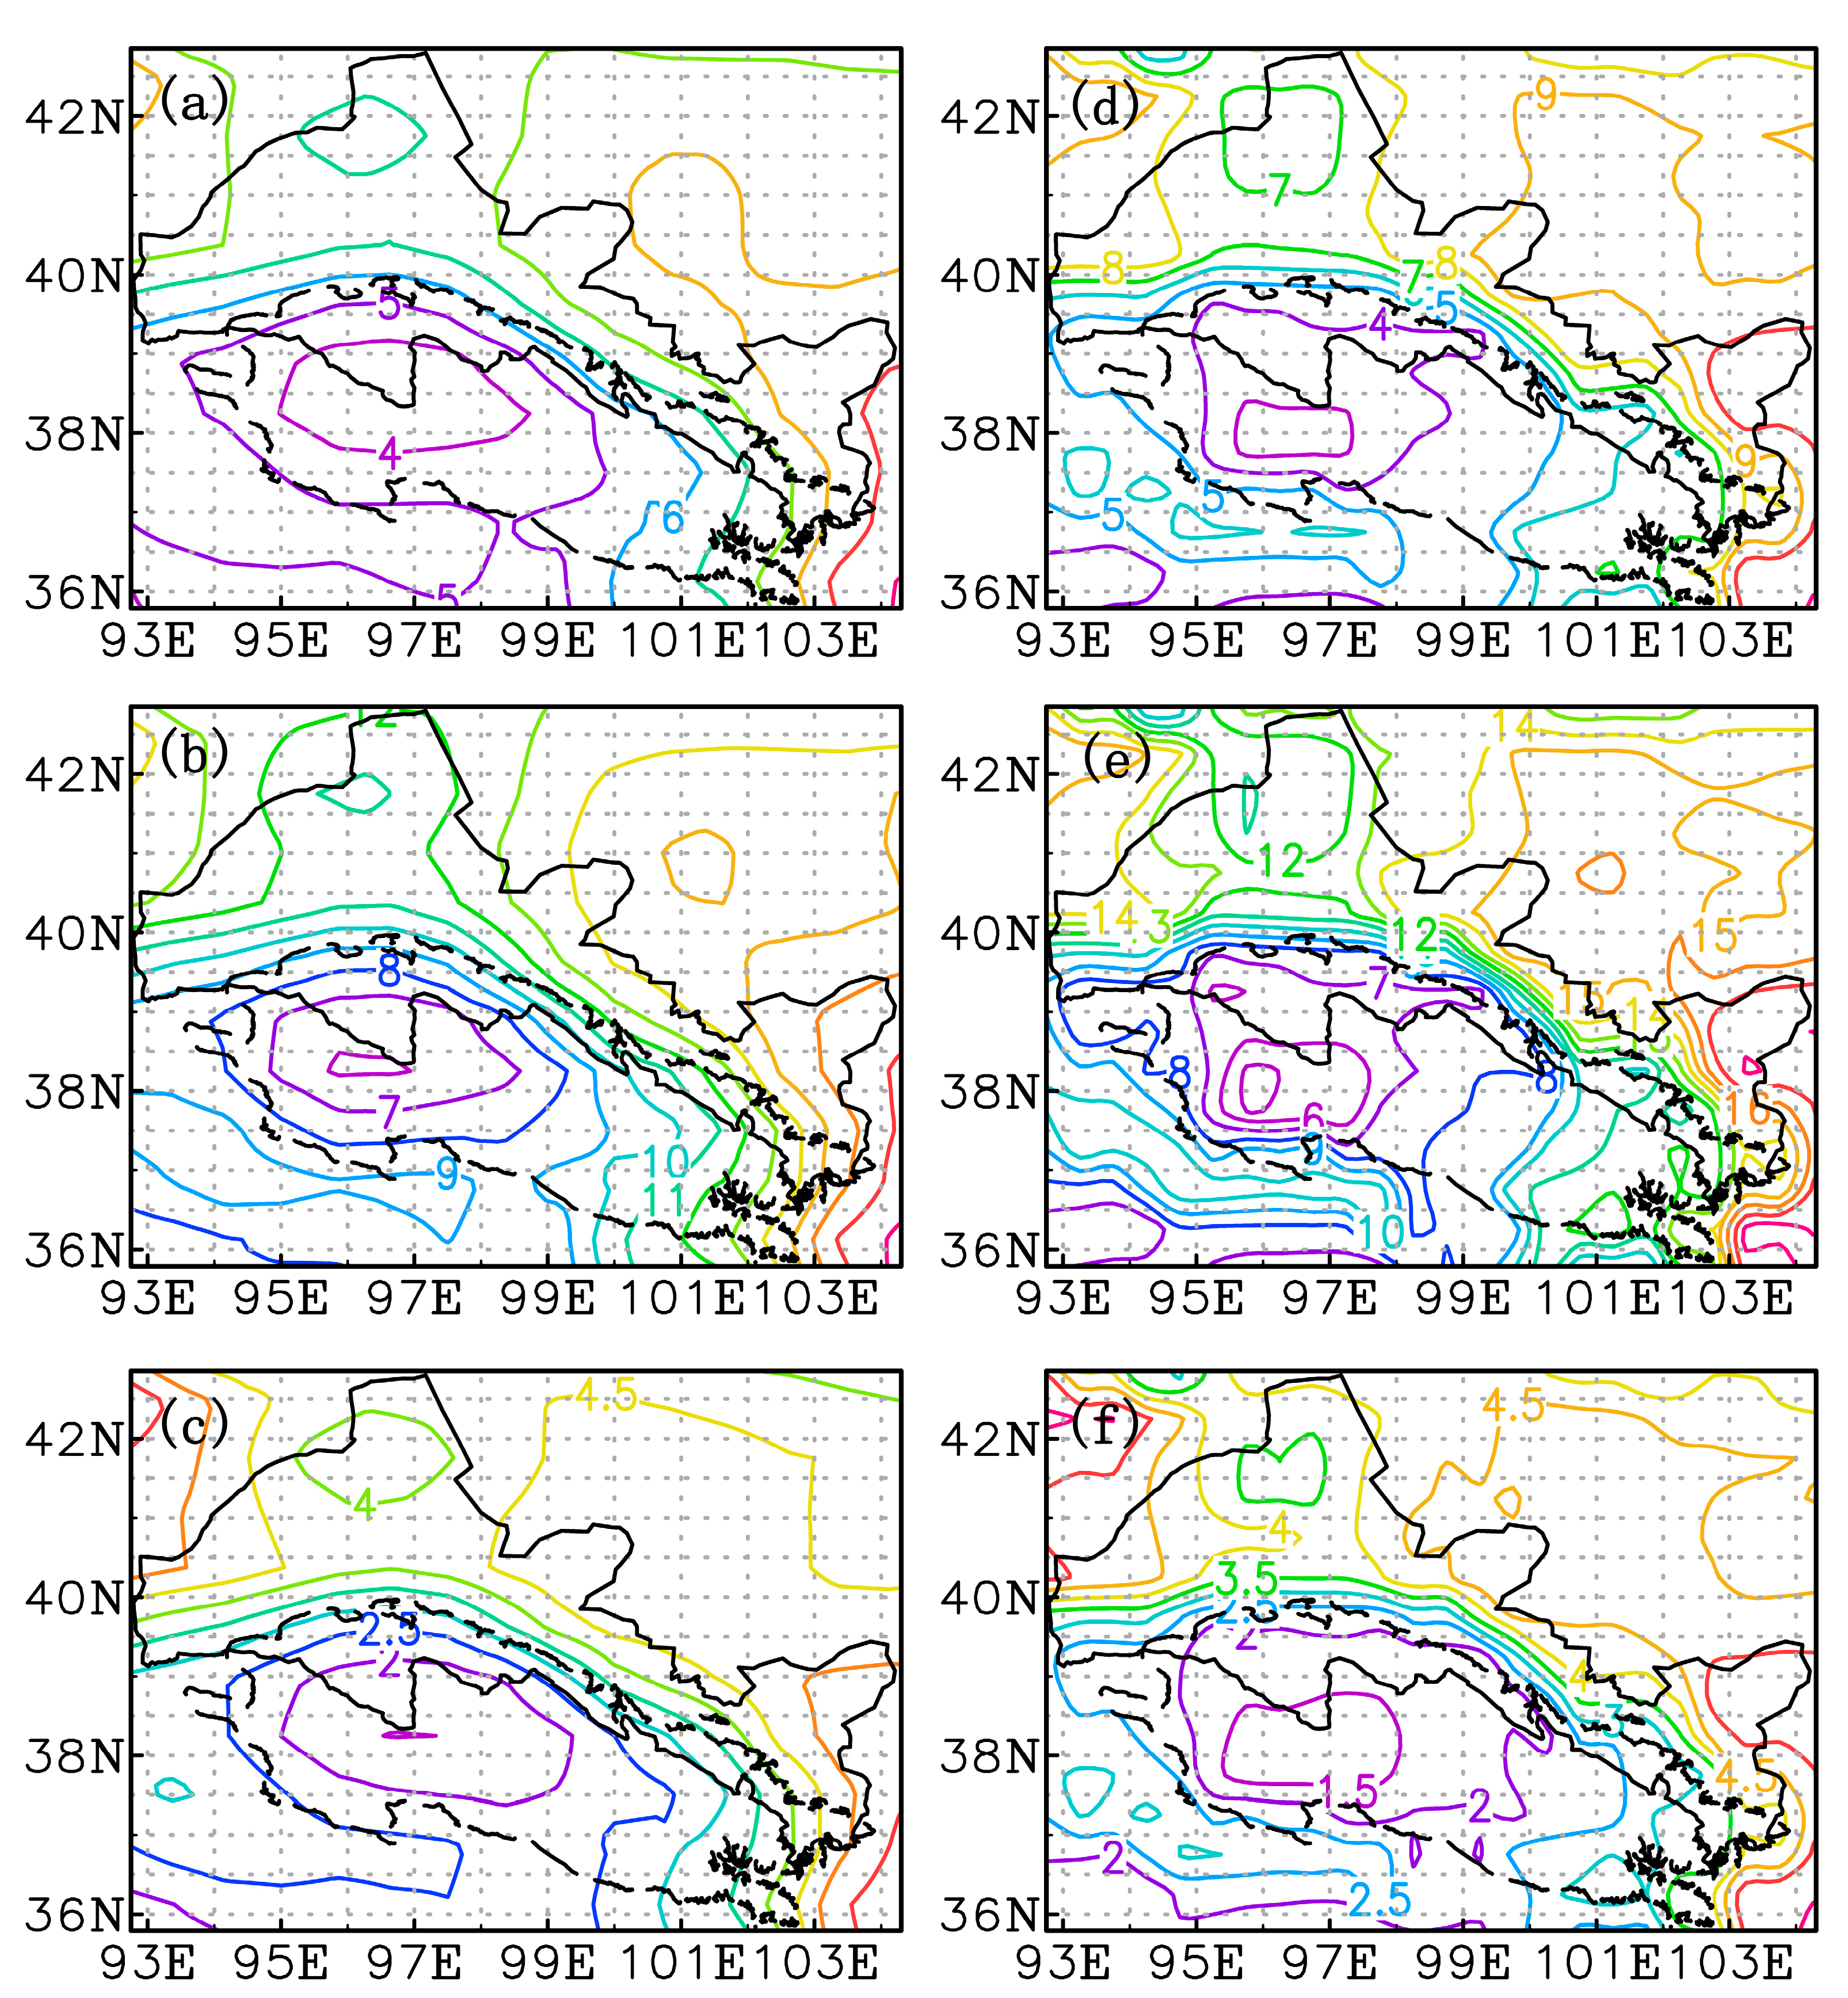
3.1. Atmospheric Precipitable Water Content
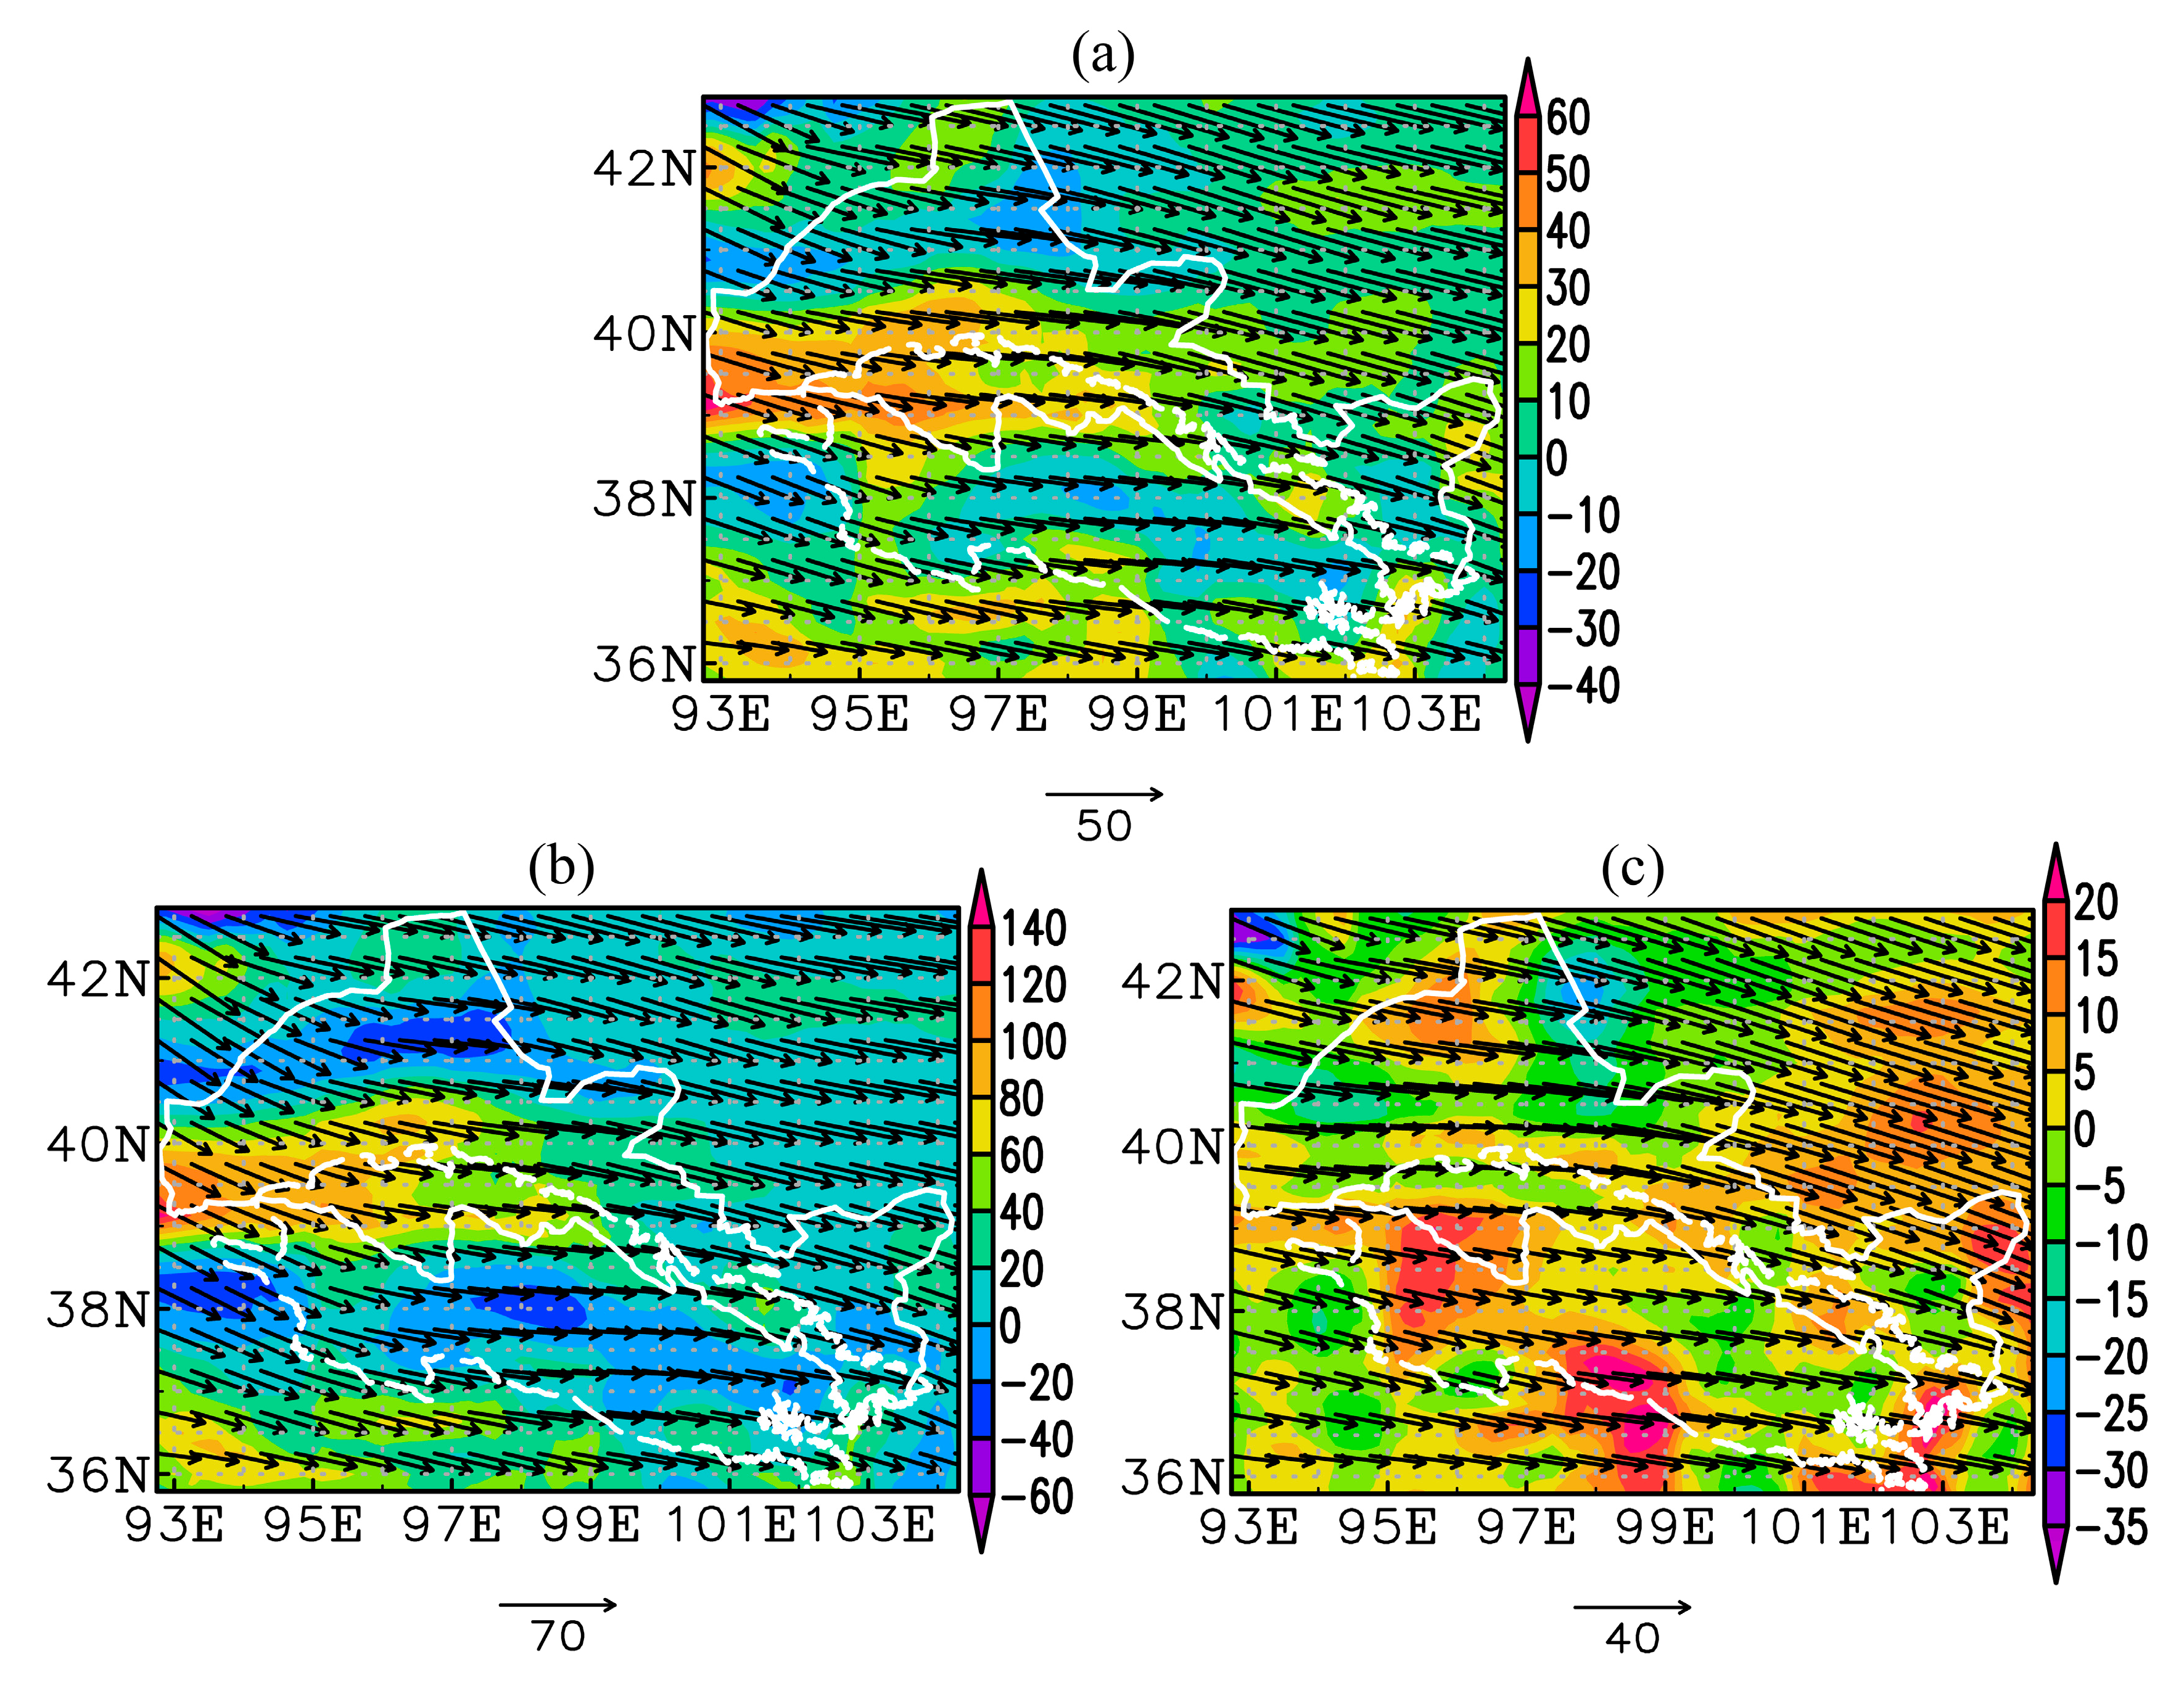
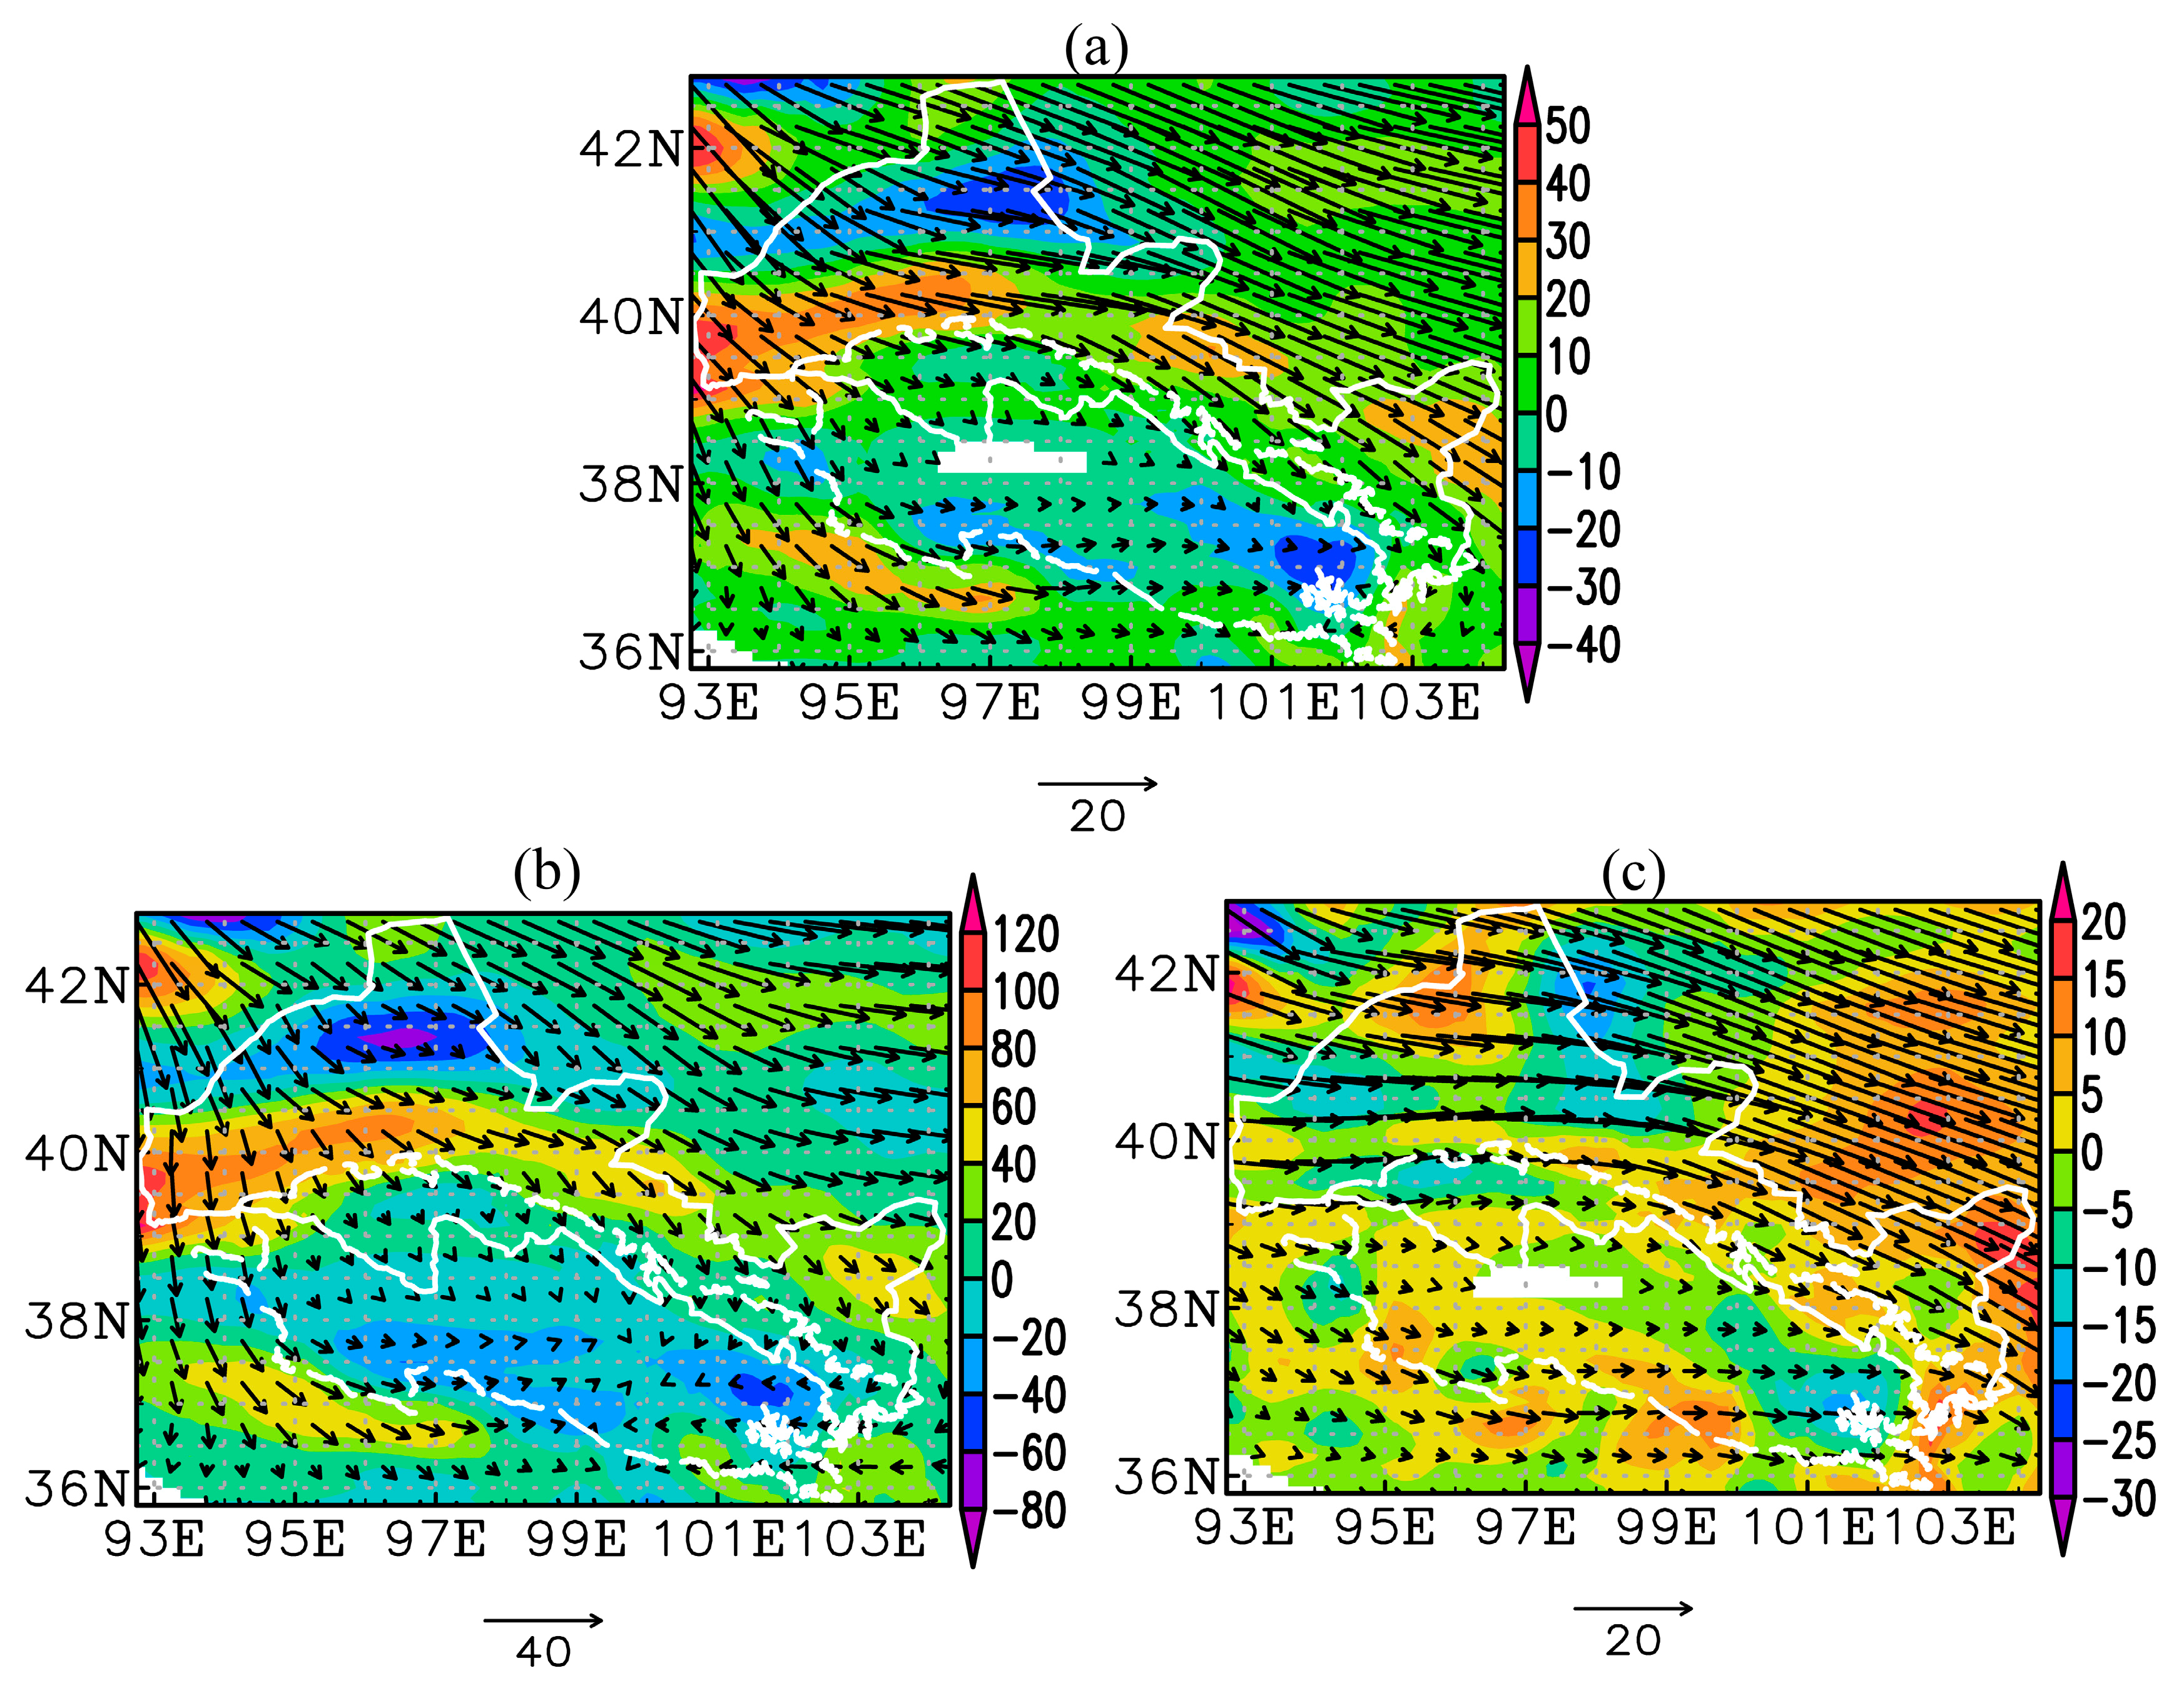
3.2. Water Vapor Flux and Water Vapor Flux Divergence
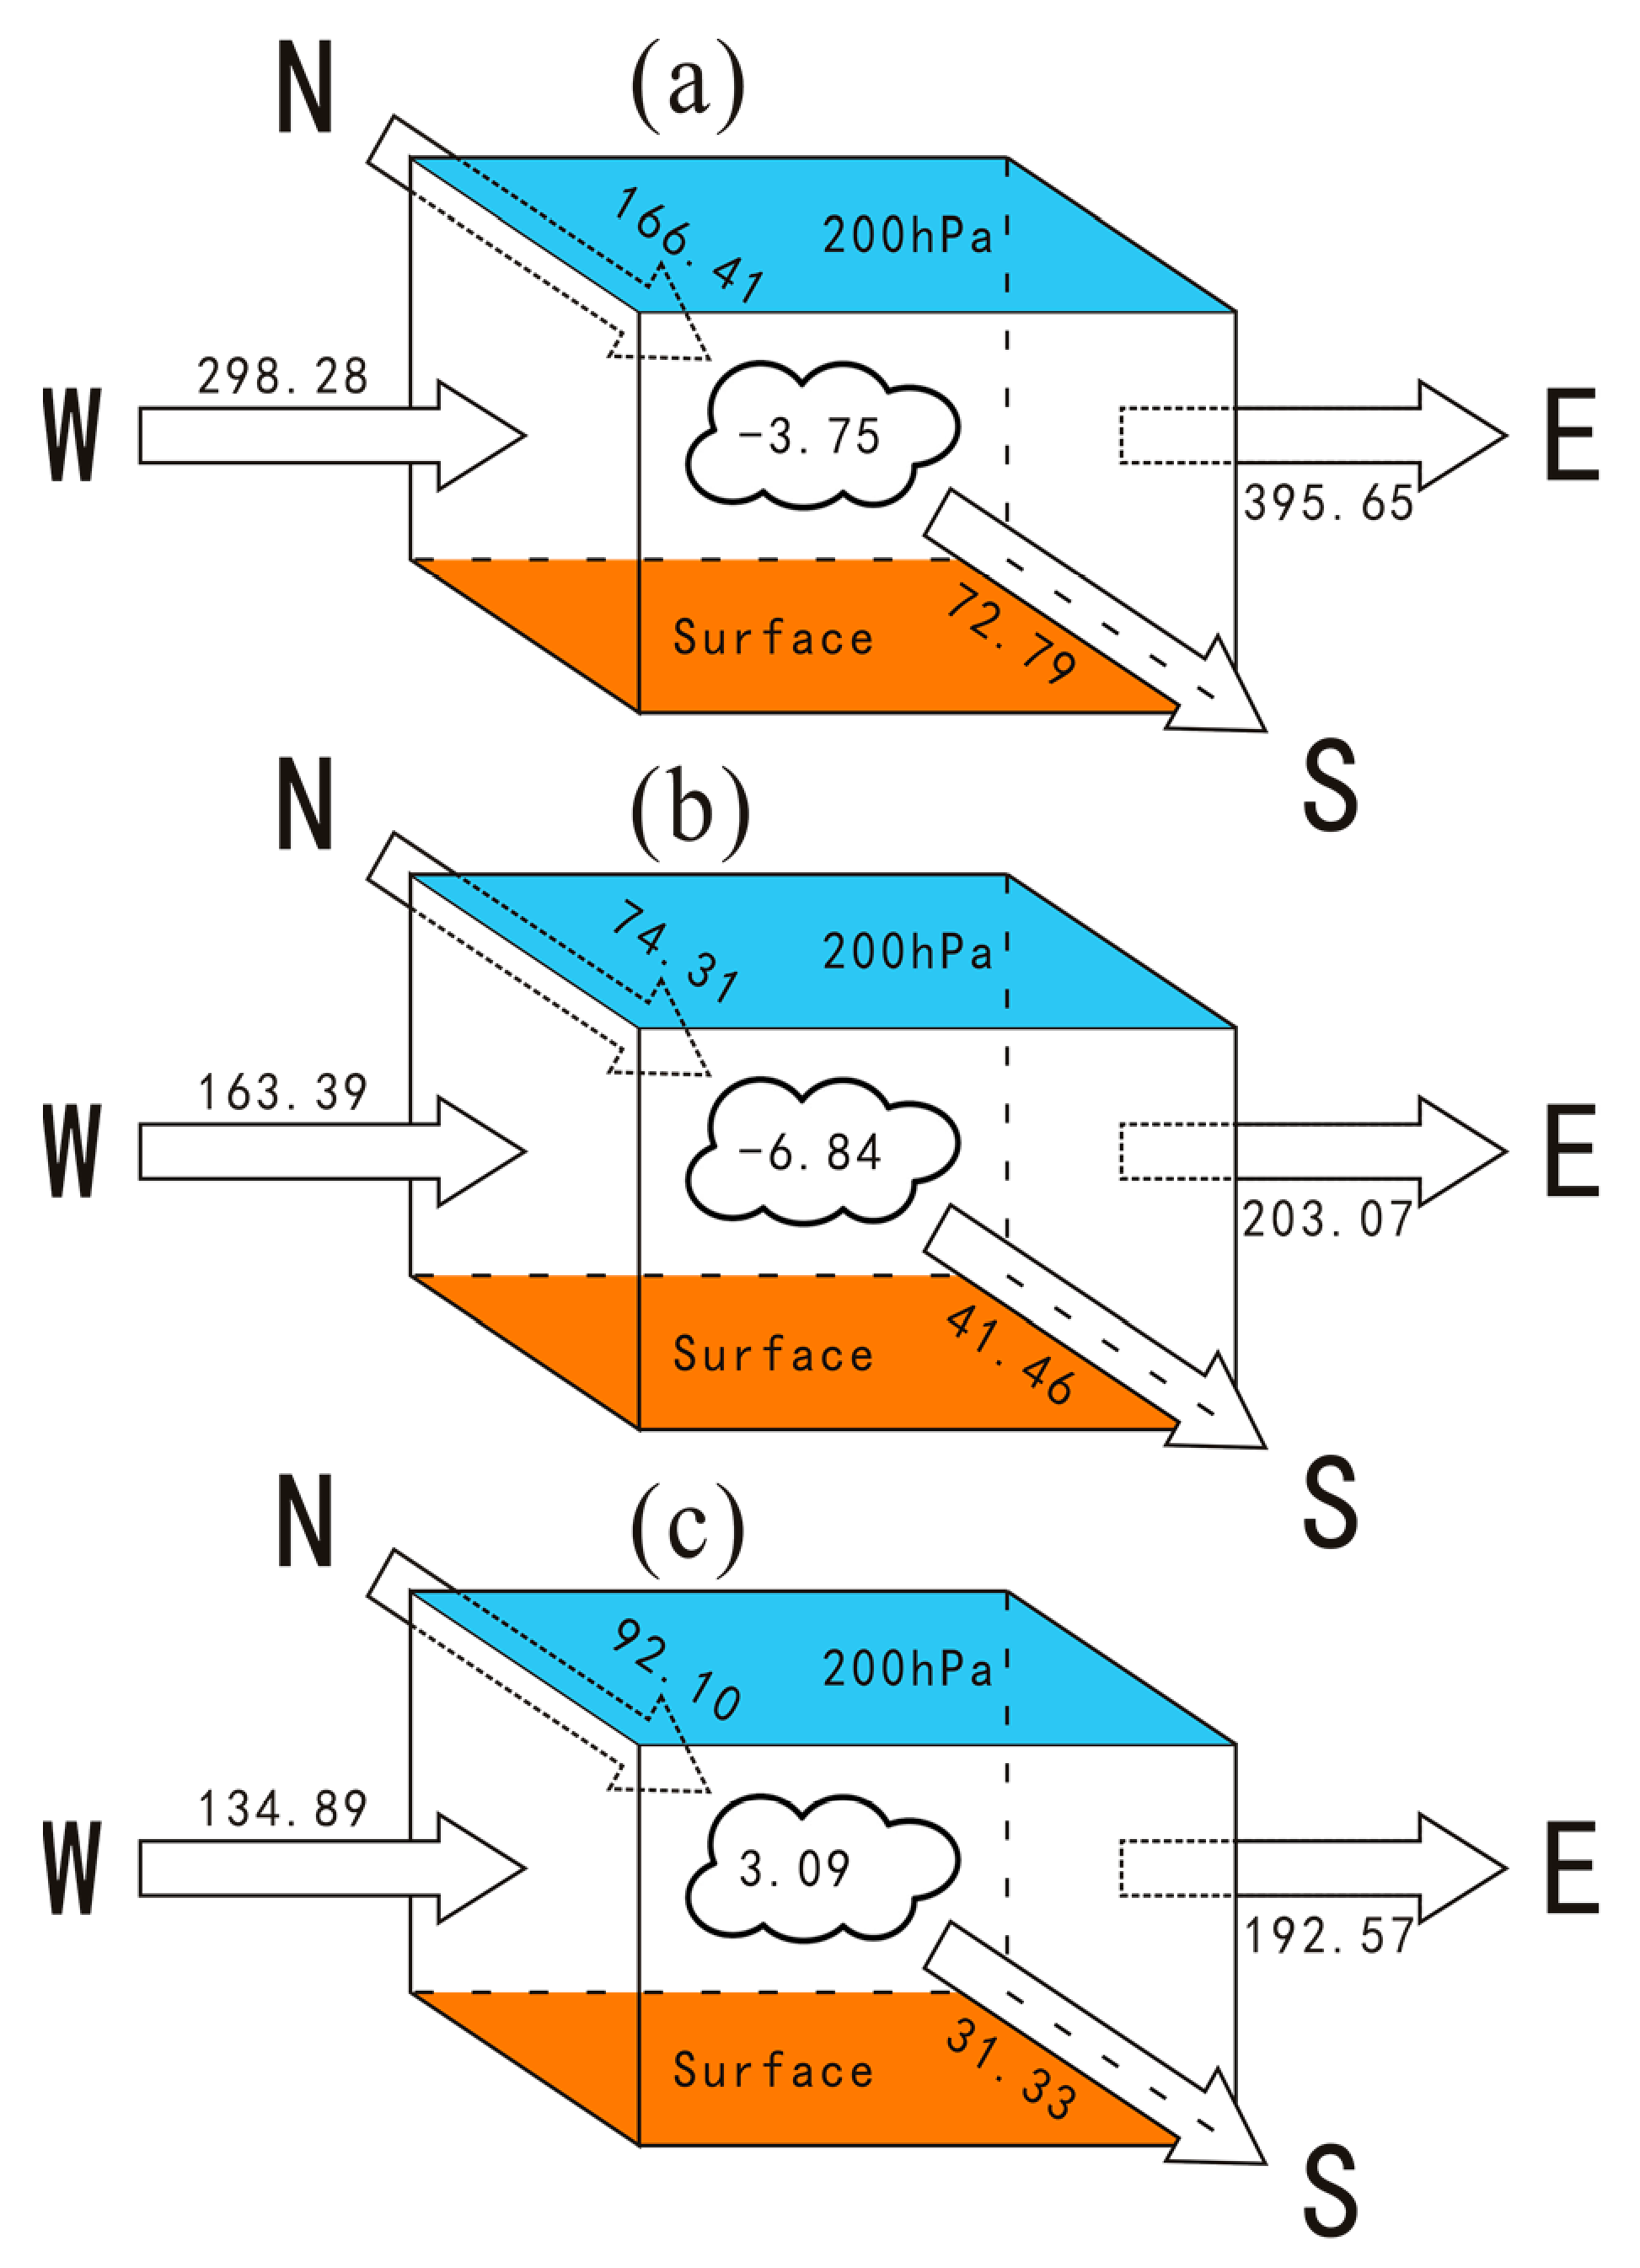
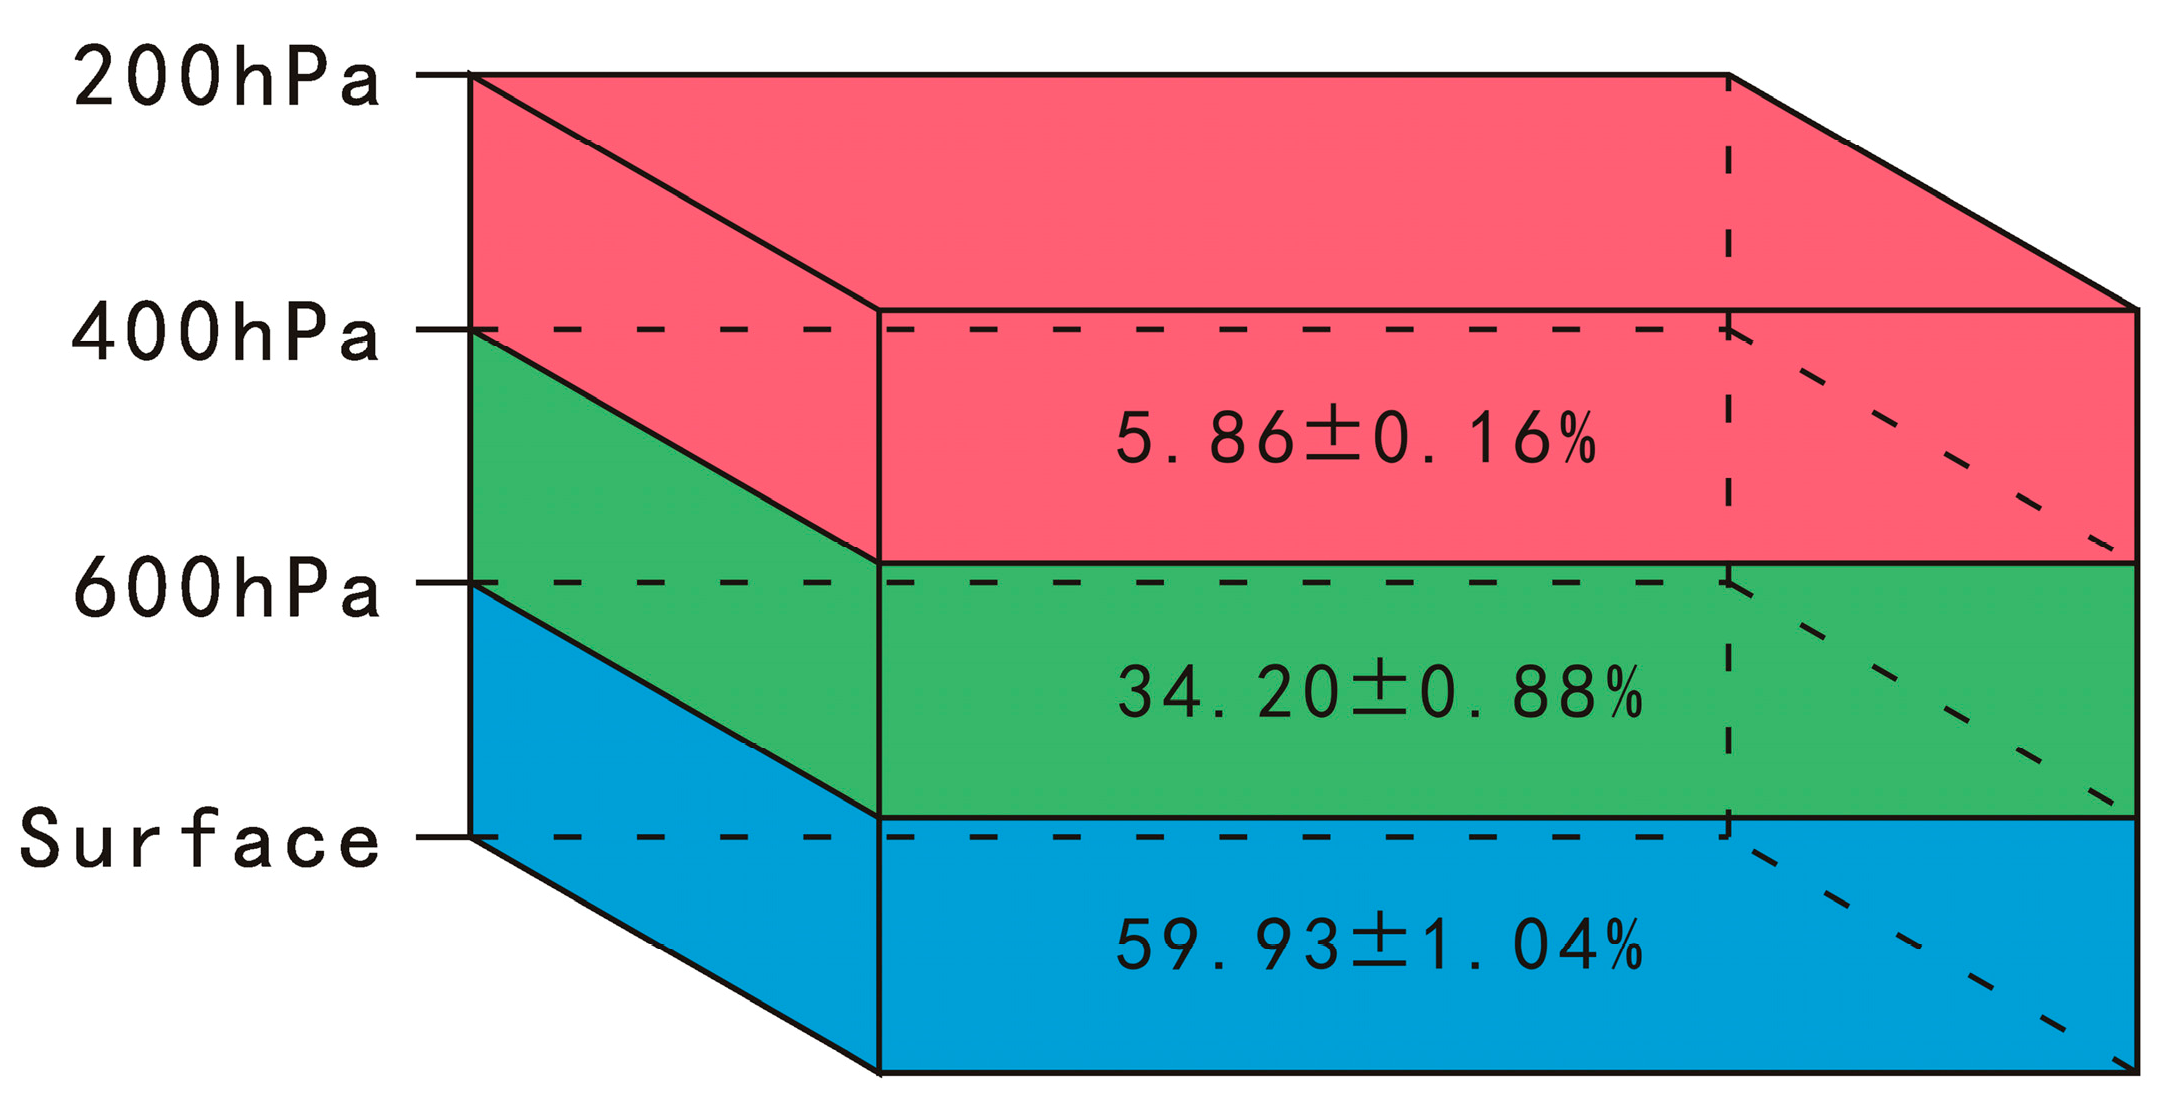
3.3. Boundary and Regional Net Water Vapor Flux
3.4. Water Vapor Transport between the QMR and the HCR
4. Discussion
4.1. Comparing Water Vapor Variables of the QM-HCR with Previous Studies
4.2. Potential Driving Mechanism of Horizontal Transport of Water Vapor
4.3. Long Term Changes in Regional Net Water Vapor Flux
4.4. Uncertainty
5. Conclusions
- (1)
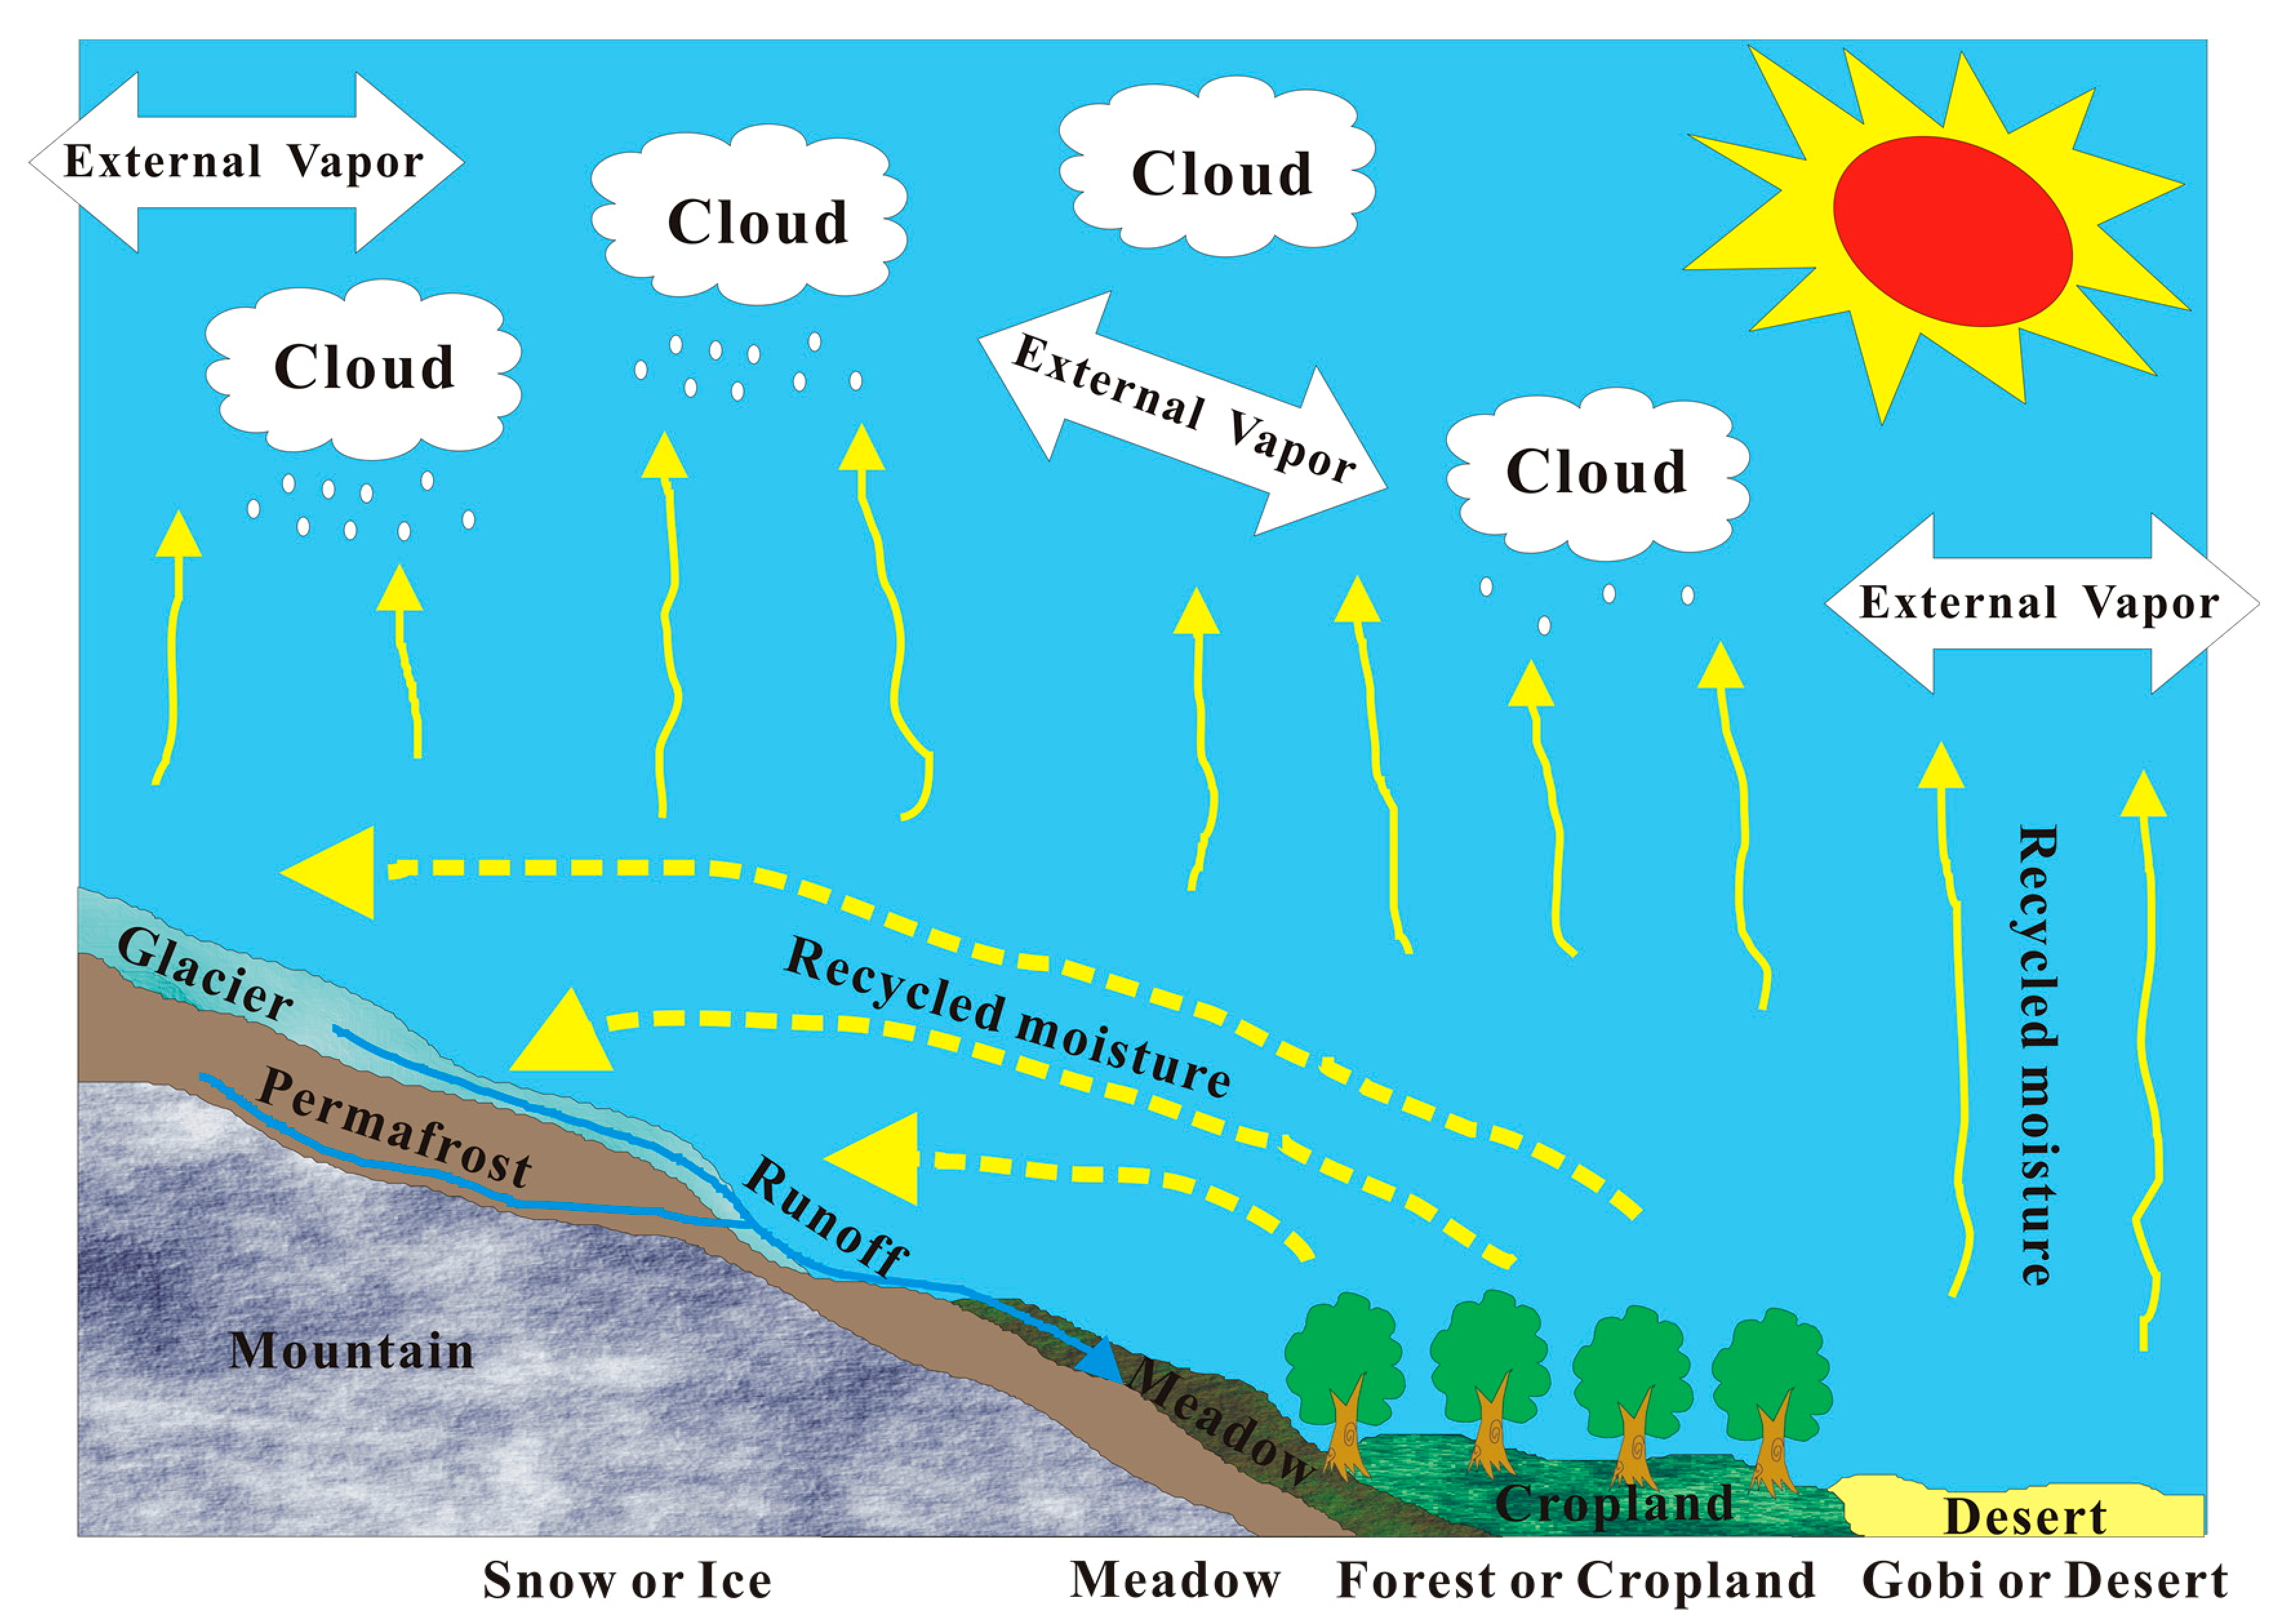
- Two channels identified transport water vapor from the arid HCR to the QMR in the low troposphere (surface–600 hPa), suggesting that parts of recycled moisture generated from evapotranspiration over the oasis and desert of the HCR are transported to the QMR, which contributes to the abundant precipitation in the QMR.
- (2)
- The primary driving mechanism of the horizontal transport of recycled moisture may be led by the significant difference in temperature and humidity between the HCR and the QMR, caused by the “cold and wet island effect” of the cryosphere in QMR, especially during the wet season.
- (3)
- The water vapor transport from HCR to QMR indicates that horizontal moisture recycling is probably an essential mechanism of the water cycle in endorheic river basins, where water resources are mainly generated from mountainous areas.
Author Contributions
Funding
Data Availability Statement
Acknowledgments
Conflicts of Interest
References
- Huang, P.; Yu, H.P.; Guan, X.D.; Wang, G.Y.; Guo, R.X. Accelerated dryland expansion under climate change. Nat. Clim. Chang. 2016, 6, 166–171. [Google Scholar] [CrossRef]
- Xia, J.; Ning, L.; Wang, Q.; Chen, J.X.; Wan, L.; Hong, S. Vulnerability of and risk to water resources in arid and semi-arid regions of West China under a scenario of climate change. Clim. Chang. 2017, 144, 549–563. [Google Scholar] [CrossRef]
- Rotenberg, E.; Yakir, D. Contribution of semi-arid forests to the climate system. Science 2010, 327, 451–454. [Google Scholar] [CrossRef] [PubMed]
- Wang, L.; Chen, R.S.; Han, C.T.; Wang, X.Q.; Liu, G.H.; Song, Y.X.; Yang, Y.; Liu, J.F.; Liu, Z.W.; Liu, X.J.; et al. Change characteristics of precipitation and temperature in the Qilian Mountains and Hexi Oasis, Northwestern China. Environ. Earth Sci. 2019, 78, 284. [Google Scholar] [CrossRef]
- Wang, N.L.; Zhang, S.B.; He, J.Q.; Pu, J.C.; Wu, X.B.; Jiang, X. Tracing the major source area of the mountainous runoff generation of the Heihe River in northwest China using stable isotope technique. Chin. Sci. Bull. 2009, 54, 2751–2757, (In Chinese with English abstract). [Google Scholar] [CrossRef] [Green Version]
- Chen, R.S.; Han, C.T. Hydrology, Ecology and Climate Significance and Its Research Progress of the Alpine Cold Desert. Adv. Earth Sci. 2010, 25, 255–263, (In Chinese with English abstract). [Google Scholar] [CrossRef]
- Zhang, Z.H.; Deng, S.F.; Zhao, Q.D.; Zhang, S.Q.; Zhang, X.W. Projected glacier meltwater and river run-off changes in the Upper Reach of the Shule River Basin, north-eastern edge of the Tibetan Plateau. Hydrol. Process. 2019, 33, 1059–1074. [Google Scholar] [CrossRef]
- He, Z.B.; Zhao, W.Z.; Liu, H.; Tang, Z.X. Effect of forest on annual water yield in the mountains of an arid inland river basin: A case study in the Pailugou catchment on northwestern China’s Qilian Mountains. Hydrol. Process. 2012, 26, 613–621. [Google Scholar] [CrossRef]
- Gao, Q.Z.; Du, H.L.; Zu, R.P. The balance between supply and demand of water resources and the water-saving potential for agriculture in the Hexi Corridor. Chin. Geogr. Sci. 2002, 12, 23–29. [Google Scholar] [CrossRef]
- Held, I.M.; Soden, B.J. Water vapor feedback and global warming. Annu. Rev. Energy Environ. 2000, 25, 441–475. [Google Scholar] [CrossRef] [Green Version]
- Hubert, H.S. New definitions for moisture recycling and the relationship with land-use changes in the Sahel. J. Hydrol. 1995, 167, 57–78. [Google Scholar]
- Ma, Y.; Lu, M.; Chen, H.; Pan, M.; Hong, Y. Atmospheric moisture transport versus precipitation across the Tibetan Plateau: A mini-review and current challenges. Atmos. Res. 2018, 209, 50–58. [Google Scholar] [CrossRef]
- Chen, B.; Xu, X.D.; Yang, S.; Zhang, W. On the origin and destination of atmospheric moisture and air mass over the Tibetan Plateau. Theor. Appl. Climatol. 2012, 110, 423–435. [Google Scholar] [CrossRef]
- Zhang, C.; Tang, Q.; Chen, D. Recent changes in the moisture source of precipitation over the Tibetan Plateau. J. Clim. 2017, 30, 1807–1819. [Google Scholar] [CrossRef]
- Ma, Y.; Lu, M.; Bracken, C.; Chen, H. Spatially coherent clusters of summer precipitation extremes in the Tibetan Plateau: Where is the moisture from? Atmos. Res. 2020, 237, 104841. [Google Scholar] [CrossRef]
- Zhao, L.J.; Liu, X.H.; Wang, N.L.; Kong, Y.L.; Song, Y.X.; He, Z.B.; Liu, Q.Y.; Wang, L.X. Contribution of recycled moisture to local precipitation in the inland Heihe River Basin. Agric. For. Meteorol. 2019, 271, 316–335. [Google Scholar] [CrossRef]
- Ding, Y.J.; Zhang, S.Q. Study on Water Internal Recycle Process and Mechanism in Typical Mountain Areas of Inland Basins, Northwest China: Progress and Challenge. Adv. Earth Sci. 2018, 33, 719–727, (In Chinese with English abstract). [Google Scholar] [CrossRef]
- Liu, G.W. Atmospheric Processes of Hydrological Cycle; Science Press: Beijing, China, 1997. (In Chinese) [Google Scholar]
- Saha, S.; Moorthi, S.; Pan, H.L.; Wu, X.R.; Wang, J.D.; Nadiga, S.; Tripp, P.; Kistler, R.; Woollen, J.; Behringer, D.; et al. The NCEP Climate Forecast System Reanalysis. Bull. Am. Meteorol. Soc. 2010, 91, 1015–1058. [Google Scholar] [CrossRef]
- Wang, X.J.; Pang, G.J.; Yang, M.X.; Wan, G.N.; Liu, Z.C. Precipitation changes in the Qilian Mountains associated with the shifts of regional atmospheric water vapor during 1960–2014. Int. J. Climatol. 2018, 38, 4355–4368. [Google Scholar] [CrossRef]
- Simmons, A.J.; Willett, K.M.; Jones, P.D.; Thorne, P.W.; Dee, D.P. Low-frequency variations in surface atmospheric humidity, temperature and precipitation: Inferences from reanalyses and monthly gridded observational datasets. J. Geophys. Res. 2010, 115, 1–21. [Google Scholar] [CrossRef]
- Decker, M.; Brunke, M.A.; Wang, Z.; Sakaguchi, K.; Zeng, X.; Bosilovich, M.G. Evaluation of the reanalysis products from GSFC, NCEP, and ECMWF Using Flux Tower Observations. J. Clim. 2012, 25, 1916–1944. [Google Scholar] [CrossRef]
- Xie, X.R.; You, Q.L.; Bao, Y.T.; Meng, X.H. The Connection Between the Precipitation and Water Vapor Transport over Qinghai-Tibetan Plateau in Summer Based on the Multiple Datasets. Plateau Meteorol. 2018, 37, 78–92, (In Chinese with English abstract). [Google Scholar] [CrossRef]
- Jiang, J.; Zhou, T.J.; Zhang, W.X. Evaluation of Satellite and Reanalysis Precipitable Water Vapor Data Sets Against Radiosonde Observations in Central Asia. Earth Space Sci. 2019, 6, 1129–1148. [Google Scholar] [CrossRef] [Green Version]
- Gelaro, R.; Mccarty, W.; Suárez, M.J.; Todling, R.; Molod, A.; Takacs, L.; Radles, C.A.; Darmenov, A.; Bosilovich, M.G.; Reichle, R. The Modern-Era Retrospective Analysis for Research and Applications, Version 2 (MERRA-2). J. Clim. 2017, 30, 5419–5454. [Google Scholar] [CrossRef] [PubMed]
- Li, S.; Xie, G.H.; He, Q.; Li, X.Y. Research on Precipitation, Precipitable Water and the Precipitation Conversion Efficiency of Altay Prefecture. J. Glaciol. Geocryol. 2008, 30, 675–680, (In Chinese with English abstract). [Google Scholar]
- Yao, J.Q.; Chen, Y.N.; Yang, Q. Spatial and temporal variability of water vapor pressure in the arid region of northwest China, during 1961–2011. Theor. Appl. Climatol. 2016, 123, 683–691. [Google Scholar] [CrossRef]
- Chow, K.C.; Tong, H.W.; Chan, J.C.L. Water vapor sources associated with the early summer precipitation over China. Clim. Dyn. 2008, 30, 497–517. [Google Scholar] [CrossRef]
- Meng, X.J.; Zhang, S.F.; Zhang, Y.Y.; Wang, C.C. Temporal and spatial changes of temperature and precipitation in Hexi Corridor during 1955–2011. J. Geogr. Sci. 2013, 23, 653–667. [Google Scholar] [CrossRef]
- Oliver, M.A.; Webster, R. Kriging: A method of interpolation for geographical information systems. Int. J. Geogr. Inf. Syst. 1990, 4, 313–332. [Google Scholar] [CrossRef]
- Miao, Q.J.; Xu, X.D.; Zhang, S.Y. Whole layer water vapor budget of Yangtze River valley and moisture flux components transform in the key areas of the plateau. Acta Meteorol. Sin. 2005, 63, 93–99, (In Chinese with English abstract). [Google Scholar] [CrossRef]
- Dee, D.P.; Uppala, S.M.; Simmons, A.J.; Berrisford, P.; Poli, P.K.; Kobayashi, S.; Andrae, U.; Balmaseda, M.A.; Balsamo, G.; Bauer, P. The ERA-Interim reanalysis: Configuration and performance of the data assimilation system. Q. J. R. Meteorol. Soc. 2011, 137, 553–597. [Google Scholar] [CrossRef]
- Trenberth, K.E. Climate Diagnostics from Global Analyses: Conservation of Mass in ECMWF Analyses. J. Clim. 1991, 4, 707–722. [Google Scholar] [CrossRef] [Green Version]
- Zhou, T.J. Comparison of the global air-sea freshwater exchange evaluated from independent datasets. Prog. Nat. Sci. 2003, 13, 626–631. [Google Scholar]
- Wang, K.L.; Cheng, G.D.; Xiao, H.L.; Jiang, H. The westerly fluctuation and water vapor transport over the Qilian-Heihe valley. Sci. China Ser. D Earth Sci. 2004, 47, 32–38. [Google Scholar] [CrossRef]
- Li, X.; Zhang, G.X. Research on Precipitable Water and Precipitation Conversion Efficiency around Tianshan Mountain Area. J. Desert Res. 2003, 23, 509–513, (In Chinese with English abstract). [Google Scholar] [CrossRef]
- Zhang, L.; Zhang, Q.; Feng, J.Y.; Bai, H.Z.; Zhao, J.H.; Xu, X.H. A study of atmospheric water cycle over the Qilian Mountains (I): Variation of annual water vapor transport. J. Glaciol. Geocryol. 2014, 36, 1079–1091, (In Chinese with English abstract). [Google Scholar] [CrossRef]
- Chen, R.S.; Han, C.T.; Liu, J.F.; Yang, Y.; Liu, Z.W.; Wang, L.; Kang, E.S. Maximum precipitation altitude on the northern flank of the Qilian Mountains, northwest China. Hydrol. Res. 2018, 49, 1696–1710. [Google Scholar] [CrossRef]
- Peng, D.D.; Zhou, T.J. Why was the arid and semiarid northwest China getting wetter in the recent decades? J. Geophys. Res. 2017, 122, 9060–9075. [Google Scholar] [CrossRef]
- Yang, C.L.; Wang, N.L.; Wang, S.J. A comparison of three predictor selection methods for statistical downscaling. Int. J. Climatol. 2017, 37, 1238–1249. [Google Scholar] [CrossRef]
- Sun, Q.H.; Miao, C.Y.; Duan, Q.Y.; Ashouri, H.; Sorooshian, S.; Hsu, K.L. A review of global precipitation data sets: Data sources, estimation, and intercomparisons. Rev. Geophys. 2018, 56, 79–107. [Google Scholar] [CrossRef] [Green Version]
- Guan, X.F.; Mei, Y.L.; Xie, Z.Y.; Gang, L.J. Spatial distribution, temporal variation, and transport characteristics of atmospheric water vapor over Central Asia and the arid region of China. Glob. Planet. Chang. 2018, 172, 159–178. [Google Scholar] [CrossRef]

| Station ID | Latitude | Longitude | Full Name | Abbreviation | Station ID | Latitude | Longitude | Full Name | Abbreviation |
|---|---|---|---|---|---|---|---|---|---|
| 52203 | 42.82 | 93.52 | Hami | HM | 52679 | 37.92 | 102.67 | Wuwei | WW |
| 52267 | 41.95 | 101.07 | Mesozoic-Cenozoic | MC | 52681 | 38.63 | 103.08 | Minqin | MQ |
| 52313 | 41.53 | 94.67 | Hongliuhe | HLH | 52707 | 36.80 | 93.68 | Xiaozaohuo | XZH |
| 52323 | 41.80 | 97.03 | Mazongshan | MZS | 52713 | 37.85 | 95.37 | Dachaidan | DCD |
| 52343 | 41.93 | 99.90 | Jihede | JHD | 52737 | 37.37 | 97.37 | Delingha | DLH |
| 52378 | 41.37 | 102.37 | Guaizihu | GZH | 52754 | 37.33 | 100.13 | Gangcha | GC |
| 52418 | 40.15 | 94.68 | Dunhuang | DH | 52765 | 37.38 | 101.62 | Menyuan | MY |
| 52424 | 40.53 | 95.77 | Anxi | AX | 52787 | 37.20 | 102.87 | Wushaoling | WSL |
| 52436 | 40.27 | 97.03 | Yumenzhen | YMZ | 52788 | 37.12 | 103.50 | Songshan | SS |
| 52441 | 40.72 | 98.62 | Wutonggou | WTG | 52797 | 37.18 | 104.05 | Jingtai | JT |
| 52446 | 40.30 | 99.52 | Dingxin | DX | 52818 | 36.42 | 94.90 | Geermu | GEM |
| 52447 | 40.00 | 98.90 | Jinta | JTa | 52825 | 36.43 | 96.42 | Nuomuhong | NMH |
| 52533 | 39.77 | 98.48 | Jiuquan | JQ | 52833 | 36.92 | 98.48 | Wulan | WL |
| 52546 | 39.37 | 99.83 | Gaotai | GT | 52836 | 36.30 | 98.10 | Dulan | DL |
| 52576 | 39.22 | 101.68 | Alxa League | AL | 52842 | 36.78 | 99.08 | Chaka | CK |
| 52602 | 38.75 | 93.33 | Lenghu | LH | 52856 | 36.27 | 100.62 | Qabqa | QBQ |
| 52633 | 38.80 | 98.42 | Tuole | TL | 52866 | 36.72 | 101.75 | Xining | XN |
| 52645 | 38.42 | 99.58 | Yeniugou | YNG | 52868 | 36.03 | 101.43 | Guide | GD |
| 52652 | 38.93 | 100.43 | Zhangye | ZY | 52876 | 36.32 | 102.85 | Minhe | MH |
| 52657 | 38.18 | 100.25 | Qilian | QL | 52884 | 36.35 | 103.93 | Gaolan | GL |
| 52661 | 38.80 | 101.08 | Shandan | SD | 52889 | 36.05 | 103.88 | Lanzhou | LZ |
| 52674 | 35.87 | 104.15 | Yongchang | YC | 52983 | 38.23 | 101.97 | Yuzhong | YZ |
| Time Scale | Evaporation | Regional | Latitudinal | Longitudinal | East | West | South | North | Total Input | Total Output |
|---|---|---|---|---|---|---|---|---|---|---|
| annual | 0.46 ** | 0.29 | 0.39 * | −0.33 * | 0.18 | 0.14 | 0.26 | −0.39 * | −0.19 | −0.24 |
| Wet season | 0.02 | 0.38 * | 0.32 | −0.21 | 0.12 | 0.19 | 0.31 | −0.32 | −0.13 | −0.20 |
| Dry season | 0.10 | −0.42 ** | 0.28 | −0.40 * | 0.08 | 0.05 | 0.16 | −0.36 * | −0.17 | 0.11 |
Publisher’s Note: MDPI stays neutral with regard to jurisdictional claims in published maps and institutional affiliations. |
© 2021 by the authors. Licensee MDPI, Basel, Switzerland. This article is an open access article distributed under the terms and conditions of the Creative Commons Attribution (CC BY) license (https://creativecommons.org/licenses/by/4.0/).
Share and Cite
Zhang, Z.; Zhao, Q.; Zhang, S. Abundant Precipitation in Qilian Mountains Generated from the Recycled Moisture over the Adjacent Arid Hexi Corridor, Northwest China. Water 2021, 13, 3354. https://doi.org/10.3390/w13233354
Zhang Z, Zhao Q, Zhang S. Abundant Precipitation in Qilian Mountains Generated from the Recycled Moisture over the Adjacent Arid Hexi Corridor, Northwest China. Water. 2021; 13(23):3354. https://doi.org/10.3390/w13233354
Chicago/Turabian StyleZhang, Zhihua, Qiudong Zhao, and Shiqiang Zhang. 2021. "Abundant Precipitation in Qilian Mountains Generated from the Recycled Moisture over the Adjacent Arid Hexi Corridor, Northwest China" Water 13, no. 23: 3354. https://doi.org/10.3390/w13233354
APA StyleZhang, Z., Zhao, Q., & Zhang, S. (2021). Abundant Precipitation in Qilian Mountains Generated from the Recycled Moisture over the Adjacent Arid Hexi Corridor, Northwest China. Water, 13(23), 3354. https://doi.org/10.3390/w13233354