
Study on the Remote Sensing Spectral Method for Disaster Loss Inversion in Urban Flood Areas

 , ,
, ,
Abstract
:1. Introduction
2. Materials and Methods
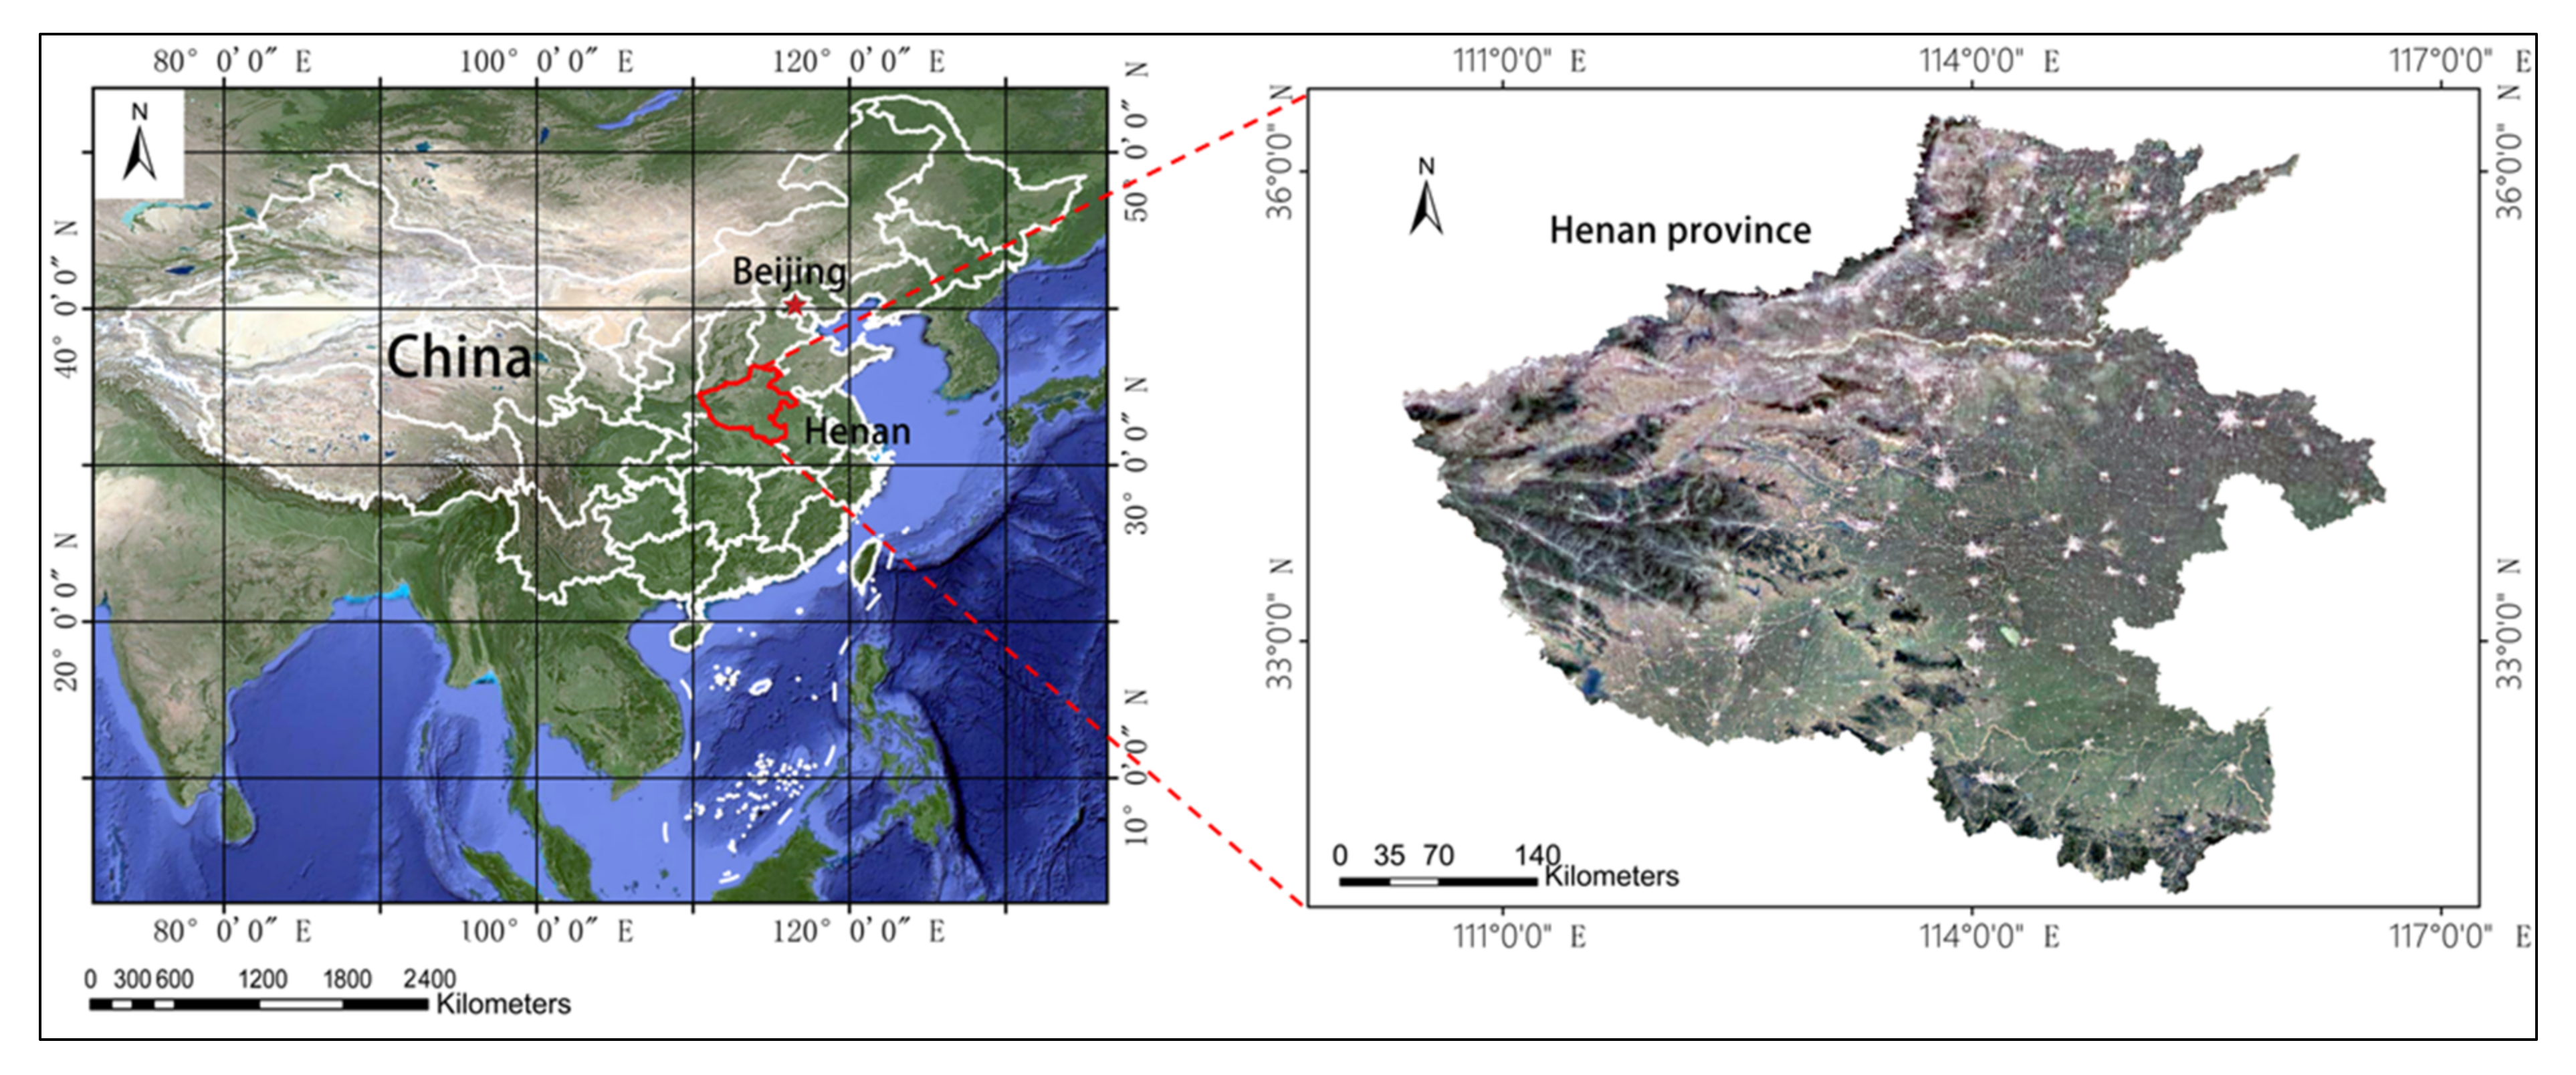
2.1. The Study Area
2.2. Access to Data and Materials
2.3. Methods
2.3.1. Inversion Model of Rainfall Distribution
2.3.2. Economic Loss Calculation Model of Floods
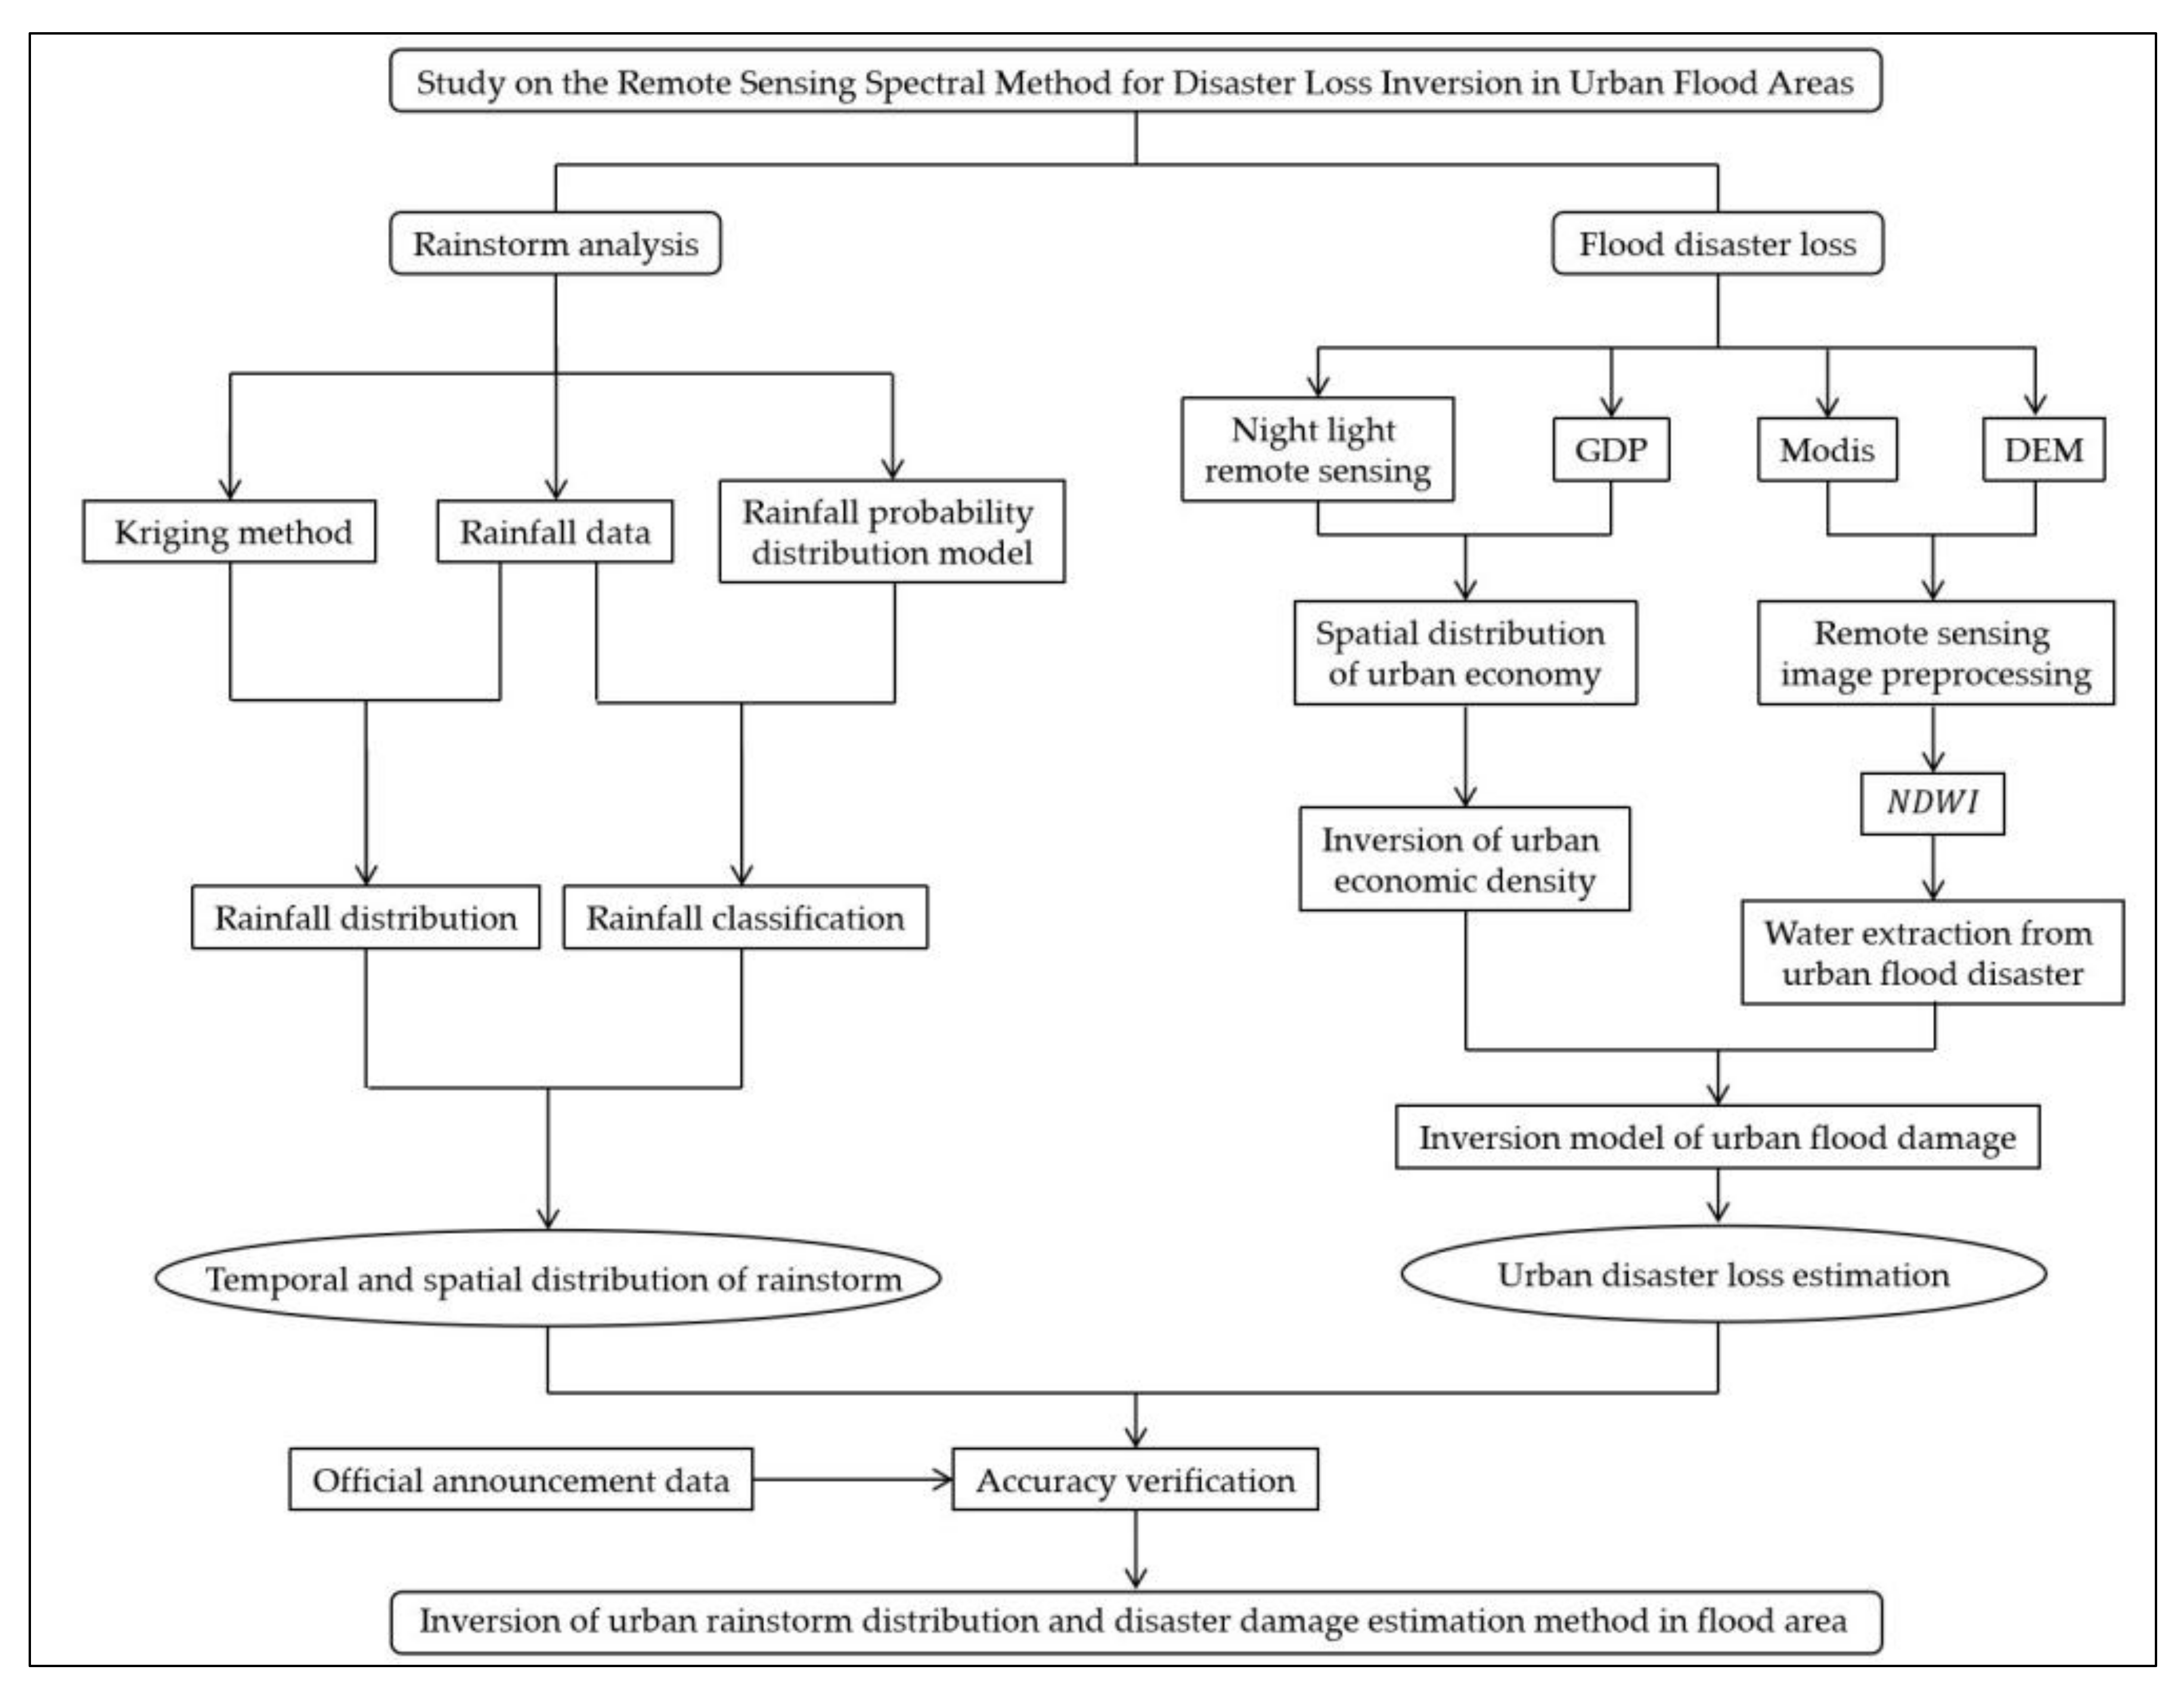
2.4. Flow Chart
3. Results
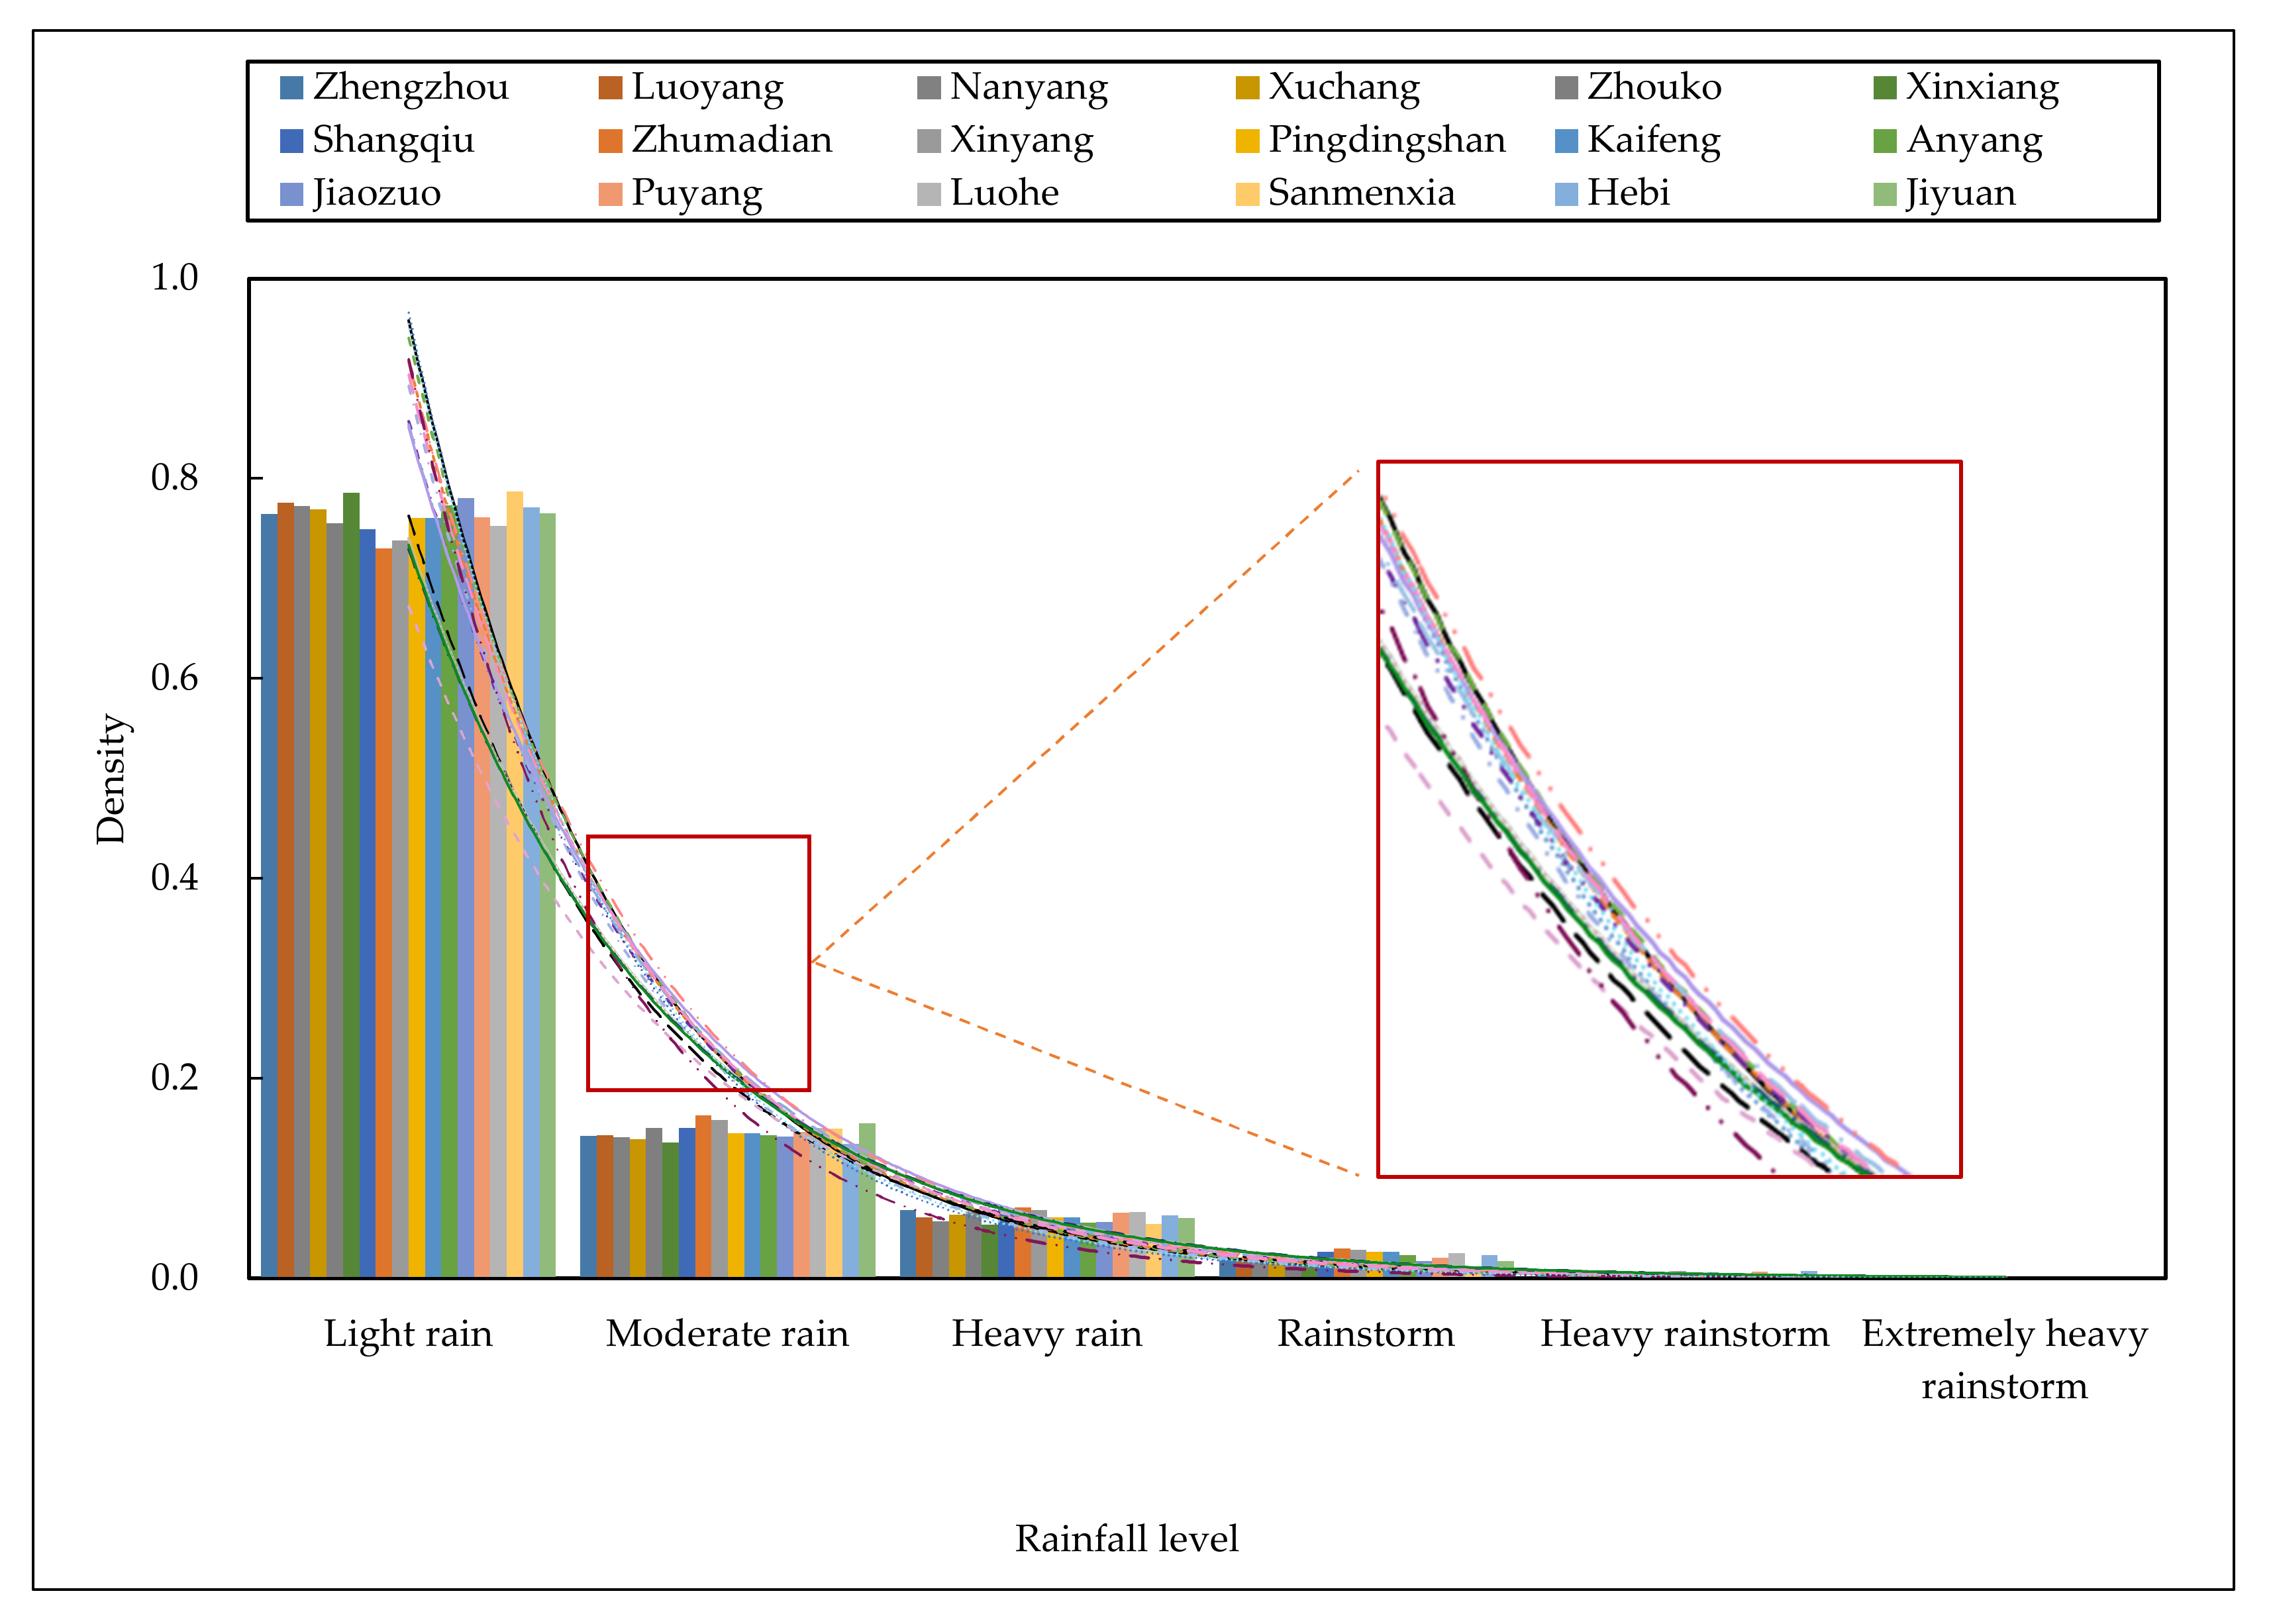
3.1. Rainfall Probability and Disaster Level
3.2. Inversion of Precipitation Development and Distribution in Henan Province
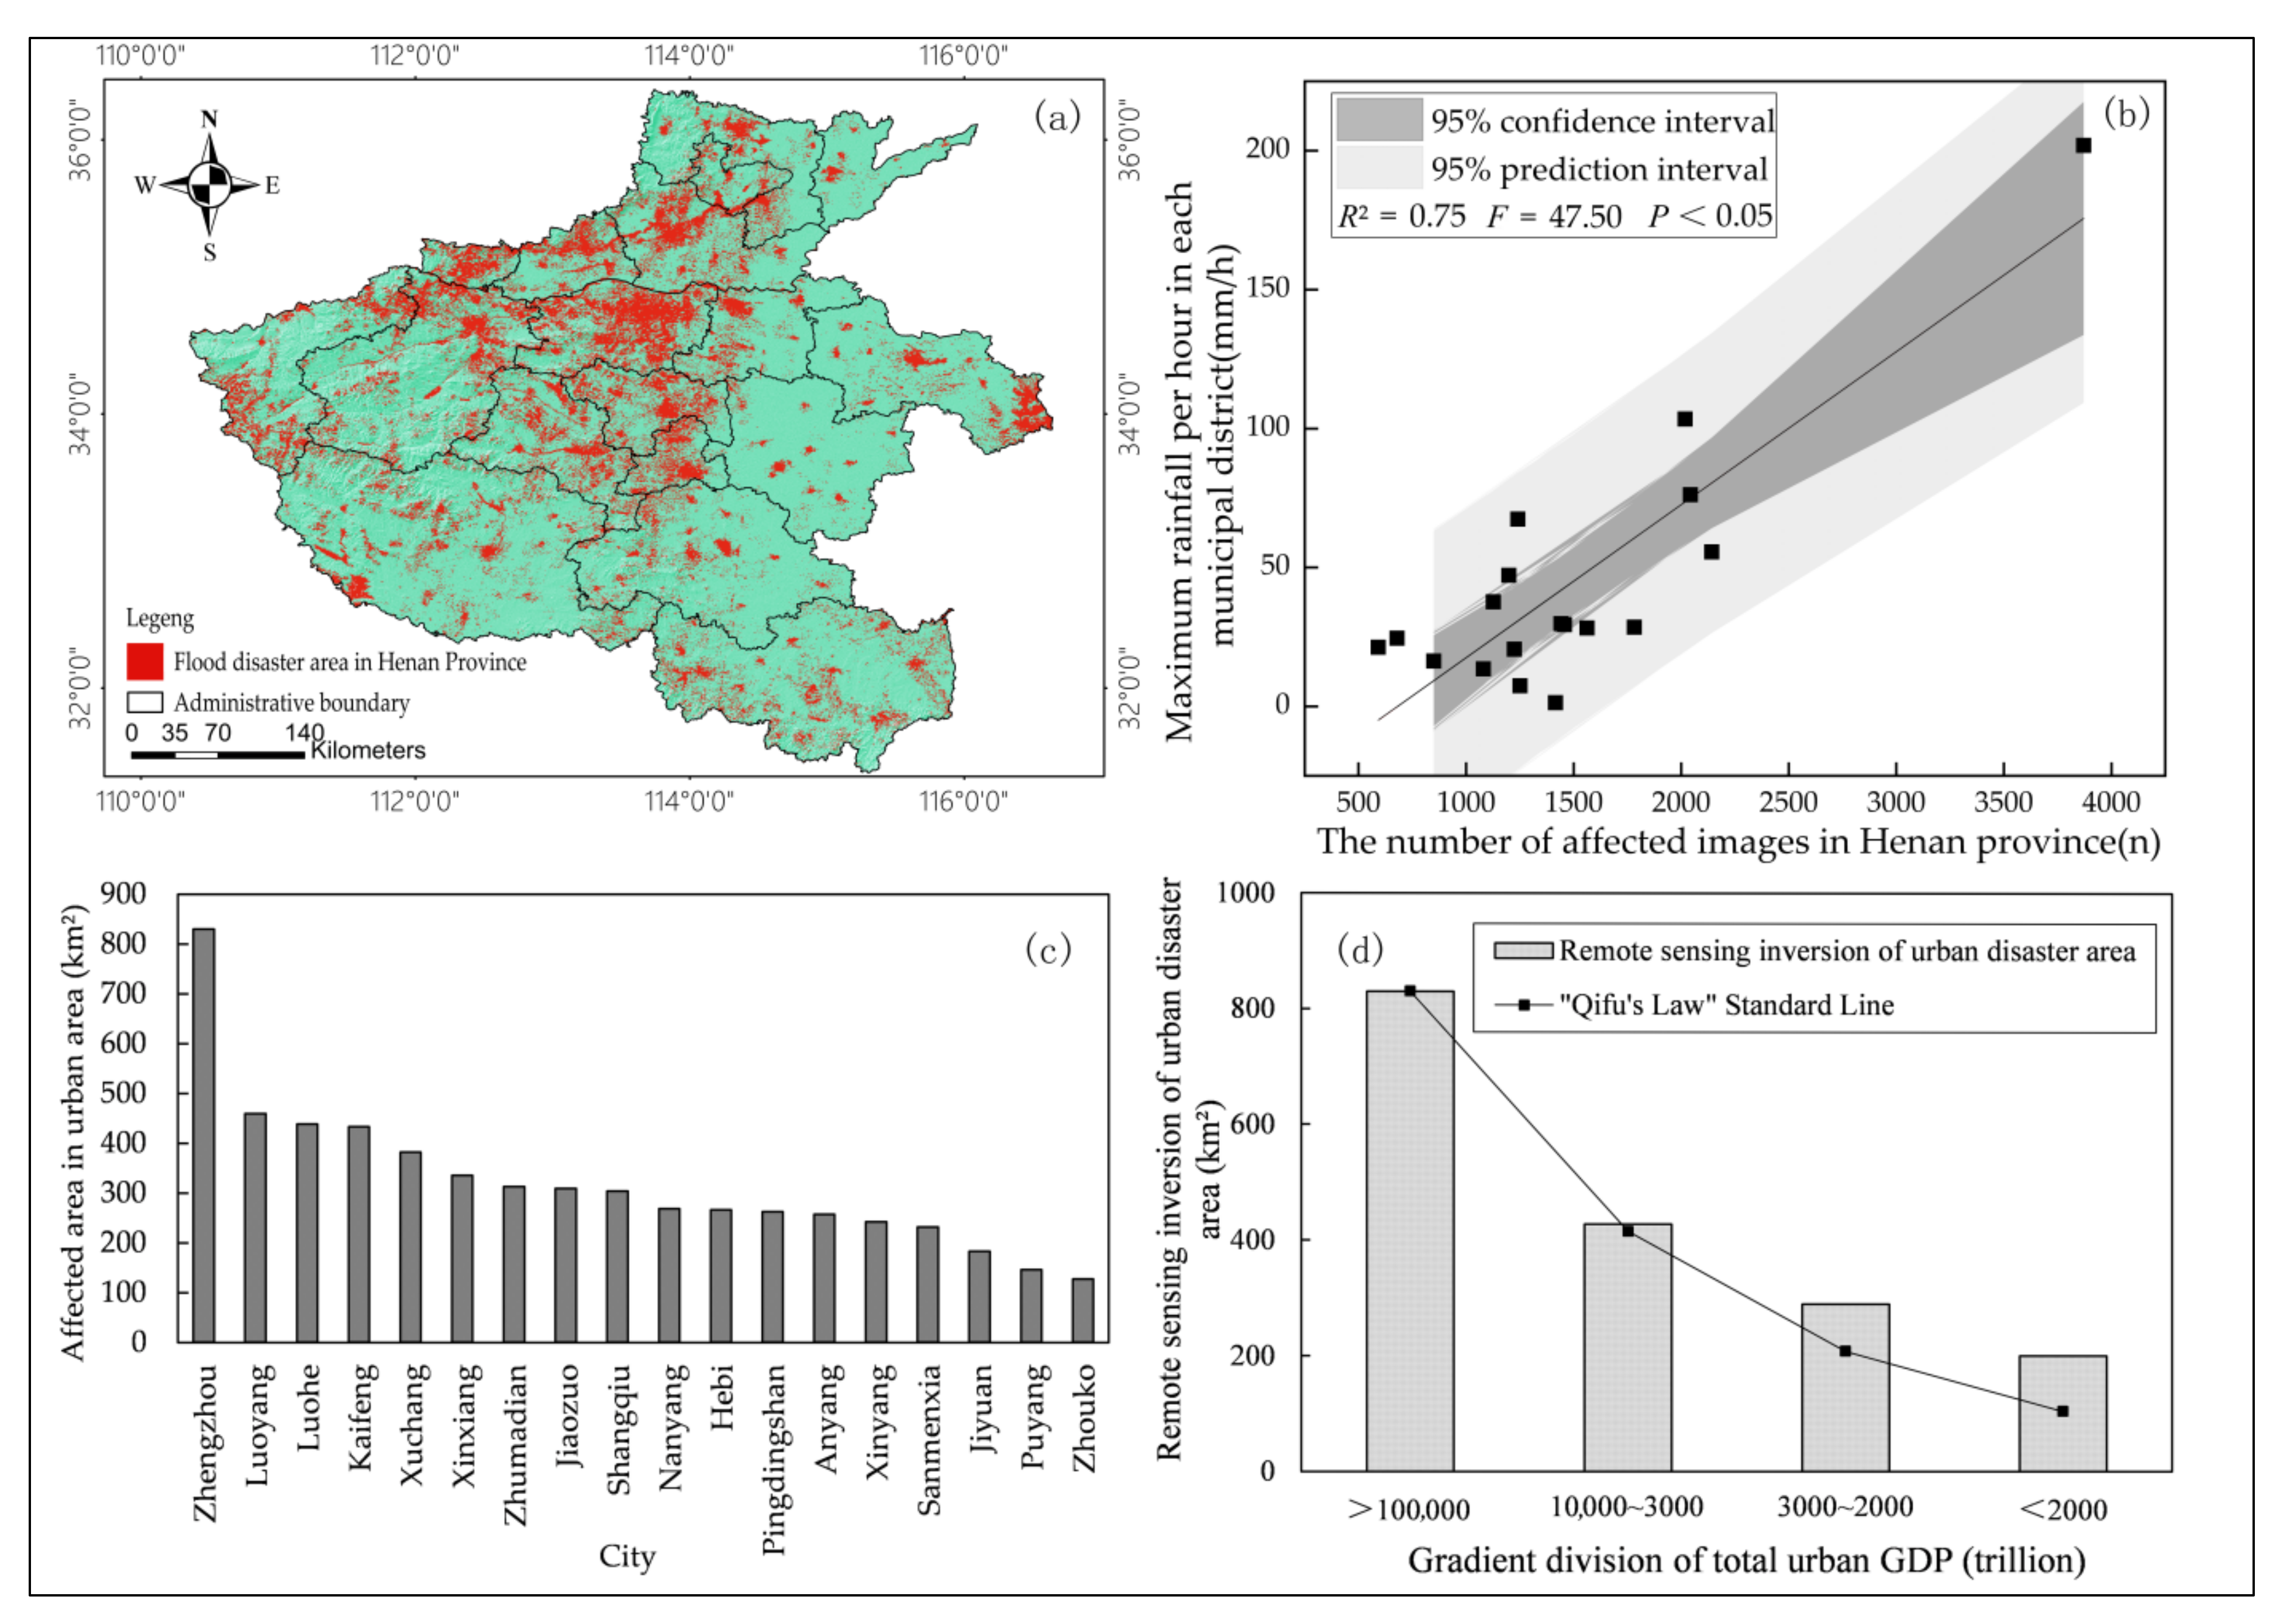
3.3. Inversion of Flood Disaster Zoning and Distribution Based on Remote Sensing Images
3.4. Establishing a Spatial Coupling Model of Remote Sensing—Urban Economy-Flood Disaster
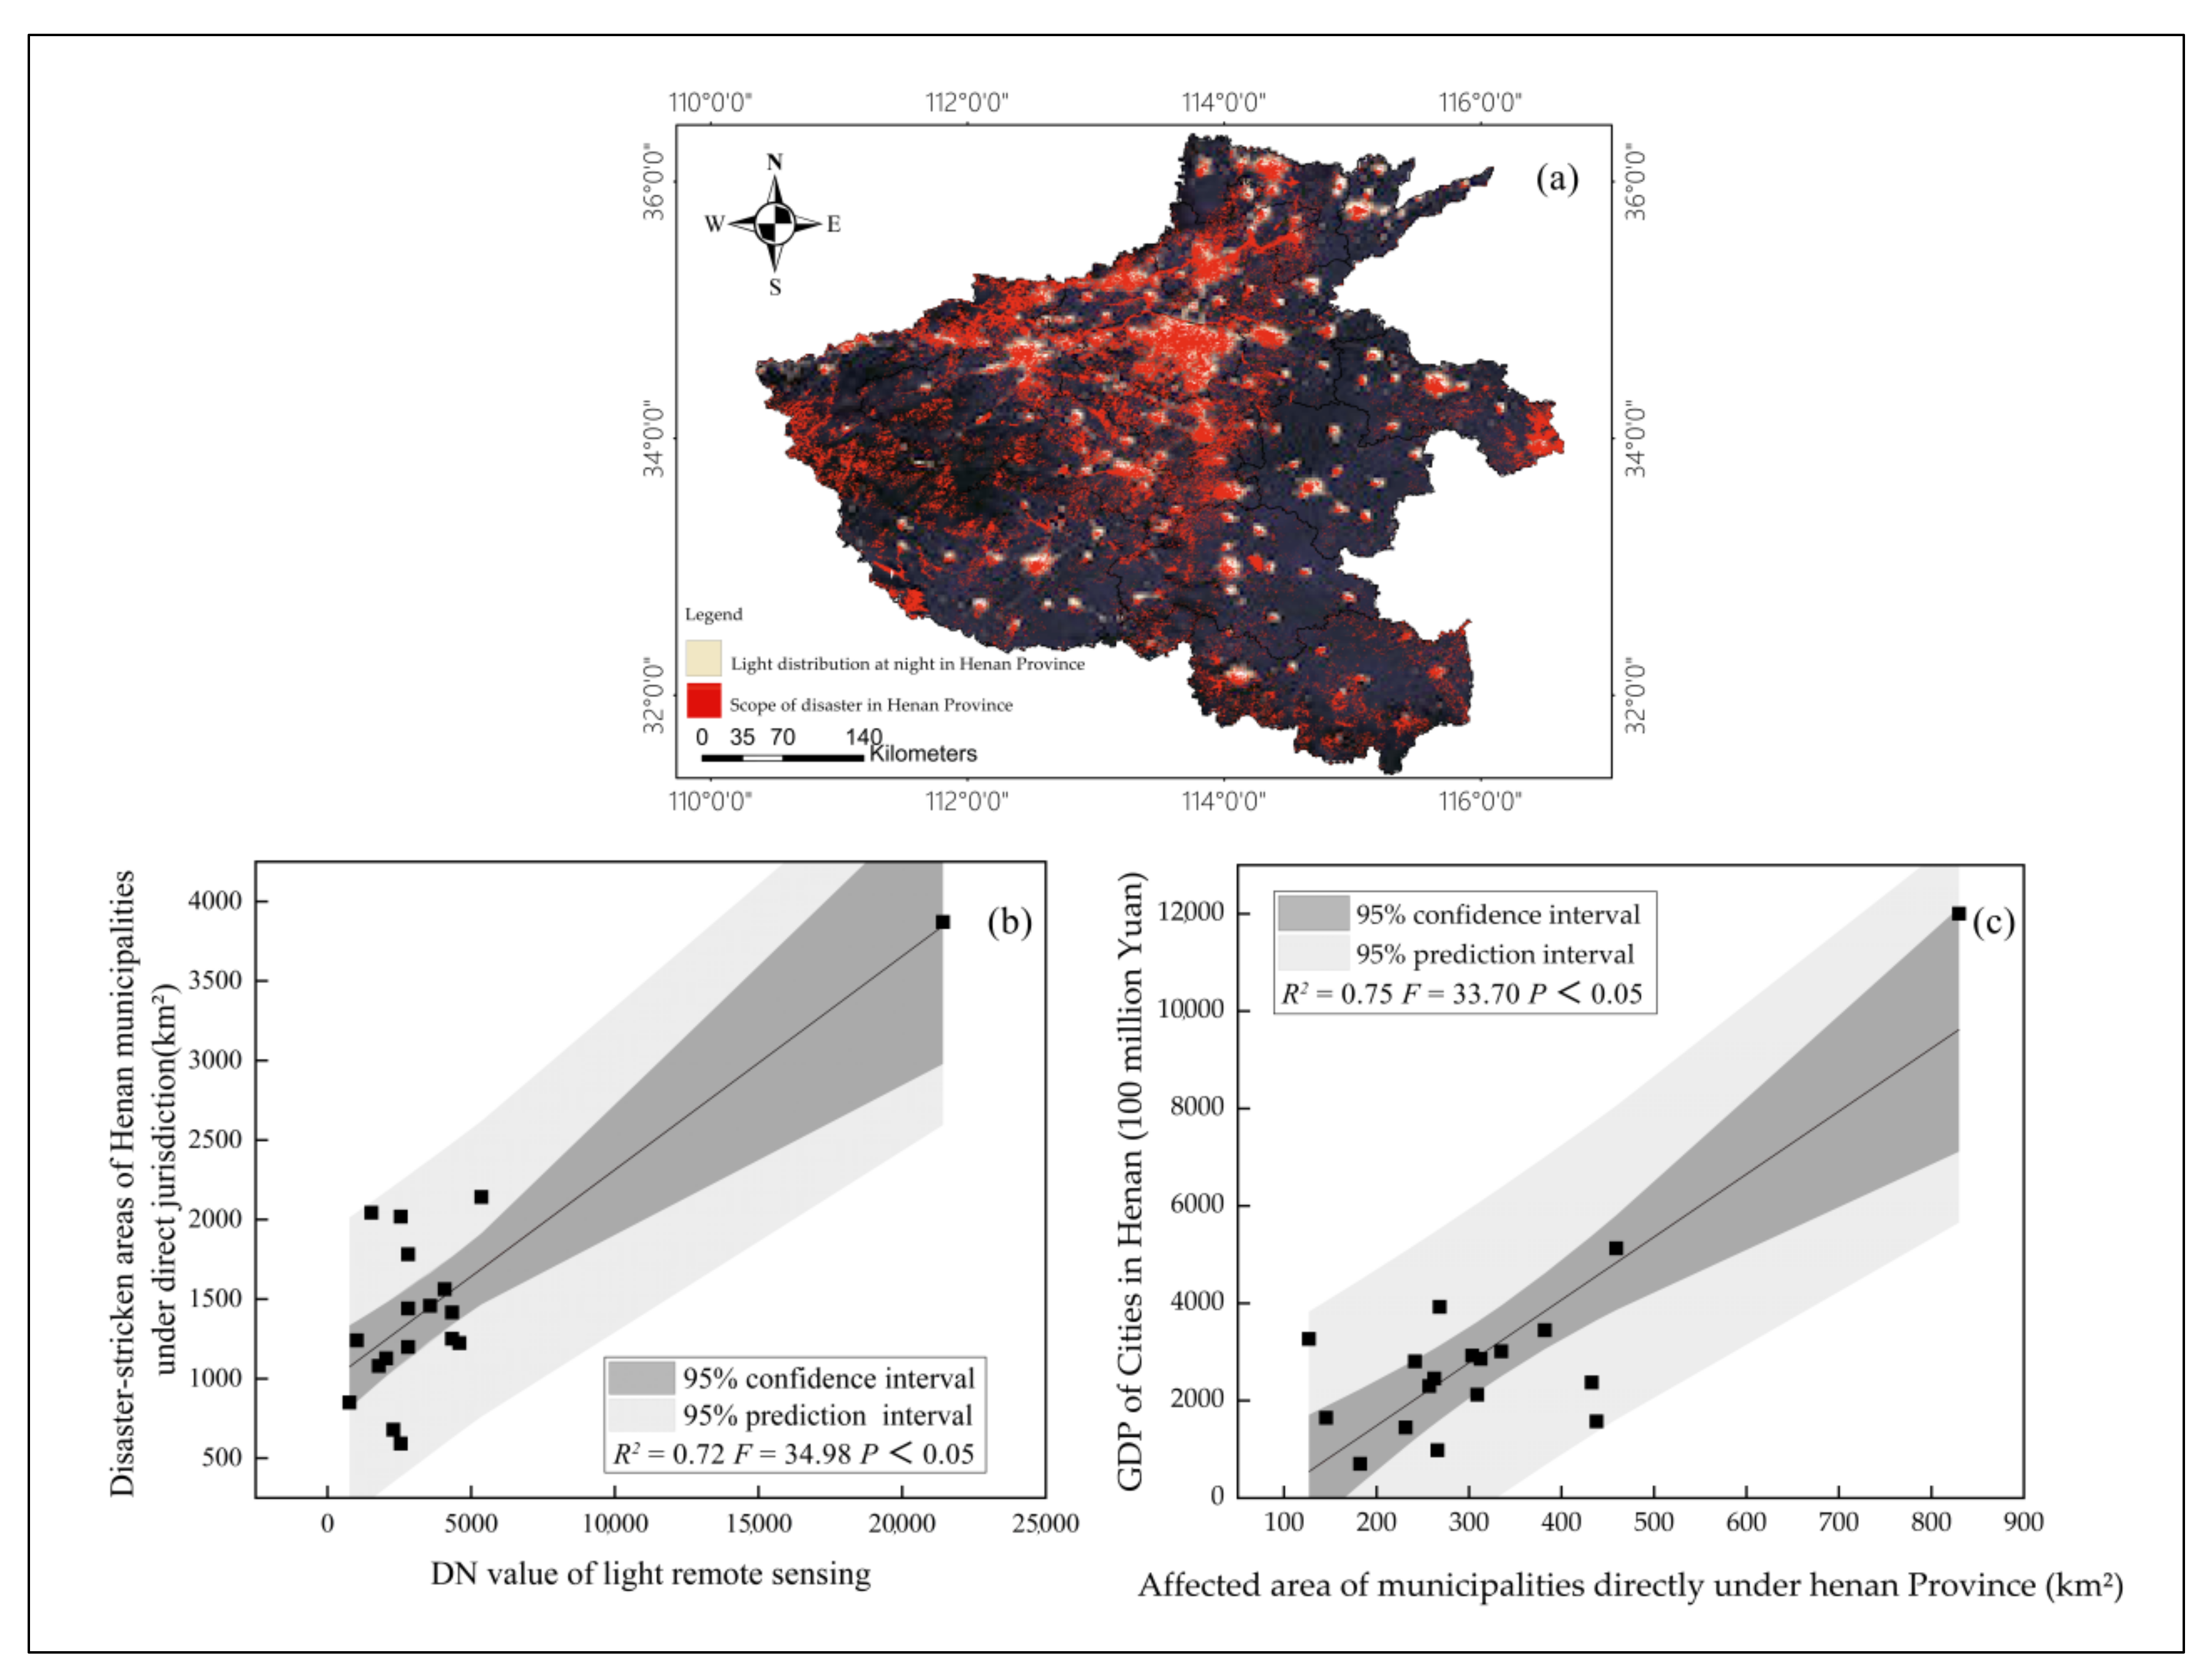
3.4.1. Plane Feature Mining Based on Night Light and Urban GDP
3.4.2. Analysis of the Relationship between Urban Night Light, GDP, and Flood Distribution
3.5. Economic Loss Assessment of Flood Disasters
4. Discussion
5. Conclusions
- (1)
- According to data from research on historical rainfall, the rainfall probability is analyzed and the rainfall probability distribution model is constructed (R2 ≥ 0.95). The disaster grade is categorized from high to low (grades I, II, III, and IV), and the corresponding relationship between flood disaster grade and rainfall grade, rainfall interval, and rainfall return period is constructed.
- (2)
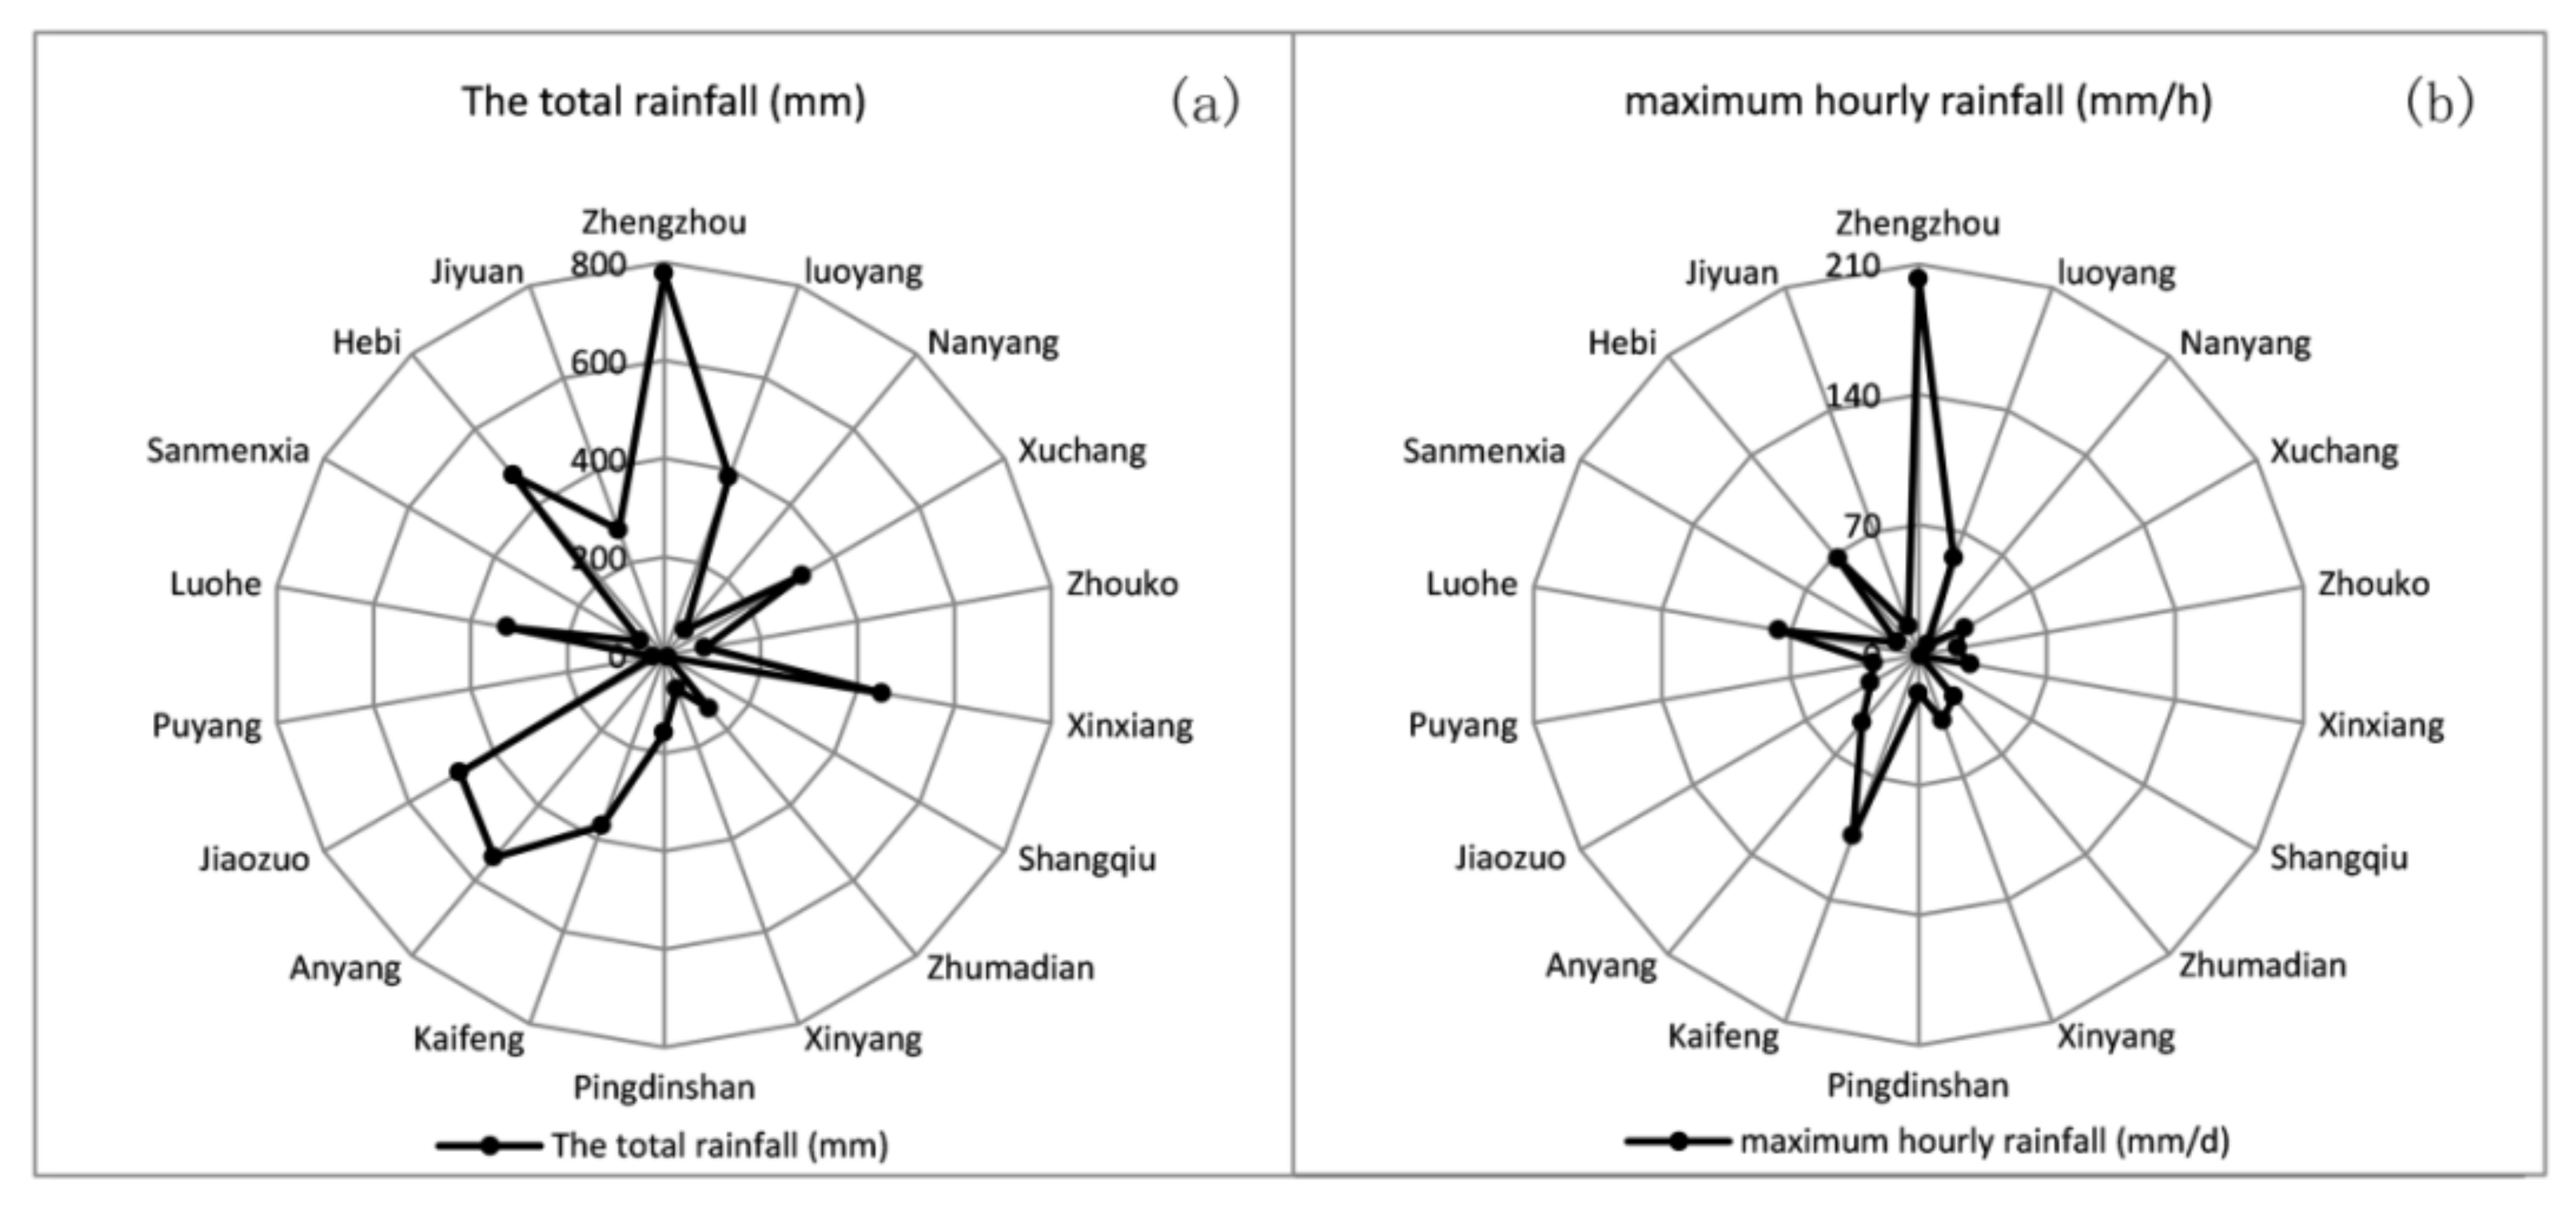
- The daily rainfall development distribution of the 20 July rainstorm in Henan Province is retrieved by the kriging regression algorithm. According to the analysis of the inversion results, the daily maximum rainfall in Henan Province from 19 July to 22 July is 352 mm/d, 630 mm/d, 447 mm/d, and 159 mm/d, respectively. The maximum hourly rainfall occurs in Zhengzhou on 20 July (210 mm/h). On 21 July, the rainfall distribution shifts from southwestern Zhengzhou and western Xuchang to northern Henan Province, and the rainfall in most parts of Henan Province gradually decreases. On 22 July, only the northern and western parts of the province have rainfall.
- (3)
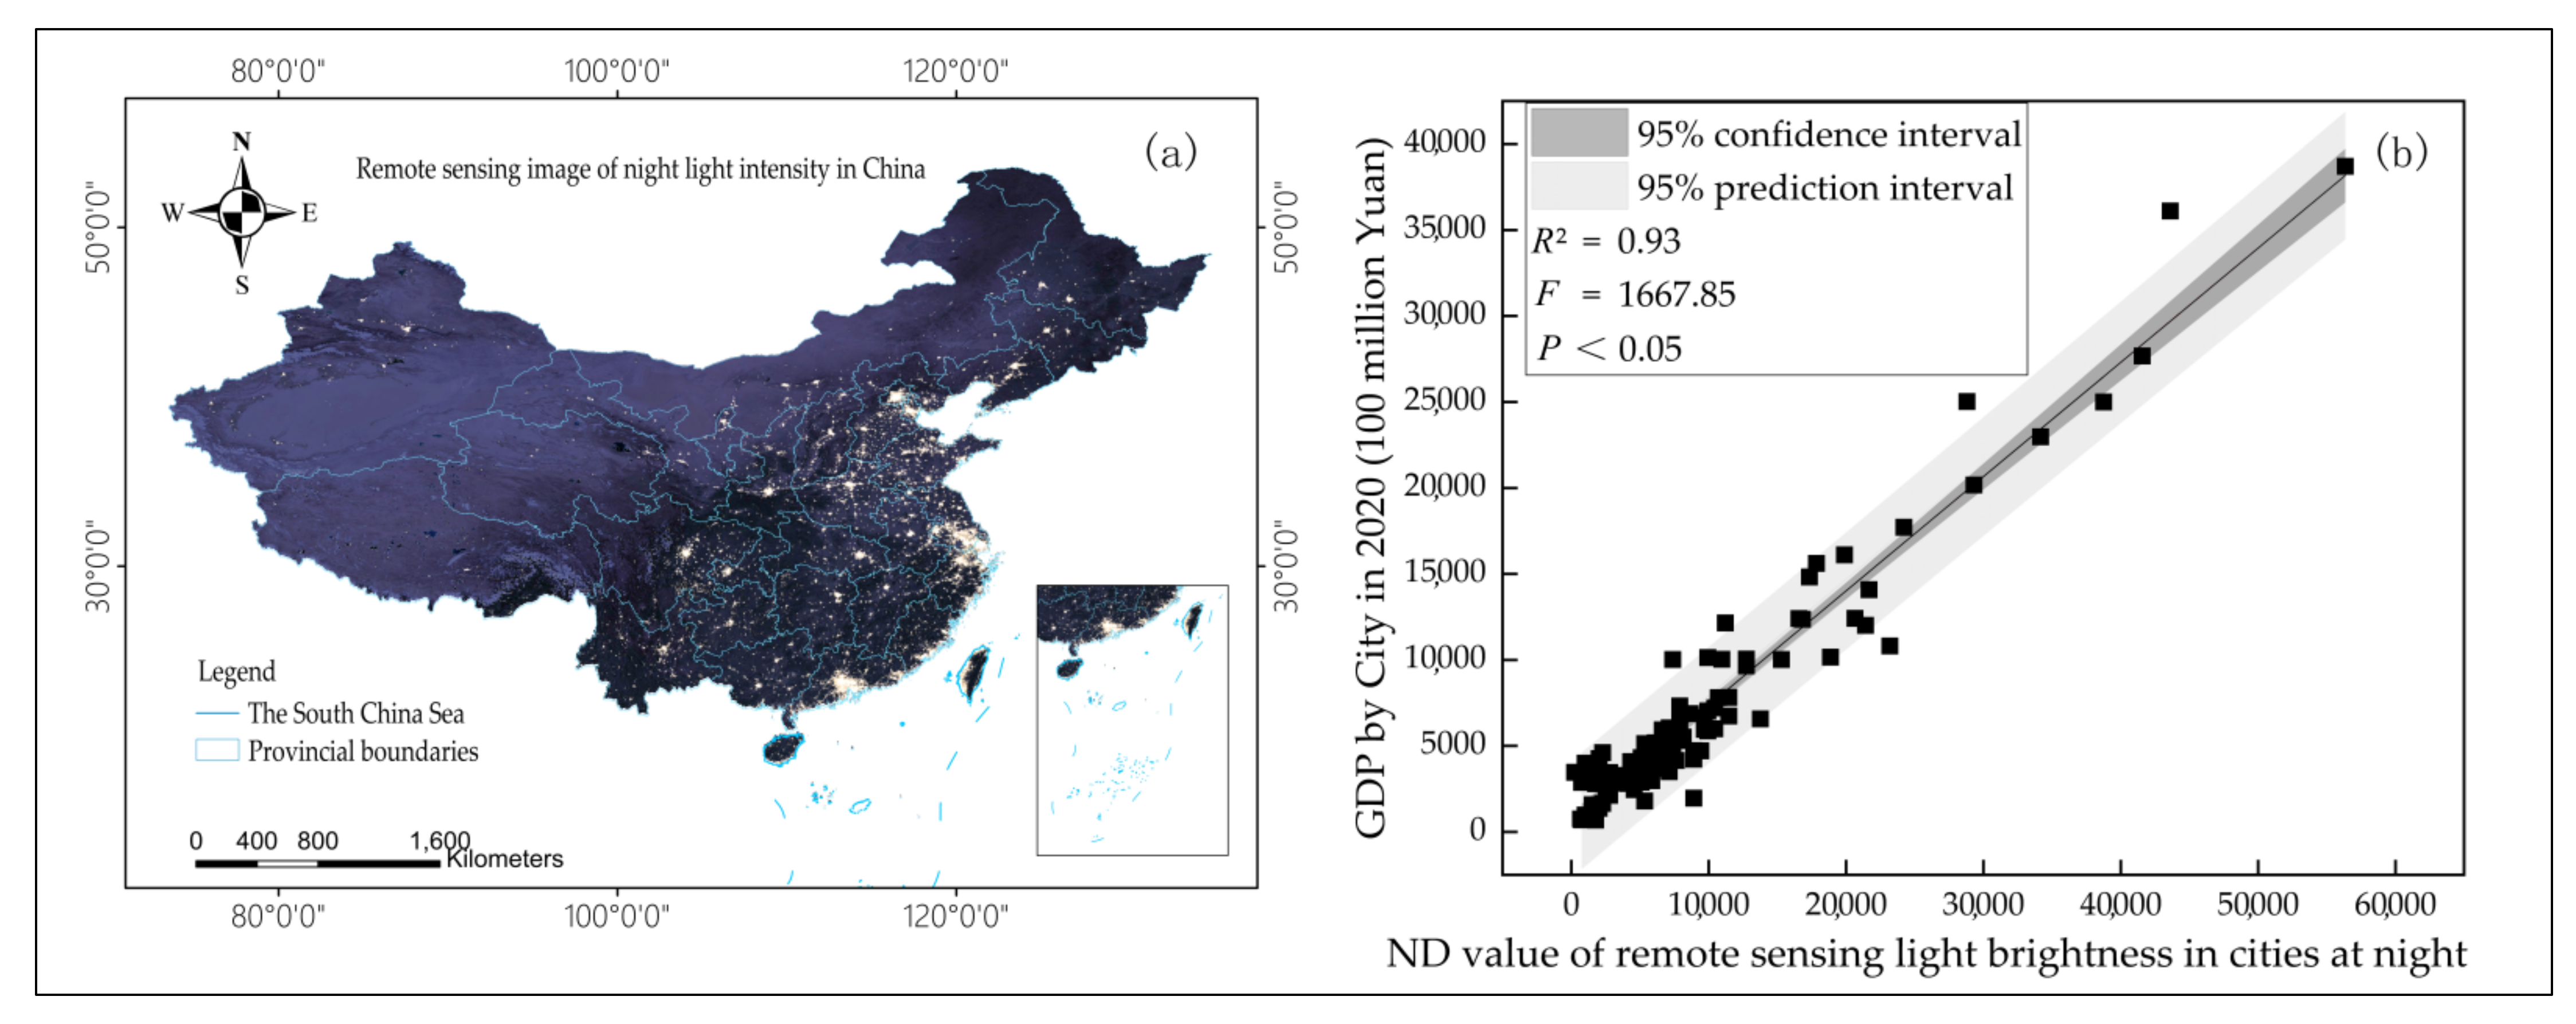
- The disaster distribution in the Henan urban flood area retrieved by the multidimensional remote sensing spectrum is consistent with the rainfall distribution ( = 0.75, F = 47.50, p < 0.05). The spatial distribution of urban flood disasters (centered on Zhengzhou) conforms to Zipf’s law. The urban economic spatial distribution is characterized by night light remote sensing ( = 0.93, F = 1667.85, p < 0.05), the spatial coupling inversion of the remote sensing spectrum-urban economy-flood disaster is realized, and a disaster loss estimation method for urban flood areas is proposed (in comparing the disaster loss calculation results with official data, the accuracy is greater than 90%, ≥ 0.95). Therefore, this study can provide technical support for accurate and efficient estimation of large-scale urban flood disaster. At the same time, this study provides data and theoretical support for the implementation of personnel evacuation by disaster and emergency departments and subregional flood control and disaster relief. It also provides a theoretical method and calculation basis for the government’s post-disaster reconstruction and the compilation of flood loss reports in various cities.
Author Contributions
Funding
Institutional Review Board Statement
Informed Consent Statement
Data Availability Statement
Conflicts of Interest
References
- Maziar, Y.D.; Mohammad, M.; Martin, L.; David, S. A modelling framework to design an evacuation support system for healthcare infrastructures in response to major flood events. Prog. Disaster Sci. 2022, 13, 100218. [Google Scholar] [CrossRef]
- Wang, X.; Wu, Z.; Liang, G. WRF/CHEM modeling of impacts of weather conditions modified by urban expansion on secondary organic aerosol formation over Pearl River Delta. Particuology 2009, 7, 384–391. [Google Scholar] [CrossRef]
- Trifonova, T.; Arakelian, M.; Bukharov, D.; Abrakhin, S.; Abrakhina, S.; Arakelian, S. Catastrophic floods in large River Basins: Surface water and groundwater interaction under dynamic complex natural processes-forecasting and presentation of flood consequences. Water 2022, 14, 1405. [Google Scholar] [CrossRef]
- Liu, K.; Li, X.; Wang, S. Characterizing the spatiotemporal response of runoff to impervious surface dynamics across three highly urbanized cities in southern China from 2000 to 2017. Int. J. Appl. Earth Obs. Geoinf. 2021, 100, 102331. [Google Scholar] [CrossRef]
- Jin, K.; Wang, F.; Han, J.; Shi, S.; Ding, W. Contribution of climatic change and human activities to vegetation NDVI change over China during 1982–2015. Acta Geogr. Sin. 2020, 75, 961–974. [Google Scholar] [CrossRef]
- Xu, X.; Du, Y.; Tang, J.; Wang, Y. Variations of temperature and precipitation extremes in recent two decades over China. Atmos. Res. 2011, 101, 143–154. [Google Scholar] [CrossRef]
- Sidek, L.M.; Jaafar, A.S.; Majid, W.H.; Basri, H.; Marufuzzaman, M.; Fared, M.M.; Moon, W.C. High-resolution hydrological-hydraulic modeling of urban floods using infoworks ICM. Sustainability 2021, 13, 10259. [Google Scholar] [CrossRef]
- Huang, G.; Chen, W.; Yu, H. Construction and evaluation of an integrated hydrological and hydrodynamics urban flood model. Adv. Water Sci. 2021, 32, 334–344. [Google Scholar] [CrossRef]
- Chen, M.; Zhou, F.; Ma, J.; Chen, G.; Ni, H.; Hu, Y. Waterinduced disaster damage function and flood and water-logging damage assessment. J. Hydraul. Eng. 2015, 46, 883–891. [Google Scholar] [CrossRef]
- Li, C.C.; Cheng, X.T.; Wang, Y.Y.; Fu, D.Y. A three-parameter flood damage function, part I. Theory and development. J. Hydraul. Eng. 2020, 51, 349–357. [Google Scholar] [CrossRef]
- Zimba, H.; Kawawa, B.; Chabala, A.; Phiri, W.; Selsam, P.; Meinhardt, M.; Nyambe, I. Assessment of trends in inundation extent in the Barotse Floodplain, upper Zambezi River Basin: A remote sensing-based approach. J. Hydrol. Reg. Stud. 2018, 15, 149–170. [Google Scholar] [CrossRef]
- Barnett, B.J.; Mahul, O. Weather index insurance for agriculture and rural areas in lower-income countries. Am. J. Agric. Econ. 2007, 89, 1241–1247. [Google Scholar] [CrossRef]
- Nghia, B.P.Q.; Pal, I.; Chollacoop, N.; Mukhopadhyay, A. Applying Google earth engine for flood mapping and monitoring in the downstream provinces of Mekong river. Prog. Disaster Sci. 2022, 14, 100235. [Google Scholar] [CrossRef]
- Karthikeyan, M.; Niranga, A.; Rajesh, P.; Giriraj, A. Flood risk assessment in South Asia to prioritize flood index insurance applications in Bihar, India. Geomat. Nat. Hazards Risk 2019, 10, 26–48. [Google Scholar] [CrossRef] [Green Version]
- Auliagisni, W.; Wilkinson, S.; Elkharboutly, M. Using community-based flood maps to explain flood hazards in Northland, New Zealand. Prog. Disaster Sci. 2022, 14, 100229. [Google Scholar] [CrossRef]
- Vecere, A.; Martina, M.; Monteiro, R.; Galasso, C. Satellite precipitation–based extreme event detection for flood index insurance. Int. J. Disaster Risk Reduct. 2021, 55, 102108. [Google Scholar] [CrossRef]
- Kim, Y.D.; Tak, Y.H.; Park, M.H.; Kang, B. Improvement of urban flood damage estimation using a high-resolution digital terrain. J. Flood Risk Manag. 2020, 13, e12575. [Google Scholar] [CrossRef] [Green Version]
- Xu, Z.; Cheng, T.; Hong, S.; Wang, L. Review on applications of remote sensing in urban flood modeling. Chin. Sci. Bull. 2018, 63, 2156–2166. [Google Scholar] [CrossRef]
- Wang, X.; Xie, S.; Zhang, X.; Chen, C.; Guo, H.; Du, J.; Duan, Z. A robust multi-band water index (MBWI) for automated extraction of surface water from landsat 8 OLI imagery. Int. J. Appl. Earth Obs. Geoinf. 2018, 68, 73–91. [Google Scholar] [CrossRef]
- Yang, T.; Xie, J.; Li, G.; Zhang, L.; Mou, N.; Wang, H.; Zhang, X.; Wang, X. Extracting disaster-related location information through social media to assist remote sensing for disaster analysis: The case of the flood disaster in the Yangtze River Basin in China in 2020. Remote Sens. 2022, 14, 1199. [Google Scholar] [CrossRef]
- Deng, G.; Chen, H.; Wang, S. Risk assessment and prediction of rainstorm and flood disaster based on Henan Province, China. Math. Probl. Eng. 2022, 2022, 5310920. [Google Scholar] [CrossRef]
- Du, S.; Cheng, X.; Huang, Q.; Chen, R.; Ward, P.J.; Aerts, J.C.J.H. Brief communication: Rethinking the 1998 China floods to prepare for a nonstationary future. Nat. Hazards Earth Syst. Sci. 2019, 19, 715–719. [Google Scholar] [CrossRef] [Green Version]
- David, C. Role of insurance in reducing flood risk. Geneva Pap. Risk Insur. Issues Pract. 2008, 33, 117–132. [Google Scholar] [CrossRef] [Green Version]
- Li, H.; Wang, X.; Dai, S.; Tian, G. Flood monitoring in Hainan Island based on HJ-CCD data. Trans. Chin. Soc. Agric. Eng. 2015, 31, 191–198. [Google Scholar] [CrossRef]
- Chen, C.K.; Sun, F.L. Flood damage assessments based on entropy weight-grey relational analyses. J. Tsinghua Univ. (Sci. Technol.) 2022, 62, 1067–1073. [Google Scholar] [CrossRef]
- Tang, Y.; Cai, H.; Liu, R. Farmers’ demand for informal risk management strategy and weather index insurance: Evidence from China. Int. J. Disaster Risk Sci. 2021, 12, 281–297. [Google Scholar] [CrossRef]
- Chen, J.; Wang, Y.Q.; Zhang, X.Q. Study on the strategy of water supply security in the Yangtze River economic belt. J. Hydraul. Eng. 2021, 52, 1369–1378. [Google Scholar] [CrossRef]
- Wang, Y.Y.; Li, N.; Wang, S.; Wang, J.; Zhang, N.Q. Development and application of flood damage assessment system. J. Hydraul. Eng. 2019, 50, 1103–1110. [Google Scholar] [CrossRef]
- Jiang, C.B.; Zhou, Q.; Shen, Y.X.; Liu, G.F.; Zhang, D. Review on hydrological and hydrodynamic coupling models for flood forecasting in mountains watershed. J. Hydraul. Eng. 2021, 52, 1137–1150. [Google Scholar] [CrossRef]
- Liu, Y.; Qin, Y.; Ge, Q.; Dai, J.; Chen, Q. Reponses and sensitivities of maize phenology to climate change from 1981 to 2009 in Henan Province, China. J. Geogr. Sci. 2017, 27, 1072–1084. [Google Scholar] [CrossRef]
- Shi, C.; Zhou, L.; Fan, L.; Zhang, W.; Cao, Y.; Wang, C.; Xiao, F.; Lü, G.; Liang, H. Analysis of “21· 7” extreme rainstorm process in Henan Province using BeiDou/GNSS observation. Chin. J. Geophys. 2022, 65, 186–196. [Google Scholar] [CrossRef]
- Azari, B.; Tabesh, M. Urban storm water drainage system optimization using a sustainability index and LID/BMPs. Sustain. Cities Soc. 2022, 76, 103500. [Google Scholar] [CrossRef]
- Hasan, K.; Paul, S.; Chy, T.J.; Antipova, A. Analysis of groundwater table variability and trend using ordinary kriging: The case study of Sylhet, Bangladesh. Appl. Water Sci. 2021, 11, 120. [Google Scholar] [CrossRef]
- Rossat, D.; Baroth, J.; Briffaut, M.; Dufour, F. Bayesian inversion using adaptive polynomial Chaos Kriging within subset simulation. J. Comput. Phys. 2022, 455, 110986. [Google Scholar] [CrossRef]
- Rossi, R.E.; Dungan, J.L.; Beck, L.R. Kriging in the shadows: Geostatistical interpolation for remote sensing. Remote Sens. Environ. 1994, 49, 32–40. [Google Scholar] [CrossRef]
- Cressie, N. The origins of kriging. Math. Geol. 1990, 22, 239–252. [Google Scholar] [CrossRef]
- McFeeters, S.K. The use of the normalized difference water index (NDWI) in the delineation of open water features. Int. J. Remote Sens. 1996, 17, 1425–1432. [Google Scholar] [CrossRef]
- Xu, D.; Liu, Y. Research on the effect of rainfall flood regulation and control of wetland park based on SWMM model—A case study of wetland park in Yuanjia village, Qishan county, Shaanxi Province. IOP Conf. Ser. Earth Environ. Sci. 2018, 121, 052014. [Google Scholar] [CrossRef]
- Xu, Z.X.; Ye, C.L. Simulation of urban flooding/waterlogging processes: Principle, models and prospects. J. Hydraul. Eng. 2021, 52, 381–392. [Google Scholar] [CrossRef]
- Xu, K.; Mao, W.S.; Zhao, H.B. Characteristics of rainstorm variation in Longquanyi District of Chengdu. Sci. J. 2021, 9, 443–453. [Google Scholar] [CrossRef]
- Huang, C.; Zhang, S.; Dong, L.; Wang, Z.; Li, L.; Cui, L. Spatial and temporal variabilities of rainstorms over China under climate change. J. Geogr. Sci. 2021, 31, 479–496. [Google Scholar] [CrossRef]
- Ashok, A.; Rani, H.P.; Jayakumar, K.V. Monitoring of dynamic wetland changes using NDVI and NDWI based landsat imagery. Remote Sens. Appl. Soc. Environ. 2021, 23, 100547. [Google Scholar] [CrossRef]
- Chen, Z.Q.; Wei, Y.; Shi, K.F.; Zhao, Z.Y.; Wang, C.X.; Wu, B.; Qiu, B.; Yu, B.L. The potential of nighttime light remote sensing data to evaluate the development of digital economy: A case study of China at the city level. Comput. Environ. Urban Syst. 2022, 92, 101749. [Google Scholar] [CrossRef]


| Data Name | Data Sources | Website |
|---|---|---|
| meteorological data | China National Meteorological Information Center | http://data.cma.cn accessed on 2 January 2022 |
| Rainfall data | China National Meteorological Information Center | http://data.cma.cn accessed on 2 January 2022 |
| MODIS Remote Sensing | LAADS and DAAC | https://ladsweb.nascom.nasa.gov/search accessed on 7 December 2021 |
| digital elevation model, DEM | China geospatial data cloud platform | http://www.gscloud.cn accessed on 7 December 2021 |
| GDP of cities in Henan Province | Statistical yearbook of Henan Province in 2020 | https://tjj.henan.gov.cn/tjfw/tjcbw/tjnj/ accessed on 14 December 2021 |
| Night light remote sensing | National Oceanic and Atmospheric Administration | https://ngdc.noaa.gov/eog/dmsp.html accessed on 14 December 2021 |
| Frquency | Light Rain % | Moderate Rain % | Heavy Rain % | Rainstorm % | Heavy Rainstorm % | Extremely Heavy Rainstorm % | Probabilistically Distributed Model | Imitative Effect R2 | |
|---|---|---|---|---|---|---|---|---|---|
| Region | |||||||||
| Zhengzhou | 76.47% | 14.27% | 6.84% | 2.07% | 0.33% | 0.03% | y = 4.30*e−1.50x | R2 = 0.96 | |
| Luoyang | 77.57% | 14.31% | 6.07% | 1.84% | 0.17% | 0.02% | y = 4.61*e−1.56x | R2 = 0.98 | |
| Nanyang | 77.23% | 14.12% | 5.68% | 2.43% | 0.52% | 0.02% | y = 3.95*e−1.46x | R2 = 0.95 | |
| Xuchang | 76.88% | 13.92% | 6.34% | 2.32% | 0.51% | 0.02% | y = 4.09*e−1.47x | R2 = 0.95 | |
| Zhouko | 75.54% | 15.01% | 6.67% | 2.27% | 0.46% | 0.05% | y = 3.44*e−1.39x | R2 = 0.97 | |
| Xinxiang | 78.58% | 13.58% | 5.35% | 2.00% | 0.44% | 0.06% | y = 2.97*e−1.36x | R2 = 0.98 | |
| Shangqiu | 74.92% | 15.05% | 6.86% | 2.63% | 0.48% | 0.05% | y = 3.35*e−1.37x | R2 = 0.97 | |
| Zhumadian | 73.02% | 16.32% | 7.09% | 2.97% | 0.55% | 0.06% | y = 3.22*e−1.33x | R2 = 0.97 | |
| Xinyang | 73.78% | 15.86% | 6.79% | 2.84% | 0.70% | 0.03% | y = 3.67*e−1.39x | R2 = 0.94 | |
| Pingdingshan | 76.02% | 14.53% | 6.12% | 2.66% | 0.58% | 0.09% | y = 2.63*e−1.27x | R2 = 0.98 | |
| Kaifeng | 76.02% | 14.53% | 6.12% | 2.66% | 0.58% | 0.09% | y = 2.80*e−1.31x | R2 = 0.98 | |
| Anyang | 77.31% | 14.33% | 5.57% | 2.33% | 0.31% | 0.14% | y = 2.35*e−1.25x | R2 = 0.99 | |
| Jiaozuo | 78.01% | 14.18% | 5.66% | 1.73% | 0.40% | 0.03% | y = 3.93*e−1.48x | R2 = 0.97 | |
| Puyang | 76.08% | 14.66% | 6.55% | 2.05% | 0.63% | 0.03% | y = 3.77*e−1.43x | R2 = 0.95 | |
| Luohe | 75.22% | 15.06% | 6.62% | 2.54% | 0.45% | 0.11% | y = 2.57*e−1.26x | R2 = 0.99 | |
| Sanmenxia | 78.68% | 14.95% | 5.40% | 0.85% | 0.10% | 0.02% | y = 4.73*e−1.638x | R2 = 0.99 | |
| Hebi | 77.13% | 13.46% | 6.27% | 2.32% | 0.74% | 0.07% | y = 2.61*e−1.27x | R2 = 0.97 | |
| Jiyuan | 76.49% | 15.51% | 5.99% | 1.73% | 0.26% | 0.03% | y = 4.41*e−1.53x | R2 = 0.98 | |
| Rainfall Level | Light Rain, Moderate Rain, Heavy Rain | Rainstorm | Heavy Rainstorm | Extremely Heavy Rainstorm |
|---|---|---|---|---|
| Flood disaster level | Ordinary (level IV) | Larger (level III) | Great (level II) | Especially serious (level I) |
| Rainfall (mm/d) | p < 50 | 50 ≤ p < 100 | 100 ≤ p <200 | p ≥ 200 |
| Rainfall return period (a) | a ≤ 5 | 5 < a ≤ 20 | 20 < a ≤ 50 | a > 50 |
| Items | DMSP/OL DN Value | GDP (CNY 100 million) | Direct Loss per Unit Area (CNY 100 million/km2) | Inundation Area A (km2) | Direct Economic Loss (CNY 100 million) | Indirect Economic Loss (CNY 100 million) | Comprehensive Flood Losses (CNY 100 million) | Loss as a Percentage of GDP % | |
|---|---|---|---|---|---|---|---|---|---|
| Regions | |||||||||
| Zhengzhou | 21,420 | 12,003.00 | 0.52 | 829.82 | 431.79 | 86.36 | 518.15 | 0.05 | |
| Luoyang | 5355 | 5128.40 | 0.24 | 459.18 | 111.37 | 22.27 | 133.64 | 0.03 | |
| Nanyang | 4335 | 3925.90 | 0.19 | 437.96 | 81.31 | 16.26 | 97.58 | 0.02 | |
| Xuchang | 2805 | 3449.20 | 0.16 | 432.60 | 70.57 | 14.11 | 84.68 | 0.02 | |
| Zhouko | 2550 | 3267.20 | 0.15 | 382.01 | 59.02 | 11.80 | 70.83 | 0.02 | |
| Xinxiang | 4080 | 3014.50 | 0.14 | 334.84 | 47.74 | 9.55 | 57.28 | 0.02 | |
| Shangqiu | 4335 | 2925.30 | 0.14 | 312.55 | 43.24 | 8.65 | 51.89 | 0.02 | |
| Zhumadian | 3570 | 2859.30 | 0.14 | 308.91 | 41.77 | 8.35 | 50.13 | 0.02 | |
| Xinyang | 2040 | 2805.70 | 0.13 | 303.55 | 40.28 | 8.06 | 48.33 | 0.02 | |
| Pingdingshan | 4590 | 2455.80 | 0.12 | 268.18 | 31.15 | 6.23 | 37.38 | 0.02 | |
| Kaifeng | 2550 | 2371.80 | 0.11 | 266.03 | 29.84 | 5.97 | 35.81 | 0.02 | |
| Anyang | 2805 | 2300.50 | 0.11 | 262.39 | 28.55 | 5.71 | 34.26 | 0.01 | |
| Jiaozuo | 2805 | 2123.60 | 0.10 | 257.03 | 25.81 | 5.16 | 30.98 | 0.01 | |
| Puyang | 2295 | 1650.00 | 0.08 | 241.59 | 18.85 | 3.77 | 22.62 | 0.01 | |
| Luohe | 1530 | 1573.90 | 0.07 | 231.52 | 17.23 | 3.45 | 20.68 | 0.01 | |
| Sanmenxia | 1785 | 1450.70 | 0.07 | 182.21 | 12.50 | 2.50 | 15.00 | 0.01 | |
| Hebi | 1020 | 981.00 | 0.05 | 145.56 | 6.75 | 1.35 | 8.10 | 0.01 | |
| Jiyuan | 765 | 703.20 | 0.05 | 126.91 | 4.23 | 1.01 | 5.24 | 0.01 | |
Publisher’s Note: MDPI stays neutral with regard to jurisdictional claims in published maps and institutional affiliations. |
© 2022 by the authors. Licensee MDPI, Basel, Switzerland. This article is an open access article distributed under the terms and conditions of the Creative Commons Attribution (CC BY) license (https://creativecommons.org/licenses/by/4.0/).
Share and Cite
Duan, C.; Zheng, X.; Jin, L.; Chen, Y.; Li, R.; Yang, Y. Study on the Remote Sensing Spectral Method for Disaster Loss Inversion in Urban Flood Areas. Water 2022, 14, 2165. https://doi.org/10.3390/w14142165
Duan C, Zheng X, Jin L, Chen Y, Li R, Yang Y. Study on the Remote Sensing Spectral Method for Disaster Loss Inversion in Urban Flood Areas. Water. 2022; 14(14):2165. https://doi.org/10.3390/w14142165
Chicago/Turabian StyleDuan, Chenfei, Xiazhong Zheng, Lianghai Jin, Yun Chen, Rong Li, and Yingliu Yang. 2022. "Study on the Remote Sensing Spectral Method for Disaster Loss Inversion in Urban Flood Areas" Water 14, no. 14: 2165. https://doi.org/10.3390/w14142165