Detection of Spatial Shift in Flood Regime of the Kabul River Basin in Pakistan, Causes, Challenges, and Opportunities
Abstract
:1. Introduction
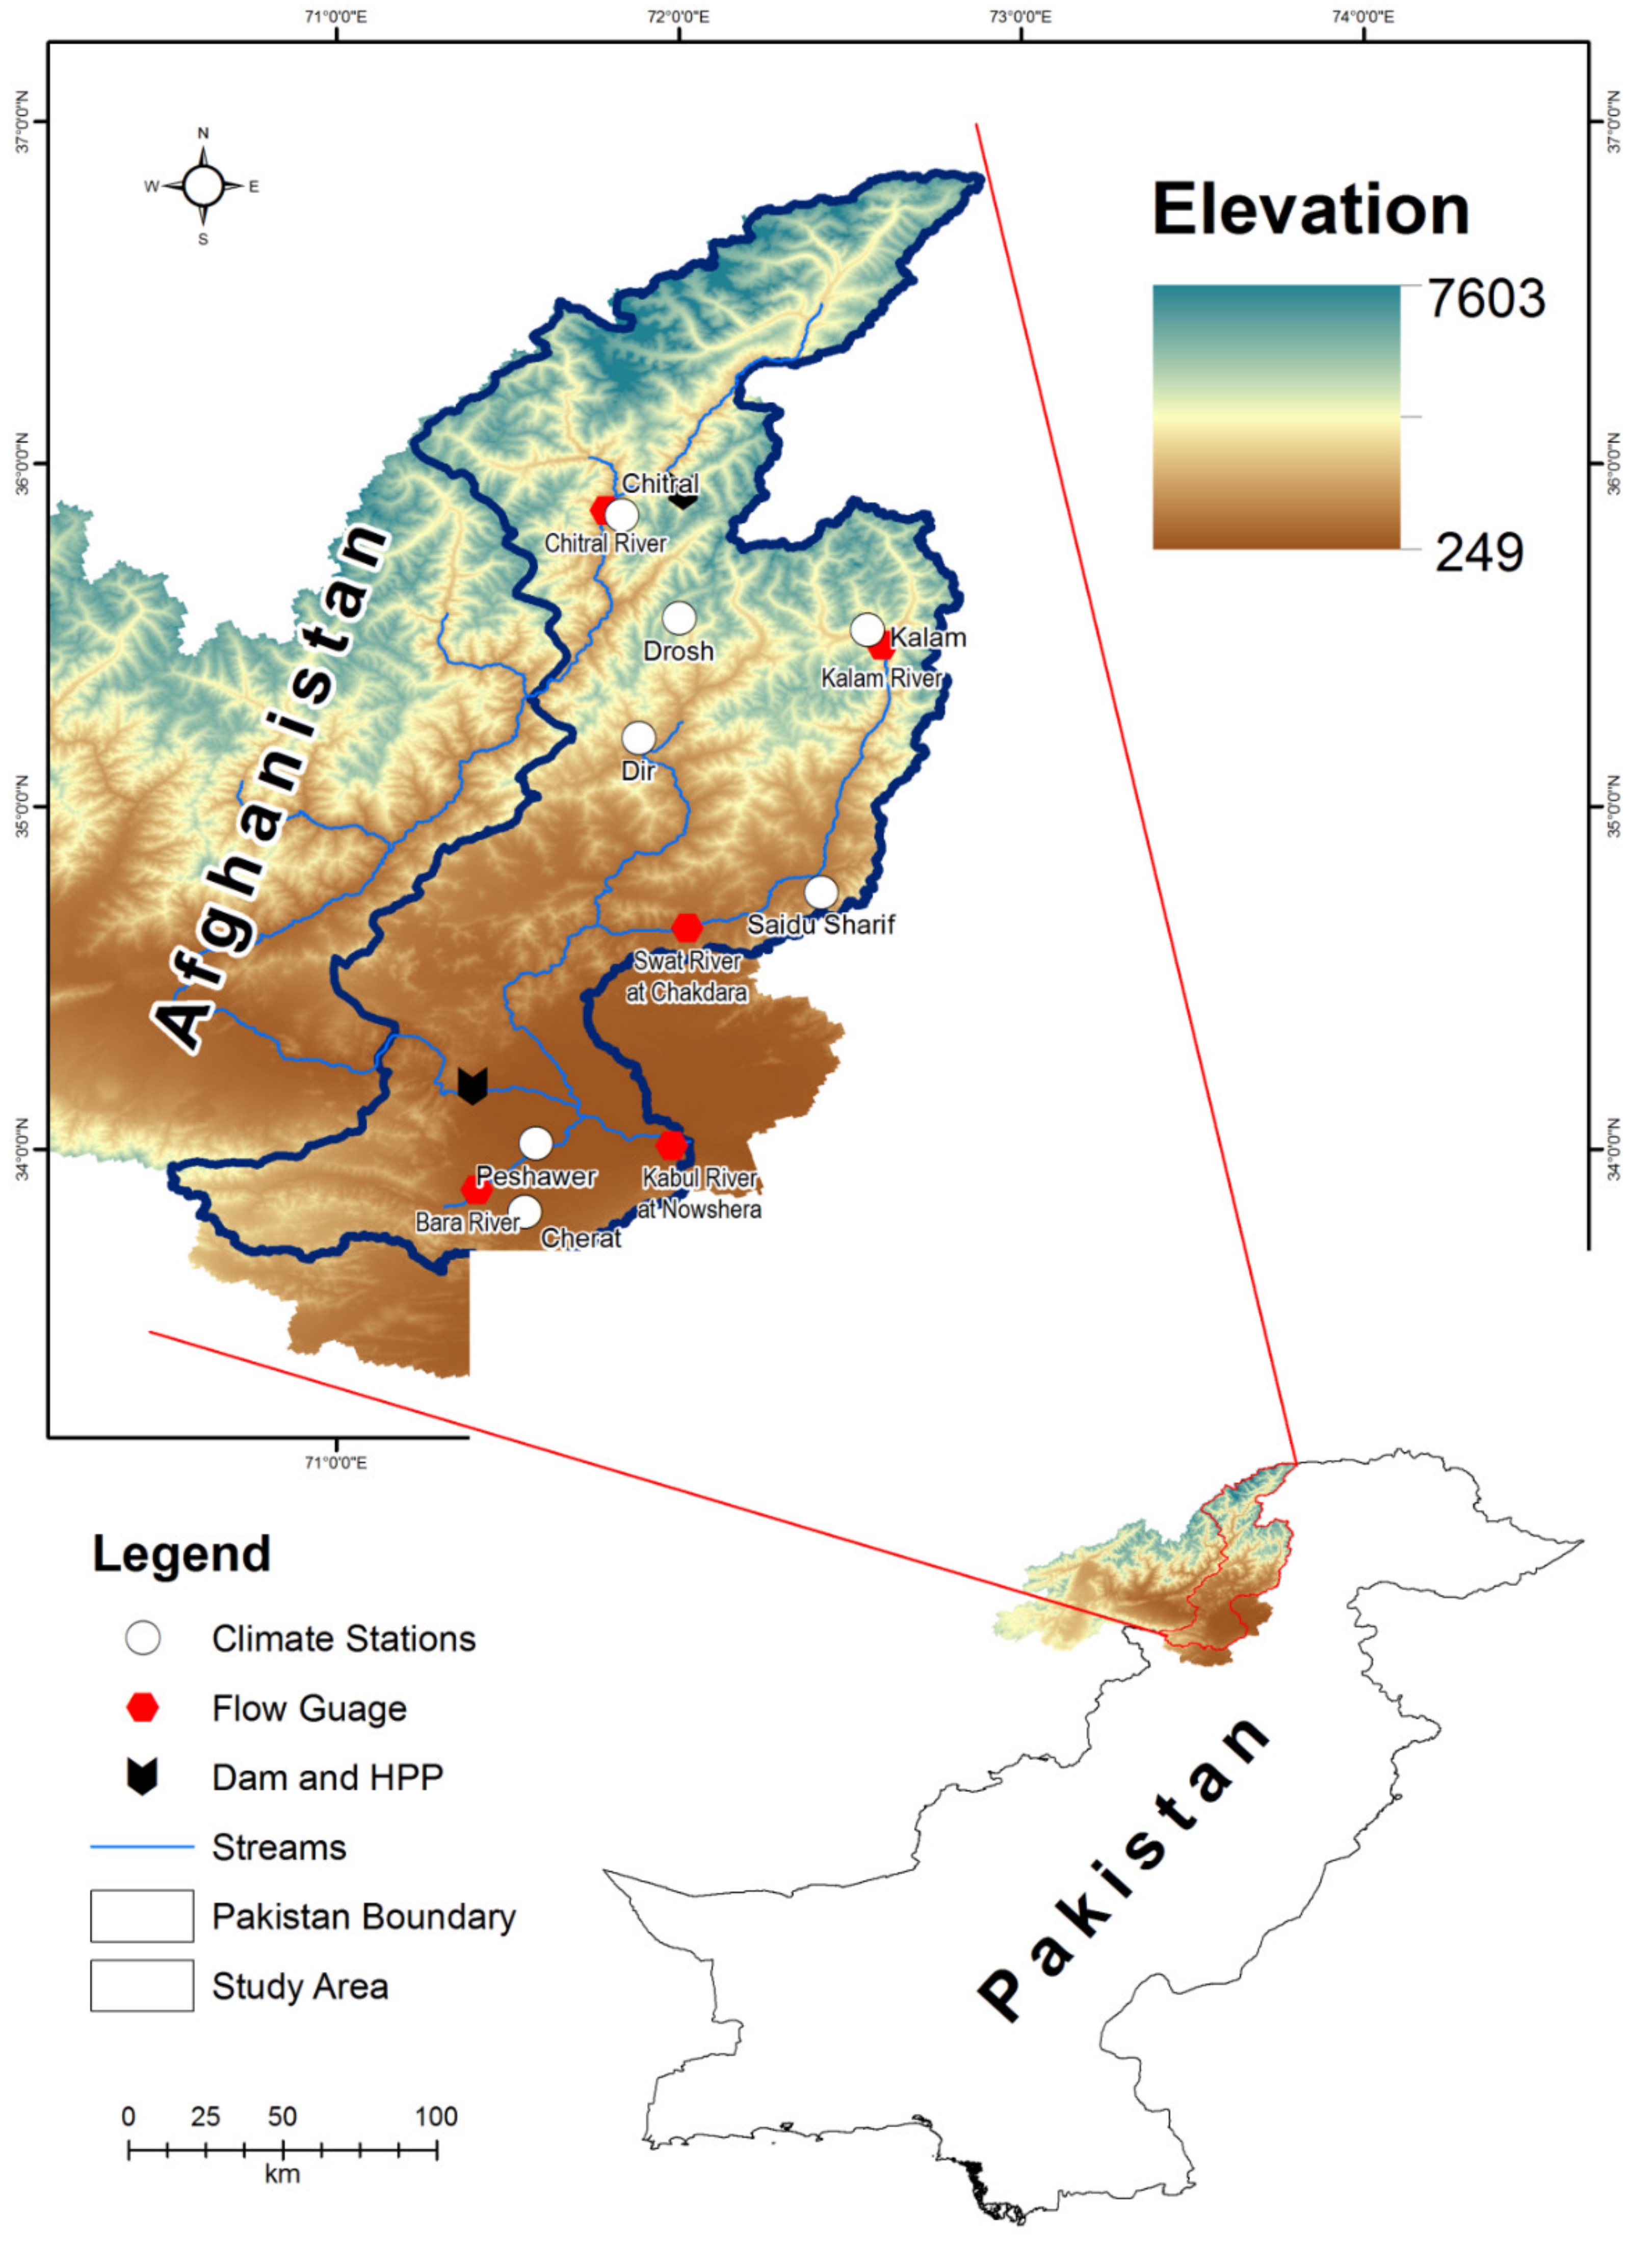
2. Study Area and Data Description
2.1. Study Area
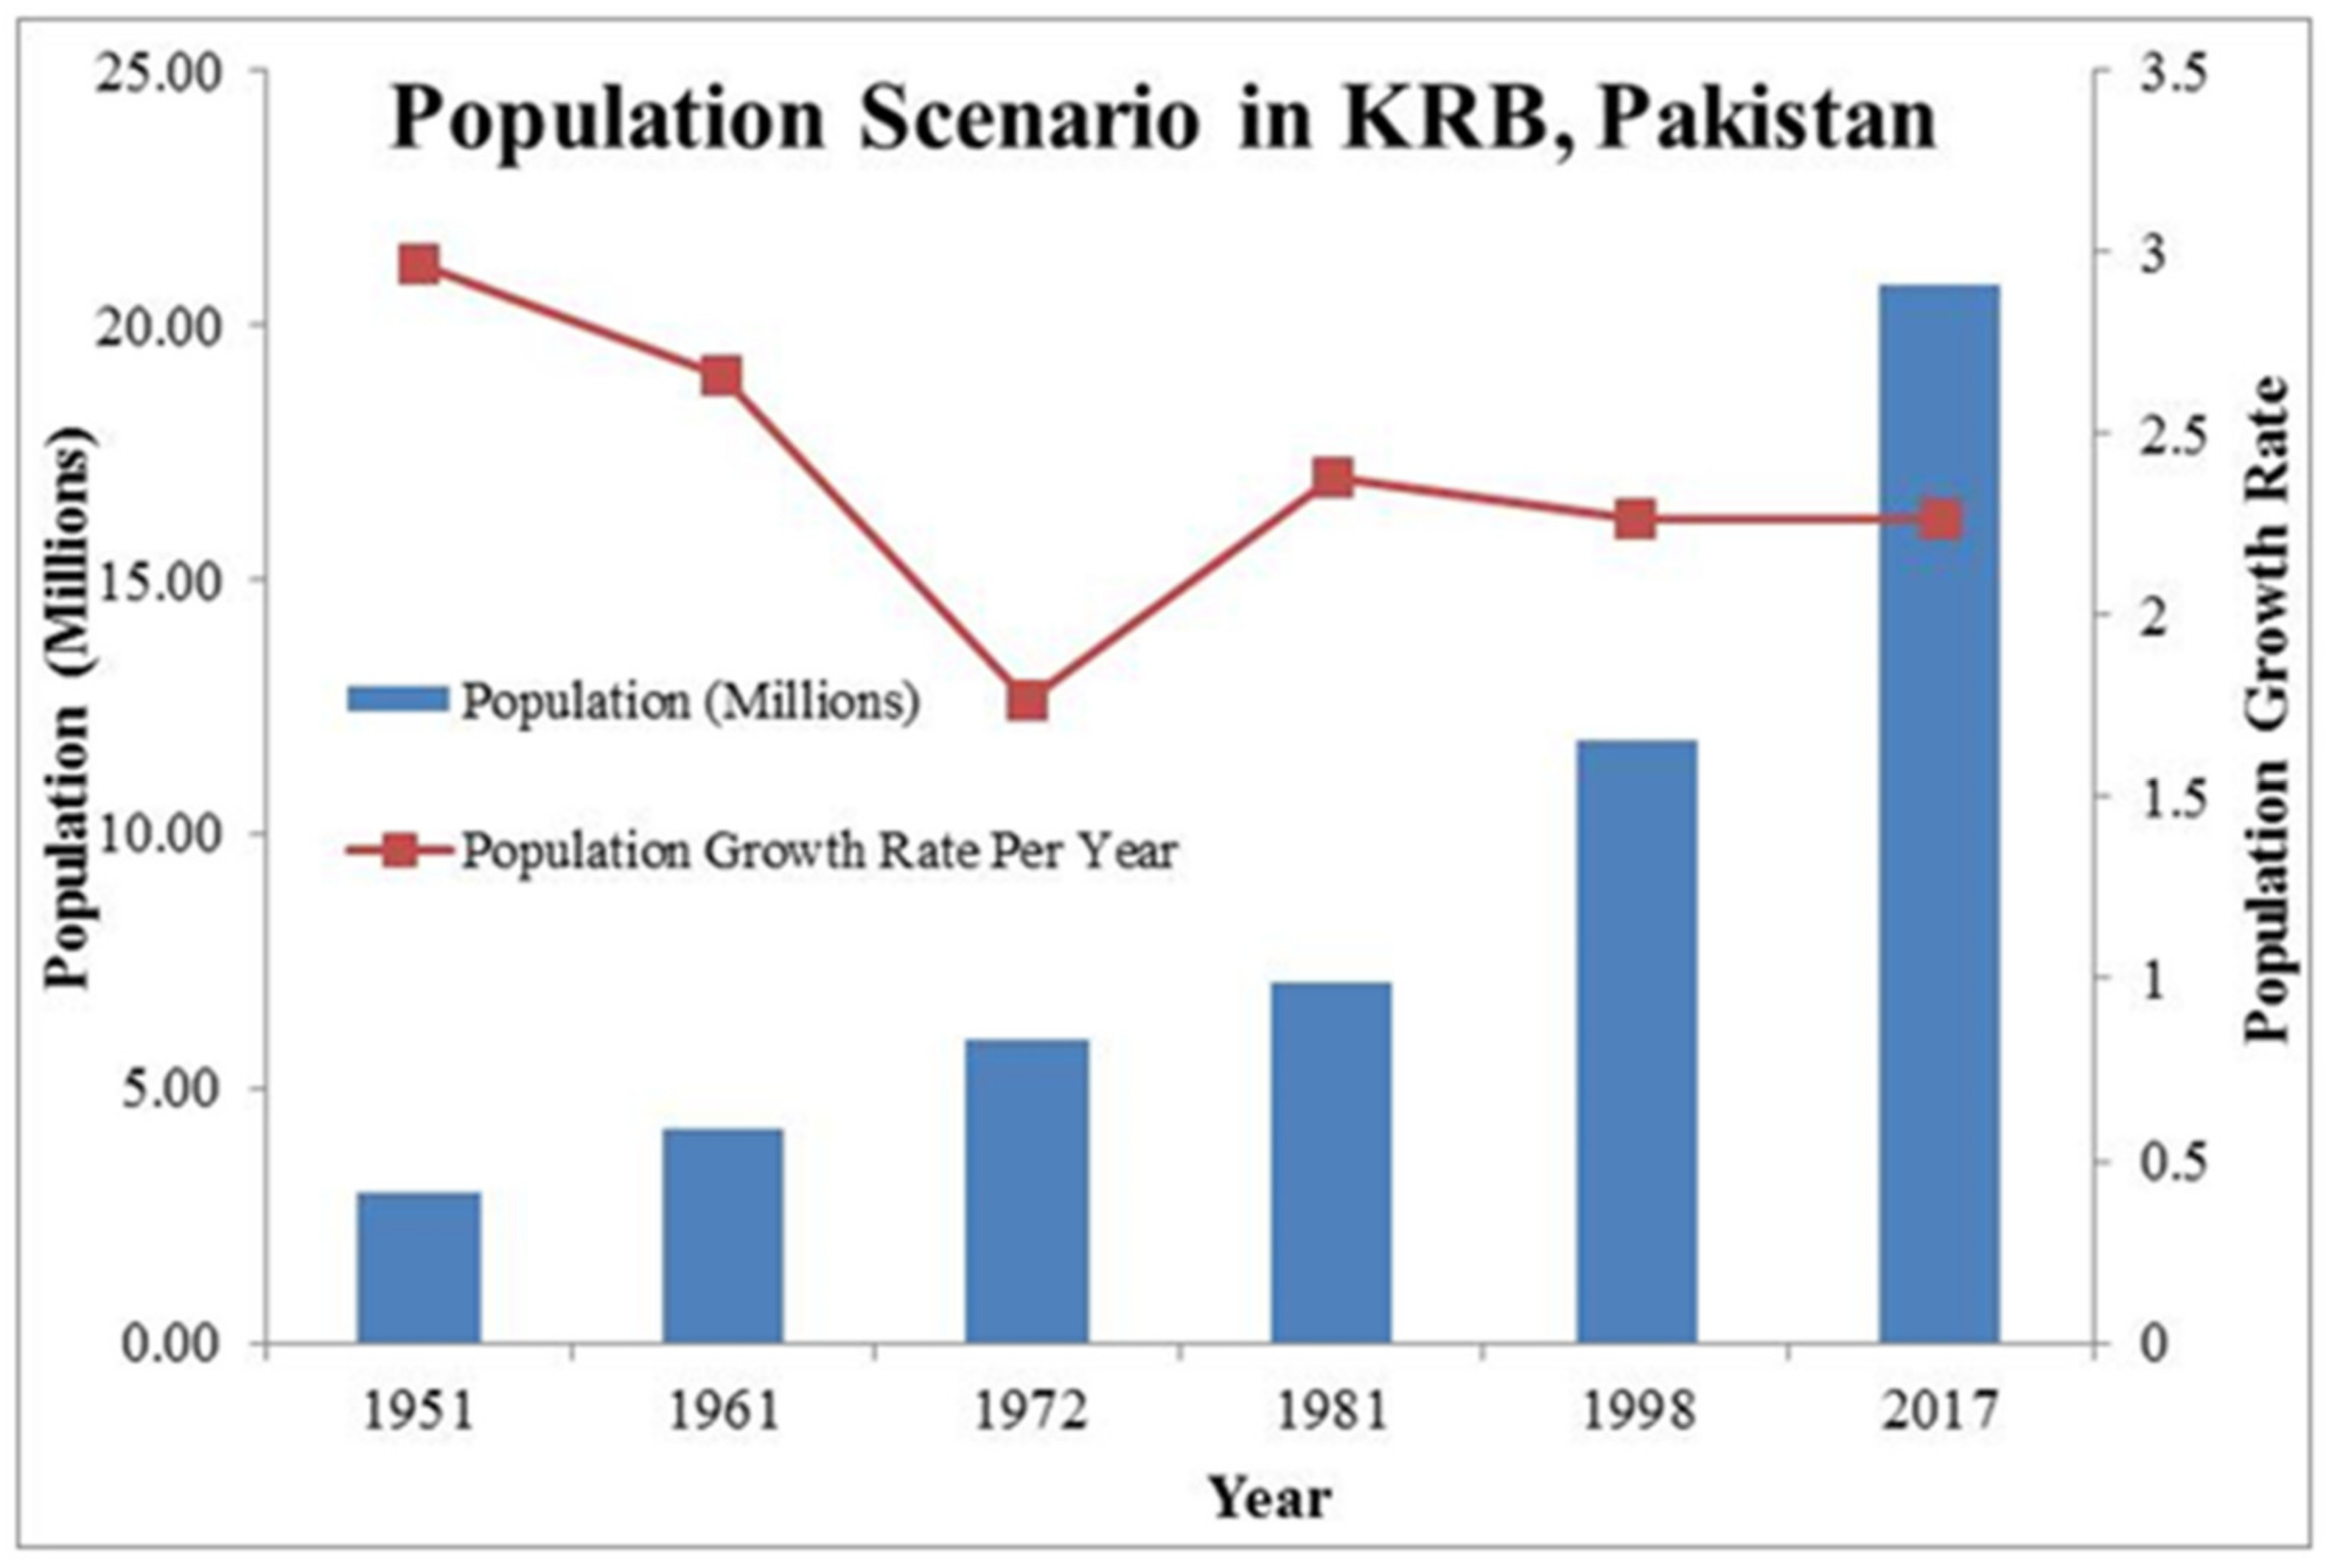
Population in the KRB
2.2. Data
2.2.1. Hydrological and Meteorological Data
2.2.2. Soil and Land Use Data
3. Methods
3.1. Preliminary Analysis
3.1.1. Analysis of Annual, Seasonal, and Peak over Threshold Flood Regime
Flood Indicators
Independence of Flood Peaks
Selection of Threshold for POT Series
Meteorological Indices
3.2. Trend Analysis
3.3. Change Point Detection for Flood Time Series
3.4. Flood Modeling with HEC–HMS
3.4.1. Basin Model
3.4.2. Meteorological Model
3.4.3. Calibration and Validation of HEC–HMS
3.4.4. Land Use Cover Change (LUCC) Impact on the Extreme Flood of 2010
3.4.5. Assessment of Model Performance
4. Results
4.1. Analysis of Floods at Annual, Seasonal, and Peak over Threshold
4.1.1. The Decision of Threshold for POT-Based Flood Series
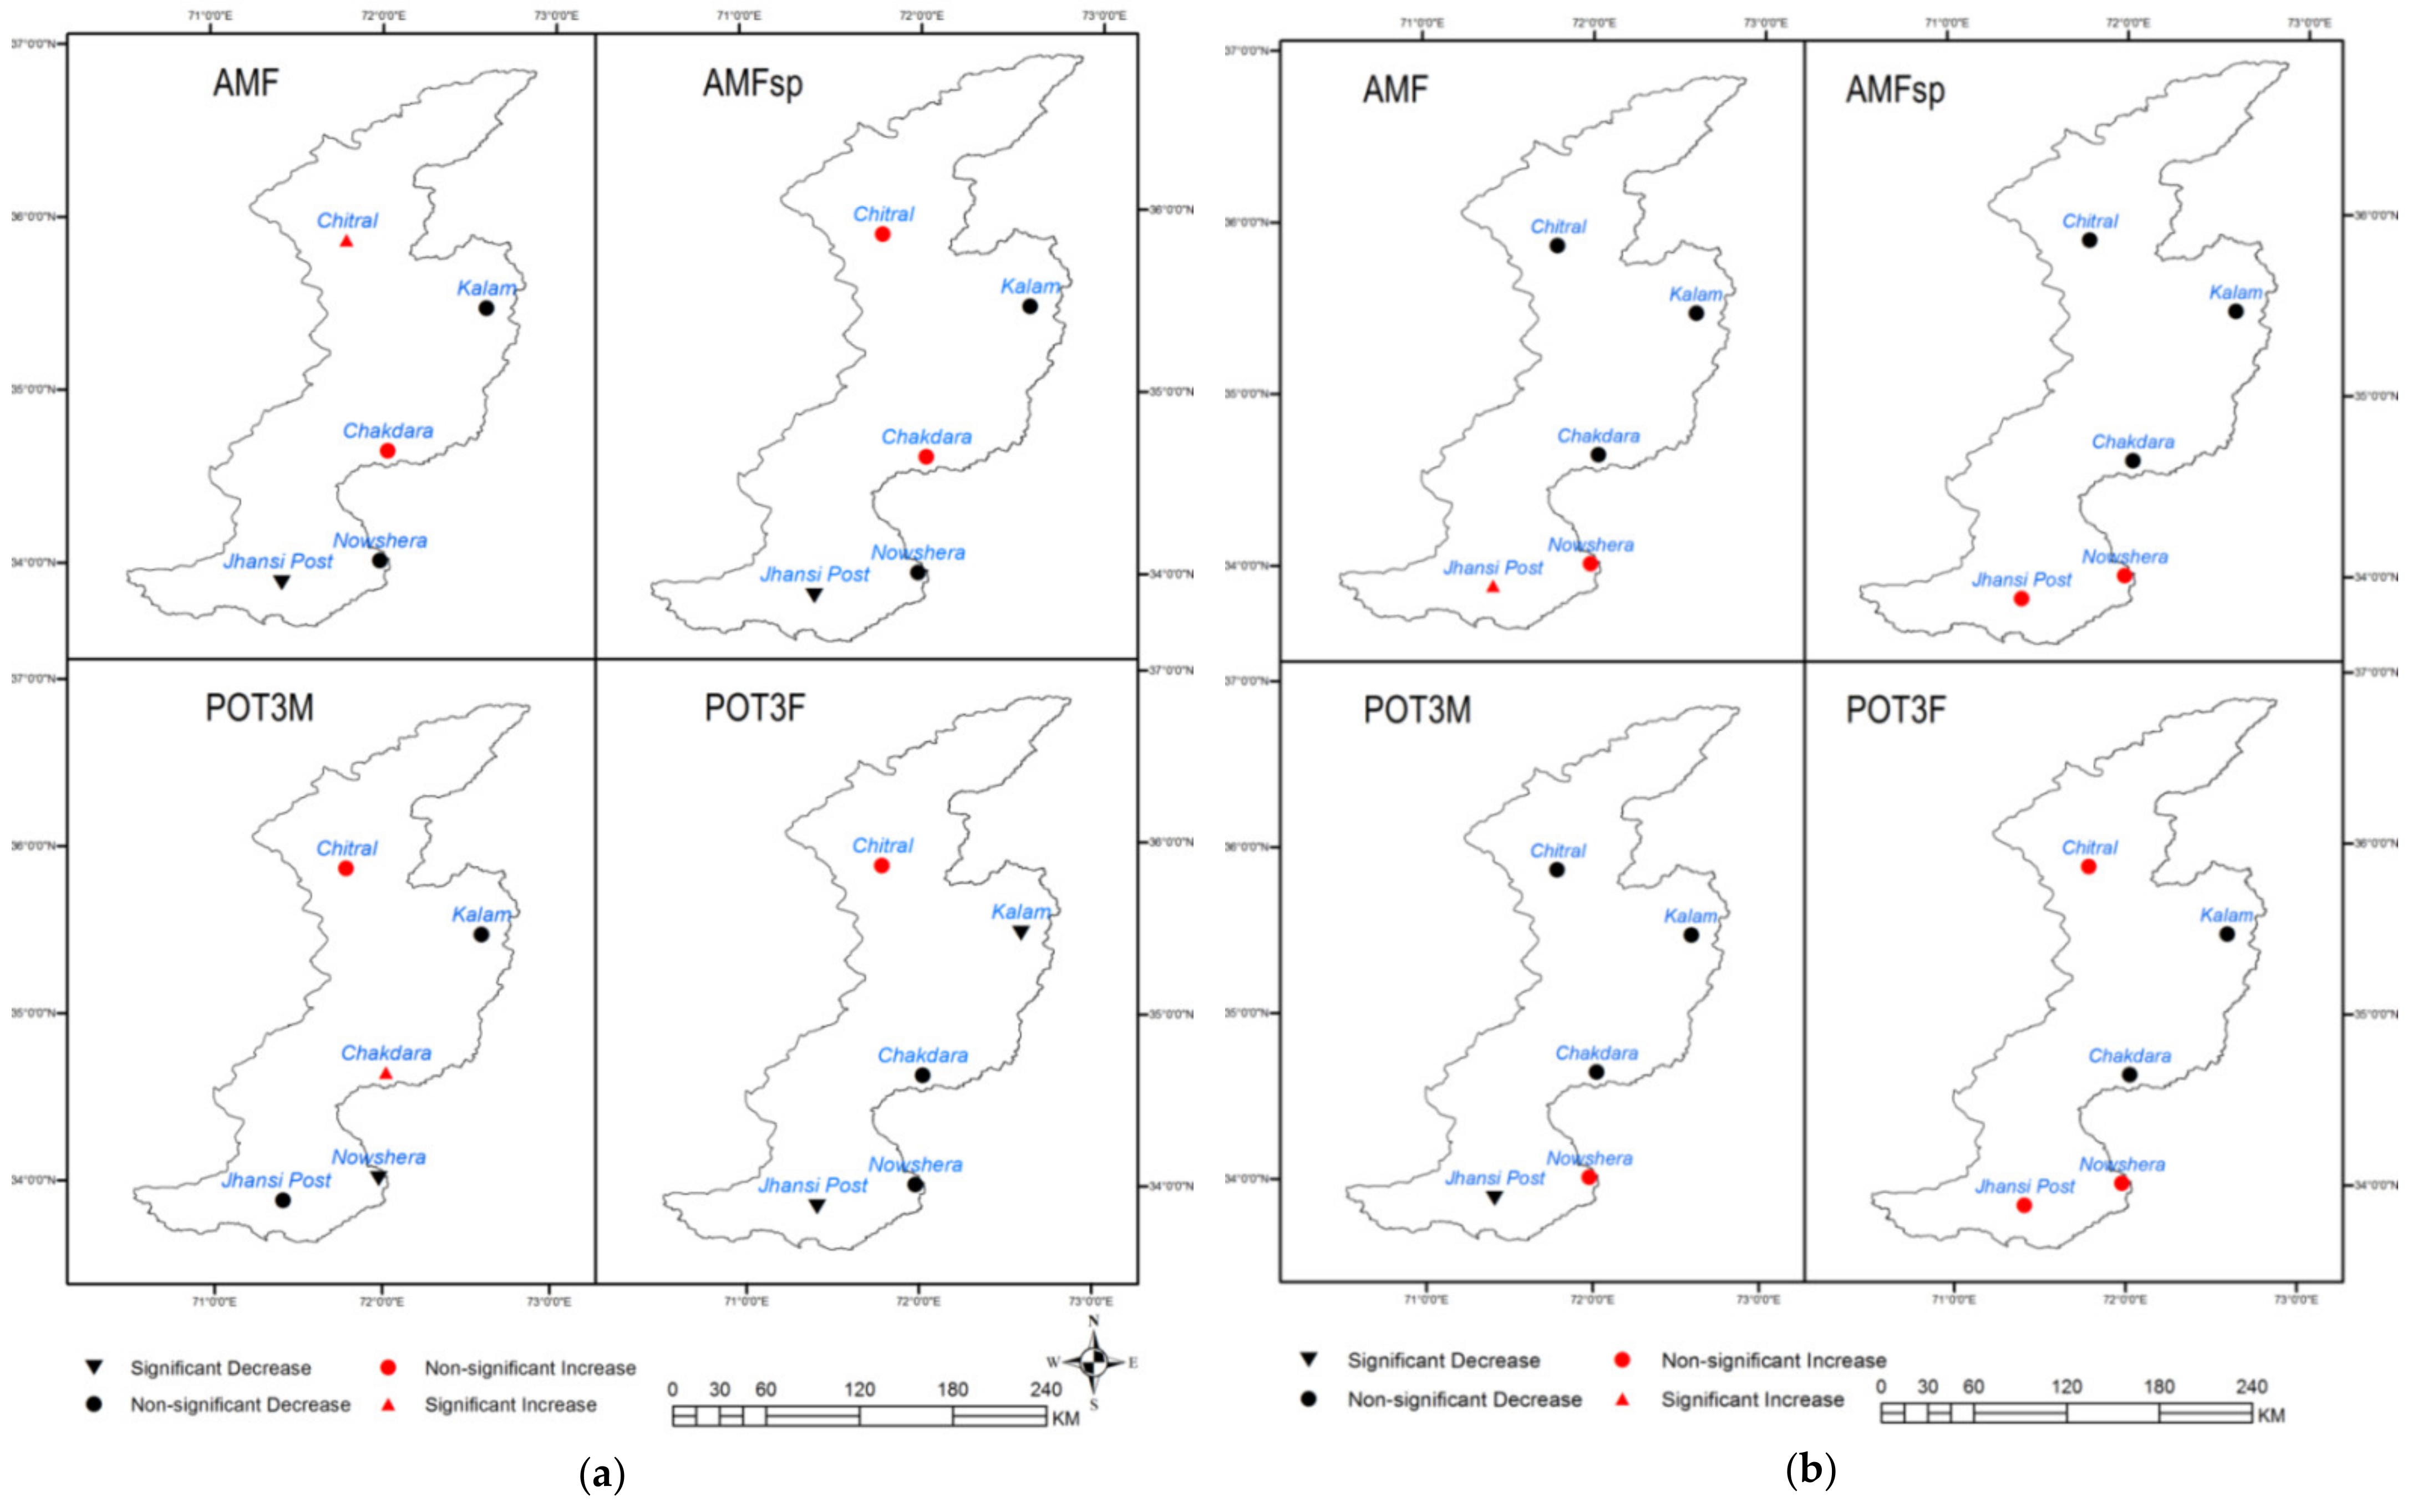
4.1.2. Spatial and Temporal Trends in Flood Regime of the KRB (1961/64-2015)
4.1.3. Change Point Analysis
4.1.4. Trends in Flood Regime Posterior to Change Point
4.2. Probable Causes of Floods in the KRB, Pakistan
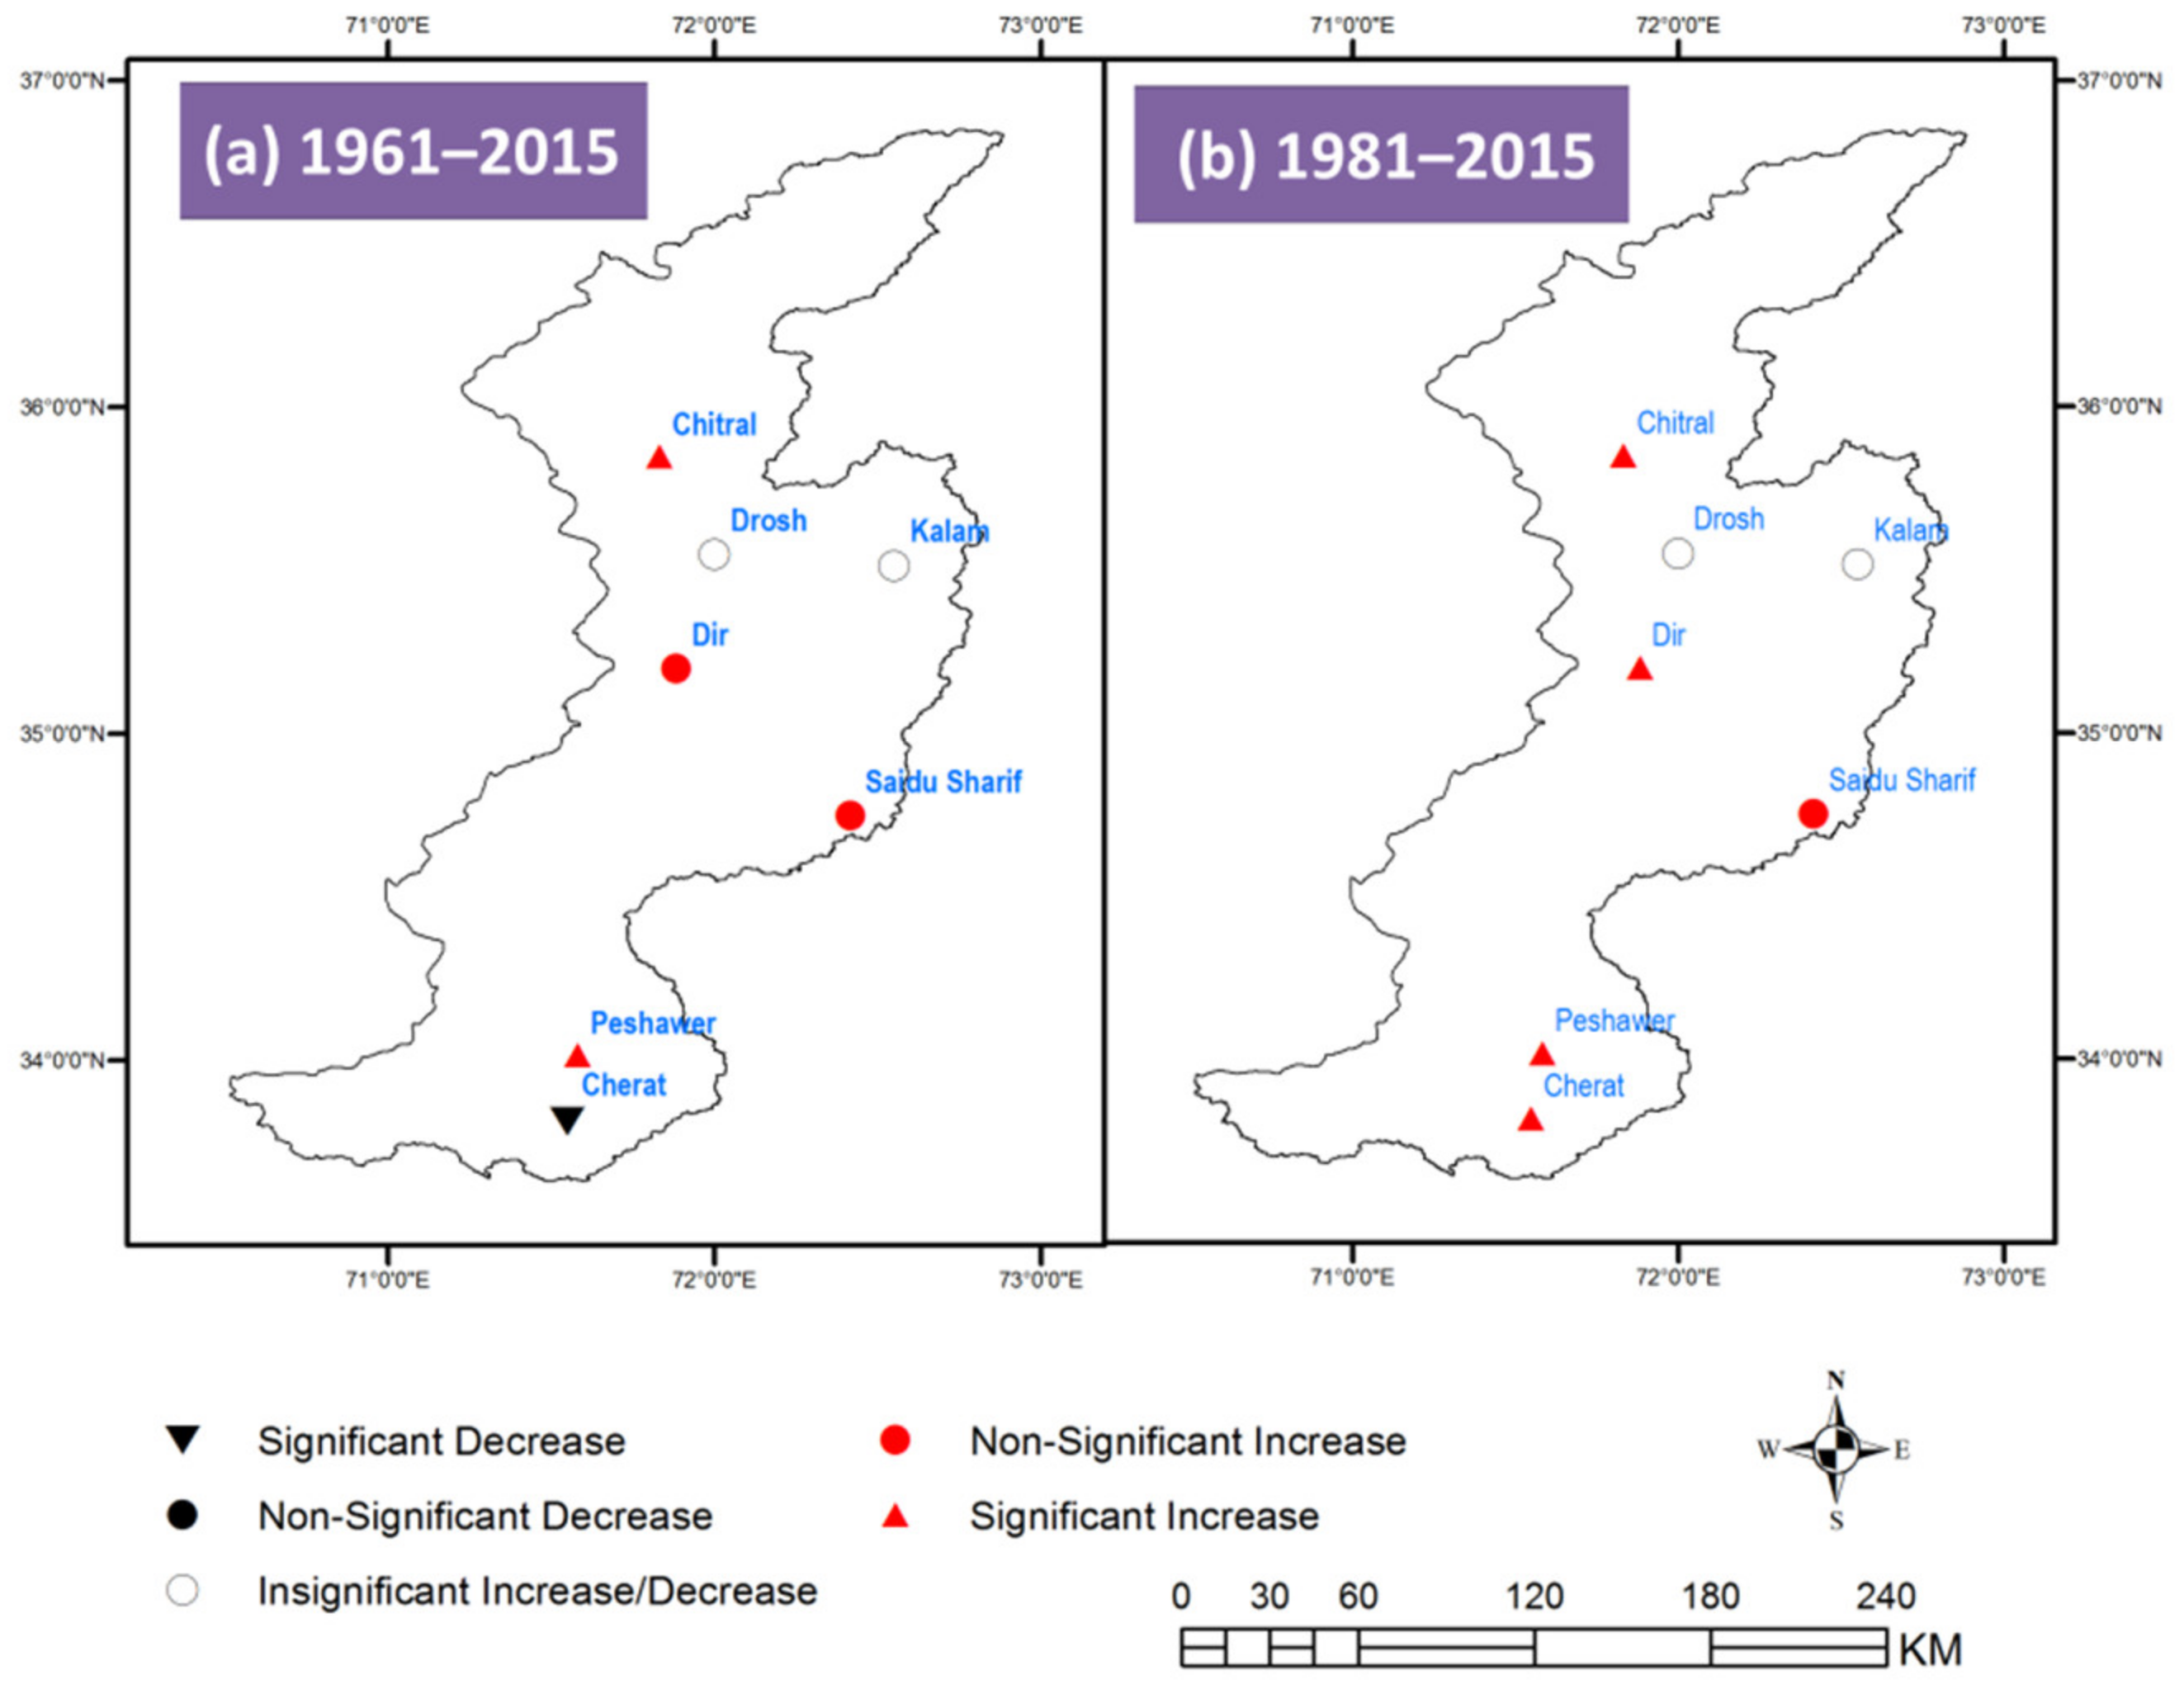
4.2.1. Spatial and Temporal Changes in Mean Annual Temperature across the KRB
4.2.2. Spatial and Temporal Trends in Extreme Precipitation Indices
4.2.3. Land Use Cover Changes in the KRB from 1992–2015
4.2.4. Calibration and Validation of HEC–HMS
4.2.5. Impact of LUCC on Flood Peak in Past and Future
5. Discussion
5.1. Analysis of Annual, Seasonal, POT Series, and Probable Causes of Floods in KRB
5.1.1. Analysis Posterior to Change Point in Flood Regime
5.1.2. Impact of LUCC on Extreme Flood of 2010 in Past and Future
6. Conclusions
Recommendations, Challenges, and Opportunities
Supplementary Materials
Author Contributions
Funding
Institutional Review Board Statement
Informed Consent Statement
Data Availability Statement
Acknowledgments
Conflicts of Interest
References
- Stocker, T.F.; Qin, D.; Plattner, G.-K.; Tignor, M.; Allen, S.K.; Boschung, J.; Nauels, A.; Xia, Y.; Bex, V.; Midgley, P.M. Climate Change 2013: The Physical Science Basis; Cambridge University Press: Cambridge, UK, 2013. [Google Scholar]
- Ziegler, A.D.; Sheffield, J.; Maurer, E.P.; Nijssen, B.; Wood, E.F.; Lettenmaier, D.P. Detection of intensification in global-and continental-scale hydrological cycles: Temporal scale of evaluation. J. Clim. 2003, 16, 535–547. [Google Scholar]
- Zhang, Q.; Li, J.; Singh, V.P.; Xiao, M. Spatio-temporal relations between temperature and precipitation regimes: Implications for temperature-induced changes in the hydrological cycle. Glob. Planet. Chang. 2013, 111, 57–76. [Google Scholar]
- Zhang, Q.; Xiao, M.; Singh, V.P.; Chen, X. Copula-based risk evaluation of droughts across the Pearl River basin, China. Theor. Appl. Climatol. 2013, 111, 119–131. [Google Scholar]
- Apurv, T.; Mehrotra, R.; Sharma, A.; Goyal, M.K.; Dutta, S. Impact of climate change on floods in the Brahmaputra basin using CMIP5 decadal predictions. J. Hydrol. 2015, 527, 281–291. [Google Scholar]
- Mirza, M.M.Q. Global warming and changes in the probability of occurrence of floods in Bangladesh and implications. Glob. Environ. Chang. 2002, 12, 127–138. [Google Scholar]
- Li, J.; Zhang, Q.; Chen, Y.D.; Singh, V.P. Future joint probability behaviors of precipitation extremes across China: Spatiotemporal patterns and implications for flood and drought hazards. Glob. Planet. Chang. 2015, 124, 107–122. [Google Scholar]
- Zhang, Q.; Sun, P.; Singh, V.P.; Chen, X. Spatial-temporal precipitation changes (1956–2000) and their implications for agriculture in China. Glob. Planet. Chang. 2012, 82, 86–95. [Google Scholar]
- Allan, R.P.; Soden, B.J. Atmospheric warming and the amplification of precipitation extremes. Science 2008, 321, 1481–1484. [Google Scholar]
- Beniston, M.; Stephenson, D.B. Extreme climatic events and their evolution under changing climatic conditions. Glob. Planet. Chang. 2004, 44, 1–9. [Google Scholar]
- Zolina, O.; Kapala, A.; Simmer, C.; Gulev, S.K. Analysis of extreme precipitation over Europe from different reanalyses: A comparative assessment. Glob. Planet. Chang. 2004, 44, 129–161. [Google Scholar]
- Barros, V.R.; Field, C.B. Climate Change 2014: Impacts, Adaptation, and Vulnerability. Part B: Regional Aspects; Cambridge University Press: Cambridge, UK, 2014. [Google Scholar]
- Eckstein, D.; Künzel, V.; Schäfer, L.; Winges, M. Global Climate Risk Index 2020; Germanwatch e.V.: Bonn, Germany, 2019. [Google Scholar]
- Najibi, N.; Devineni, N. Recent trends in the frequency and duration of global floods. Earth Syst. Dyn. 2018, 9, 757–783. [Google Scholar]
- Lin, L.; Sherman, P.D. Cleaning data the Chauvenet way. In Proceedings of the SouthEast SAS Users Group, SESUG Proceedings, Paper SA11, Hilton Head Island, SC, USA, 4–6 November 2007. [Google Scholar]
- National Disaster Management Authority, Pakistan. NDMA, Annual Report 2011. Available online: http://www.ndma.gov.pk/publications/AR2011.pdf (accessed on 13 July 2019).
- Annual Reports (2018); Federal Flood Commission, Water and Power Development Authority: Lahore, Pakistan, 2018.
- Anjum, M.N.; Ding, Y.; Shangguan, D.; Ijaz, M.W.; Zhang, S. Evaluation of high-resolution satellite-based real-time and post-real-time precipitation estimates during 2010 extreme flood event in Swat River Basin, Hindukush region. Adv. Meteorol. 2016, 2016, 2604980. [Google Scholar]
- Tariq, M.A.U.R.; Van de Giesen, N. Floods and flood management in Pakistan. Phys. Chem. EarthParts A/B/C 2012, 47, 11–20. [Google Scholar]
- National Disaster Management Authority, Pakistan. Annual Reports 2010. 2010; p. 13. Available online: http://www.ndma.gov.pk/publications/AR2010.pdf (accessed on 13 July 2019).
- National Disaster Management Authority, Pakistan. Annual Reports 2012–2018. Available online: http://www.ndma.gov.pk/publications.php (accessed on 13 July 2019).
- Ahmad, I.; Tang, D.; Wang, T.; Wang, M.; Wagan, B. Precipitation trends over time using Mann-Kendall and spearman’s rho tests in swat river basin, Pakistan. Adv. Meteorol. 2015, 2015, 431860. [Google Scholar]
- Ahmad, I.; Zhang, F.; Liu, J.; Anjum, M.N.; Zaman, M.; Tayyab, M.; Waseem, M.; Farid, H.U. A linear bi-level multi-objective program for optimal allocation of water resources. PLoS ONE 2018, 13, e0192294. [Google Scholar]
- Ahmad, S.; Israr, M.; Liu, S.; Hayat, H.; Gul, J.; Wajid, S.; Ashraf, M.; Baig, S.U.; Tahir, A.A. Spatio-temporal trends in snow extent and their linkage to hydro-climatological and topographical factors in the Chitral River Basin (Hindukush, Pakistan). Geocarto Int. 2018, 35, 711–734. [Google Scholar]
- Khattak, M.; Anwar, F.; Sheraz, K.; Saeed, T.; Sharif, M.; Ahmed, A. Floodplain Mapping Using HEC-RAS and ArcGIS: A Case Study of Kabul River. Arab. J. Sci. Eng. 2016, 41, 1375–1390. [Google Scholar]
- Bahadar, I.; Shafique, M.; Khan, T.; Tabassum, I.; Ali, M.Z. Flood hazard assessment using hydro-dynamic model and GIS/RS tools: A case study of Babuzai-Kabal tehsil Swat Basin, Pakistan. J. Himal. Earth Sci. 2015, 48, 129–138. [Google Scholar]
- Aziz, A. Rainfall-Runoff Modeling of the Trans-Boundary Kabul River Basin Using Integrated Flood Analysis System (IFAS). Pak. J. Meteorol. 2014, 10, 75–81. [Google Scholar]
- Sayama, T.; Ozawa, G.; Kawakami, T.; Nabesaka, S.; Fukami, K. Rainfall–runoff–inundation analysis of the 2010 Pakistan flood in the Kabul River basin. Hydrol. Sci. J. 2012, 57, 298–312. [Google Scholar]
- Mehmood, A.; Jia, S.; Mahmood, R.; Yan, J.; Ahsan, M. Non-stationary Bayesian modeling of annual maximum floods in a changing environment and implications for flood management in the Kabul River Basin, Pakistan. Water 2019, 11, 1246. [Google Scholar]
- Khan, A.N. Analysis of flood causes and associated socio-economic damages in the Hindukush region. Nat. Hazards 2011, 59, 1239. [Google Scholar]
- Khan, A.N. Analysis of 2010-flood causes, nature and magnitude in the Khyber Pakhtunkhwa, Pakistan. Nat. Hazards 2013, 66, 887–904. [Google Scholar]
- Ashraf, A.; Naz, R.; Roohi, R. Glacial lake outburst flood hazards in Hindukush, Karakoram and Himalayan Ranges of Pakistan: Implications and risk analysis. Geomat. Nat. Hazards Risk 2012, 3, 113–132. [Google Scholar]
- Mahmood, S.; Mayo, S.M. Exploring underlying causes and assessing damages of 2010 flash flood in the upper zone of Panjkora River. Nat. Hazards 2016, 83, 1213–1227. [Google Scholar]
- Ullah, S.; Farooq, M.; Sarwar, T.; Tareen, M.J.; Wahid, M.A. Flood modeling and simulations using hydrodynamic model and ASTER DEM—A case study of Kalpani River. Arab. J. Geosci. 2016, 9, 439. [Google Scholar]
- Mack, T.J.; Chornack, M.P.; Taher, M.R. Groundwater-level trends and implications for sustainable water use in the Kabul Basin, Afghanistan. Environ. Syst. Decis. 2013, 33, 457–467. [Google Scholar]
- Lashkaripour, G.R.; Hussaini, S. Water resource management in Kabul river basin, eastern Afghanistan. Environmentalist 2008, 28, 253–260. [Google Scholar]
- School of Geography and Environmental Science, U.o.S.; Department of Geography and Geosciences, U.o.L.D.d.G., Universite de Namur; Center for International Earth Science Information Network (CIESIN), C.U. Global High Resolution Population Denominators Project Funded by The Bill and Melinda Gates; Foundation (OPP1134076); WorldPop: Southampton, UK, 2018; Volume 2017. [Google Scholar]
- Anjum, M.N.; Ding, Y.; Shangguan, D.; Tahir, A.A.; Iqbal, M.; Adnan, M. Comparison of two successive versions 6 and 7 of TMPA satellite precipitation products with rain gauge data over Swat Watershed, Hindukush Mountains, Pakistan. Atmos. Sci. Lett. 2016, 17, 270–279. [Google Scholar]
- Defourny, P.; Kirches, G.; Brockmann, C.; Boettcher, M.; Peters, M.; Bontemps, S.; Lamarche, C.; Schlerf, M.; Santoro, M. Land Cover CCI; Product User Guide Version: Paris, France, 2012; Volume 2. [Google Scholar]
- Kirches, G.; Brockmann, C.; Boettcher, M.; Peters, M.; Bontemps, S.; Lamarche, C.; Schlerf, M.; Santoro, M.; Defourny, P. Land Cover Cci-Product User Guide-Version 2; ESA Public Document CCI-LC-PUG: Paris, France, 2014. [Google Scholar]
- Defourny, P.; Schouten, L.; Bartalev, S.; Bontemps, S.; Cacetta, P.; De Wit, A.; Di Bella, C.; Gérard, B.; Giri, C.; Gond, V. Accuracy Assessment of a 300 m Global Land Cover Map: The GlobCover Experience. 2009; Available online: https://library.wur.nl/WebQuery/wurpubs/fulltext/14725 (accessed on 13 July 2019).
- Zhang, Q.; Gu, X.; Singh, V.P.; Sun, P.; Chen, X.; Kong, D. Magnitude, frequency and timing of floods in the Tarim River basin, China: Changes, causes and implications. Glob. Planet. Chang. 2016, 139, 44–55. [Google Scholar]
- Lang, M.; Ouarda, T.; Bobée, B. Towards operational guidelines for over-threshold modeling. J. Hydrol. 1999, 225, 103–117. [Google Scholar]
- Zhang, X.; Alexander, L.; Hegerl, G.C.; Jones, P.; Tank, A.K.; Peterson, T.C.; Trewin, B.; Zwiers, F.W. Indices for monitoring changes in extremes based on daily temperature and precipitation data. Wiley Interdiscip. Rev. Clim. Chang. 2011, 2, 851–870. [Google Scholar]
- Karl, T.R.; Nicholls, N.; Ghazi, A. Clivar/GCOS/WMO workshop on indices and indicators for climate extremes workshop summary. In Weather and Climate Extremes; Springer: Berlin, Germany, 1999; pp. 3–7. [Google Scholar]
- Keggenhoff, I.; Elizbarashvili, M.; Amiri-Farahani, A.; King, L. Trends in daily temperature and precipitation extremes over Georgia, 1971–2010. Weather Clim. Extrem. 2014, 4, 75–85. [Google Scholar]
- Hu, Z.; Wang, L.; Wang, Z.; Hong, Y.; Zheng, H. Quantitative assessment of climate and human impacts on surface water resources in a typical semi-arid watershed in the middle reaches of the Yellow River from 1985 to 2006. Int. J. Clim. 2015, 35, 97–113. [Google Scholar] [CrossRef]
- Feng, G.; Cobb, S.; Abdo, Z.; Fisher, D.K.; Ouyang, Y.; Adeli, A.; Jenkins, J.N. Trend analysis and forecast of precipitation, reference evapotranspiration, and rainfall deficit in the Blackland Prairie of Eastern Mississippi. J. Appl. Meteorol. Clim. 2016, 55, 1425–1439. [Google Scholar] [CrossRef]
- Mahmood, R.; Jia, S. Spatial and temporal hydro-climatic trends in the transboundary Jhelum River basin. J. Water Clim. Chang. 2017, 8, 423–440. [Google Scholar]
- Mann, H.B. Nonparametric tests against trend. Econom. J. Econom. Soc. 1945, 13, 245–259. [Google Scholar]
- Kendall, M.G.; Gibbons, J. Rank Correlation Methods, 1970; Griffin: London, UK, 1975. [Google Scholar]
- Sen, P.K. Estimates of the regression coefficient based on Kendall’s Tau. J. Am. Stat. Assoc. 1968, 63, 1379–1389. [Google Scholar] [CrossRef]
- Pettitt, A. A non-parametric approach to the change-point problem. J. R. Stat. Soc. Ser. C 1979, 28, 126–135. [Google Scholar]
- Buishand, T.A. Some methods for testing the homogeneity of rainfall records. J. Hydrol. 1982, 58, 11–27. [Google Scholar]
- Wijngaard, J.; Klein Tank, A.; Können, G. Homogeneity of 20th century European daily temperature and precipitation series. Int. J. Climatol. A J. R. Meteorol. Soc. 2003, 23, 679–692. [Google Scholar]
- Štěpánek, P.; Zahradníček, P.; Skalák, P. Data quality control and homogenization of air temperature and precipitation series in the area of the Czech Republic in the period 1961–2007. Adv. Sci. Res. 2009, 3, 23–26. [Google Scholar]
- Vezzoli, R.; Pecora, S.; Zenoni, E.; Tonelli, F. Data analysis to detect inhomogeneity, change points, trends in observations: An application to Po river discharge extremes. CMCC Res. Pap. 2012. [Google Scholar] [CrossRef]
- Silvestro, F.; Gabellani, S.; Delogu, F.; Rudari, R.; Boni, G. Exploiting remote sensing land surface temperature in distributed hydrological modelling: The example of the Continuum model. Hydrol. Earth Syst. Sci. 2013, 17, 39. [Google Scholar]
- Silvestro, F.; Rebora, N.; Giannoni, F.; Cavallo, A.; Ferraris, L. The flash flood of the Bisagno Creek on 9th October 2014: An “unfortunate” combination of spatial and temporal scales. J. Hydrol. 2016, 541, 50–62. [Google Scholar]
- Hernandez, M.; Miller, S.N.; Goodrich, D.C.; Goff, B.F.; Kepner, W.G.; Edmonds, C.M.; Jones, K.B. Modeling runoff response to land cover and rainfall spatial variability in semi-arid watersheds. In Monitoring Ecological Condition in the Western United States; Springer: Berlin, Germany, 2000; pp. 285–298. [Google Scholar]
- Knebl, M.; Yang, Z.-L.; Hutchison, K.; Maidment, D. Regional scale flood modeling using NEXRAD rainfall, GIS, and HEC-HMS/RAS: A case study for the San Antonio River Basin Summer 2002 storm event. J. Environ. Manag. 2005, 75, 325–336. [Google Scholar]
- Ali, M.; Khan, S.J.; Aslam, I.; Khan, Z. Simulation of the impacts of land-use change on surface runoff of Lai Nullah Basin in Islamabad, Pakistan. Landsc. Urban Plan. 2011, 102, 271–279. [Google Scholar]
- Chu, X.; Steinman, A. Event and continuous hydrologic modeling with HEC-HMS. J. Irrig. Drain. Eng. 2009, 135, 119–124. [Google Scholar]
- Ramly, S.; Tahir, W. Application of HEC-GeoHMS and HEC-HMS as rainfall–runoff model for flood simulation. In ISFRAM 2015; Springer: Singapore, 2016; pp. 181–192. [Google Scholar]
- Merwade, V. Creating SCS Curve Number Grid Using HEC-GeoHMS; Purdue University: West Lafayette, IN, USA, 2012. [Google Scholar]
- Fiedler, F.R. Simple, practical method for determining station weights using Thiessen polygons and isohyetal maps. J. Hydrol. Eng. 2003, 8, 219–221. [Google Scholar]
- Boughton, W. A review of the USDA SCS curve number method. Soil Res. 1989, 27, 511–523. [Google Scholar]
- Rabunal, J.; Puertas, J.; Suarez, J.; Rivero, D. Determination of the unit hydrograph of a typical urban basin using genetic programming and artificial neural networks. Hydrol. Process. Int. J. 2007, 21, 476–485. [Google Scholar]
- De Silva, M.; Weerakoon, S.; Herath, S. Modeling of event and continuous flow hydrographs with HEC–HMS: Case study in the Kelani River Basin, Sri Lanka. J. Hydrol. Eng. 2014, 19, 800–806. [Google Scholar]
- Gill, M.A. Flood routing by the Muskingum method. J. Hydrol. 1978, 36, 353–363. [Google Scholar]
- Chen, Y.; Xu, Y.; Yin, Y. Impacts of land use change scenarios on storm-runoff generation in Xitiaoxi basin, China. Quat. Int. 2009, 208, 121–128. [Google Scholar]
- Moriasi, D.N.; Arnold, J.G.; Van Liew, M.W.; Bingner, R.L.; Harmel, R.D.; Veith, T.L. Model evaluation guidelines for systematic quantification of accuracy in watershed simulations. Trans. ASABE 2007, 50, 885–900. [Google Scholar]
- Mahmood, R.; Jia, S. Assessment of impacts of climate change on the water resources of the transboundary Jhelum River basin of Pakistan and India. Water 2016, 8, 246. [Google Scholar]
- Miller, J.D.; Kim, H.; Kjeldsen, T.R.; Packman, J.; Grebby, S.; Dearden, R. Assessing the impact of urbanization on storm runoff in a peri-urban catchment using historical change in impervious cover. J. Hydrol. 2014, 515, 59–70. [Google Scholar]
- Rafiei Emam, A.; Mishra, B.; Kumar, P.; Masago, Y.; Fukushi, K. Impact assessment of climate and land-use changes on flooding behavior in the Upper Ciliwung River, Jakarta, Indonesia. Water 2016, 8, 559. [Google Scholar]
- Chen, Y.-R.; Yu, B. Impact assessment of climatic and land-use changes on flood runoff in southeast Queensland. Hydrol. Sci. J. 2015, 60, 1759–1769. [Google Scholar]
- Latif, Y.; Ma, Y.; Ma, W. Climatic trends variability and concerning flow regime of Upper Indus Basin, Jehlum, and Kabul river basins Pakistan. Theor. Appl. Climatol. 2021, 144, 447–468. [Google Scholar]
- Gardelle, J.; Berthier, E.; Arnaud, Y.; Kaab, A. Region-Wide Glacier Mass Balances over the Pamir-Karakoram-Himalaya during 1999–2011; European Geosciences Union: Munich, Germany, 2013; Volume 7, p. 1263. [Google Scholar]
- Hasson, S.; Lucarini, V.; Khan, M.R.; Petitta, M.; Bolch, T.; Gioli, G. Early 21st century snow cover state over the western river basins of the Indus River system. Hydrol. Earth Syst. Sci. 2014, 18, 4077–4100. [Google Scholar]
- Masood, A.; Mushtaq, H. Spatio-temporal analysis of early twenty-first century areal changes in the Kabul River Basin cryosphere. Earth Syst. Environ. 2018, 2, 563–571. [Google Scholar]
- Bokhari, S.A.A.; Ahmad, B.; Ali, J.; Ahmad, S.; Mushtaq, H.; Rasul, G. Future climate change projections of the Kabul River Basin using a multi-model ensemble of high-resolution statistically downscaled data. Earth Syst. Environ. 2018, 2, 477–497. [Google Scholar]
- Iqbal, M.S.; Dahri, Z.H.; Querner, E.P.; Khan, A.; Hofstra, N. Impact of climate change on flood frequency and intensity in the Kabul River Basin. Geosciences 2018, 8, 114. [Google Scholar]
- Kamal, A.; Yingjie, M.; Ali, A. Significance of billion tree tsunami afforestation project and legal developments in forest sector of Pakistan. Int. J. Law Soc 2019, 1, 157. [Google Scholar]
- Khan, N.; Shah, S.J.; Rauf, T.; Zada, M.; Yukun, C.; Harbi, J. Socioeconomic impacts of the billion trees afforestation program in Khyber Pakhtunkhwa Province (kpk), Pakistan. Forests 2019, 10, 703. [Google Scholar]
- Nazir, N.; Farooq, A.; Jan, S.A.; Ahmad, A. A system dynamics model for billion trees tsunami afforestation project of Khyber Pakhtunkhwa in Pakistan: Model application to afforestation activities. J. Mt. Sci. 2019, 16, 2640–2653. [Google Scholar]
- Casale, F.; Bombelli, G.; Monti, R.; Bocchiola, D. Hydropower potential in the Kabul River under climate change scenarios in the XXI century. Theor. Appl. Climatol. 2020, 139, 1415–1434. [Google Scholar]


| Site# | River | Station | Flow Regime | Basin Area (km2) | Record (Years) |
|---|---|---|---|---|---|
| 1 | Kabul | Nowshera | Rainfall-dominated | 87,499 | 52 (1964–2015) |
| 2 | Chitral | Chitral | Seasonal snowmelt regime | 11,396 | 52 (1964–2015) |
| 3 | Swat | Kalam | Seasonal snowmelt regime | 2020 | 50 (1961–2010) |
| 4 | Swat | Chakdara | Seasonal snowmelt and rainfall | 6066 | 55 (1961–2015) |
| 5 | Bara | Jhansi Post | Rainfall-dominated | 1847 | 54 (1962–2015) |
| Sr | Station | Record (Years) | Variables |
|---|---|---|---|
| 1 | Drosh | 1961–2014 | Precipitation & Temperature |
| 2 | Kalam | 1961–2015 * | Precipitation & Temperature |
| 3 | Saidu Sharif | 1974–2014 | Precipitation & Temperature |
| 4 | Dir | 1967–2014 | Precipitation & Temperature |
| 5 | Chitral | 1961–2015 | Precipitation & Temperature |
| 6 | Cherat | 1961–2015 | Precipitation & Temperature |
| 7 | Peshawer | 1961–2015 | Precipitation & Temperature |
| Flood Indicators | Abbreviations | Description | Flood Characteristics |
|---|---|---|---|
| Annual maximum flow (m3/s) | AMF | Maximum daily flow during a hydrological year | Magnitude |
| Annual maximum flow from spring to pre-monsoon (m3/s) | AMFsp | Maximum daily flow including spring to pre-monsoon (March–15 June) | Magnitude |
| Peak over threshold magnitude (m3/s) | POT3M | Flow peaks over the threshold that lead to an average of 2.4–3 events per year | Magnitude |
| Peak over threshold frequency (number of events per year) | POT3F | Annual number of flow events in POT3 series | Frequency |
| Indicators | Abbreviations | Unit |
|---|---|---|
| Annual Mean Temperature | Tmean | °C |
| Maximum length of dry spell | CDD | d |
| Maximum length of wet spell | CWD | d |
| Annual total precipitation in wet days | PRCPTOT | mm |
| Annual count of days when precipitation ≥ 10 mm | R10 | d |
| Annual count of days when precipitation ≥ 20 mm | R20 | d |
| Annual count of days when precipitation ≥ 25 mm | R25 | d |
| Annual total precipitation when “daily precipitation amount on wet day > 95th percentile” | R95PTOT | mm |
| Annual total precipitation when “daily precipitation amount on wet day > 99th percentile” | R99PTOT | mm |
| Monthly maximum 1-day precipitation | Rx1day | mm |
| Monthly maximum 5-day precipitation | Rx5day | mm |
| Simple precipitation intensity index; Let RRwj be the daily precipitation amount on wet days, w (RR ≥ 1 mm) in period j. If W represents number of wet days in j, then: SDIIj = | SDII | mm/d |
| Sr | Station | Lambda λ | Chi-Squared Critical Value | Chi-Squared Observed Value |
|---|---|---|---|---|
| 1 | Nowshera | 2.6 | 15.51 | 13.17 |
| 2 | Chitral | 2.731 | 15.51 | 9.968 |
| 3 | Kalam | 2.51 | 15.51 | 5.113 |
| 4 | Chakdara | 2.4 | 15.51 | 14.736 |
| 5 | Jhansi Post | 2.585 | 15.51 | 11.6 |
| Sr | Station | AMF | AMFsp | POT3M | POT3F |
|---|---|---|---|---|---|
| 1 | Nowshera | −0.35 | −1.27 | −1.8 + | −0.59 |
| 2 | Chitral | 2.86 ** | 1.56 | 0.61 | 0.95 |
| 3 | Kalam | −1.36 | −1.45 | −0.08 | −2.35 * |
| 4 | Chakdara | 1.03 | 1.41 | 1.73 + | −0.75 |
| 5 | Jhansi Post | −2.31 * | −2.67 ** | −0.5 | −2.23 * |
| Sr | Station | AMF | AMFsp | POT3M | POT3F | ||||||||
|---|---|---|---|---|---|---|---|---|---|---|---|---|---|
| Pettitt’s | Buishand’s | SNHT | Pettitt’s | Buishand’s | SNHT | Pettitt’s | Buishand’s | SNHT | Pettitt’s | Buishand’s | SNHT | ||
| 1 | Nowshera | 1968 | 2004 | 2009 | 1969 | 1969 | 1968 | 1978 | 1968 | 1965 | 1969 | 1969 | 1969 |
| 2 | Chitral | 1991 | 1991 | 1991 | 2000 | 1987 | 1964 | 1981 | 1981 | 1972 | 1992 | 1992 | 1965 |
| 3 | Kalam | 1997 | 1999 | 1999 | 1996 | 1998 | 1998 | 1997 | 1963 | 1963 | 1995 | 1995 | 1998 |
| 4 | Chakdara | 1987 | 1987 | 1987 | 1989 | 1989 | 1989 | 1991 | 1973 | 1973 | 1998 | 1998 | 2010 |
| 5 | Jhansi Post | 1994 | 1983 | 1967 | 1983 | 1983 | 1967 | 1991 | 2009 | 2009 | 1983 | 1976 | 1976 |
| Sr | Station | AMF | AMFsp | POT3M | POT3F |
|---|---|---|---|---|---|
| 1 | Nowshera | 1.06 | 0.24 | 1.39 | 0.41 |
| 2 | Chitral | −0.74 | −0.88 | −0.66 | 0.1 |
| 3 | Kalam | −0.89 | −1.4 | −1.24 | −0.83 |
| 4 | Chakdara | −0.34 | −1.04 | −0.91 | −0.71 |
| 5 | Jhansi Post | 2.09 * | 0.65 | −2.22 * | 0.72 |
| Sr | Station | Entire Series | 1981–2015 |
|---|---|---|---|
| 1 | Drosh | 0.22 | −0.02 |
| 2 | Kalam | 0.22 | 0.22 |
| 3 | Saidu Sharif | 0.43 | 0.60 |
| 4 | Dir | 1.23 | 3.18 ** |
| 5 | Chitral | 1.92 + | 2.00 * |
| 6 | Cherat | −1.68 + | 1.77 + |
| 7 | Peshawer | 3.58 *** | 1.82 * |
| Indices | Stations | ||||||
|---|---|---|---|---|---|---|---|
| Chitral | Drosh | Kalam | Saidu Sharif | Dir | Peshawar | Cherat | |
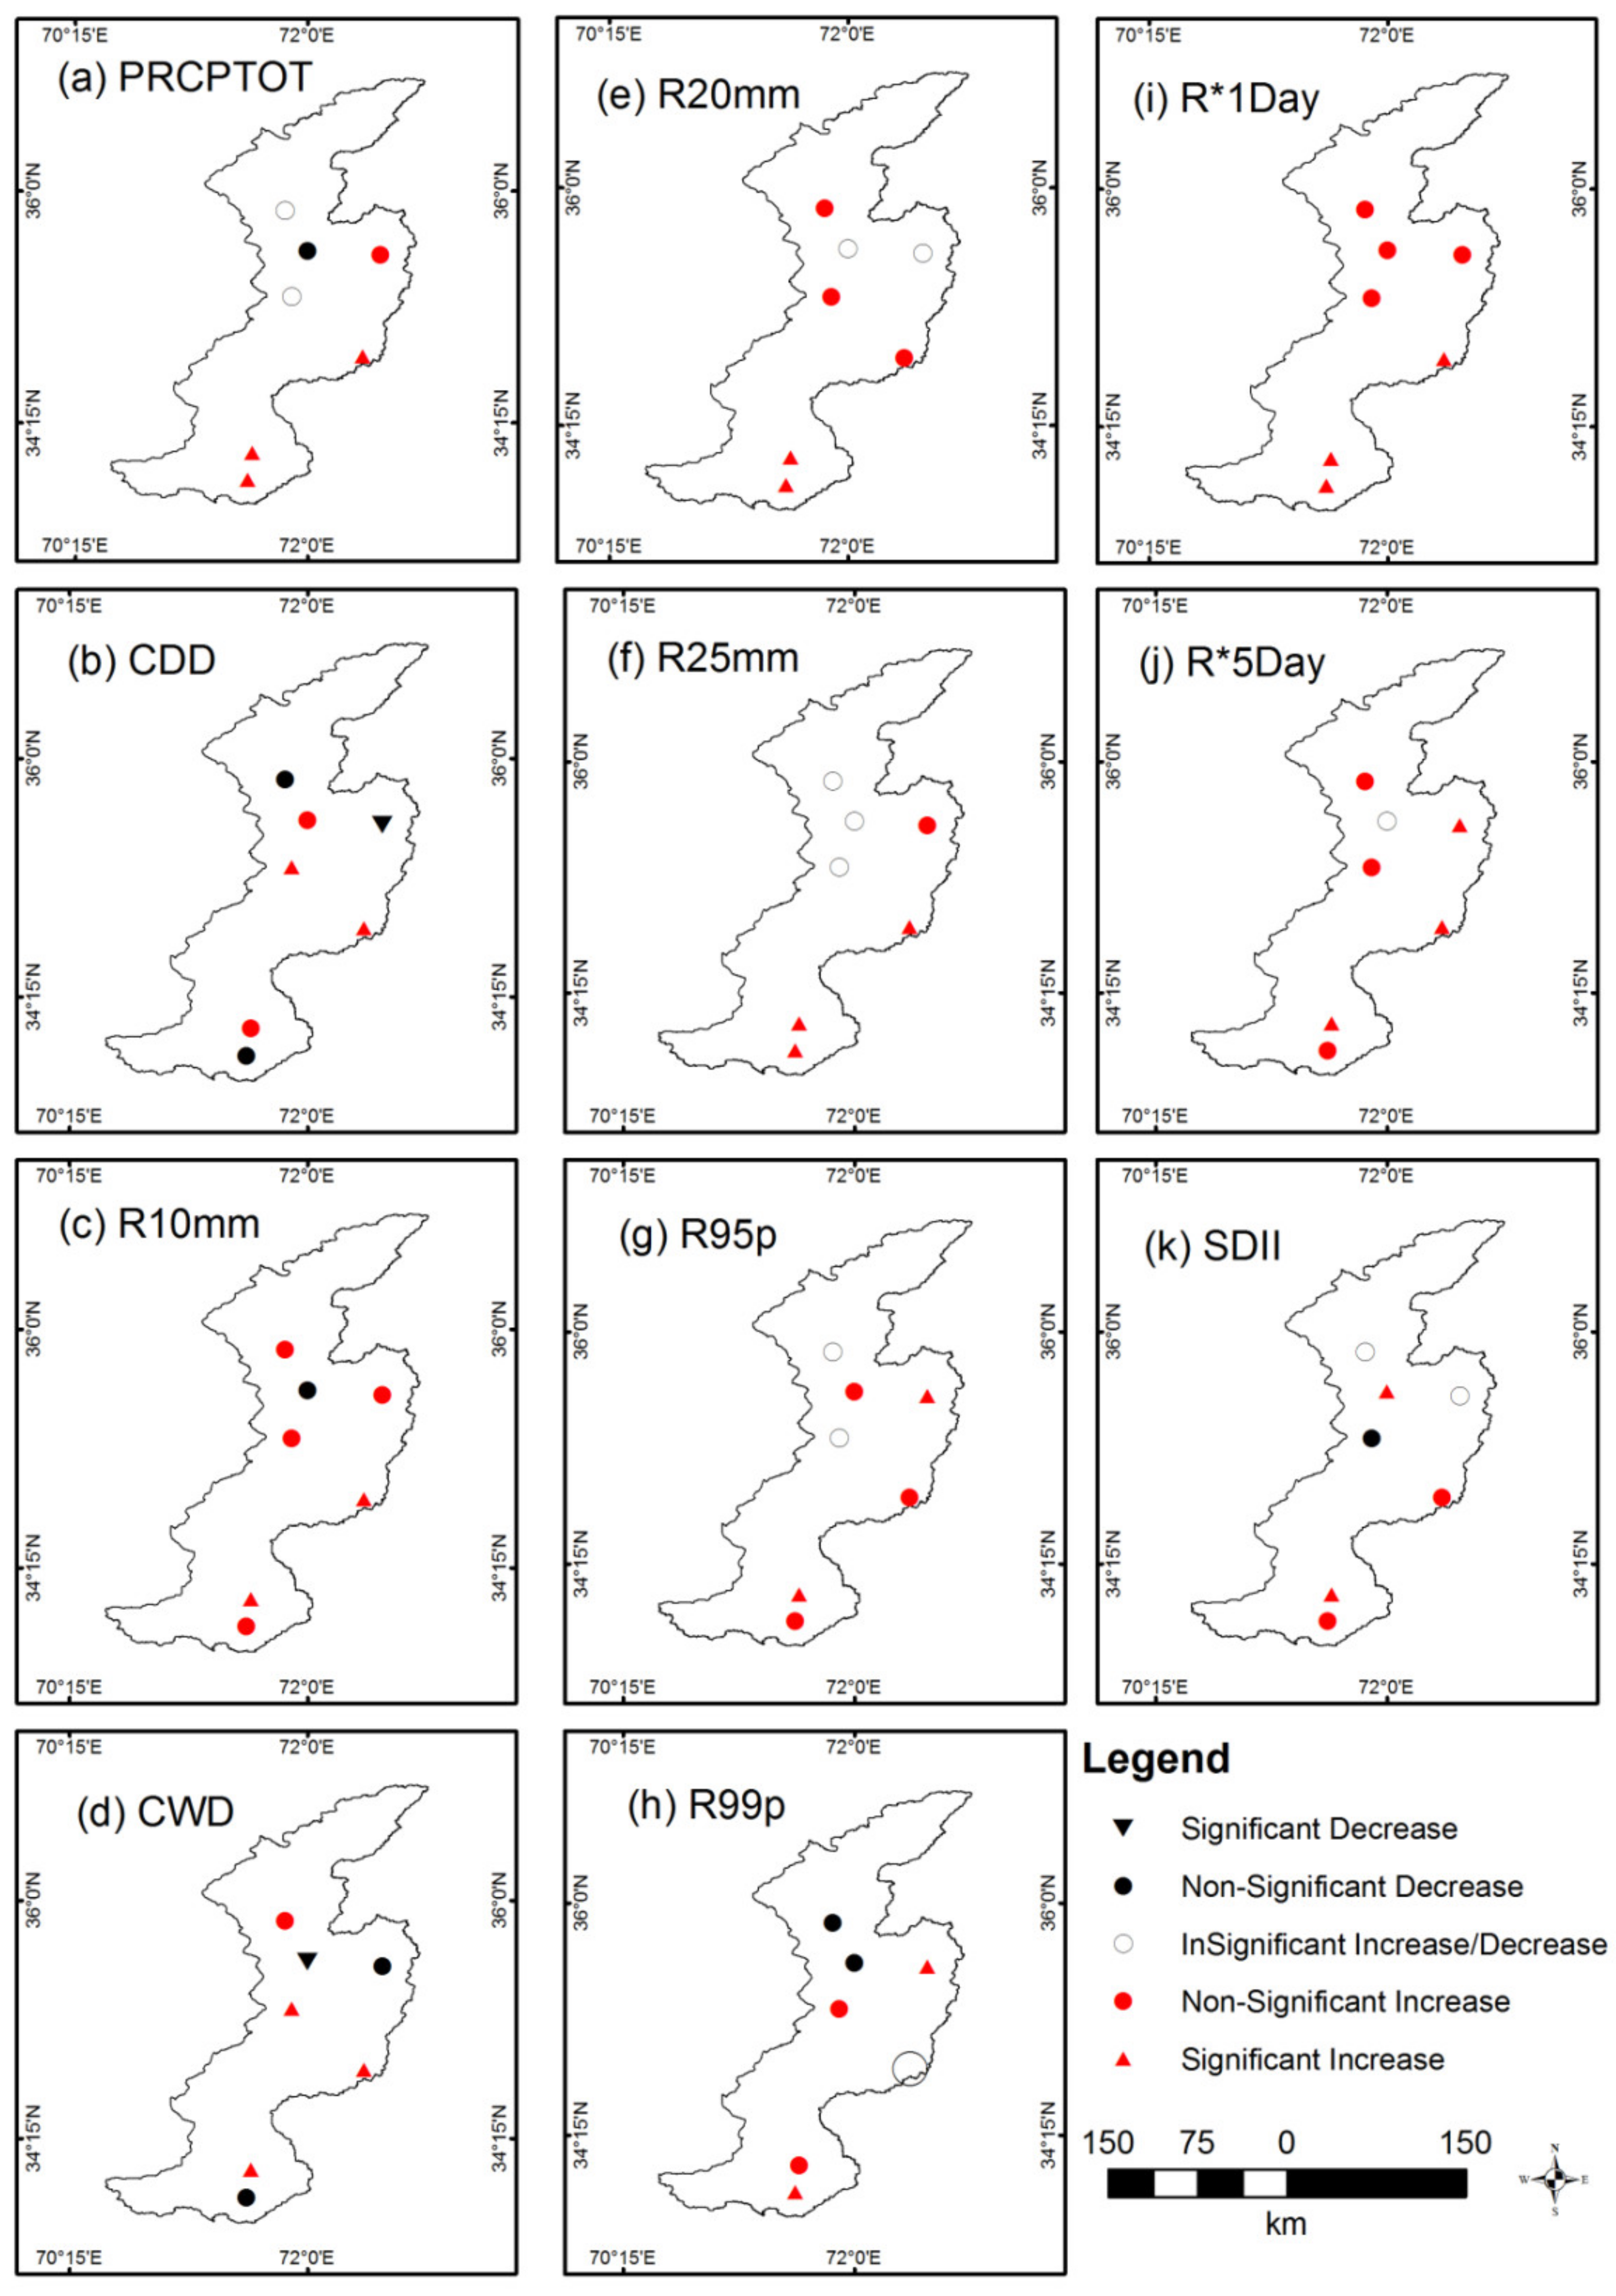
| CDD | −1.62 | 0.52 | −1.88 + | 1.66 + | 0.78 | 0.2 | −0.8 |
| CWD | 0.48 | −3.69 *** | −1.08 | 1.17 | 0.63 | 1.87 + | −0.6 |
| PRCPTOT | 0.16 | −1.38 | 1.13 | 1.95 + | 0.19 | 2.87 ** | 1.66 + |
| R10mm | 0.55 | −0.62 | 0.81 | 1.99 * | 0.4 | 3.02 ** | 1.52 |
| R20mm | 0.3 | −0.13 | 0.29 | 1.51 | 0.49 | 3.44 *** | 1.67 + |
| R25mm | 0.08 | 0.19 | 0.96 | 1.68 + | 0 | 3.36 *** | 1.70 + |
| R95p | −0.18 | 0.33 | 1.66 + | 1.52 | −0.14 | 1.87 + | 1.15 |
| R99p | −0.57 | −1.32 | 1.97 * | 0.22 | 0.65 | 0.98 | 2.73 ** |
| R1*Day | 0.43 | 0.48 | 1.56 | 2.47 * | 0.83 | 1.94 + | 2.22 * |
| R5*Day | 1.07 | 0.11 | 2.09 * | 2.37 * | 1.32 | 2.23 * | 1.58 |
| SDII | −0.28 | 2.95 ** | −0.05 | 0.61 | −0.53 | 2.14 * | 1.21 |
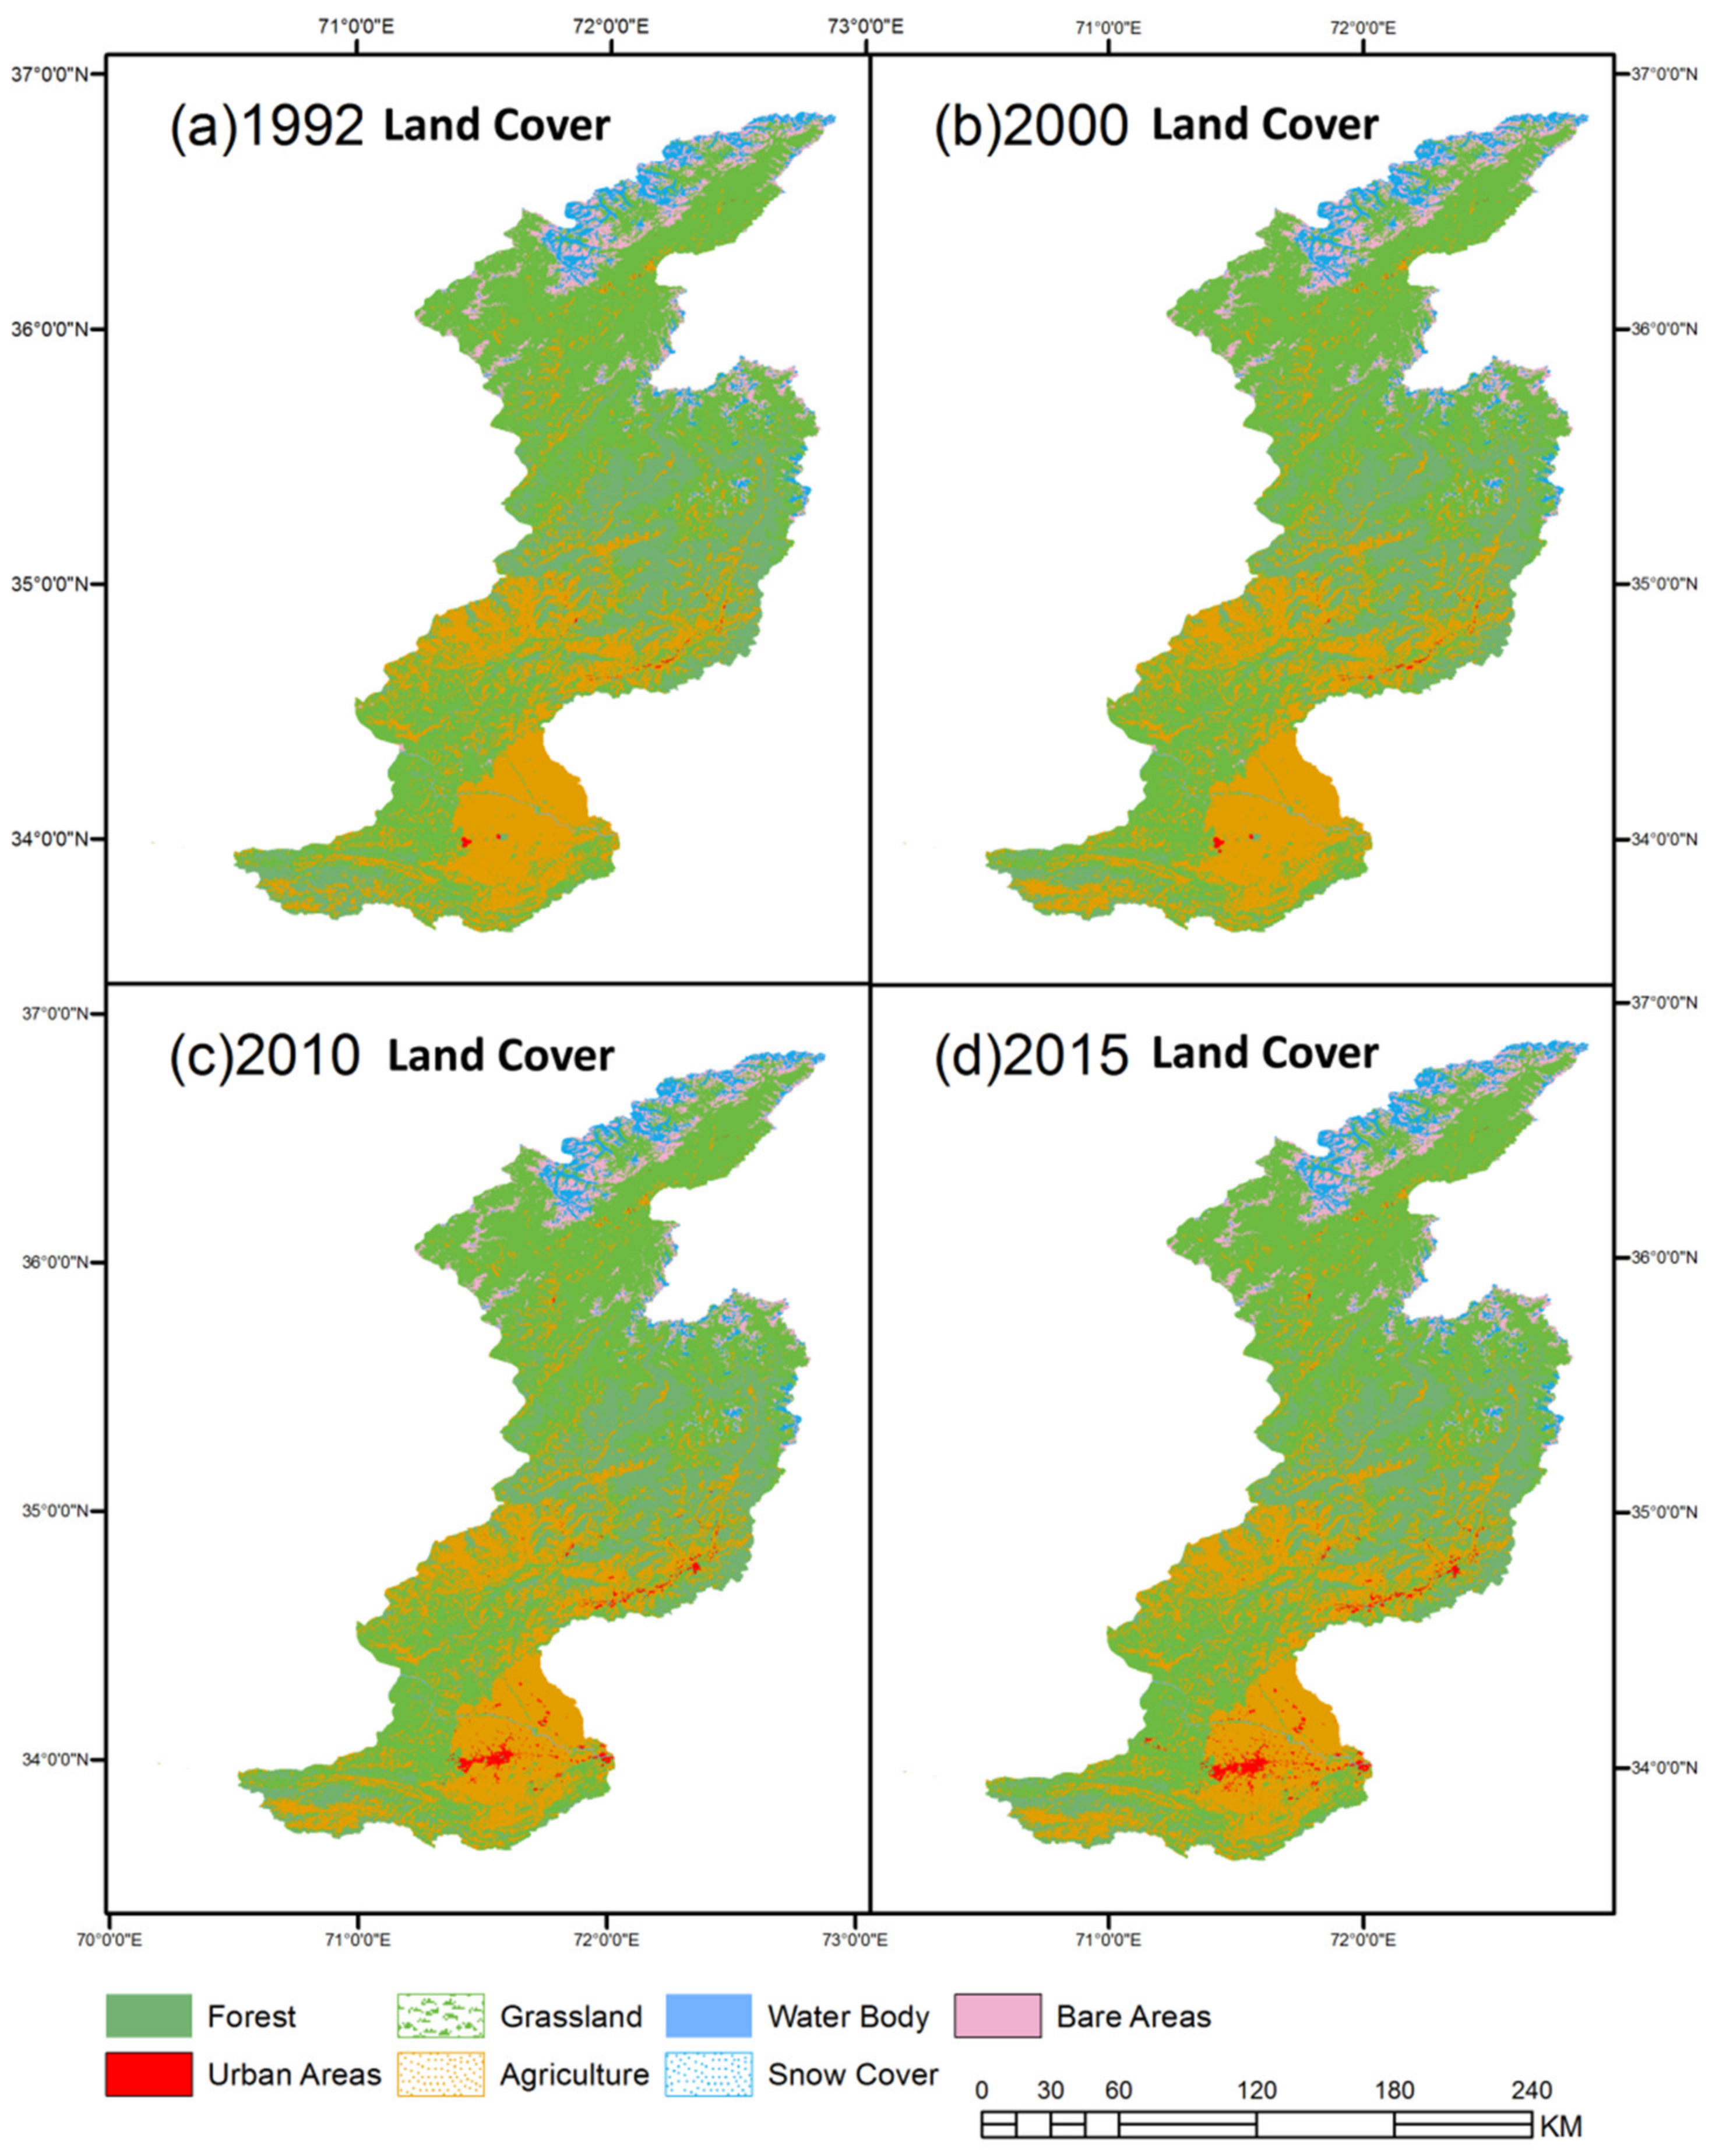
| Class Name | 1992 (km2) | 2000 (km2) | 2010 (km2) | 2015 (km2) | % (1992–2000) | % (2000–2010) | % (2010–2015) | % (1992–2015) |
|---|---|---|---|---|---|---|---|---|
| Forest | 5839.56 | 5538.96 | 5542.56 | 5535.36 | −5.43 | 0.06 | −0.13 | −5.21 |
| Urban Areas | 40.14 | 48.51 | 264.78 | 341.91 | 17.25 | 81.68 | 22.56 | 88.26 |
| Grassland | 17,680.1 | 17,776.7 | 17,685.4 | 17,688.3 | 0.54 | −0.52 | 0.02 | 0.05 |
| Agriculture | 8795.25 | 8990.82 | 8874.63 | 8801.91 | 2.18 | −1.31 | −0.83 | 0.08 |
| Water Body | 33.12 | 33.12 | 33.03 | 32.94 | 0 | −0.27 | −0.27 | −0.54 |
| Snow Cover | 1192.05 | 1192.05 | 1192.05 | 1192.05 | 0 | 0 | 0 | 0 |
| Bare Areas | 1964.7 | 1964.7 | 1952.37 | 1952.37 | 0 | −0.63 | 0 | −0.63 |
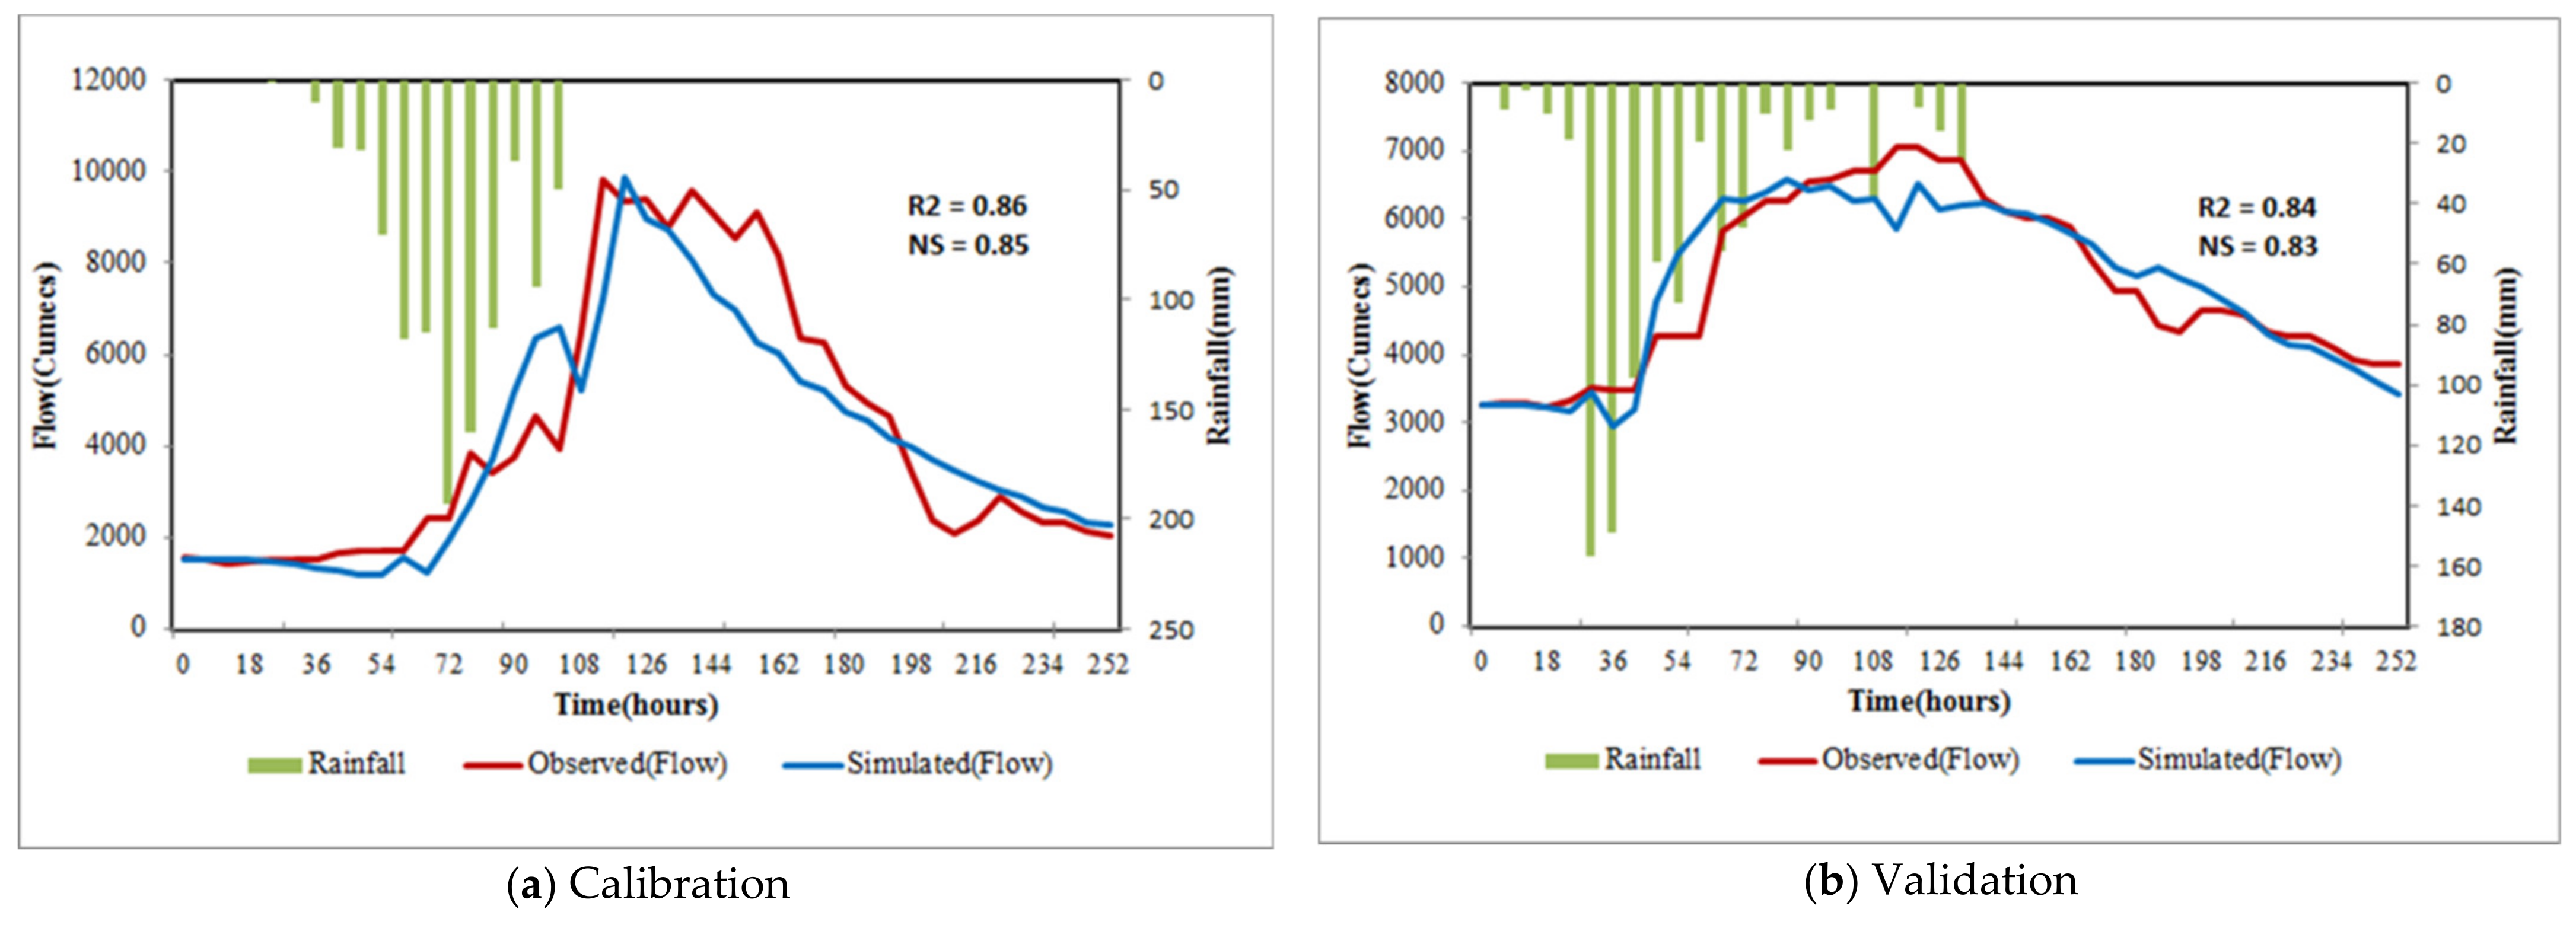
| Peak Flow (m3 s−1) | Time of Peak (Hours) | Nash Efficiency (NS) | Coefficient of Determination (R2) | |
|---|---|---|---|---|
| Calibration Event 27 July 2010 to 5 August 2010 | ||||
| Observed | 9808 | 30 July 2010, 18 p.m. | 0.86 | 0.85 |
| Simulated | 9871 | 31 July 2010, 00 a.m. | ||
| Difference Dp (%) | 0.63% | 6 h | ||
| Validation Event 7 August 2010 to 14 August 2010 | ||||
| Observed | 7054 | 09 August 2010, 14 p.m. | 0.84 | 0.83 |
| Simulated | 6578 | 08 August 2010, 12 a.m. | ||
| Difference Dp (%) | 6.74% | 26 h | ||
| Sr 1 | Chitral River Basin | Swat River Basin | ||||||
|---|---|---|---|---|---|---|---|---|
| Annual Rainfall | Monsoon Rainfall | Annual Rainfall | Monsoon Rainfall | |||||
| ES | ACP | ES | ACP | ES | ACP | ES | ACP | |
| 1 | 0.55 | −1.74 + | 1.73 + | −1.06 | 1.58 | 0.28 | 1.79 + | 0.06 |
Publisher’s Note: MDPI stays neutral with regard to jurisdictional claims in published maps and institutional affiliations. |
© 2021 by the authors. Licensee MDPI, Basel, Switzerland. This article is an open access article distributed under the terms and conditions of the Creative Commons Attribution (CC BY) license (https://creativecommons.org/licenses/by/4.0/).
Share and Cite
Mehmood, A.; Jia, S.; Lv, A.; Zhu, W.; Mahmood, R.; Saifullah, M.; Adnan, R.M. Detection of Spatial Shift in Flood Regime of the Kabul River Basin in Pakistan, Causes, Challenges, and Opportunities. Water 2021, 13, 1276. https://doi.org/10.3390/w13091276
Mehmood A, Jia S, Lv A, Zhu W, Mahmood R, Saifullah M, Adnan RM. Detection of Spatial Shift in Flood Regime of the Kabul River Basin in Pakistan, Causes, Challenges, and Opportunities. Water. 2021; 13(9):1276. https://doi.org/10.3390/w13091276
Chicago/Turabian StyleMehmood, Asif, Shaofeng Jia, Aifeng Lv, Wenbin Zhu, Rashid Mahmood, Muhammad Saifullah, and Rana Muhammad Adnan. 2021. "Detection of Spatial Shift in Flood Regime of the Kabul River Basin in Pakistan, Causes, Challenges, and Opportunities" Water 13, no. 9: 1276. https://doi.org/10.3390/w13091276
APA StyleMehmood, A., Jia, S., Lv, A., Zhu, W., Mahmood, R., Saifullah, M., & Adnan, R. M. (2021). Detection of Spatial Shift in Flood Regime of the Kabul River Basin in Pakistan, Causes, Challenges, and Opportunities. Water, 13(9), 1276. https://doi.org/10.3390/w13091276


