Article

Validation of a Swimming Direction Model for the Downstream Migration of Atlantic Salmon Smolts

1
Department of Civil and Environmental Engineering, Norwegian University of Science and Technology, S. P. Andersens 5, 7491 Trondheim, Norway
2
Norwegian Institute for Nature Research (NINA), Høgskoleringen 9, 7043 Trondheim, Norway
3
Norwegian Institute of Nature Research (NINA), Fakkelgården, 2624 Lillehammer, Norway
4
National Institute of Aquatic Resources, Technical University of Denmark, 8600 Silkeborg, Denmark
5
Norwegian Institute for Nature Research (NINA), Hjalmar Johansens gate 14, 9007 Tromsø, Norway
6
SINTEF Energy Research, Sem Sælandsvei 11, 7048 Trondheim, Norway
7
River Ecology and Management Research Group RivEM, Department of Environmental and Life Sciences, Karlstad University, 651 88 Karlstad, Sweden
*
Author to whom correspondence should be addressed.
Contributed equally to this work and are considered to be co-first authors.
Deceased in March 2020.
Water 2021, 13(9), 1230; https://doi.org/10.3390/w13091230
Submission received: 26 March 2021 / Revised: 23 April 2021 / Accepted: 26 April 2021 / Published: 28 April 2021
(This article belongs to the Special Issue Fish Passage at Hydropower Dams)

Abstract

:
Fish swimming performance is strongly influenced by flow hydrodynamics, but little is known about the relation between fine-scale fish movements and hydrodynamics based on in-situ investigations. In the presented study, we validated the etho-hydraulic fish swimming direction model presented in the River Mandal from Southern Norway, using similar behavioral and hydraulic data on salmon smolts from the River Orkla in Central Norway. The re-parametrized model explained the variation of the swimming direction of fish in the Orkla system in same degree as the original model performed in the Mandal system (R2: 84% in both cases). The transferability of the model when using it from one river to predict swimming direction in the other river was lower (R2: 21% and 26%), but nevertheless relatively high given that the two localities differed in hydraulic conditions. The analyses thus provide support for the fact that the identified hydraulic parameters and their interaction affected smolt behavior in a similar way at the two sites, but that local parametrization of the base model is required. The developed etho-hydraulic models can provide important insights into fish behavior and fish migration trajectories and can be developed into prediction models important for the future development of behavioral downstream migration solutions.

1. Introduction

Habitat fragmentation due to the presence of hydropower plants, dams, and weirs is widespread in many rivers used as migratory routes by fish and is a major threat to worldwide aquatic biodiversity [1,2]. Maintaining or re-establishing longitudinal and lateral connectivity for fish in fragmented rivers is crucial to achieving environmental goals (e.g., the United Nations Sustainable Development Goals and the EU Water Framework Directive). Mitigation measures for upstream fish passage (such as fishways) are well-studied compared to measures for downstream fish passage. Based on the state of the art, the current best practice solution for small fishes in river systems with small to medium hydropower facilities consists of fined meshed (non-passable) racks with bypass facilities (e.g., [3] and references therein), although such a method is challenged by technical limitations, economic costs, the risks of fish impingement on racks [4], and predation. A major barrier for the development of alternative guiding systems is insufficient knowledge of how the hydrodynamics of the flow affect the behavioral choices of the migrating fish [5]. Due to technical limitations, links between hydraulics and fish behavior at fine spatial and temporal scales have mainly been explored under laboratory conditions (e.g., [6,7,8,9]), with inherent concerns regarding their relevance in natural systems. Recent advances in fish telemetry methods and computational fluid dynamics (CFD) modeling now allows the acquisition of fish position and properties of the flow field under natural conditions at high spatio-temporal resolutions and accuracy.
Previous research from North America [10] pioneered such an etho-hydraulic approach by combining CFD modeling and an individual-based behavioral model of juvenile Pacific salmon (Oncorhynchus spp.) to explore how downstream migrating fish navigate through dammed river sections by adjusting their direction, speed and depth according to the perceived conditions. Recently, an international research group in Scandinavia explored the effects of hydrodynamics on both swimming direction and swimming speed of downstream migrating Atlantic salmon (Salmo salar) smolts [11]. It studied in situ based on fish telemetry tracking and CFD modeling and developed explanatory etho-hydraulics models for the smolts. Such models are important tools for the understanding and prediction of fish swimming behavior, and for the development of mitigation measures. However, for development of predictive models, the transferability to other systems of such explanatory models needs to be explored. The aforementioned etho-hydraulics models were developed from tracking of downstream migrating salmon smolts in the River Mandal in southern Norway [11].
Here, we validate the model developed for swimming direction in River Mandal [11] from southern Norway using similar data from the Svorkmo hydropower plant intake on the River Orkla, in central Norway. This was done by parametrizing a similar explanatory model with the River Orkla data, and then by cross-validation of the two models.

2. Materials and Methods

In this study, datasets on smolt behavior and hydraulics from two river sites, at the River Mandal in southern Norway and the River Orkla in central Norway, were used to validate the swimming direction behavioral model for Atlantic salmon smolt developed on data from River Mandal [11] (hereafter the Mandal model). First, we re-parametrized the Mandal model, using the same dependent and explanatory variables and modeling procedures as those in the Mandal for data from the River Orkla (termed the Orkla Model) to explore the extent to which the model structure could explain smolt swimming direction at another site. Secondly, we explored how well the model parametrized for one site predicted behavior in the other site to examine the dependence of model transferability on parameter values.
Detailed information on the behavioral and hydraulic dataset and analyses from the River Mandal can be found in the cited study [11], whereas the River Orkla study is described below.

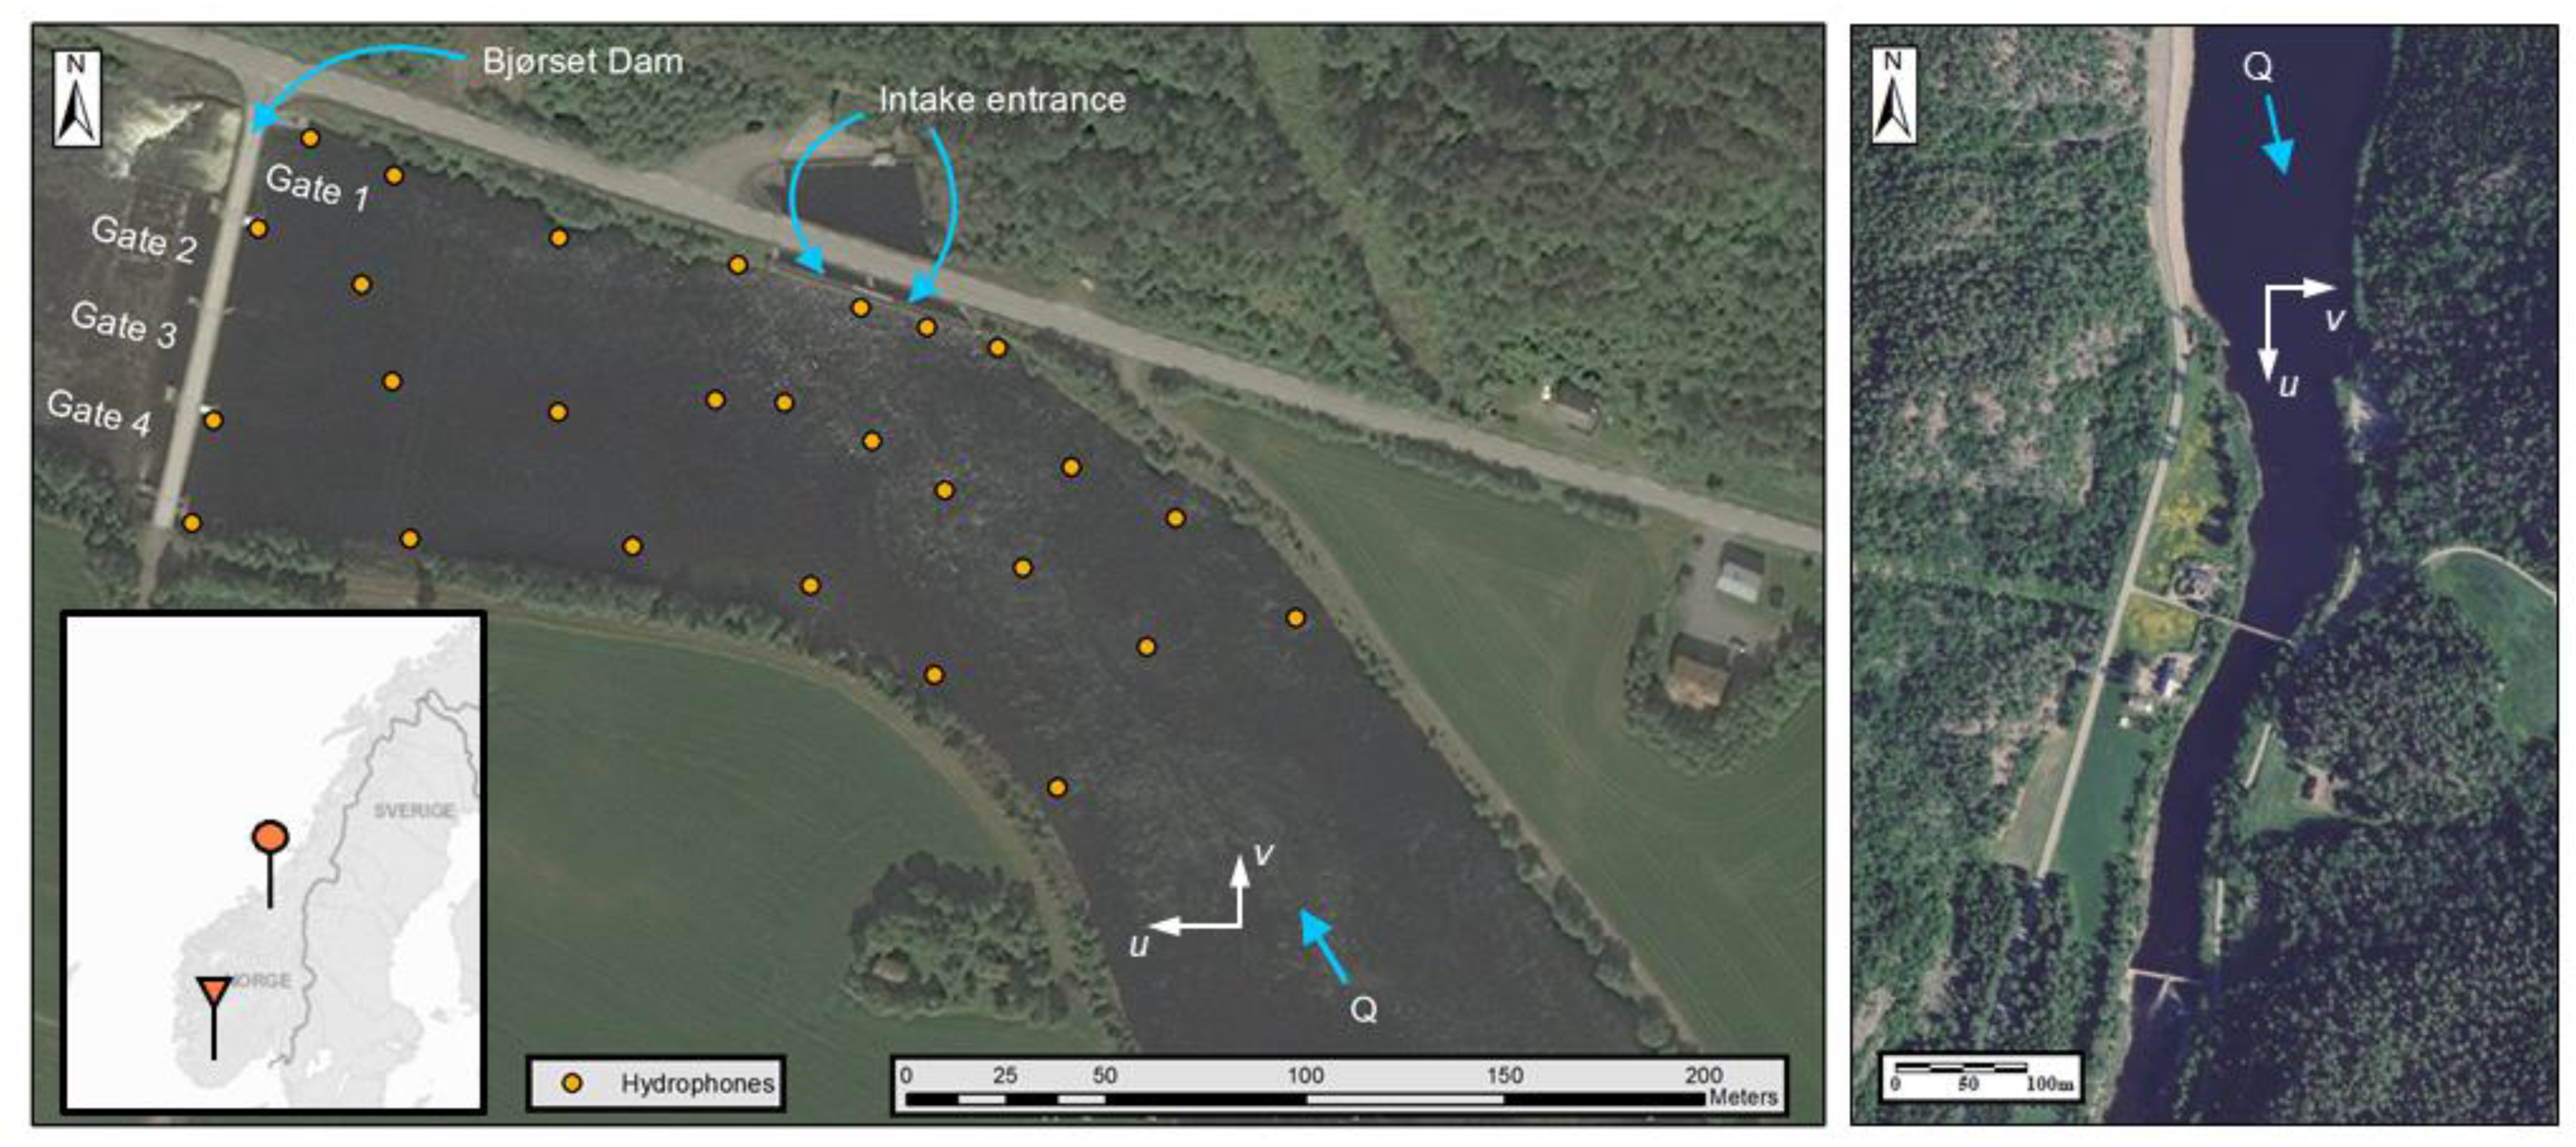
2.1. The River Orkla

The River Orkla, located in Central Norway (63°03′ N, 9°40′ E), has a mean annual discharge of 72 m3 s−1 and a total of five hydropower plants operating within the watercourse. The lowermost Svorkmo hydropower plant (HPP; Figure 1) is located in the main migratory route of anadromous Atlantic salmon and is a challenge for the downstream migration of Atlantic salmon smolts and kelts in the river [12]. As an attempt to prevent the movement of smolts (and ice and debris) towards the HPP, a concrete wall with two identical submerged openings (1.5 × 25.8 m, each at 2–2.5 m depth) was installed at the intake entrance during the construction of the HPP facility (in operation from 1983). The water withdrawal towards the Svorkmo HPP typically varies between 20 and 55 m3 s−1. The water level at the intake of the Svorkmo HPP is controlled by the Bjørset dam 100 m downstream of the intake, which comprises two pool and weir fishways along the two riverbanks (one in operation during the study) and four spillway gates. To meet the requirements of a minimum flow at 20 m3 s−1 during summer, one of the gates is opened (usually Gate 1 is used, next to the operating fishway) from May 1 (when almost all smolts have passed). During winter and until the gate opening, a minimum flow of 4 m3 s−1 is spilled through the fishway.

2.2. Telemetry

During the smolt migration period from late April to early June, 100 Atlantic salmon smolts were caught using a floating rotary trap. The smolts were surgically tagged with acoustic transmitters (Lotek, 200 kHz, model M-626, 7.5 × 17 mm, Lotek Wireless Inc., Newmarket, ON, Canada, with 2 s burst interval) following the methodology used in River Mandal [11], in accordance with the Norwegian regulations for animal welfare and treatment (Permit ID: 7636).
A two-dimensional telemetry array comprising 27 hydrophones (Lotek 200 kHz WHS 3050, Lotek Wireless Inc., Newmarket, ON, Canada) was deployed at the intake area of the Svorkmo HPP, covering the area from 150 m upstream of the intake facility to 100 m downstream to the Bjørset dam (Figure 1). Due to the shallow water depth at the study site (≈1.5–2.5 m), only a 2D setup could be deployed, in contrast to Laudal HPP on the River Mandal [11], where the depth in front of the intake allowed for a 3D telemetry array.
Fish positional signals of those 91 individuals that were detected in the study area (others were either lost to predation, or had not reached the site during the study period) were processed using the YAPS method [13] to determine location and the concomitant estimated positional error. The tracks were further processed to remove periods when either fish had scattered estimated positions or they were stationary (high number of successive observations occurring over short distances). This resulted in a total of 21,062 observations (median standard error of estimated positions: ~0.80 m) originated from 74 individuals (out of the 91 fish tracked successfully in the system).

2.3. Hydraulic Modeling

During the period when smolts were tracked within the study area (25 April–21 May), the flow regime in River Orkla varied highly from late-spring flood events to a one-week low-flow period. As the entire flow-series during the telemetry study could not be modeled due to heavy computational effort, ten flow scenarios were selected to represent the hydrological conditions experienced by the smolts (specified by hourly recorded hydrological and operational parameters, e.g., water elevation, discharge diverted to the HPP, spilled water through the gates, etc.). Each smolt was allocated to one of these scenarios based on the time of their positional signals (Table 1). The hydrological conditions of the ten selected scenarios together with the bathymetry data from Acoustic Doppler Current Profiler (ADCP, SonTek M9) mapping were used to characterize the hydrodynamics of the flow at the vicinity of the Svokmo HPP intake and the Bjørset dam (Table 1) using the computational fluid dynamics model OpenFOAM (release 4.1.0, [14]). Structural elements (dam with spillway gates and intake channel with submerged wall and two openings) were digitalized based on technical drawings and RTK GPS measurements (Leica Viva CS15). Ten hexahedra-dominant computational mesh were then generated by the snappyHexMesh utility of OpenFOAM with grid elements comparable to the size of smolts (0.15–0.3 and 0.1 m in horizontal and in vertical directions, respectively), creating in total approximately 18 million cells per scenario.
The ten scenarios were simulated by the pimpleFoam one-phase solver from the OpenFOAM software, which uses the PIMPLE algorithm [15] for pressure–velocity coupling and allowed modeling of the 3D transient flow on the discretized domain by solving the Reynolds-averaged Navier–Stokes equations. Turbulence was modeled using the widely validated standard k-ε turbulence model [16]. Detailed description on the numerical modeling process, including model calibration and validation, can be found in one of the previous studies of the authors [17]. The transient scenarios were set up to simulate 10 min of river flow upon reaching developed flow patterns, in correspondence with the observed average passage time of the smolts (<10 min). The following modeled variables were stored accordingly over the 10 consecutive minutes of each simulation at a 60 s time interval: the three components of flow velocity (u, v, and w, Cartesian velocity directions in streamwise, transversal, and vertical directions, respectively) and the turbulent kinetic energy (TKE). These data were further processed in combination with the smolt trajectories.

2.4. Combining Fish Positioning and Hydraulics

To analyze the effects of hydrodynamics on the swimming direction of smolts in the River Orkla, described as angular difference (minimum angular difference at time t; in degrees) between the resultant flow vector and the ground direction of fish between times t − 1 and t + 1, following the study in River Mandal [11], estimated fish positions (YAPS, [13]) were combined with the averaged (in time and depth) modeled hydraulic variables, following the 2D etho-hydraulic model developed for the “main watercourse” at the Laudal HPP intake on the River Mandal [11]. Two depths (0.4 and 0.6 m below the water surface) were selected to cover the water depth that Atlantic salmon smolts were expected to migrate [18].

2.5. Fish Swimming Direction Models
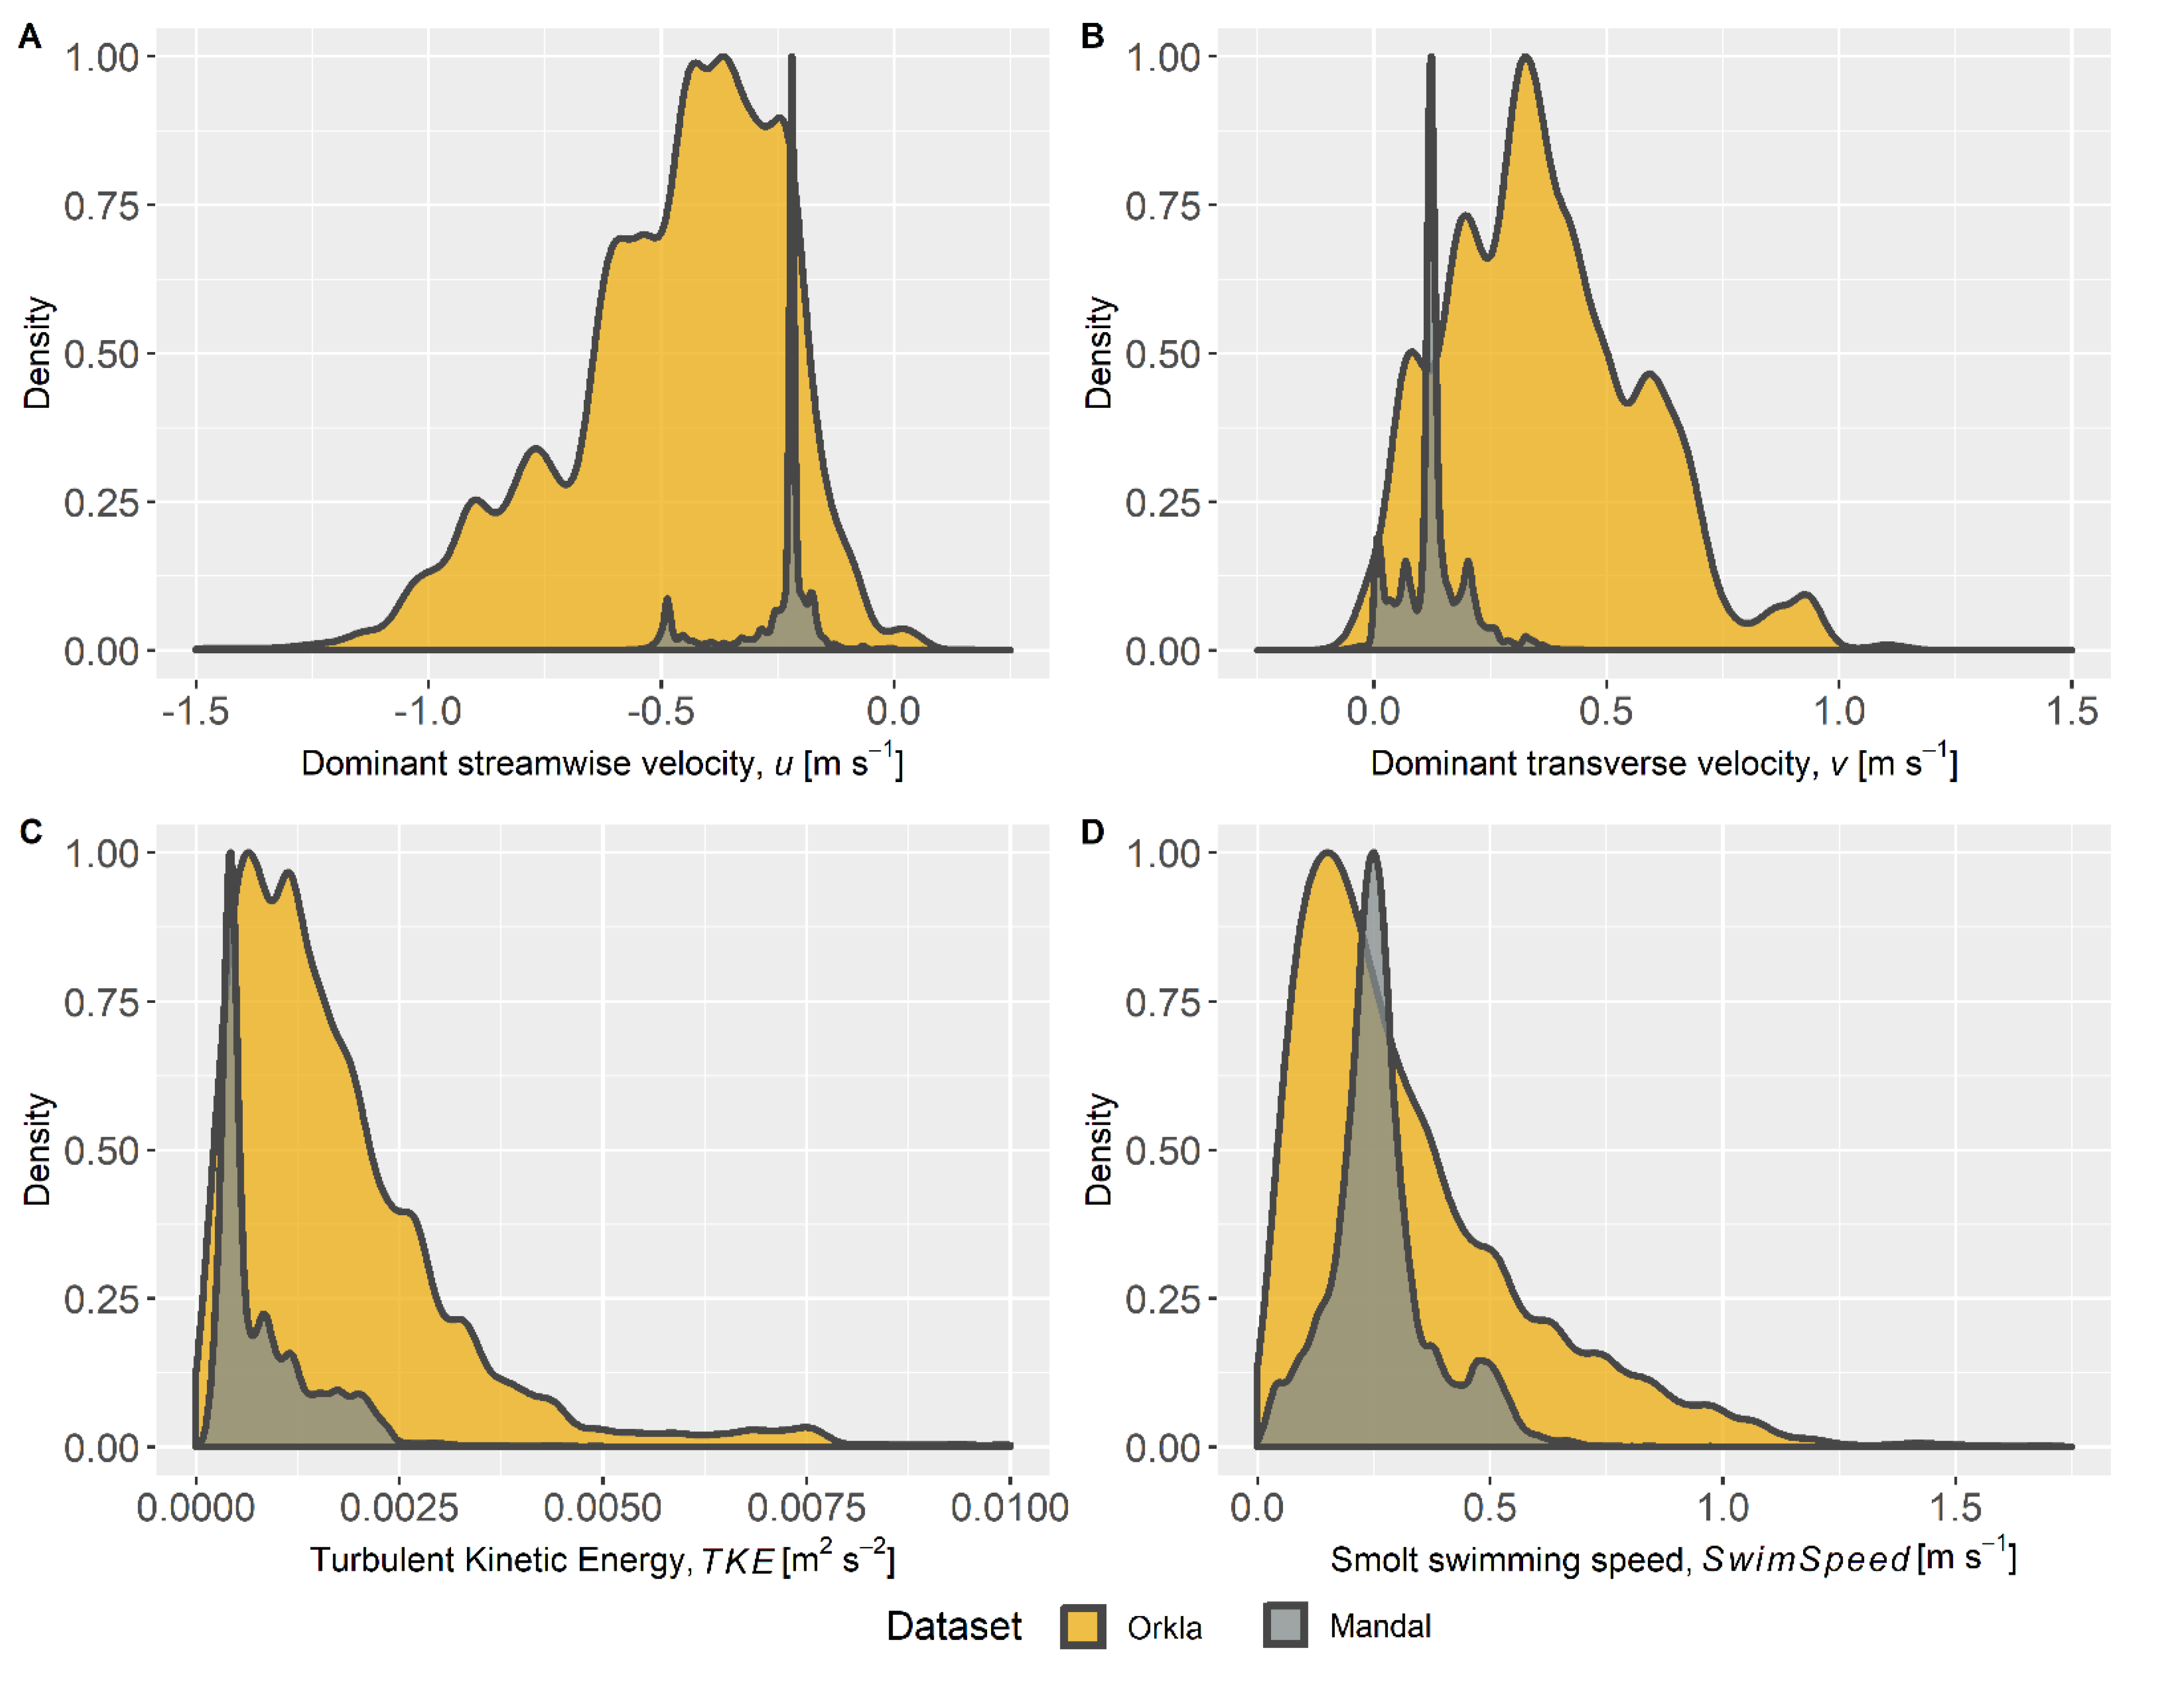
A generalized linear mixed model using the template model builder [19] with a beta-distribution technique was used to parameterize the explanatory angular difference model for the Orkla site (Orkla model). Angular difference was defined as the absolute difference between the ground direction of the fish (the direction in which the fish is moving, in degrees) and the flow direction (in degrees) and indicates the swimming direction of the fish relative to the flow direction. The angular difference ranges from 0° (the fish is moving in the same direction as the flow) through 90° (the fish is moving perpendicular to the flow) to 180° (the fish is moving in an opposite direction to the flow). The model setup followed the model developed in River Mandal [11] in which angular difference was explained by hydraulic explanatory variables, the u and v velocity components, and TKE, as well as the swimming speed of the smolt (SwimSpeed). The swimming speed was calculated as S x 2 + S y 2 , where Sx and Sz are swimming speeds in x and y directions and calculated as Sx = Gxu and Sy = Gyv. Here, Gx and Gy are the ground speed of the fish in x and y dimensions, and u and v are the water velocity components in the same dimensions. Ground speed and swimming speed of a fish in time (t) were calculated as displacement from time t − 1 to time t + 1. Next, we cross-validated the models by comparing predictions from the Mandal model with those observed in the Orkla site and the predictions from the Orkla model with observations in the Mandal site.
All model selections were based on the Akaike’s information criterion (AIC; [20]) provided by the bbmle-library [21], and model performance was evaluated by examining the correlation (Pearsons R2) between the predicted and the observed values.

3. Results

Among the ten modeled scenarios (Table 1), five exhibited higher flow discharge through the intake towards the HPP (Qintake) than the spilled discharge over the dam (Qdam). Out of the 91 detected fish, 42 smolts were detected under these conditions, whereas 49 fish were detected in the other five scenarios where Qdam > Qintake (30 and 44 fish, respectively, among the 74 smolts used in further analysis). The latter hydraulic scenarios emerged as the result of two longer flood events (scenario G and I, Table 1) and one short flood peak (scenario J, Table 1). The design of the intake and dam area as well as the floods caused larger variation of the hydraulic condition in the Orkla site compared to the Mandal site conditions (Figure 2), and distributions were skewed towards higher values, particularly for transversal velocities (v) and turbulent kinetic energy (TKE).
Using the same statistical modeling procedures as in the study on River Mandal [11], the most parsimonious model obtained for the Orkla site included the same main effects and interactions as the Mandal model (M.org model from Table 2). Turbulent kinetic energy, horizontal velocity components, and swimming speed of the fish and concomitant interactions significantly explained angular differences in the Orkla site (R2 = 0.84, Table 3), with similar explanatory power as for the Mandal site (R2 = 0.84). The estimated gradients differed somewhat between the models, but the direction of the effects (signs) was the same. The ability of the models to explain angular difference in the other river system was similar, with the Orkla model tested at the Mandal site performing slightly better (R2 = 0.26) compared to the Mandal model tested at the Orkla site (R2 = 0.21).

4. Discussion

Etho-hydraulic models that can explain fish movement are important for future development of guiding systems that ensure safe two-way passage of migrating riverine fish at anthropogenic structures such as hydropower facilities and dams [5,10]. Statistical explanatory models for the effects of hydraulic variables on fish swimming, such as the model developed in River Mandal [11] for the swimming direction of Atlantic salmon smolts, are important steps towards predictive models that can be used in design of guiding systems. The explanatory models inform the hydraulic variables involved and how they interact to influence the behavior of the fish. However, the generality of the identified links between smolt movement and hydraulic variables needs to be assessed.
The model, developed from smolt tracking and hydraulic modeling in the River Mandal [11], performed well when re-parameterized to similar data from the River Orkla. The most parsimonious model from both sites included the same main and interaction effects, affecting angular difference in the same directions. The Orkla model explained 84% of the variation in angular difference of the 74 tracked smolts at this site, a prediction rate that matched the performance of the original model (84%—73 smolts, [11]). The correspondence of the modeling results from the two sites occurred despite the generally higher velocities, larger range of the hydraulic parameters, and generally higher swimming speeds in the Orkla than in the Mandal site (see Figure 2). Thus, the results provide support for how the hydraulic variables and concomitant interactions identified in the River Mandal [11] influence the swimming direction of Atlantic salmon smolts during their downstream migration, and that general behavioral mechanisms were indeed identified.
The more challenging cross-validation yielded lower explanatory powers. The Mandal model explained 21% of the angular difference of salmon smolts in the Orkla site, whereas the Orkla model explained 26% of the angular difference in the Mandal site. Interestingly, the Orkla model performed somewhat better in the cross validation than the Mandal model, probably due to the wider range of the hydraulic parameters estimated for the Orkla site. Indeed, the Mandal model predictions for the Orkla site represent extrapolation to hydraulic conditions not found at the Mandal site. Developing representative and transferable etho-hydraulic models is challenging, in particular due to their limitation in quantifying and studying all the possible exogenous and endogenous factors and associated interactions that would likely contribute to the complex decision-making process of fish swimming performance [10]. Such limitations may explain the moderate explanatory power of the cross validations.
In both models in this study, the interplay among the hydraulic variables emerges as more important for angular difference than the effect of single variables. This result corroborates the finding from River Mandal [11] and stresses the importance of considering the interaction of multiple hydraulic variables when assessing the effects of hydraulics on fish swimming performance, which has so far been the typical laboratory approach.
The models presented here were developed for Atlantic salmon smolts and can be used to develop predictive trajectory models for this species and life-stage. We recognize that due to the specific biomechanical, physiological, and morphometric attributes of each fish species and associated life-stages, these models cannot be generalized and used for other species. Thus, we advocate that future research focuses on the development of etho-hydraulic models targeting umbrella fish species representing different swimming modes [22,23,24].
Etho-hydraulic behavioral models are powerful tools and highly relevant for the future progress of river management and engineering solutions for safe fish migration past barriers [2,5,10].

Author Contributions

Conceptualization: K.A., T.F. and O.C.; methodology: M.S.-M., A.T.S., K.A. and T.F.; software: M.S.-M., A.T.S., K.M.B. and R.D.H.; validation: M.S.-M. and K.M.B.; investigation: all authors; resources: H.B., K.A., F.Ø., K.Ø.G. and H.-P.F.; writing—original draft preparation: M.S.-M., A.T.S., K.A. and T.F.; writing—review and editing: all authors; visualization: M.S.-M.; supervision: K.A. and T.F.; funding acquisition: K.A. and T.F. All authors have read and agreed to the published version of the manuscript.

Funding

This research was funded by the SafePASS project through the ENERGIX program of the Research Council of Norway (Project no. 244022) with contributions from 13 hydropower companies, the Norwegian Environment Agency and the Norwegian Water Resources and Energy Directorate. The project was also funded by the Norwegian Research Centre for Hydropower Technology—HydroCen (Project no. 257588).

Institutional Review Board Statement

Fish handing and surgery complied with the Norwegian Animal Welfare Act (2009). Permit ID: 7636.

Informed Consent Statement

Not applicable.

Data Availability Statement

The data presented in this study is available on request from the corresponding author.

Acknowledgments

Additional funding for the River Orkla case study was provided by the TrønderEnergi energy company, which operates the HP station at the study site. The numerical simulations were performed on resources provided by UNINETT Sigma2—the National Infrastructure for High Performance Computing and Data Storage in Norway.

Conflicts of Interest

The authors declare no conflict of interest.

References

  1. Liermann, C.R.; Nilsson, C.; Robertson, J.; Ng, R.Y. Implications of Dam Obstruction for Global Freshwater Fish Diversity. Bioscience 2012, 62, 539–548. [Google Scholar] [CrossRef]
  2. Silva, A.T.; Lucas, M.C.; Castro-Santos, T.; Katopodis, C.; Baumgartner, L.J.; Thiem, J.D.; Aarestrup, K.; Pompeu, P.S.; O’Brien, G.C.; Braun, D.C.; et al. The future of fish passage science, engineering, and practice. Fish Fish. 2018, 19, 340–362. [Google Scholar] [CrossRef] [Green Version]
  3. Fjeldstad, H.-P.; Pulg, U.; Forseth, T. Safe two-way migration for salmonids and eel past hydropower structures in Europe: A review and recommendations for best-practice solutions. Mar. Freshw. Res. 2018, 69, 1834–1847. [Google Scholar] [CrossRef] [Green Version]
  4. Taft, E.; Hofmann, P.; Eisle, P.; Horst, T. An experimental approach to the design of systems for alleviating fish impingement at existing and proposed power plant intake structures. In Proceedings of the 3rd National Workshop on Entrainment and Impingement, New York, NY, USA, 24 February 1976; pp. 343–365. [Google Scholar]
  5. Williams, J.G.; Armstrong, G.; Katopodis, C.; Lariniere, M.; Travade, F. Thinking Like a Fish: A Key Ingredient for Development of Effective Fish Passage Facilities at River Obstructions. River Res. Appl. 2012, 28, 407–417. [Google Scholar] [CrossRef] [Green Version]
  6. Coutant, C.C. Integrated, multi-sensory, behavioral guidance systems for fish diversions. In Behavioral Technologies for Fish Guidance; Coutant, C.C., Ed.; American Fisheries Society: Bethesda, MD, USA, 2001; Volume 26, pp. 105–113. [Google Scholar]
  7. Silva, A.T.; Santos, J.M.; Ferreira, M.T.; Pinheiro, A.N.; Katopodis, C. Effects of Water Velocity and Turbulence on the Behaviour of Iberian Barbel (Luciobarbus Bocagei, Steindachner 1864) in an Experimental Pool-Type Fishway. River Res. Appl. 2011, 27, 360–373. [Google Scholar] [CrossRef]
  8. Tritico, H.M.; Cotel, A.J. The effects of turbulent eddies on the stability and critical swimming speed of creek chub (Semotilus atromaculatus). J. Exp. Biol. 2010, 213, 2284–2293. [Google Scholar] [CrossRef] [PubMed] [Green Version]
  9. Lacey, R.W.J.; Neary, V.S.; Liao, J.C.; Enders, E.C.; Tritico, H.M. The Ipos Framework: Linking Fish Swimming Performance in Altered Flows from Laboratory Experiments to Rivers. River Res. Appl. 2012, 28, 429–443. [Google Scholar] [CrossRef]
  10. Goodwin, R.A.; Politano, M.; Garvin, J.W.; Nestler, J.M.; Hay, D.; Anderson, J.J.; Weber, L.J.; Dimperio, E.; Smith, D.L.; Timko, M. Fish navigation of large dams emerges from their modulation of flow field experience. Prod. Nat. Acad. Sci. USA 2014, 111, 5277–5282. [Google Scholar] [CrossRef] [Green Version]
  11. Silva, A.T.; Bærum, K.M.; Hedger, R.D.; Baktoft, H.; Fjeldstad, H.-P.; Gjelland, K.Ø.; Økland, F.; Forseth, T. The effects of hydrodynamics on the three-dimensional downstream migratory movement of Atlantic salmon. Sci. Total Environ. 2020, 705, 135773. [Google Scholar] [CrossRef]
  12. Baktoft, H.; Gjelland, K.O.; Szabo-Meszaros, M.; Silva, A.T.; Riha, M.; Okland, F.; Alfredsen, K.; Forseth, T. Can Energy Depletion of Wild Atlantic Salmon Kelts Negotiating Hydropower Facilities Lead to Reduced Survival? Sustainability 2020, 12, 7341. [Google Scholar] [CrossRef]
  13. Baktoft, H.; Gjelland, K.Ø.; Økland, F.; Thygesen, U.H. Positioning of aquatic animals based on time-of-arrival and random walk models using YAPS (Yet Another Positioning Solver). Sci. Rep. UK 2017, 7, 14294. [Google Scholar] [CrossRef] [PubMed] [Green Version]
  14. Greenshields, C.J.O.F.L. The Open Source CFD Toolbox (Version 4.1.0). 2015. Available online: https://openfoam.org/ (accessed on 28 April 2021).
  15. Higuera, P.; Lara, J.L.; Losada, I.J. Realistic wave generation and active wave absorption for Navier-Stokes models Application to OpenFOAM (R). Coast. Eng. 2013, 71, 102–118. [Google Scholar] [CrossRef]
  16. Launder, B.E.; Spalding, D.B. The numerical computation of turbulent flows. Comput. Methods Appl. Mech. Eng. 1974, 3, 269–289. [Google Scholar] [CrossRef]
  17. Szabo-Meszaros, M.; Forseth, T.; Baktoft, H.; Fjeldstad, H.-P.; Silva, A.T.; Gjelland, K.Ø.; Økland, F.; Uglem, I.; Alfredsen, K. Modelling mitigation measures for smolt migration at dammed river sections. Ecohydrology 2019, 12, e2131. [Google Scholar] [CrossRef]
  18. Thorstad, E.B.; Whoriskey, F.; Rikardsen, A.H.; Aarestrup, K.J.A. Aquatic nomads: The Life and Migrations of the Atlantic Salmon, 1st ed.; Wiley-Blackwell: Hoboken, NJ, USA, 2011. [Google Scholar]
  19. Brooks, M.E.; Kristensen, K.; van Benthem, K.J.; Magnusson, A.; Berg, C.W.; Nielsen, A.; Skaug, H.J.; Machler, M.; Bolker, B.M. glmmTMB Balances Speed and Flexibility Among Packages for Zero-inflated Generalized Linear Mixed Modeling. R J. 2017, 9, 378–400. [Google Scholar] [CrossRef] [Green Version]
  20. Akaike, H. New Look at Statistical-Model Identification. IEEE T. Automat. Contr. 1974, 19, 716–723. [Google Scholar] [CrossRef]
  21. Bolker, B. Tools for General Maximum Likelihood Estimation. R Development Core Team. 2017. Available online: https://CRAN.R-project.org/package=bbmle (accessed on 28 April 2021).
  22. Taugbol, A.; Olstad, K.; Baerum, K.M.; Museth, J. Swimming performance of brown trout and grayling show species-specific responses to changes in temperature. Ecol. Freshw. Fish 2019, 28, 241–246. [Google Scholar] [CrossRef]
  23. Quintella, B.R.; Mateus, C.S.; Costa, J.L.; Domingos, I.; Almeida, P.R. Critical swimming speed of yellow- and silver-phase European eel (Anguilla anguilla, L.). J. Appl. Ichthyol. 2010, 26, 432–435. [Google Scholar] [CrossRef]
  24. Tytell, E.D.; Borazjani, I.; Sotiropoulos, F.; Baker, T.V.; Anderson, E.J.; Lauder, G.V. Disentangling the Functional Roles of Morphology and Motion in the Swimming of Fish. Integr. Comp. Biol. 2010, 50, 1140–1154. [Google Scholar] [CrossRef] [PubMed] [Green Version]
Figure 1. The study site at the Bjørset dam on the River Orkla with the location of the twenty-seven hydrophones (left panel) and the study site at the Laudal hydropower plant [11] (right panel). Insets show the location of sites (bottom-left, circle marker: River Orkla; triangle marker: River Mandal). The main flow directions (Q) are presented beside the u and v flow vectors defined along the Cartesian grid to represent the dominant longitudinal (u) and transversal (v) velocities accordingly. Source: ArcGIS® software by ESRI (www.esri.com; accessed on 1 April 2018) and Norge i Bilder (www.norgeibilder.no; accessed on 1 December 2019).
Water 13 01230 g001
Figure 2. Distributions of the linked hydraulic variables and the swimming speed of smolts at the River Orkla (yellow) and River Mandalselva (grey) sites, which were used for model testing. The variables are presented in the following order: top row: streamwise velocity—u (A), transverse velocity—v (B); bottom-row: turbulent kinetic energy—TKE (C), Smolt swimming speed—SwimSpeed (D).
Water 13 01230 g002
Table 1. The scenarios for CFD modeling (AJ) with water surface elevation (Welev (m above sea level (m a.s.l.)), inlet discharge (Qin (m3 s−1)), discharge through the dam (Qdam [m3 s−1]) and through the intake (Qintake (m3 s−1)). The dimensionless ratio between the two outlets (Qdam/Qintake) is also presented. The gate openings (G1–G4) indicate the percentage (%) of the actual opening of the gates. Note that below 16%, the gate was considered closed (TronderEnergi, personal communication). The number of fish (Nrfish) sorted into each scenario is also shown.
SIDWelevQinQdamQintakeQdam/QintakeG1G2G3G4Nrfish
[m a.s.l.][m3s−1][m3s−1][m3s−1][-][%][%][%][%]
A129.1255.521.334.20.6269.360.030.030.038
B129.1251.922.029.90.7369.360.030.030.0311
C129.1247.421.625.80.8469.360.030.030.034
D129.2282.436.945.40.8169.9715.540.030.0314
E129.3484.839.445.40.8769.9715.540.030.035
F129.44112.166.645.51.4696.7615.540.030.035
G129.42148.4111.337.03.0197.0579.400.030.0323
H129.50124.874.949.91.5099.6831.660.030.035
I129.50130.881.549.31.6599.6842.820.030.0314
J129.40211.0175.435.64.9397.0295.6394.940.032
Table 2. Investigated combination of the variables for best model selection of angular difference parameterized for the River Orkla site. The model candidates were tested with different parameter setups for the fixed effect, while the same dispersion structure was used for all of them as for the River Mandal site [11]. The degree of freedom (df) in addition to the AIC values and the difference in the AIC values (ΔAIC) were calculated by the bbmle R package [21].
CandidatesParameter Set up for Fixed EffectAICΔAICdf
M.orgTKE × SwimSpeed + v × SwimSpeed + u × v + TKE × v−59008.4016
M.1v × SwimSpeed + u × v + TKE × v−58885.2123.315
M.2v × SwimSpeed + u × v + TKE−58873.5134.914
M.3v × SwimSpeed + u × v + u−58852.415613
M.4u × SwimSpeed + u × v + TKE−58807.420114
M.5u × SwimSpeed + u × v + TKE × v−58805.9202.615
M.6u × SwimSpeed + u × v + u−58794.8213.613
M.7v × SwimSpeed + u + TKE × v−58615.8392.714
M.8v × SwimSpeed + u + TKE−58594.541413
M.9v× SwimSpeed + u−58550.1458.312
M.10TKE × SwimSpeed + u × v + TKE × v−58469.7538.715
M.11u × SwimSpeed + v + TKE−58444.8563.613
M.12u × SwimSpeed + v + TKE × v−58443.556514
M.13TKE × SwimSpeed + u × v + v−58431.7576.714
M.14u× SwimSpeed + v−58407.0601.512
M.15TKE × SwimSpeed + u + TKE × v−58370.2638.314
M.16v × u + SwimSpeed + TKE−58100.0908.413
M.17v× u + SwimSpeed−58079.3929.112
M.18v + SwimSpeed + u + TKE−58003.61004.812
M.19v + SwimSpeed + u−57969.91038.511
M.20v × SwimSpeed + TKE × v−57227.31781.213
M.21v× SwimSpeed + TKE−57181.21827.212
M.22v× SwimSpeed + v−57179.21829.211
M.23v× SwimSpeed−57179.21829.211
M.24TKE × SwimSpeed + TKE × v−57075.31933.113
M.25TKE × SwimSpeed + v + TKE−56994.12014.312
M.26v + SwimSpeed + TKE−56708.92299.511
M.27v + SwimSpeed−56706.82301.610
M.28u× SwimSpeed + TKE−56227.32781.112
M.29TKE × SwimSpeed + u + TKE−56197.12811.312
M.30TKE × SwimSpeed + TKE × u−56196.42812.113
M.31u× SwimSpeed + u−56018.22990.311
M.32u + SwimSpeed + TKE−55980.73027.711
M.33u + SwimSpeed−55778.13230.310
M.34v× u−44189.914818.611
M.35v× u + TKE−44189.214819.312
M.36v + u−44179.814828.610
Table 3. Estimated parameters of the best models for angular difference parameterized for the River Orkla site and for the River Mandal site [11]. Parameter estimates are presented for the fixed effect only, with the standard error in parentheses. All R2 are calculated by comparing observed values vs. predicted values for the models, and R2own70% is calculated by parameterizing the model on 70% of the individuals and compare the observed vs. predicted for the remaining 30% of the individuals. R2own is the R2 of angular difference when the model was parameterized and tested on the same river site, while the R2cross is the R2 for the models parameterized on one site and tested in the other site.
Dependent Variables per Sites:
OrklaMandalselva
Intercept−1.79 *** (0.06)−3.59 *** (0.22)
u3.09 *** (0.11)7.41 *** (0.78)
v−3.95 *** (0.11)−9.48 *** (0.74)
TKE−14.47 (15.09)391.75 *** (103.66)
Swimspeed8.164 *** (0.10)25.63 *** (0.51)
Swimspeed×TKE−273.85 *** (24.44)−5486.81 *** (190.10)
Swimspeed× u3.40 *** (0.15)21.48 *** (1.25)
TKE× u−187.06 *** (27.47)−3194.79 *** (384.44)
u× v−3.45 *** (0.22)−18.04 *** (2.58)
Observations21,06212,072
R2own0.840.84
R2own70%0.60 (0.07)0.40 (0.08)
R2cross0.260.21
*** Significant in p < 0.001.
Publisher’s Note: MDPI stays neutral with regard to jurisdictional claims in published maps and institutional affiliations.

