Article

Mapping Contaminant Plume at a Landfill in a Crystalline Basement Terrain in Ouagadougou, Burkina Faso, Using Self-Potential Geophysical Technique

1
Geoscience and Environment Laboratory, (LaGE), Department of Earth Sciences, Joseph KI-ZERBO University, 7021 Ouagadougou, Burkina Faso
2
Laboratory of Geoscience, Water and Environment, (LG2E-CERNE2D), Department of Earth Sciences, Faculty of Sciences, Mohammed V University of Rabat, Rabat 1014, Morocco
3
Laboratory of Geoscience, Faculty of Sciences, University Ibn Tofai of Kenitra, Kénitra 14000, Morocco
*
Author to whom correspondence should be addressed.
Water 2021, 13(9), 1212; https://doi.org/10.3390/w13091212
Submission received: 15 February 2021 / Revised: 27 March 2021 / Accepted: 7 April 2021 / Published: 28 April 2021
(This article belongs to the Special Issue Modeling and Prediction of Groundwater Contaminant Plumes)

Abstract

:
The delineation of pollution plumes generated by household waste landfills is not easy, particularly in the case of discontinuous or intricately extending water tables, such as those developed in a fractured crystalline bedrock context. In Ouagadougou (Burkina Faso), there are many uncontrolled landfills throughout the urban area. The water table, generally located between 3 and 10 m deep, is likely to be contaminated by the leachate from these landfills. More than 1000 measurements of spontaneous potential (self-potential), referenced by GPS, have been carried out on a landfill and its immediate surroundings to the south of the urban area. The geostatistical processing by analysis of variograms and correlograms highlights an adapted prospecting technique and reliable cartography. The response seems to be mainly due to the electrochemical component with hot spots within the landfill and a plume heading towards the North-East. The distribution of the spontaneous potential seems to be controlled, not by the topography of the site, but by the fracturing of the mother rock of dominant direction 15° N, and by the mother rock/saprolite contact. Thus, the plume does not flow to the market gardening just below the landfill but rather to a residential area where monitoring of the quality of the borehole water is required.

1. Introduction

For many countries, particularly the Sahelian countries, groundwater is a large proportion of the water resource, whether it is used to feed people or to irrigate food crops [1]. Paradoxically, it is in densely populated areas, and therefore where it is particularly prized, that this resource is most at risk, in terms of quantity, but above all in terms of quality. Household waste dumps, when they are not made up of watertight caissons, are often the source of pollution, as the fermentation of the waste generates leachates that flow down to the water table. The consequence is then a pollution of the aquifer with heavy metals, dissolved organic matter, nitrogenous forms, phosphorus and various micro-organisms, especially pathogens. In this context, the use of polluted water, for the irrigation of green vegetables, for bathing or even for drinking, is a major health issue. These issues have been the subject of numerous studies in many countries.
The mapping of the pollution plume is crucial for the knowledge of the contaminated areas and the natural attenuation under surveillance whose management techniques integrate the convective, dispersive and reactive aspects of pollutant transport in the water table. However, a relevant and reliable plume delineation requires access to the water table at a large number of points. Such mapping from boreholes and wells is very random and costly. This difficulty is compounded by the complexity of groundwater flow in space and time, as the extent and direction of a contaminant plume can change over the seasons [2,3]. Predicting the spread of a pollution plume is relatively easy to delineate, monitor and model in the context of aquifers in porous sedimentary environments. This is less the case when the aquifer is developed in a fractured crystalline medium, where underground flows present a strong spatial heterogeneity in relation to the structure of the fractures and the topography of the contact between saprolite and hard rock. Under these conditions, the mapping of the plume itself is difficult and few studies have attempted this exercise.
Among the non-intrusive geophysical techniques, several authors have tested the use of spontaneous potential, or self-potential (SP) [4,5,6,7,8] for mapping the pollution plume generated by household waste landfills [9,10,11]. SP is a passive source of information on the spatial distribution of groundwater parameters. It is based on electrical signals related to the different phenomena studied and detectable from the surface. The signal may have various origins, including a streaming potential due to the displacement of a mass of water with its ionic charges through porous matrix [4,12,13]. The streaming potential is generally correlated with landscape units [4,14]. It also includes an electro-redox component generated by the gradient of redox potential [8,15,16,17] that may prevail near landfills. However, the analysis of the signal can be complex. The nature of the waste (industrial, domestic or building materials) influences the polarity and intensity of the SP signal, with an anomaly of the order of −30 mV for industrial and domestic waste, and +50 to +75 mV for the building materials landfill [18]. Due to its sensitivity to gradients in redox conditions, several authors have observed low SP values (of about −30 to −50 mV) at the edge of a pollution plume associated with a landfill, i.e., at the margin of an anaerobic zone associated with the presence of bacteria [11,19]. The correlation of these negative SP anomalies with biogeochemical data has been verified by Naudet [15], using redox potential measurements on control piezometers. Although self-potential surveys are particularly suitable for the detection and delineation of pollution plumes, most of the studies focused on sedimentary environments in temperate climates [3,20], i.e., a context quite different from tropical fractured crystalline environments [12,21,22]. On crystalline basement, it is common to find that local flows do not follow the direction of regional flows due to irregular contacts between the parent rock and the saprolite, which generally accompany the lineaments or fracturing of the rock. Moreover, the granitic arenas generally developed on fractured crystalline bedrock are materials with low electrical conductivity and obtaining relevant self-potential values to delimit a pollution plume is delicate and requires a series of precautions.
This work is developed in the urban area of Ouagadougou, the capital of Burkina Faso. It is a tropical environment with a long dry season and is highly urbanised with a fractured crystalline lithology. Numerous landfills are present in the urban area which cause groundwater pollution that can become a major health problem for nearby dwellings, some of whose water supply comes from local boreholes. It is therefore necessary to identify and outline the areas that are polluted or likely to be polluted. The aim is to evaluate the efficiency of spontaneous potential measurements associated with a classical geostatistical treatment for the mapping of a pollution plume generated by a household waste dump.

2. Materials and Methods
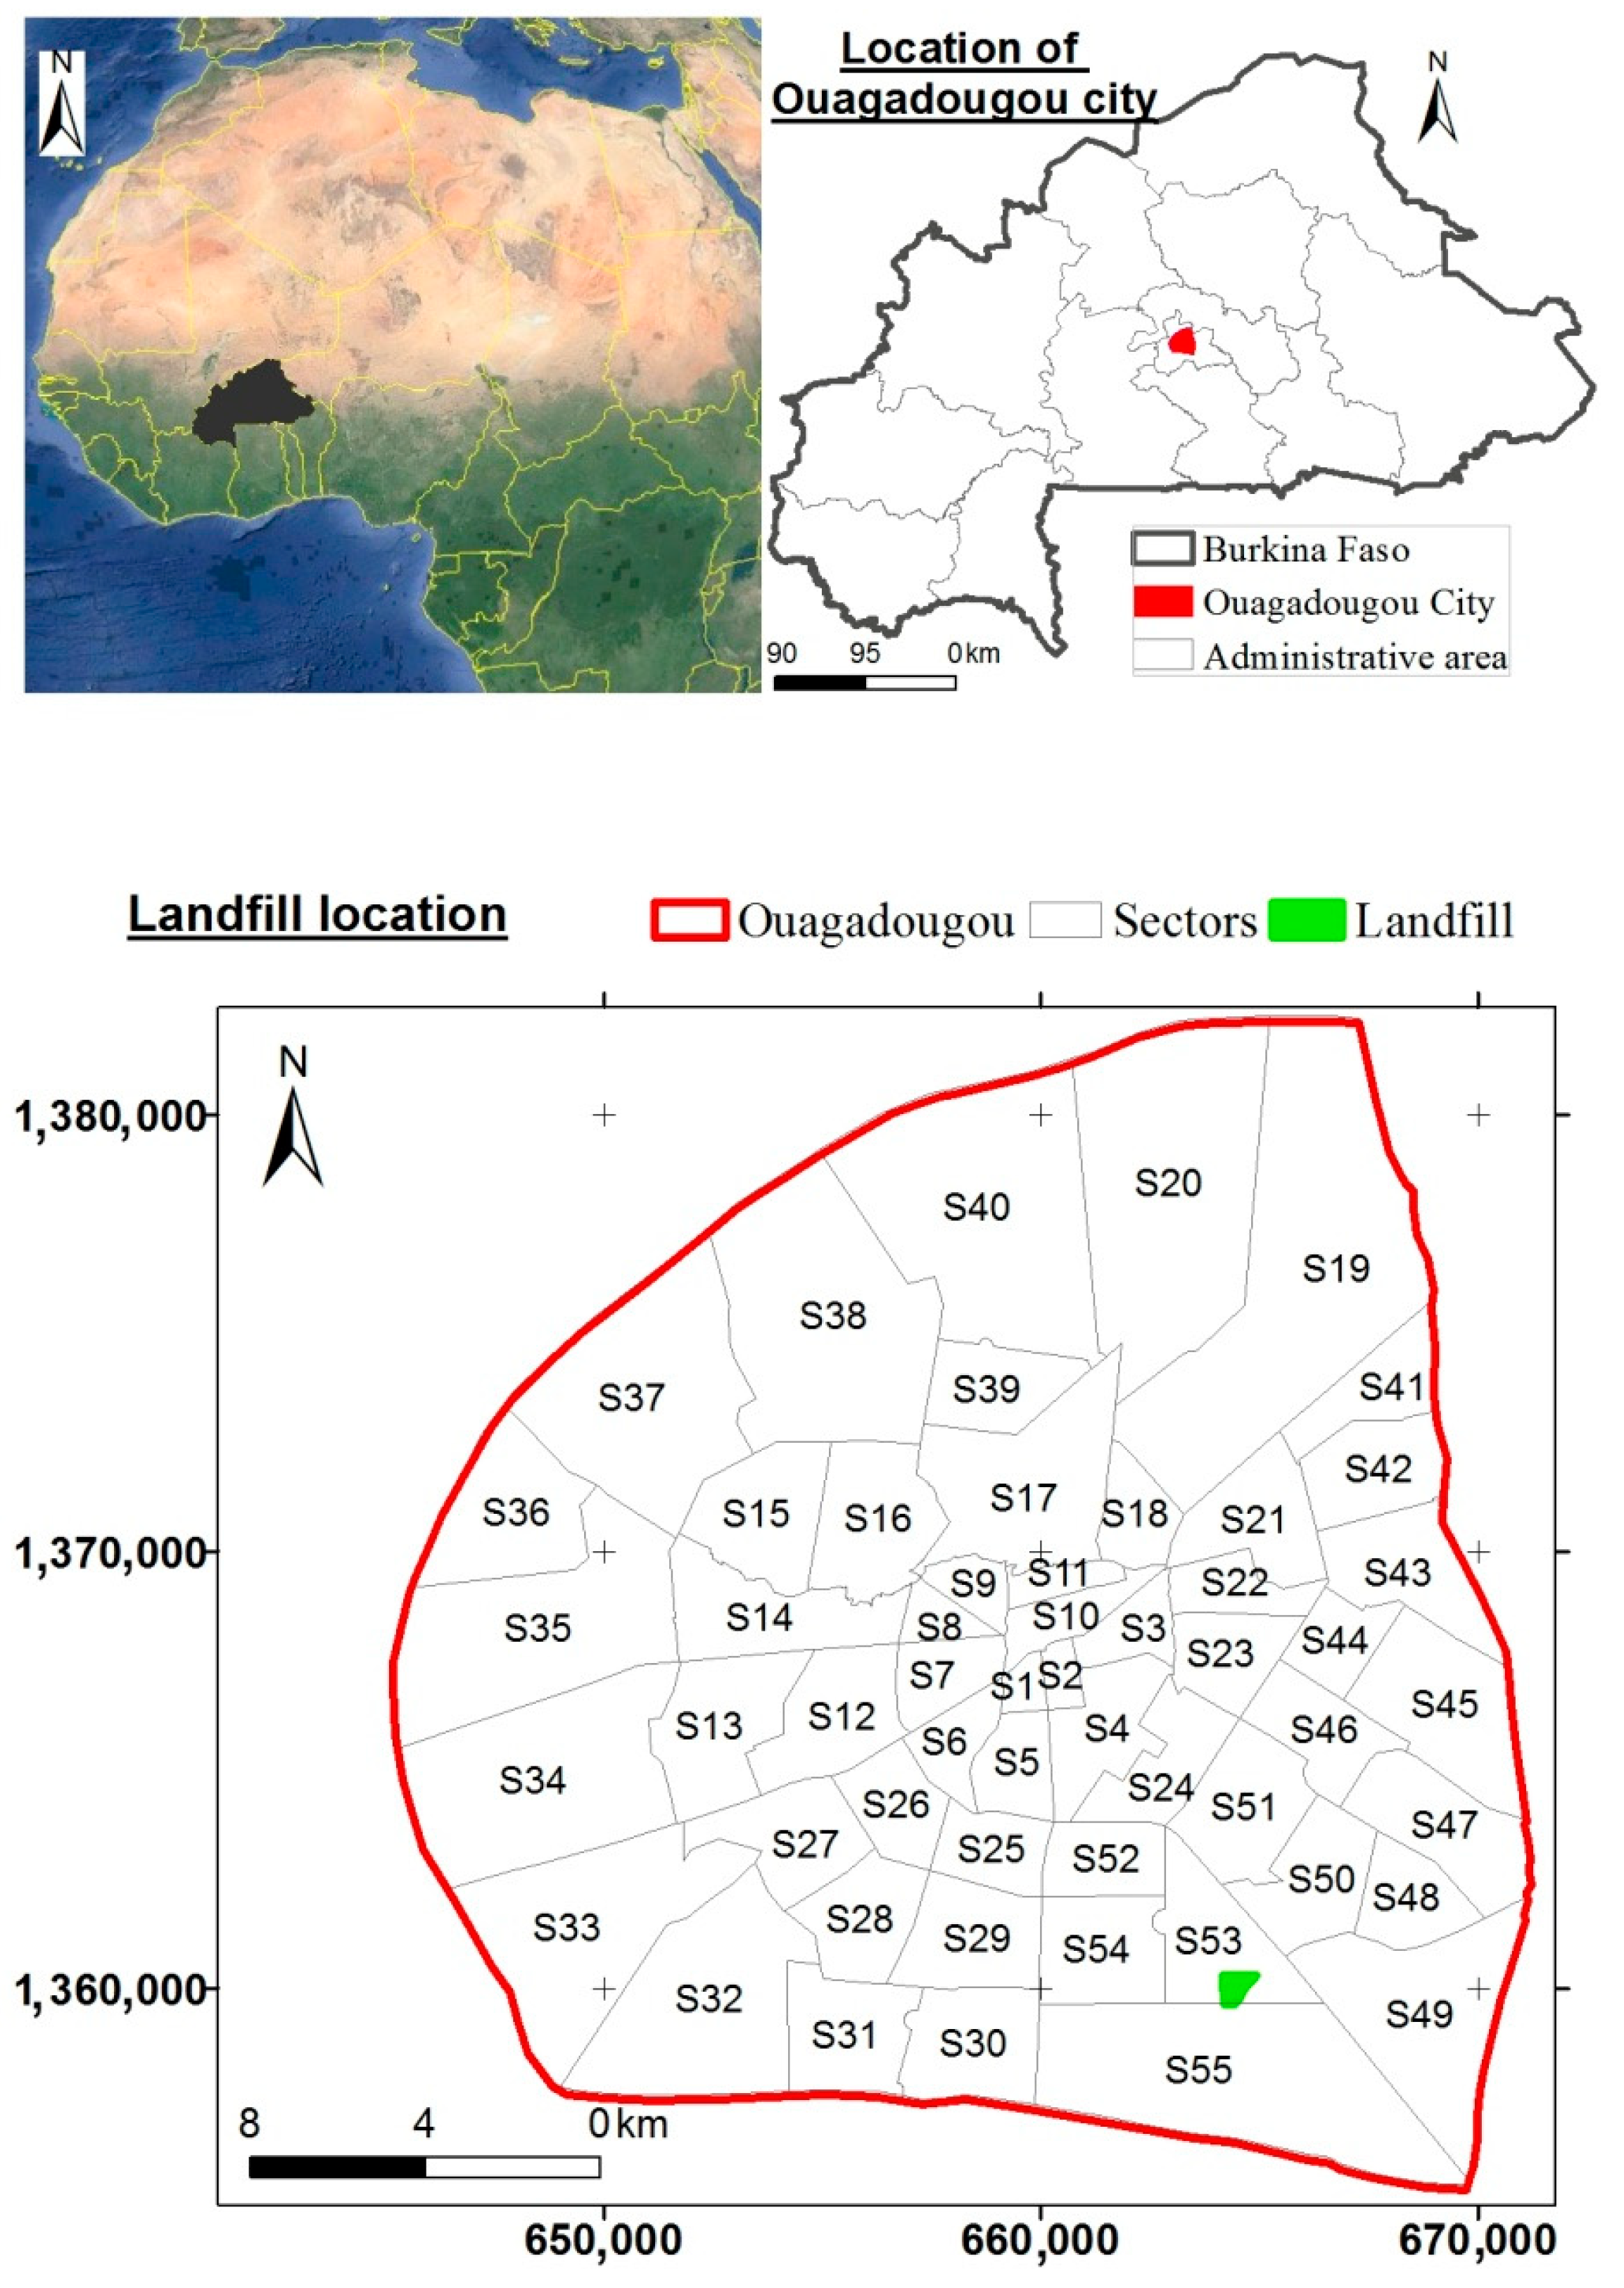
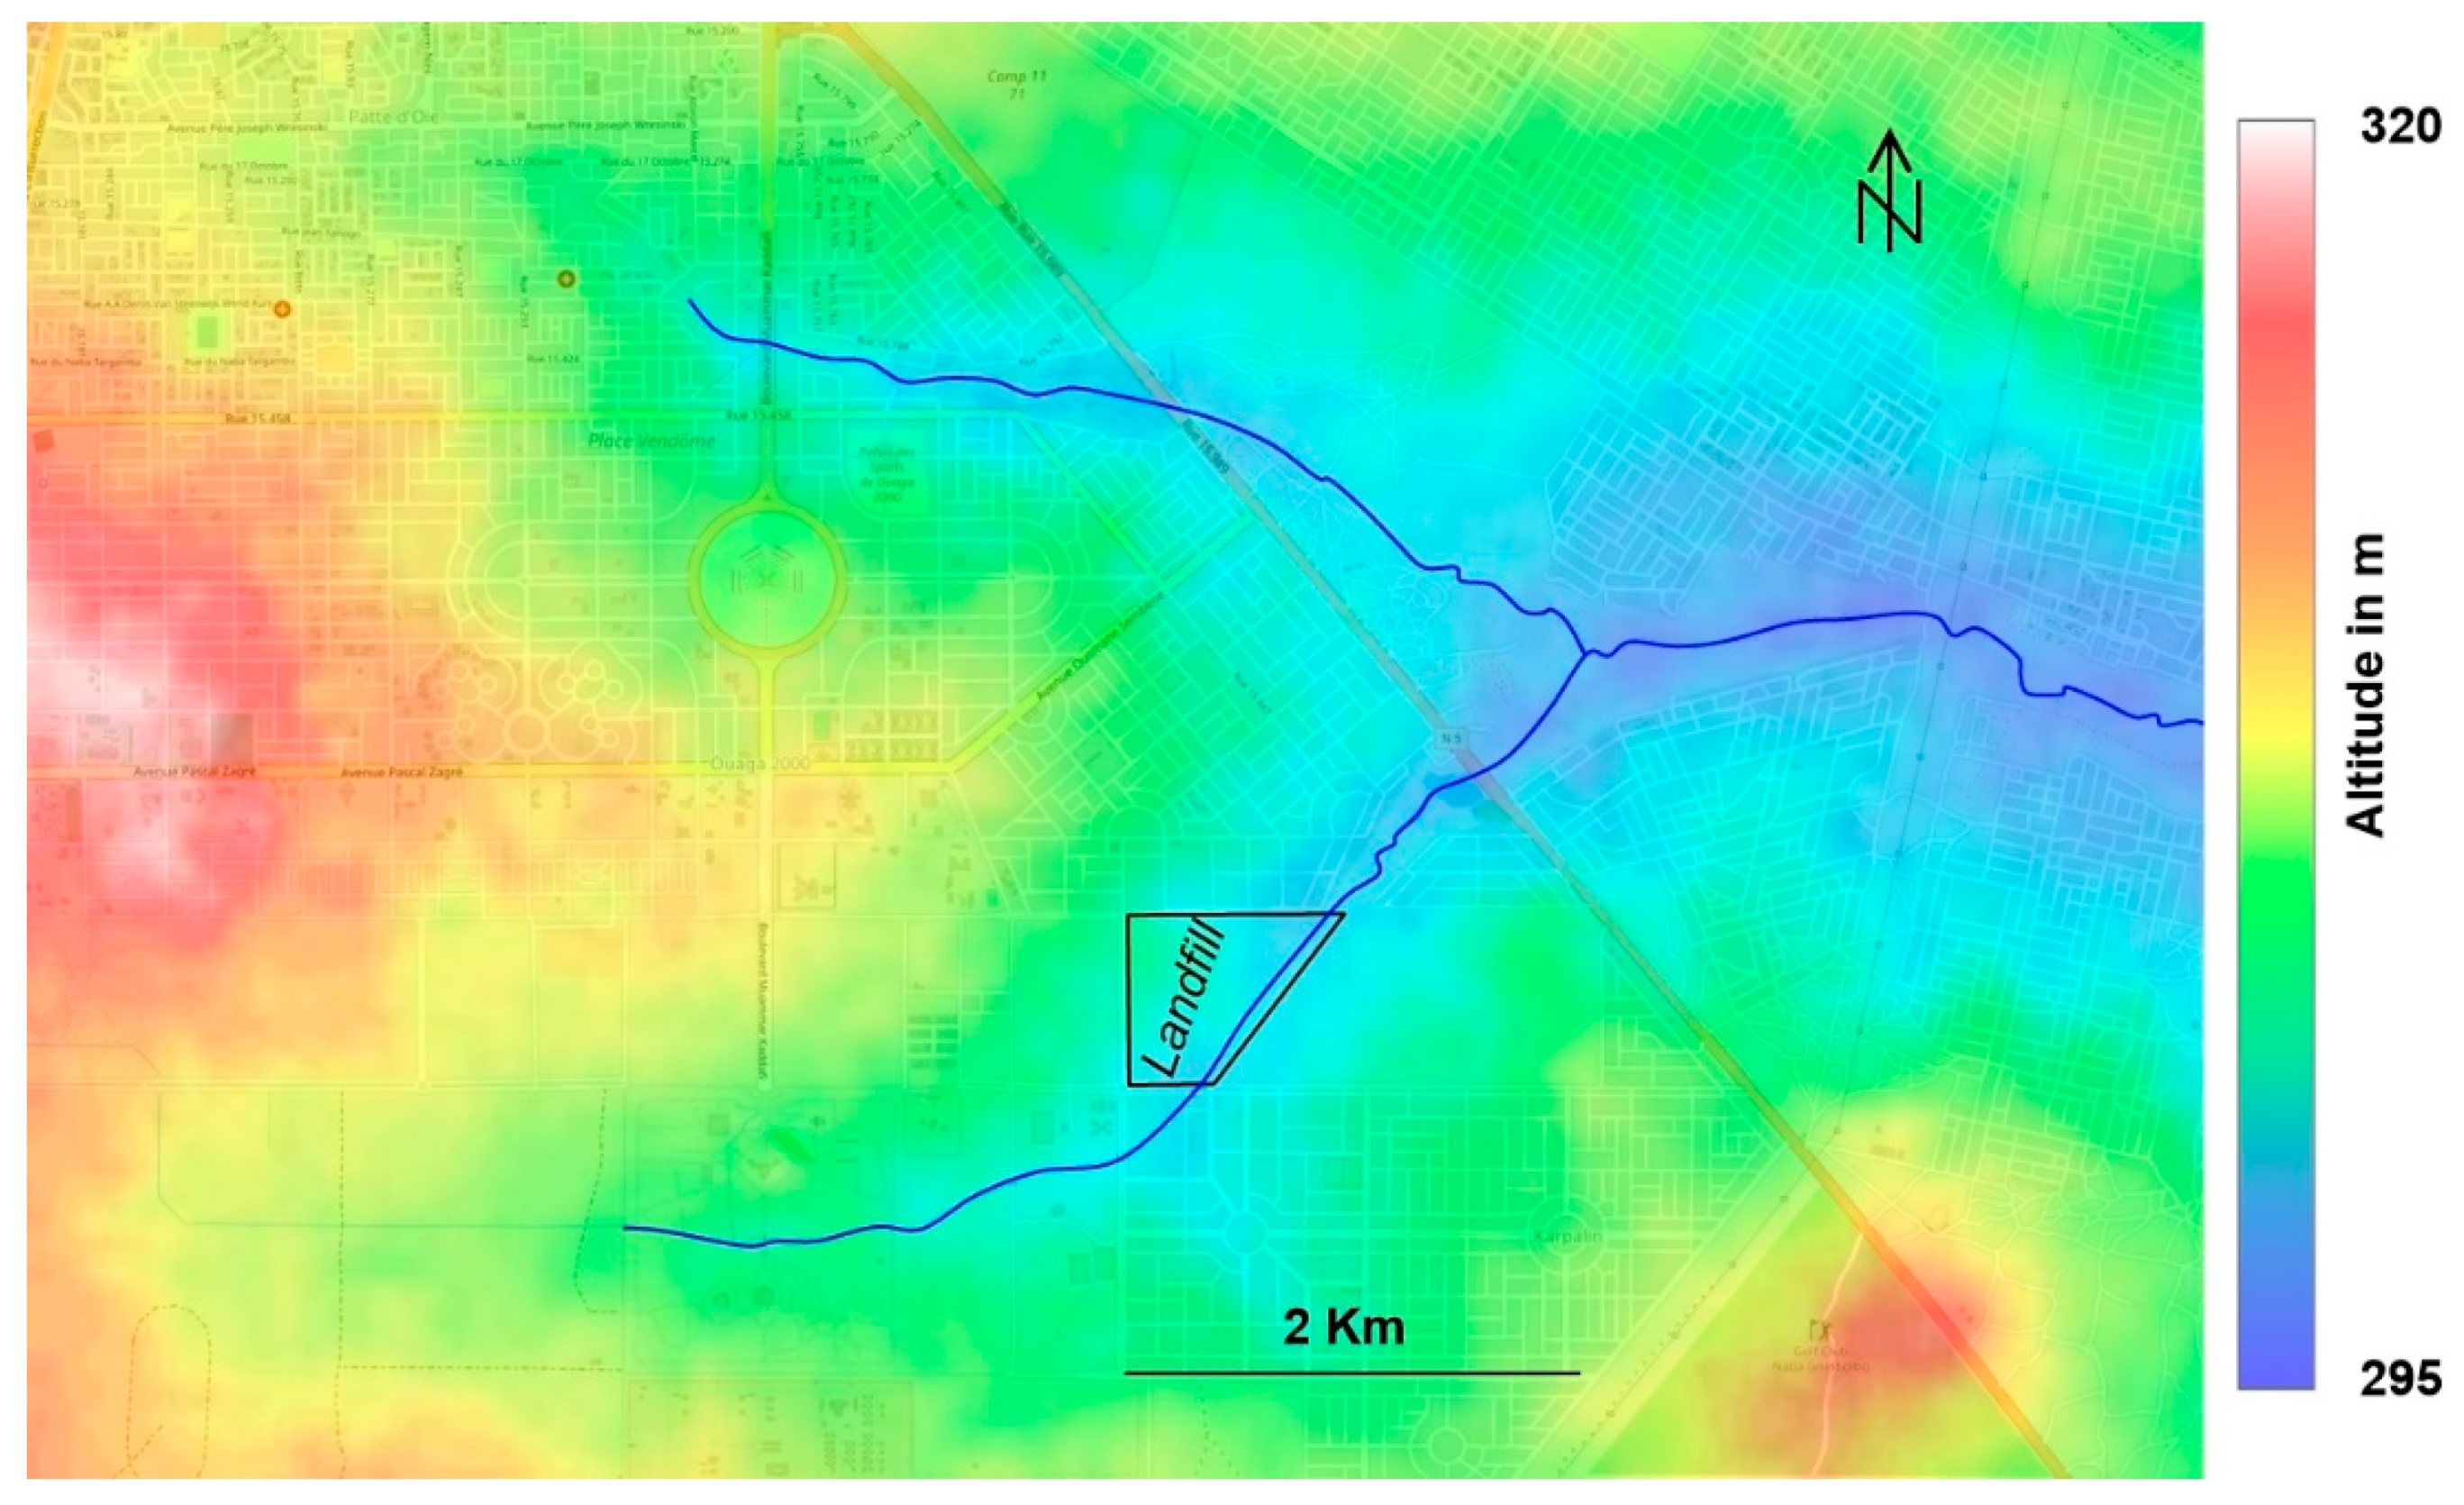
2.1. The Study Area

The area studied is located in the southern part of the city of Ouagadougou, Burkina Faso. The topography is fairly flat with an average altitude of around 300 m, a maximum range of less than 100 m (from 276 to 371 m) and gentle slopes generally between 0.6 and 1%. The climate is hot semi-arid (BSh) under Köppen-Geiger classification, and closely borders with tropical wet and dry (Aw). The rainy season stretches from May to September, followed by a cool dry season from October to February, and then a hot dry season in March and April.
The study site corresponds to an uncontrolled landfill and its immediate surroundings within the “Ouaga2000” district (Figure 1). This landfill, with a surface area of around 0.15 km2, mainly contains household waste, which is regularly carried by surface run-off to a low area during rainy periods. This lower area (Figure 2) consists of a depression with a temporary flow where the shallow water table (3 to 10 m deep over the studied area) is used for market gardening (Figure 3). Several unconsolidated sumps have been dug by the farmers and we were able to measure the height of the water table during our field campaigns. To the north of the landfill is a growing residential area. The geology of the study area is in line with that of the city of Ouagadougou, which is based on what is known as “the mole”, made up of a crystalline and crystallophyllian basement. Small outcrops can be observed in the south-east, north-west and west of the urban district [23,24]. More locally in our study area, the rock corresponds to a porphyroidal granodiorite and a tonalite granodiorite.

2.2. Self-Potential Data Acquisition
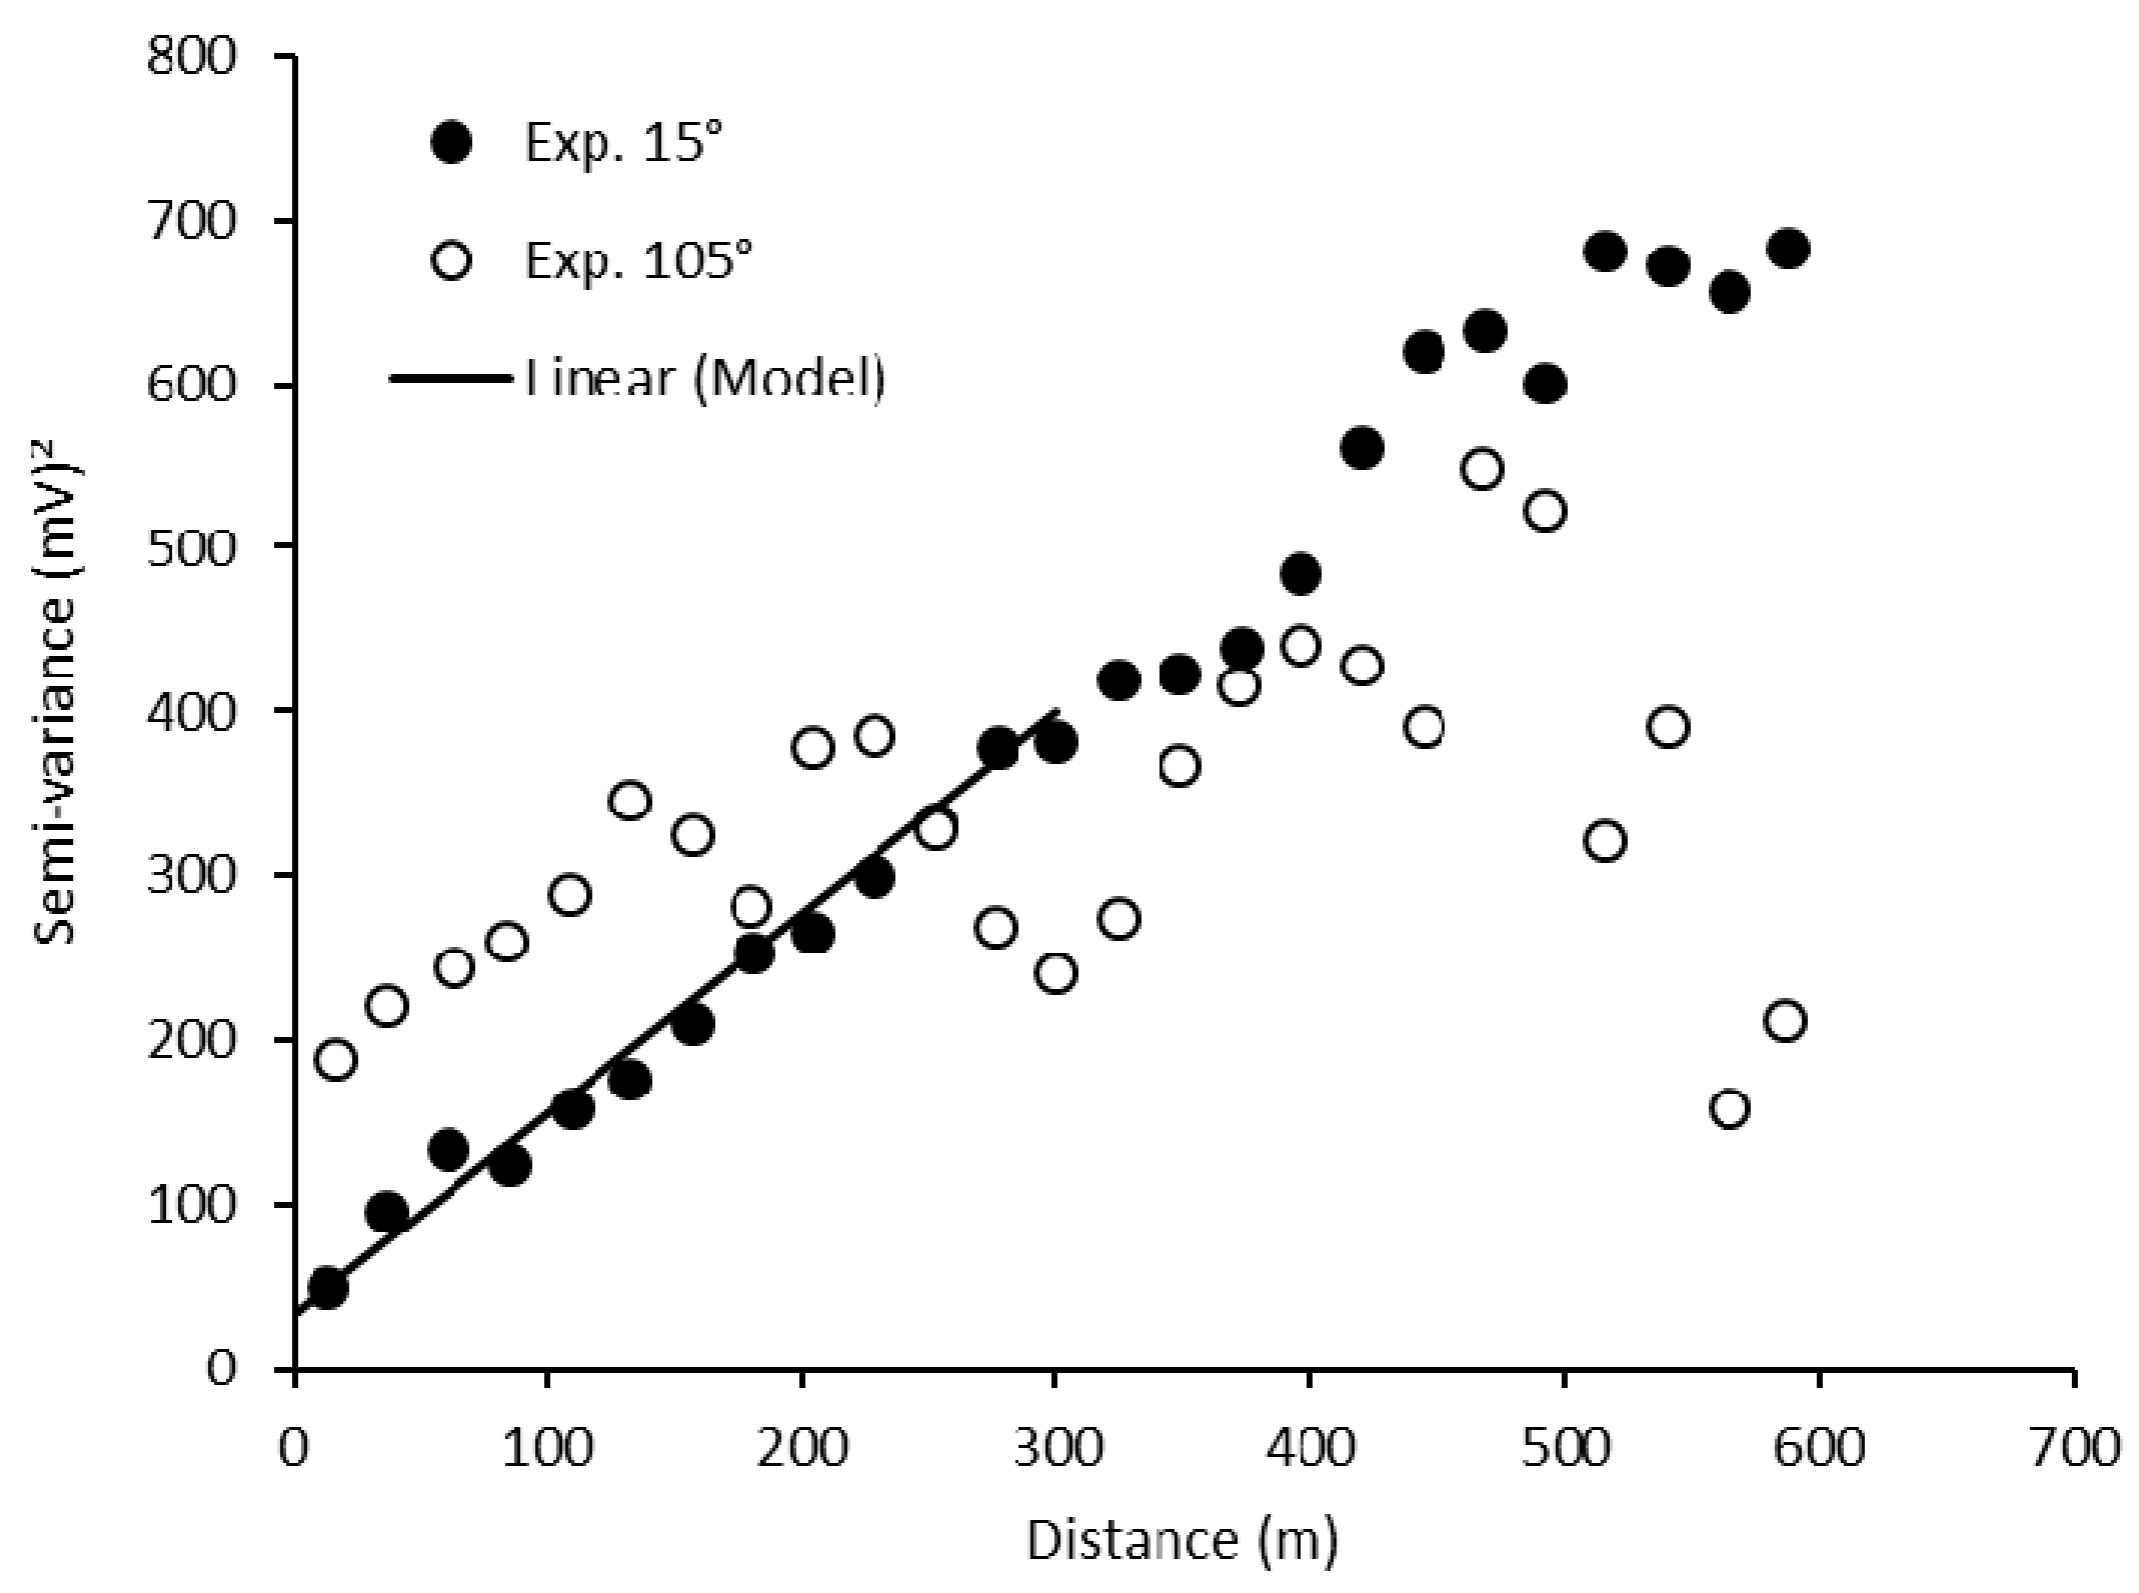
The equipment consists of two non-polarisable electrodes of the type “Petiau PMS9000”, Pb/PcCl2, NaCl [25], and a high input impedance voltmeter (Widewing Multimeter UNI-T UT71A). The electrodes are filled by a clay mud saturated by a fairly saline pore water with an acidic pH (between 4 and 5) to ensure a high degree of chemical stability of the electrode. The electrical contact between the inside of the electrode and the ground is achieved through a wood plug [26]. The high input impedance value of the voltmeter (10 MΩ) ensures good measurement quality in highly resistive arenas developed from the crystalline bedrock. One of the electrodes is fixed and the second is mobile, moved successively over the different points of the studied terrain. A flexible cable made up of two copper strands with a cross-section of 0.75 mm2 each connects the two electrodes. Due to the high resistivity of the soil, particular care has been taken to ensure the quality of the connections. To ensure good electrical contact between the soil and the inside of the electrode, the electrode is placed in a hole 8 cm in diameter and 10 cm deep, then filled with mud made from the material removed with a hand auger and slightly mineralised water. The measurement is noted when the measured potential has stabilised and only oscillates in a range below 2 mV and the quality of the electrical continuity of the cable has been checked. Each measurement point is georeferenced using GPS, and the coordinates used in this work are UTM coordinates, in metres. The measurements were carried out in 2 campaigns. The first, lasting one week, was carried out in June 2020 after the first rains of the wet season and concerned measurements within the landfill. The second campaign of 5 days was carried out in October 2020, i.e., about 3 weeks after the beginning of the dry season, on the entire periphery of the landfill and in the talweg in the eastern border occupied by market gardening. In total, 13 transects were carried out to surround and cover the area of the landfill, with a measurement approximately every 3 to 4 m. Due to the presence of numerous obstacles within the landfill, the distance between transects is not constant, but as far as possible, the distance between transects has been kept below 150 m.

2.3. Data Treatment

As a plume delineation map has to use an extrapolation of the data between measurement points and between transects, the data was subjected to a geostatistical analysis in order to check whether the measurement density was sufficient and whether the values obtained showed a certain structure over the study area. A normality test showed that the self-potential data may not be assumed to have a normal distribution. However, the log-transformation does not allow a significant improvement. Therefore, the calculation was performed on the raw self-potential values without any data transformation. The semi-variograms and correlograms of the self-potential (SP) measurements were obtained from the respective formulae:
γ ( h ) = 1 2 N ( h ) i = 1 N ( h ) ( z ( x i ) z ( x i + h ) ) 2 ,
and
C ( h ) = 1 N ( h ) i = 1 N ( h ) ( z ( x i ) z ( x i + h ) m ) ,
where N(h) is the number of pairs of points and z(xi) and z(xi+h) are the raw SP value at xi and xi+h, and m is the mean value. Raw and directional variograms with a 15° rotation step were calculated to detect an eventual anisotropy in the self-potential value distribution. Two directions were retained, corresponding to the maximization of the differences between the directional variograms and correlograms and the orthogonal direction. The kriged map was built from a model fitted on the sample variogram using the Surfer software (Golden Software).

3. Results

The location of the 1086 spontaneous potential measurement points along the 13 transects is shown in Figure 3. The measurements cover the entire landfill site and its periphery, as far as the depression to the east, which is valued by market gardening. The distribution of SP values over the surveyed area is shown in Figure 4. The range of values is quite wide, from −58 mV to 106 mV, with a bimodal distribution. There is a main mode centred on the 11 mV value, and a second, less abrupt shoulder centred on 40 mV.
The high number of observations allows the reliable calculation of correlograms and variograms, including directional variograms, which require a larger number of measuring points. Maximizing the differences between the directional variograms and correlograms shows an anisotropy in the distribution of self-potential values, with the highest and smallest differences obtained for orthogonal directions at North 15° (±15°) and North 105 (±15°) degrees, respectively (Figure 5). A linear model with a slight nugget effect can approximate the experimental 15° N-directional variogram. The sill is reached for a range of about 450 m.
For the same direction 15° N, the correlogram shows a progressive decrease in the autocorrelation coefficient between 20 and 140 m, a certain stabilisation between 140 and 350 m and a decrease until a cancellation around 400 m (Figure 6). Beyond this distance the autocorrelation coefficient is negative, underlining that at great distances there is an opposition between zones with high potential and zones with very negative potential on the study site. The anisotropy in the distribution of self-potential values was taken into consideration for kriging, the result of which is shown in Figure 7.
The potential map shows a strong local heterogeneity, with a distribution of low values (<20 mV) in the form of a triangle widening towards the north, i.e., towards the residential area. The market gardening area downslope from the landfill corresponded to a zone with a strong gradient of values, but mostly showed high potential, as did the southern and western edges of the landfill. Several spots with negative values can be observed within the landfill, the lowest values being mainly along the northern border.
The few observations of the water table height from the market garden pits are shown in Figure 7. A regular gradient of around 1% towards the north or north-east is observed.

4. Discussion

4.1. Reliability of Data and Mapping

Self-potential measurements along the transects were made every 3 or 4 m. For this short distance, the variogram shows a nugget effect, partly due to the measurement oscillating in a range of less than 2 mV during the reading. In addition, the distance between transects was kept below 150 m. For this value, the variogram shows a half variance of about 230 mV2, which is about one third of the value of the sill (~700 mV2) reached for a range of about 450 m. It can be concluded that the spacing is at the limit, but sufficient for interpolation of values between transects [27]. On the correlogram, the correlation coefficient zeroes for a value of the order of 400 m. All these results indicate that the density of measurements allows extrapolation between transects and therefore allows fairly reliable mapping of the spontaneous potential over the prospected area. This geostatistical processing enables a critical look to be taken a posteriori at the methodological choices of the data acquisition plan. For the subsequent monitoring of a landfill located in a similar lithological environment, it would seem possible to space the measurement points 10 or even 15 m apart, or to bring the measurement lines closer together.

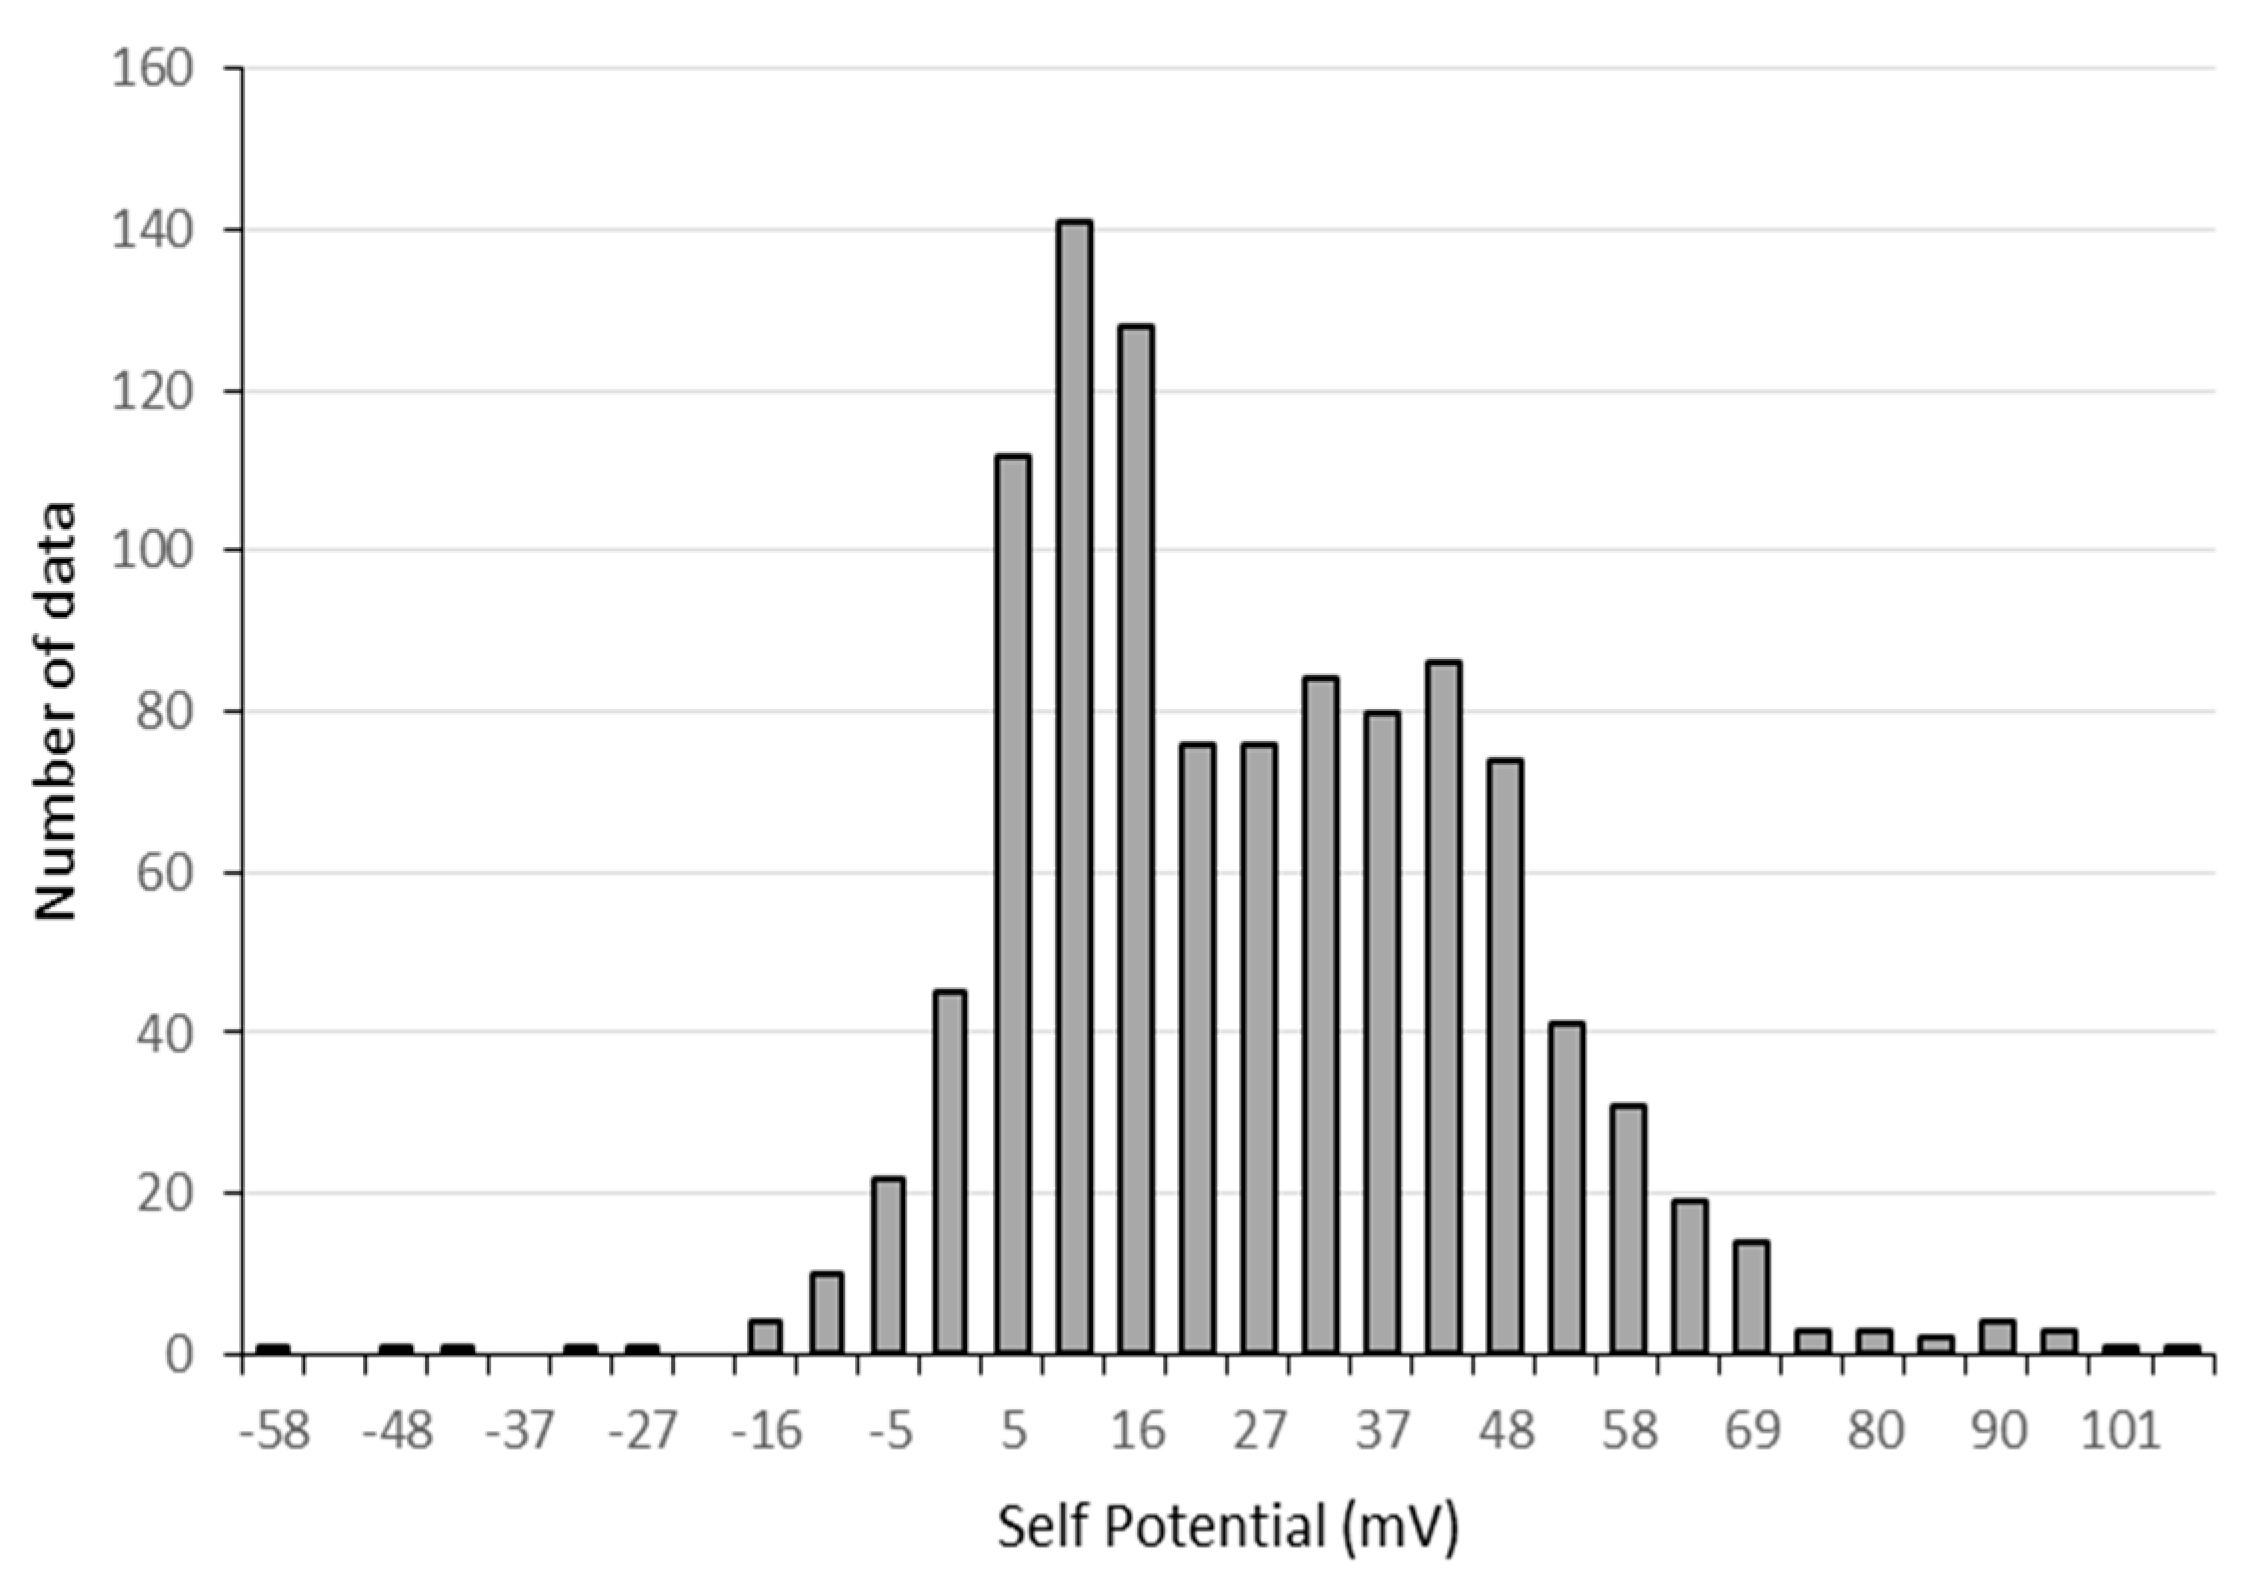
4.2. Structure of the Distribution of Self-Potential Values

Two main processes may be responsible for the low SP values; on the one hand an electrokinetic component [28] linked to charge transfer processes (ionic transfer) in porous media [29], and on the other hand an electrochemical component [16,19] linked to oxidation-reduction reactions or temperature gradients [6]. The electrokinetic component is expected on the eastern edge of the discharge within the depression, which corresponds, a priori, to an internal drainage towards the regional network. In this natural drainage sector, the flow of ionic charges within the porous material is expected to create negative SP anomalies. However, in this sector, the values are positive and high, similar to what can be measured on the southern and western edges of the landfill. This landscape unit seems not to be very active in term of drainage and the electrokinetic component is low at this study site. It can therefore be assumed that most of the low values, i.e., below 15 mV, are attributable to the electrochemical component, and that the drawn contour is that of a pollution plume induced by the decomposition of the waste, partly organic, and the associated redox condition gradients. In this context, the intensity and nature of the redox processes produced by biological activity induce SP anomalies directly at the vertical [30]. The contour thus highlights a pollution plume oriented north or north-east, towards the residential area, a priori, impacted by the pollution. There is therefore a major health risk for the boreholes developed in this sector.
Although located just below the landfill site, the market gardening seems to be relatively unaffected by the extent of the plume. The pollution plume therefore does not appear to be directed by the surface topography, which ultimately only influences the transfer of waste by runoff during rainy events. The direction of the plume towards the north-northeast is, on the one hand, in line with the main direction of the lineaments and fractures of the rock over the Ouagadougou area as mentioned by Ouandaogo-Yaméogo [24] with an orientation mainly concentrated between 0° and 30° (Figure 8). On the other hand, it is in line with the hydraulic gradient observed in the local water table (Figure 7) from the market gardener sumps. This plume has a different architecture from the pollution plumes generally detected in more homogeneous sedimentary environments, where a preferential flow axis is observed, together with a more or less regular gradient towards the edges. Here the plume does not show a generalised flow, but seems to highlight several spots within a preferential flow towards the north-east. The map drawn up therefore probably shows pollution distribution according to complex preferential flows linked to the characteristics of the bedrock, i.e., a very irregular contact between rock and saprolite that is controlled by the main structural lineaments and fractures.
The density of the measurements also reveals a series of hot spots within the landfill. This heterogeneity within a landfill has already been observed by several authors [6,16]. A temporal monitoring should make it possible to verify that these hot spots are fleeting, corresponding to recent additions of MO-rich detritus in a very active fermentation phase, as it seemed to us during the measurement campaigns. These hot spots are the genesis points of the leachates, which then flow towards the water table.

5. Conclusions and Future Directions

The work of delineating a pollution plume from a landfill site in the urban area of Ouagadougou comes up against conditions that are not very favourable for measuring the spontaneous potential, due to the high resistivity of the materials, and the depth of both the water table and the probable pollution plume. Dense measurements (approximately every 5 m) along transects spaced at 150 m intervals give relevant results, although geostatistical analysis informed that less dense measurements (15 m) but slightly less widely spaced transects (100 m) should be recommended for further studies on other landfills in a similar environment. The nugget effect observed on the variogram can be attributed to the oscillation of the potential during the measurement. The high density of the spontaneous potential measurements allows the delineation of the pollution plume with a good degree of detail, but it is a cumbersome technique to implement and not applicable to time-lapse monitoring, at least with such a density. It does however provide the information necessary to optimise coupling with other geophysical techniques such as time-lapse ERT [3,20]. In order to obtain similar information by direct access to the water table, many expensive boreholes would have been necessary, which validates the non-intrusive geophysical technique of measuring spontaneous potential on this site. Contrary to what was anticipated, the plume does not take the direction of the depression adjacent to the landfill. The flow of pollutants is not controlled by the topography of the site. The plume extends towards N-NE, which corresponds to the main fracturing direction of the crystalline bedrock. It is quite patchy and differs from the plumes generally detected in sedimentary environments. Its shape is probably driven to the morphology of the bedrock/saprolite contact, which generates heterogeneous flows, characteristic of fractured environments. This aspect will have to be confronted with other polluted sites in fractured environments. In addition, although not evident from our data, it is likely that contamination is affecting the deep aquifer within the fractured crystalline basement. From a strictly sanitary point of view, although the market gardening crops near the landfill site seem to be affected only by the detritus carried by the surface run-off in the rainy season, the water table under the residential area located to the NE of the landfill site is directly impacted by the leachate flows and the quality of the borehole water must be monitored there. This result, which is highly dependent on the local bedrock structure, is difficult to transpose to other landfills, even within the agglomeration, where similar studies should be carried out to provide information on the groundwater flow from each polluted site.

Author Contributions

Conceptualization, A.A.B. and S.Y.; methodology, M.A. and M.T.; software, I.M.; validation, A.T. and S.N.; formal analysis, M.T.; investigation, A.A.B.; data curation, A.A.B.; writing—original draft preparation, A.A.B.; writing—review and editing, A.A.B., S.Y. and A.T.; visualization, M.J., H.L. and A.F.; supervision, S.N.; project administration, S.Y. All authors have read and agreed to the published version of the manuscript.

Funding

This research received no external funding.

Data Availability Statement

Data sharing is not applicable to this article.

Conflicts of Interest

The authors declare no conflict of interest.

References

  1. Sako, A.; Bamba, O.; Gordio, A. Hydrogeochemical processes controlling groundwater quality around Bomboré gold mineralized zone, Central Burkina Faso. J. Geochem. Explor. 2016, 170, 58–71. [Google Scholar] [CrossRef]
  2. El Mouine, Y.; El Hamdi, A.; Morarech, M.; Kacimi, I.; Touzani, M.; Mohsine, I.; Tiouiouine, A.; Ouardi, J.; Zouahri, A.; Yachou, H.; et al. Landfill Pollution Plume Survey in the Moroccan Tadla Using Spontaneous Potential. Water 2021, 13, 910. [Google Scholar] [CrossRef]
  3. Clément, R.; Oxarango, L.; Descloitres, M. Contribution of 3-D time-lapse ERT to the study of leachate recirculation in a landfill. Waste Manag. 2011, 31, 457–467. [Google Scholar] [CrossRef] [PubMed]
  4. Gallas, J.D.F. Método Do Potencial Espontâneo (SP) Uma revisão sobre suas causas, seu uso histórico e suas aplicações atuais. Rev. Bras. Geofísica 2005, 23, 133–144. [Google Scholar] [CrossRef] [Green Version]
  5. Gallas, J.D.F.; Taioli, F.; Malagutti Filho, W. Induced polarization, resistivity, and self-potential: A case history of contamination evaluation due to landfill leakage. Environ. Earth Sci. 2011, 63, 251–261. [Google Scholar] [CrossRef]
  6. Revil, A.; Jardani, A. The Self-Potential Method: Theory and Applications in Environmental Geosciences; Cambridge University Press: New York City, NY, USA, 2013; ISBN 978-1-107-01927-0. [Google Scholar]
  7. Jouniaux, L.; Maineult, A.; Naudet, V.; Pessel, M.; Sailhac, P. Review of self-potential methods in hydrogeophysics. Comptes Rendus Geosci. 2009, 341, 928–936. [Google Scholar] [CrossRef] [Green Version]
  8. Schüring, J.; Schlieker, M.; Hencke, J. Redox Fronts in Aquifer Systems and Parameters Controlling their Dimensions. In Redox: Fundamentals, Processes and Applications; Schüring, J., Schulz, H.D., Fischer, W.R., Böttcher, J., Duijnisveld, W.H.M., Eds.; Springer: Berlin/Heidelberg, Germany, 2000; pp. 135–151. ISBN 978-3-662-04080-5. [Google Scholar]
  9. Senos Matias, M.; Marques da Silva, M.; Ferreira, P.; Ramalho, E. A geophysical and hydrogeological study of aquifers contamination by a landfill. J. Appl. Geophys. 1994, 32, 155–162. [Google Scholar] [CrossRef]
  10. Giang, N.V.; Kochanek, K.; Vu, N.T.; Duan, N.B. Landfill leachate assessment by hydrological and geophysical data: Case study NamSon, Hanoi, Vietnam. J. Mater. Cycles Waste Manag. 2018, 20, 1648–1662. [Google Scholar] [CrossRef]
  11. Weigel, M. Self-potential surveys on waste dumps theory and practice. In Detection of Subsurface Flow Phenomena; Merkler, G.-P., Militzer, H., Hötzl, H., Armbruster, H., Brauns, J., Eds.; Springer: Berlin/Heidelberg, Germany, 1989; pp. 109–120. [Google Scholar]
  12. Revil, A.; Cary, L.; Fan, Q.; Finizola, A.; Trolard, F. Self-potential signals associated with preferential ground water flow pathways in a buried paleo-channel. Geophys. Res. Lett. 2005, 32. [Google Scholar] [CrossRef] [Green Version]
  13. Mao, D.; Revil, A.; Hort, R.D.; Munakata-Marr, J.; Atekwana, E.A.; Kulessa, B. Resistivity and self-potential tomography applied to groundwater remediation and contaminant plumes: Sandbox and field experiments. J. Hydrol. 2015, 530, 1–14. [Google Scholar] [CrossRef] [Green Version]
  14. Touzani, M. Etude D’impact de Décharge d’oum Azza sur les Ressources en Eaux Souterraines du Secteur Oum Azza-Ain EL Aouda (Région RABAT-MAROC); Mohamed V University: Rabat, Morocco, 2020. [Google Scholar]
  15. Naudet, V.; Revil, A.; Rizzo, E.; Bottero, J.-Y.; Bégassat, P. Groundwater redox conditions and conductivity in a contaminant plume from geoelectrical investigations. Hydrol. Earth Syst. Sci. 2004, 8, 8–22. [Google Scholar] [CrossRef]
  16. Naudet, V.; Revil, A.; Bottero, J.-Y.; Bégassat, P. Relationship between self-potential (SP) signals and redox conditions in contaminated groundwater. Geophys. Res. Lett. 2003, 30. [Google Scholar] [CrossRef]
  17. Atekwana, E.A.; Slater, L.D. Biogeophysics: A new frontier in Earth science research. Rev. Geophys. 2009, 47. [Google Scholar] [CrossRef]
  18. Hämmann, M.; Maurer, H.R.; Green, A.G.; Horstmeyer, H. Self-Potential Image Reconstruction: Capabilities and Limitations. J. Environ. Eng. Geophys. 1997, 2, 21–35. [Google Scholar] [CrossRef]
  19. Nyquist, J.E.; Corry, C.E. Self-potential: The ugly duckling of environmental geophysics. Lead. Edge 2002, 21, 446–451. [Google Scholar] [CrossRef]
  20. Audebert, M.; Clément, R.; Moreau, S.; Duquennoi, C.; Loisel, S.; Touze-Foltz, N. Understanding leachate flow in municipal solid waste landfills by combining time-lapse ERT and subsurface flow modelling—Part I: Analysis of infiltration shape on two different waste deposit cells. Waste Manag. 2016, 55, 165–175. [Google Scholar] [CrossRef] [PubMed]
  21. Perrier, F.; Froidefond, T. Electrical conductivity and streaming potential coefficient in a moderately alkaline lava series. Earth Planet. Sci. Lett. 2003, 210, 351–363. [Google Scholar] [CrossRef]
  22. Revil, A.; Naudet, V.; Nouzaret, J.; Pessel, M. Principles of electrography applied to self-potential electrokinetic sources and hydrogeological applications. Water Resour. Res. 2003, 39, 1–15. [Google Scholar] [CrossRef]
  23. Ouandaogo-Yameogo, S.; Blavoux, B.; Nikiema, J.; Savadogo, A. Caractérisation du fonctionnement des aquifères de socle dans la région de Ouagadougou à partir d’une étude de la qualité chimique des eaux. Rev. des Sci. l’eau/J. Water Sci. 2013, 26, 173–191. [Google Scholar] [CrossRef] [Green Version]
  24. Ouandaogo-Yaméogo, S. Ressources en eau souterraine du centre urbain de Ouagadougou au Burkina Faso, qualité et vulnérabilité. Ph.D. Thesis, Avignon University, Avignon, France, 2008. [Google Scholar]
  25. Petiau, G. Second Generation of Lead-lead Chloride Electrodes for Geophysical Applications. Pure Appl. Geophys. 2000, 157, 357–382. [Google Scholar] [CrossRef]
  26. Jougnot, D.; Linde, N. Self-Potentials in Partially Saturated Media: The Importance of Explicit Modeling of Electrode Effects. Vadose Zone J. 2013, 12, vzj2012.0169. [Google Scholar] [CrossRef] [Green Version]
  27. Barbiero, L.; Cunnac, S.; Mané, L.; Laperrousaz, C.; Hammecker, C.; Maeght, J.L. Salt distribution in the Senegal middle valley analysis of a saline structure on planned irrigation schemes from N’Galenka creek. Agric. Water Manag. 2001, 46, 201–213. [Google Scholar]
  28. Jardani, A.; Revil, A.; Barrash, W.; Crespy, A.; Rizzo, E.; Straface, S.; Cardiff, M.; Malama, B.; Miller, C.; Johnson, T. Reconstruction of the water table from self-potential data: A bayesian approach. Ground Water 2009, 47, 213–227. [Google Scholar] [CrossRef] [PubMed]
  29. Aubert, M.; Atangana, Q.Y. Self-Potential Method in Hydrogeological Exploration of Volcanic Areas. Groundwater 2018, 34, 1010–1016. [Google Scholar] [CrossRef]
  30. Revil, A.; Mendonça, C.A.; Atekwana, E.A.; Kulessa, B.; Hubbard, S.S.; Bohlen, K.J. Understanding biogeobatteries: Where geophysics meets microbiology. J. Geophys. Res. Biogeosci. 2010, 115. [Google Scholar] [CrossRef] [Green Version]
Figure 1. Location of the landfill on sector 53 of the Ouagadougou City, Burkina Faso (WGS84-UTM coordinates, zone 30N).
Water 13 01212 g001
Figure 2. Location of the landfill on the urban background and the topographical framework. Blue lines denote the axis of the major depressions.
Water 13 01212 g002
Figure 3. Location of the self-potential measurements sites (WGS84-UTM coordinate, zone 30N).
Water 13 01212 g003
Figure 4. Bimodal histogram of the self-potential values distribution.
Water 13 01212 g004
Figure 5. Experimental directional variogram at 15° and 105°, and fitted linear model.
Water 13 01212 g005
Figure 6. Directional correlograms at 15° and 105°.
Water 13 01212 g006
Figure 7. Kriged map of the distribution of self-potential values over the prospected area, major bedrock lineament direction, and water level high.
Water 13 01212 g007
Figure 8. Rose diagram of the lineaments in the Ouagadougou sector. The directions shown in red (N 15) and blue (N 105) correspond to those obtained when maximising and minimising differences of the directional variograms, respectively (modified from Ouandaogo-Yaméogo (2008) [24]).
Water 13 01212 g008
Publisher’s Note: MDPI stays neutral with regard to jurisdictional claims in published maps and institutional affiliations.

