Article

Intestinal Microbial Ecology and Fillet Metal Chemistry of Wild Grey Mullets Reflect the Variability of the Aquatic Environment in a Western Mediterranean Coastal Lagoon (Santa Giusta, Sardinia, Italy)

1
AGRIS-Sardegna, Agricultural Research Agency of Sardinia, Bonassai, 07100 Sassari, Italy
2
Department of Architecture, Design and Urban Planning, University of Sassari, 07100 Sassari, Italy
*
Author to whom correspondence should be addressed.
Water 2021, 13(6), 879; https://doi.org/10.3390/w13060879
Submission received: 26 January 2021 / Revised: 17 March 2021 / Accepted: 19 March 2021 / Published: 23 March 2021

Abstract

:
Fish populations play an active role in the maintenance of aquatic ecosystems biodiversity. Their intestinal microbiota and fillet chemistry depend on abiotic and biotic factors of the water environments that they inhabit. The present study investigated the grey mullets’ gut microbiota from a transitional aquatic ecosystem (Santa Giusta Lagoon, Sardinia, Italy) by a multidisciplinary approach which refers the results of (1) gut cultivable microbiota analyses (MA), (2) the trace metal assessment of fish muscle (TM), (3) the physico-chemical water monitoring (PC). MA detected the greatest number of total aerobic heterotrophic bacteria, Enterobacteriaceae and coliforms in Autumn (mean values 1.3 × 10⁵, 2.4 × 10⁴, 1.1 × 10⁴ cfu g−1, respectively) when the accumulated rain and mean values of nutrients (reactive phosphorous and silica) were the highest. Marine bacteria were more numerous in Summer (mean value 7.4 × 10⁵ cfu g−1) when the highest mean values of water temperature and salinity were registered. The gut bacteria were identified as Pseudomonas spp. (64%), Aeromonas spp. (17%), Ochrobactrum pseudogrignonense (10%), Providencia spp. (5%), Enterobacter ludwigii (2%) and Kocuria tytonicola (2%). TM showed that Ca, Na, B and Ni increased their concentrations in Winter while maxima of P, Zn, Cu and Fe were found in muscles of fish sampled in Summer. This study highlighted that the fish intestinal microbiota and metal composition of the fillet reflected the seasonal aquatic environmental variability.

1. Introduction

Transitional ecosystems such as marine lagoons represent a source of a wide and complex range of ecological goods and services, which are influenced by a range of physical, chemical and biological factors [1]. Lagoons, as well as other transitional ecosystems, are exposed to a number of stressors (e.g., winds, marine exchanges and fluvial inputs), leading constantly to changes in the physical and chemical conditions of the water column [2] and in the ecosystem functioning. These ecosystems are subjected to direct and indirect anthropogenic activities which can determine the release of metals, pathogenic germs, pesticides, etc., which, in turn, can reflect on fish fauna.
In this context, fish populations are a key component of the aquatic biological communities since they regulate food web dynamics and nutrient balance [3,4,5]. Indeed, fish fauna constitute important indicators of anthropogenic stress, ecosystem recovery and resilience [6,7] because of their various form, diet, behavior, ability to migrate and the capacity to bio-accumulate toxic substances (metals, bacteria and other pollutants) in their edible parts and organs [8,9]. In this regard, fish intestinal microbiota plays a crucial role, being the reflection of the aquatic surroundings and favoring the adaptability of species to new environments [10]. Gut microbiota was explored both on reared and wild fish from all over the world [11], including coastal Mediterranean aquatic ecosystems [12,13]. A number of studies described intestinal bacteria as markers of physical and chemical aquatic surroundings [14], nutritional background [15], animal health [16] and as a source of metabolites with antibacterial and surface activities [17]. However, this complex niche still remains little explored, especially in regard to Mediterranean grey mullets.
Fish belonging to the Mugilidae family, commonly known as the grey mullets group, comprise a great number of species, and are one of the most ubiquitous teleost families in the planet coastal waters. Since they have an extraordinary adaptability, they occur in most temperate, sub-tropical and tropical waters in both hemispheres [18], inhabiting offshore waters and coastal lagoons, lakes and rivers. Grey mullets have often been described as mud-eaters, detritus feeders and interface feeders [19]. They ingest a great variety of microorganisms, organic and inorganic particles, small invertebrates and therefore, they have an important ecological role in coastal aquatic ecosystems [20]. Among Mediterranean Mugilidae, Mugil cephalus (Linnaeus, 1758), Chelon ramada (Risso, 1827), Chelon labrosus (Risso, 1827), Chelon saliens (Risso, 1810) are the main representative fish species in Sardinian lagoons and possess a high economic value. Above all, flathead grey mullet, Mugil cephalus, is highly appreciated in the food market for its eggs, processed to obtain a seafood which is known with different names such as Avgotaracho (Greece), Karasumi (Japan) or Bottarga (Italy), depending on the geographical production area [21,22].
Santa Giusta Lagoon is one of the most important and widest transitional ecosystems of Sardinia which has been exploited for a long time as fishing resource, producing high yield until the late seventies. Successively in 1989, a strong dystrophic crisis occurred, leading to the total loss of fish and other fauna [23]. From that time on, the lagoon has been subjected to various anthropogenic impacts, and for this reason, monitoring campaigns, scientific studies and management practices have been performed to face and to try solving the consequences [24].
In this scenario, the purpose of the present work was to contribute to increase the knowledge on the microbial gut ecology of wild fish species, in relation to the surrounding aquatic environment of a Mediterranean transitional ecosystem. In particular, the present study investigated through a multidisciplinary approach: (1) the microbiota of grey mullets’ gut, (2) the trace metal content on fish muscle, (3) the seasonal dynamic of environmental variables in order to evaluate the presence of significant relationships among them.

2. Materials and Methods

2.1. Study Area

Santa Giusta Lagoon is located along the central west coast of Sardinia (Italy, Figure 1). It covers an area of 8.6 km2 and its depth ranges between 0.4 and 1.2 m (mean depth of 1.0 m). The lagoon is circular shaped and is connected to the sea through the 3 km long Pesaria channel and to an industrial harbor by an artificial canal. Freshwater inputs derive from two watercourses located along the eastern coast of the lagoon (Figure 1). Prevalently, muddy sediments characterize the bottom of the lagoon [23] and the current exchange system with the sea derives from a substantial human modification of the pre-existing natural one [24,25].
The lagoon is a research site of the “Marine Ecosystems of Sardinia” of the Italian Long-Term Ecological Research network (www.lteritalia.it; https://deims.org/6f7581f0-e663-4681-bf9d-4668d6c3f2ba; accessed on 15 January 2021). Moreover, Santa Giusta Lagoon is recognized as a Site of Community Importance for European Union (SCI ITB030037) and is designated by the Sardinian Government as a protected area for animals (INFS code: OR0211).
Fishing is the main economic activity carried out in the lagoon by a local cooperative of fishermen. Landings were substantial in the 1970s (400–500 tons y−1) [26]. In the last several decades, landings began to decline due to recurrent dystrophic crises [24,27].

2.2. Environmental Characterization

Water samplings were carried out monthly from June 2018 to July 2019 in five stations (Figure 1).
Water temperature (Temp), salinity (Sal) and dissolved oxygen (DO) were measured in situ using YSI 6600 v2 (YSI Inc., Yellow Springs, OH, USA) multi-parameter probe.
Samples for nutrient analyses were collected at about 30 cm depth. Nutrients were analyzed within a few hours after sampling. Concentrations of inorganic nutrients such as reactive phosphorus (PO4), ammonium (NH4), nitrate (NO3), and nitrite (NO2), and reactive silica (SiO4) were determined in the filtered samples according to Strickland and Parsons method [28]. Total dissolved inorganic nitrogen (DIN) was calculated as the sum of NH4, NO3, and NO2. Chlorophyll a (Chla) was determined following the SCOR-UNESCO protocol [29].
The Dipartimento Specialistico Regionale Idrometeoclimatico (SAR-ARPAS) provided daily data of rainfall (Rain): http://www.sar.sardegna.it/ (accessed on 27 October 2020).
Environmental parameters (Temp, Sal, DO, and nutrients) and Chla data were arranged in order to explore the seasonal dynamics in the lagoon along the study period. Five periods were considered: Summer 2018 (n = 25), Autumn 2018 (n = 10), Winter 2018–2019 (n = 15), Spring 2019 (n = 10) and Summer 2019 (n = 20). Seasons corresponded to the following periods: Winter = 21 December–20 March; Spring = 21 March–20 June; Summer = 21 June–20 September; Autumn = 21 September–20 December. Rain data were obtained by summing daily rainfall values to get seasonal accumulations.

2.3. Microbiological Analyses of Fish Gut

2.3.1. Samplings, Biometry and Conventional Microbiological Analyses

A total of 30 mullets destined for the local food market (10 for each season) belonging to the species Mugil cephalus (7), Chelon ramada (9), Chelon labrosus (10), Chelon saliens (4), were caught by the local fishermen cooperative in September 2018 (Autumn), February 2019 (Winter) and July 2019 (Summer). The fish were transported inside a refrigerated bag to the Agris Bonassai laboratory and analyzed within 3–4 h; body weight and total length were measured. The intestine (mean weight 14 ± 6 g) was aseptically removed, diluted (10%, w/v) in saline solution (0.90% NaCl), homogenized in plastic bags by Stomacher® (FermionX Ltd, Worthing, UK) 400 at room temperature. The homogenates for microbiological analyses were made up by mixing the guts of three individuals for each species. Serial dilutions of the homogenate were prepared, and microbiological analyses were performed in duplicate: on Nutrient-Agar medium (NA; Microbiol) for counting total viable heterotrophic bacteria after incubation at 30 °C for 72 h; Violet Red Bile glucose agar (VRBGA) and Violet red bile agar mug (VRBA-MUG) were used for detecting Enterobacteriaceae and coliforms respectively, after incubation at 28 °C for 48 h. In order to enumerate marine heterotrophic bacteria, 100 µL of each dilution was spread on Marine agar plate (MA; Himedia, Mumbai, India) and incubated at 30 °C for 48 h. Bacterial colonies were randomly isolated and purified for genetical taxonomic identification.

2.3.2. Estimation of Bacterial Abundance

Bacterial enumeration of intestinal homogenates was performed by epifluorescence microscopy according to Porter and Feig [30], using DAPI stain and a Leica microscope. Ten milliliters of intestinal homogenate serial dilutions were fixed with 1 mL filter sterilized 20% PBS buffered formaldehyde solution. Samples were stored at 4 °C and processed the following day. DAPI solution was prepared adding 10 mg (whole container) of DAPI into a glass vial and diluting with 20 mL of sterile distilled water. A 0.5 mL aliquot of sample was added with 50 µL DAPI solution and left for 20 min. Afterwards, this solution was filtered in through a black polycarbonate membrane filters (0.2 µm pore size), previously washed in sterile distilled water. After rinsing away any unincorporated stain with 5 mL of sterile distilled water, the filter was placed on top of a drop of sterile distilled water on a clean microscope slide. A drop of non-fluorescent immersion oil was placed on top of the filter, covered with a coverslip and bacterial enumeration was performed by means of epifluorescent microscope. Bacterial densities were at least 30 organisms per at least 10 fields. Final bacterial densities were calculated using the equation Wetzel and Likens [31]:
Bacteria mL−1 = membrane conversion factor × N × D
where:
  • membrane conversion factor = filtration area/area of micrometer field;
  • N = total number of bacteria counted/number of micrometer fields counted;
  • D = dilution factor, i.e., volume of sample stained/total volume of sample.

2.3.3. Taxonomical Identification of Bacteria

Forty-two bacterial isolates were identified by 16S rRNA gene partial sequencing. Bacterial cell preparation for DNA extraction were performed according to Quiagen kit (DNeasy® Blood & Tissue Kit, Hilden, Germany). Universal primers designed to amplify approximately 1300 bp of Escherichia coli 16S rRNA gene were used. The sequences were: forward primer 63f (5′-CAG GCC TAA CAC ATG CAA GTC-3′) and reverse primer 1387r (5′-GGG CGG WGT GTA CAA GGC-3′). PCR mixture contained from 50 to 100 ng DNA template, 1 μL each primer (50 pmol/μL) (Sigma Genosys), 20 μL of ready-to-use PCR master mix containing Taq polymerase (MegaMix 2MM-5, μ Microzone Limited, Stourbridge, UK), to give a total reaction of 25 μL. PCR conditions were: 30 cycles of denaturation at 94 °C for 1 min, annealing at 58 °C for 1 min and elongation at 72 °C for 2 min, with a final elongation at 72 °C for 10 min. Purification of the amplicons for sequence study was carried out as described the Quiagen (QIAquick® PCR Purification Kit, Hilden, Germany) protocol. Partial sequences were determined by BMR Genomics s.r.l (Padova, Italy) and edited using the software Chromas, version 1.43 (Griffin University, Brisbane, Qld, Australia). The sequencing results were submitted for homology searches by BLAST (Basic Logical Alignment Search Tool; Altschul, Gish, Miller, Myers & Lipman 1990) after unreliable sequences at the 3′ and 5′ ends were removed. The database used for sequence pairing was the NCBI (National Center for Biotechnology Information, http://www.ncbi.nml.nih.gov (accessed on 16 December 2020). The identities were determined on the highest score basis. Nucleotide sequences determined herein were deposited in NCBI GenBank database.

2.4. Heavy Metal Analyses

The fillet portions of 30 fish (10 for each season) were sampled and stored at −80 °C before processing. Successively, freezed samples were lyophilized, grinded by a mixer milling ZM200 (Retsch) and mineralized through a wet process in microwave Mars-5 (CEM). Ca, Mg, Na, K, P, S, B, Zn, Cu, Fe, Cr, Ni, Mn, Co, Pb, Cd determinations were performed in duplicate by optical system ICP (Perkin Elmer OPTIMA 7300 DV, Waltham, MA, USA).

2.5. Statistical Analyses

The non-parametric Kruskal–Wallis test (not normal data even after multiple transformations) was applied on the environmental data to verify any significant difference among seasons using the R software (version 3.3.3) (R Core Team, Vienna, Austria). One-way analysis of variance (ANOVA) was made by SAS 9.4 (SAS Institute 2002 Inc., Cary, NC, USA) to test differences of fish metal concentrations and microbiological counts during seasons. Principal components analyses (PCA) were performed to study the relationships between metals and bacterial counts in the four seasons and for the different species using the R software (vers. 3.4.1). Fulton’s condition index expressed as K = weight/length3 [32] was also considered in the PCA for testing the relationships between fish weight-length and metal concentrations. Linear regression analyses were applied to highlight the relationships between fish weight and metal concentrations.

3. Results

3.1. Environmental Context

3.1.1. Rainfalls, Water Temperature, Salinity and Dissolved Oxygen

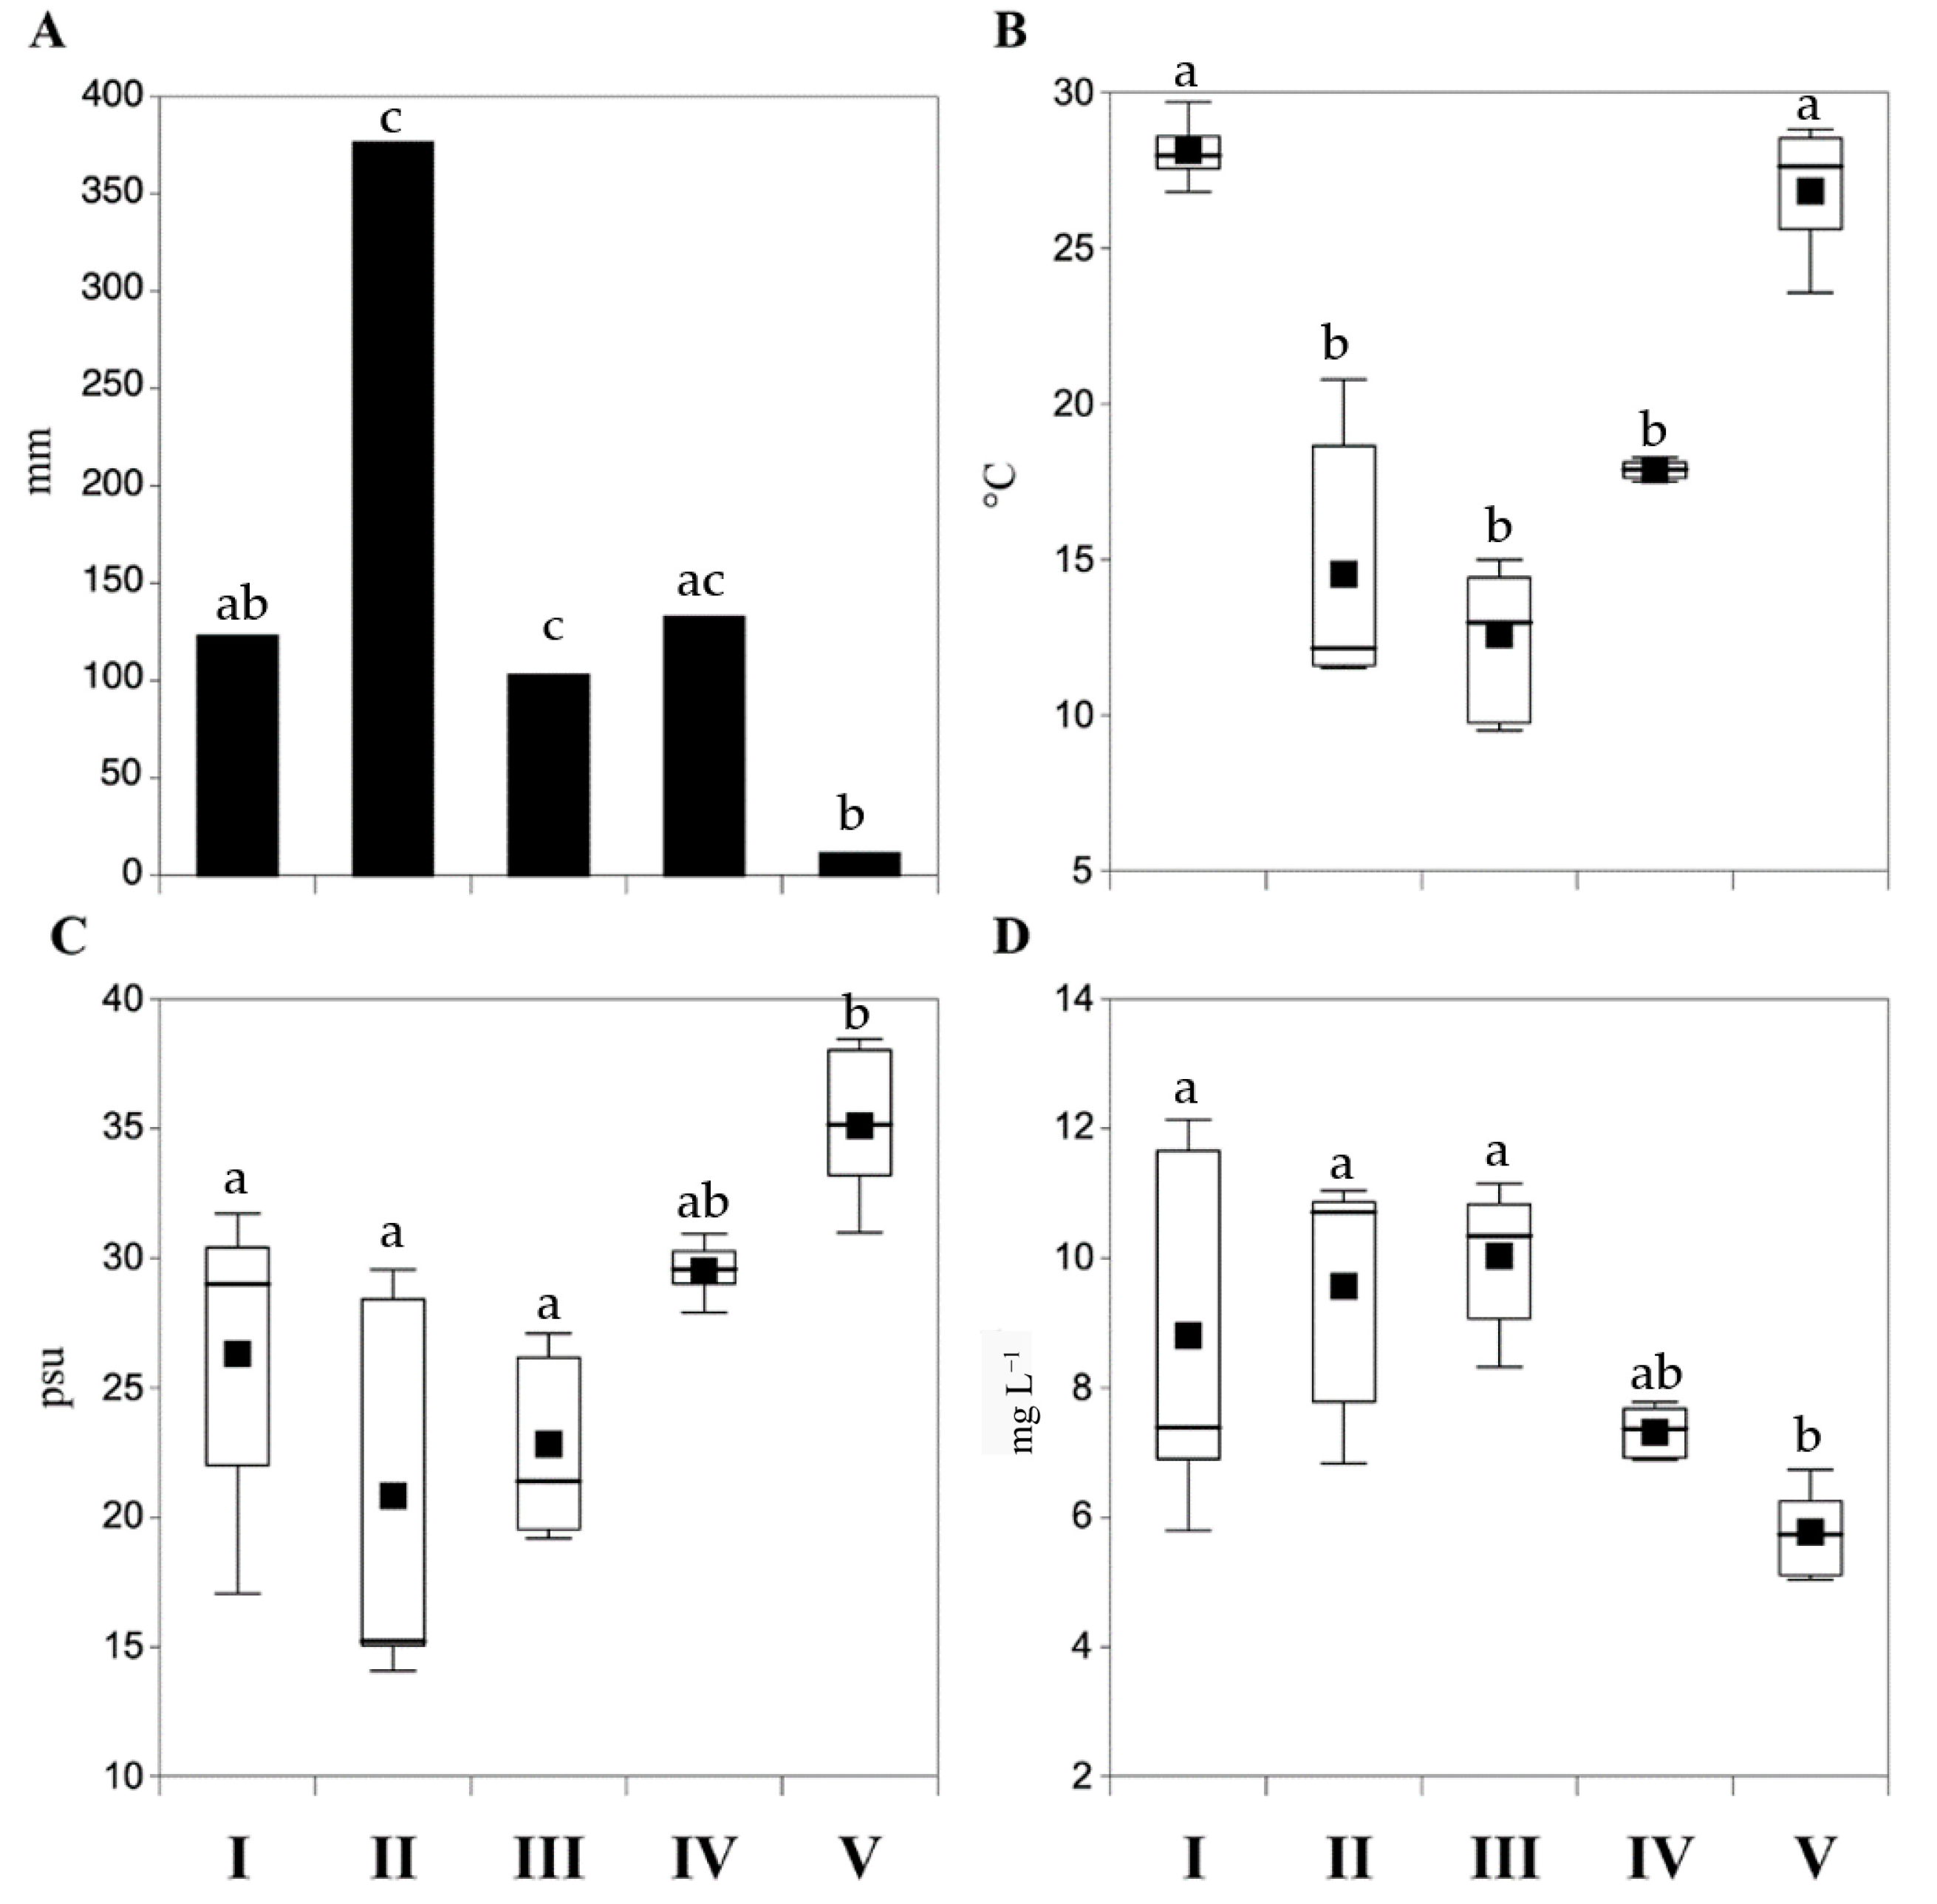
Seasonal Rain accumulates showed the highest values (376 mm) in Autumn 2018 and the lowest ones (10.6 mm) in Summer 2019 (Figure 2A). In the remaining seasons, comparable data ranging from 102 mm in Winter and 132 mm in Spring were detected, whereas Summer 2019 resulted markedly dry (Figure 2A).
Mean Temp data showed seasonal variations with the highest values recorded in Summer 2018 (28.1 °C), the lowest temperatures in Winter (12.6 °C) and intermediate values with the greatest degree of variation in Autumn and Spring (14.5 °C and 17.9 °C, respectively) (Figure 2B).
Mean Sal values indicated an increase along the seasons from Autumn to Summer 2019, with the lowest Sal values in Autumn (20.8 psu) and the highest ones in Summer 2019 (35.1 psu) (Figure 2C). Further, interannual differences were highlighted between Summer 2018 and Summer 2019 (Figure 2C).
The greatest seasonal DO mean values were recorded from Summer 2018 to Winter (maximum 10.0 mg L−1) and then they lowered in the following seasons (Figure 2D). The lowest mean value (5.8 mg L−1) was detected in Summer 2019 (Figure 2D). Significant differences among the seasons for each variable were reported in Figure 2A–D (p < 0.05).

3.1.2. Nutrients and Chlorophyll a

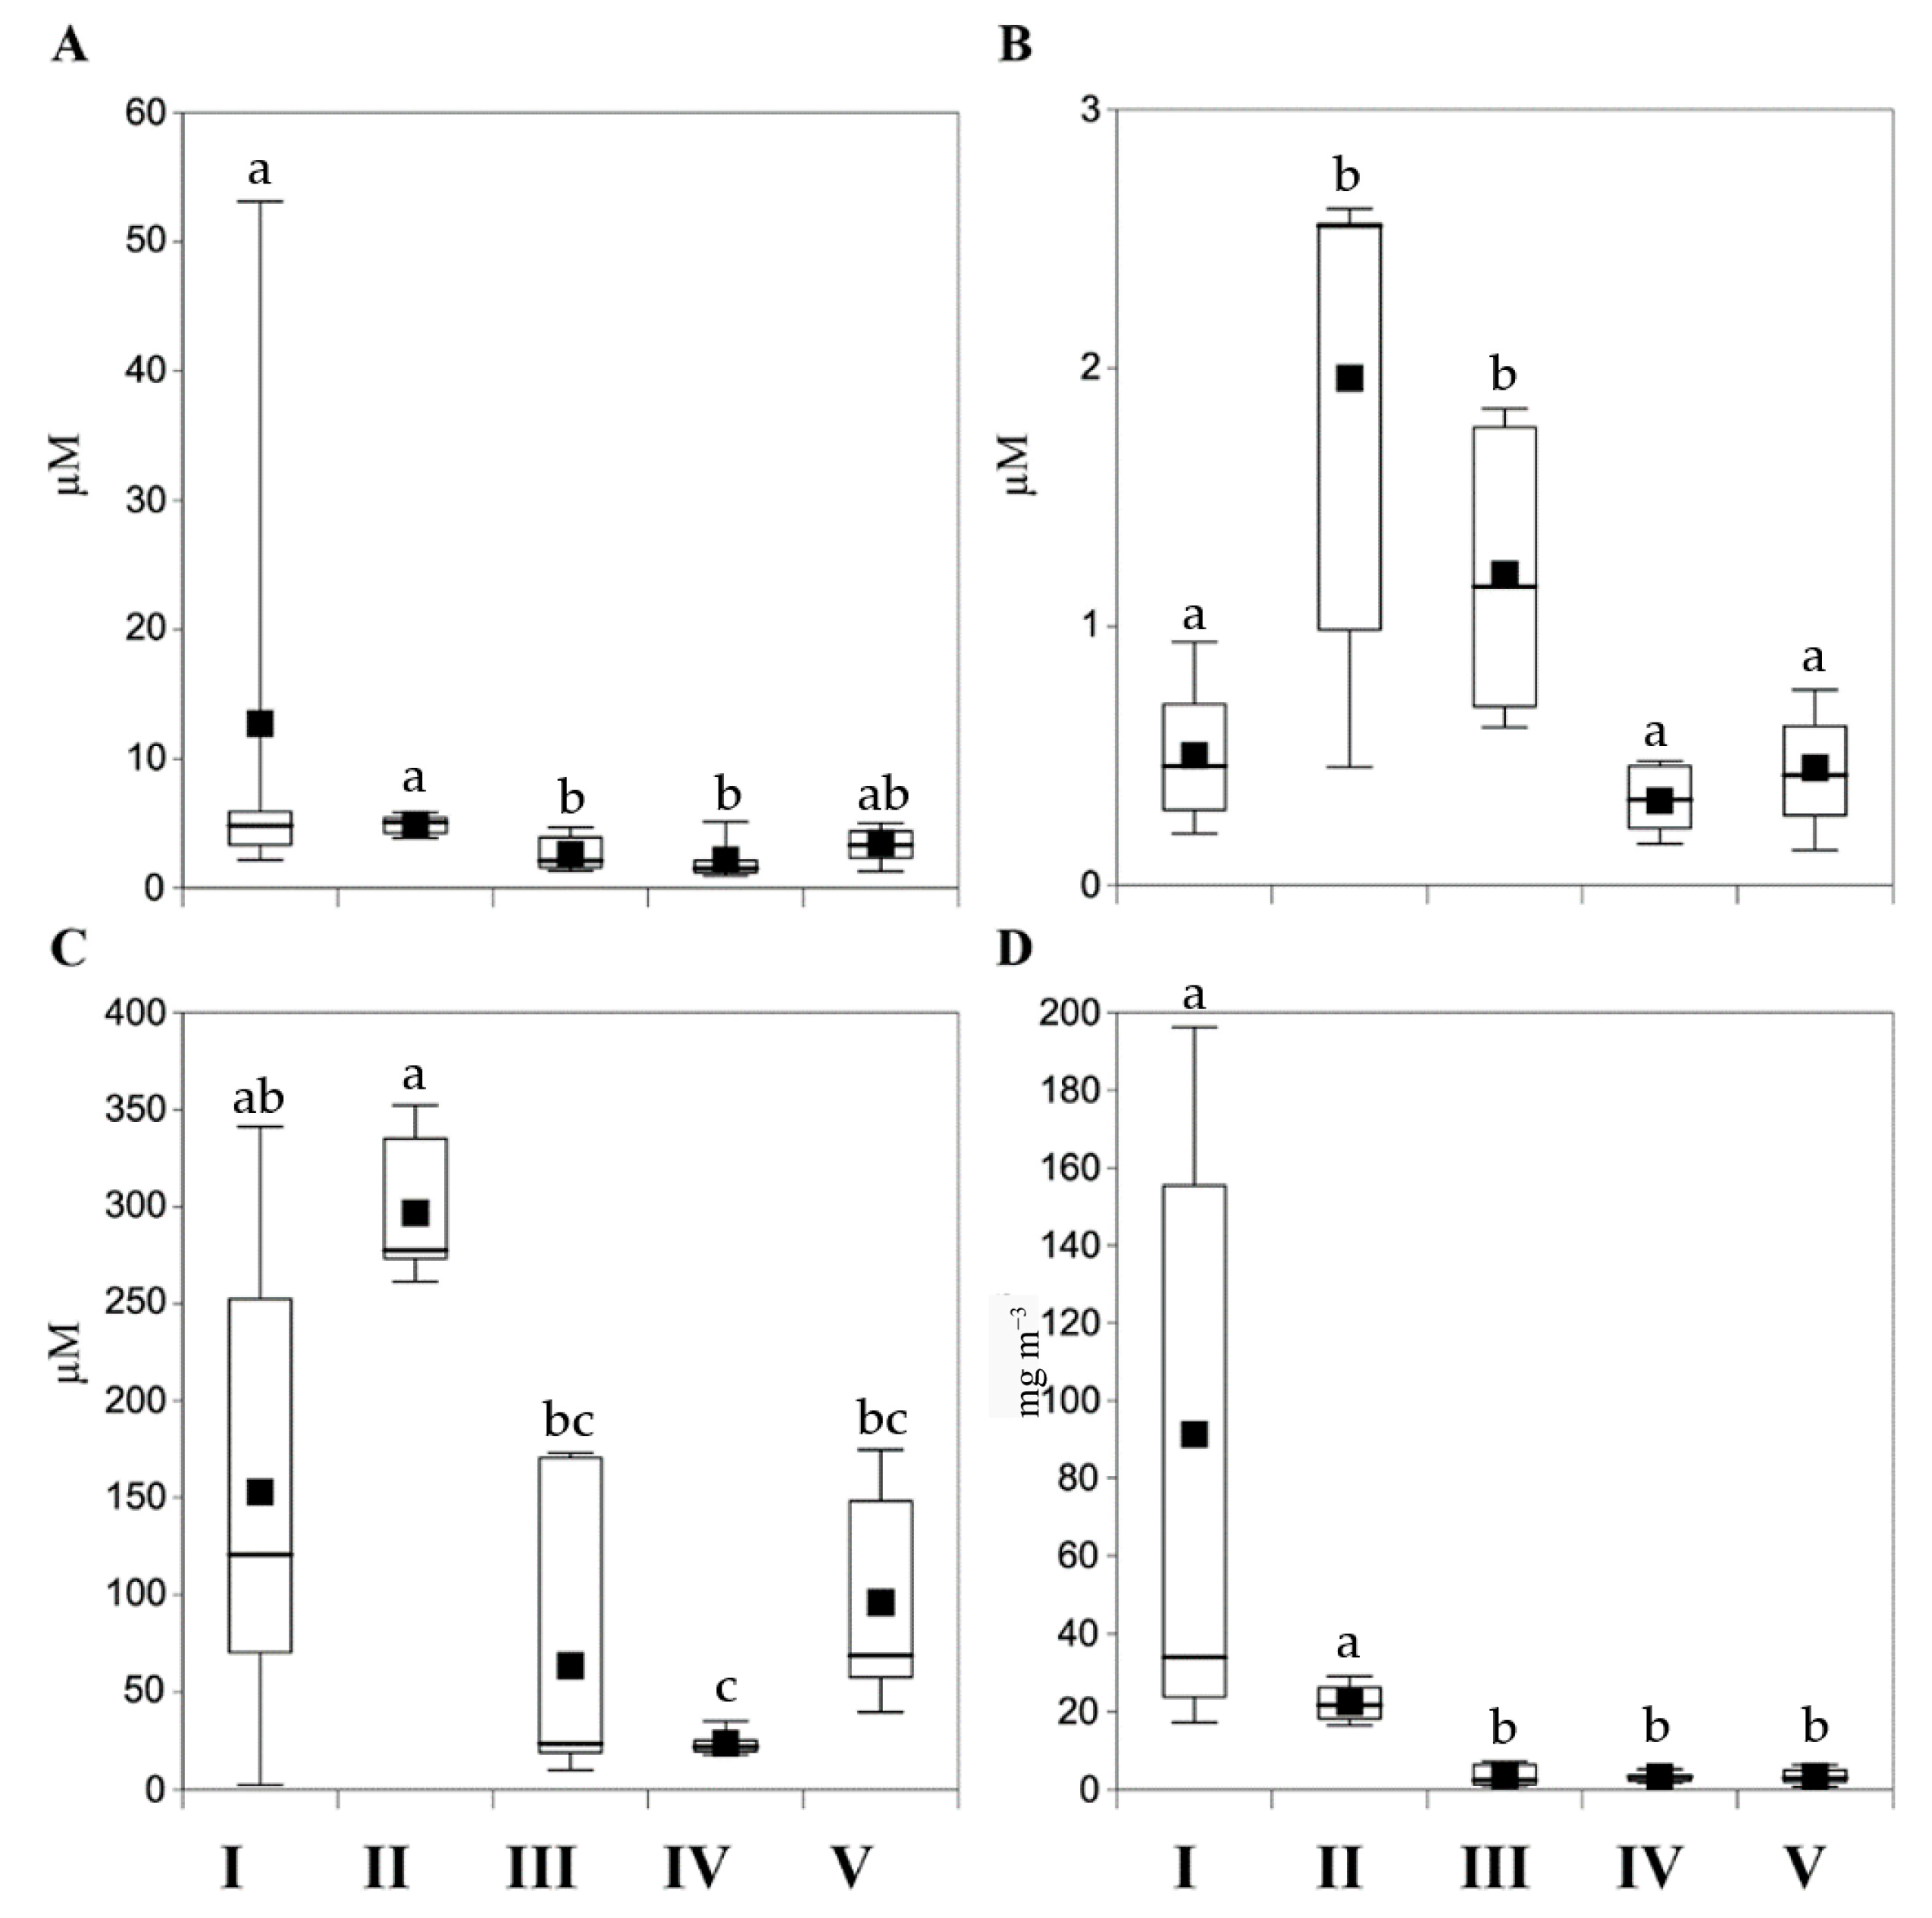
Each nutrient showed a specific trend (Figure 3A–C). DIN mean values displayed the widest variation in Summer 2018 (maximum value 12.7 µM) whereas, along the subsequent seasons, the mean values were similar, ranging from 2.2 µM in Spring to 4.9 µM in Autumn (Figure 3A). Seasonal PO4 mean values presented the major variations in Autumn (maximum value 2.0 µM) and in Winter (1.2 µM) (Figure 3B). In the remaining seasons they ranged from 0.3 µM in Spring to 0.5 µM in Summer 2018 and 2019 (Figure 3B). Seasonal SiO4 mean values had a more irregular dynamic with a maximum value recorded in Autumn 2018 (296.7 µM) and a minimum one registered in Spring (23.9 µM) when the narrowest variation range was observed, whereas the greatest variability was detected in Summer 2018 (Figure 3C).
Chla mean values showed a decreasing trend along seasons from Summer 2018 to Summer 2019 (Figure 3D). The highest value was observed in Summer 2018 (91.2 mg m−3), and the lowest one in Spring (3.3 mg m−3) whereas the means were similar in Winter and Summer 2019 (Figure 3D). Significant differences among the seasons for each variable were reported in Figure 3A–D.

3.2. Fish Gut Microbiological Analysis

3.2.1. Cultivable Bacteria Enumeration

Microbiological analyses, performed on the digestive tract of the mullets, registered a seasonal variation on the number of the cultivable bacteria. Plate count data during different seasons are shown in Table 1.
In Autumn, total aerobic heterotrophic bacteria ranged from 1.1 × 10⁴ to 3.1 × 10⁵ cfu g−1, marine bacteria from 1.0 × 10⁴ to 1.0 × 10⁵ cfu g−1, while Enterobacteriaceae and coliforms were from 3.1 × 10² to 5.0 × 10⁴ and from 7.0 × 10² to 2.0 × 10⁴ cfu g−1, respectively. In Winter, total aerobic heterotrophic bacteria were from 5.5 × 10³ to 8.2 × 10⁴, the marine viable bacteria ranged from 1.2 × 10⁵ to 3.8 × 10⁵ cfu g−1, while the counts of Enterobacteriaceae gave values from 5.0 × 10² to 2.4 × 10³ cfu g−1 and coliforms were from 3.5 × 10² to 2.5 × 10³ cfu g−1. In Summer, a number of total aerobic heterotrophic bacteria from 7.0 × 10³ to 7.0 × 10⁴ cfu g−1 was registered, marine bacteria were from 1.2 × 10⁵ to 1.1 × 10⁶ cfu g−1, while the Enterobacteriaceae ranged from 1.7 × 10² to 1.3 × 10⁴ cfu g−1 and coliforms from 60 to 1.0 × 10⁴ cfu. No significant differences of the various microbial groups were observed along seasons except for the marine heterotrophic bacteria in Summer (p < 0.05).

3.2.2. Bacterial Abundance (Cultivable and Not Cultivable Bacteria)

Microbial enumeration, performed by epifluorescence microscopy, detected a total number of bacteria from 9.0 × 10⁵ to 1.9 × 10⁶ in Winter and from 8.9 × 10⁷ to 1.1 × 10⁸ in Summer; in Autumn we did not obtain clear DAPI stained slides under fluorescent light (Table 1). The counts of uncultivable bacteria were significantly different between Winter and Summer (p < 0.05).

3.2.3. Identification of Intestinal Bacteria by 16S rDNA Sequence

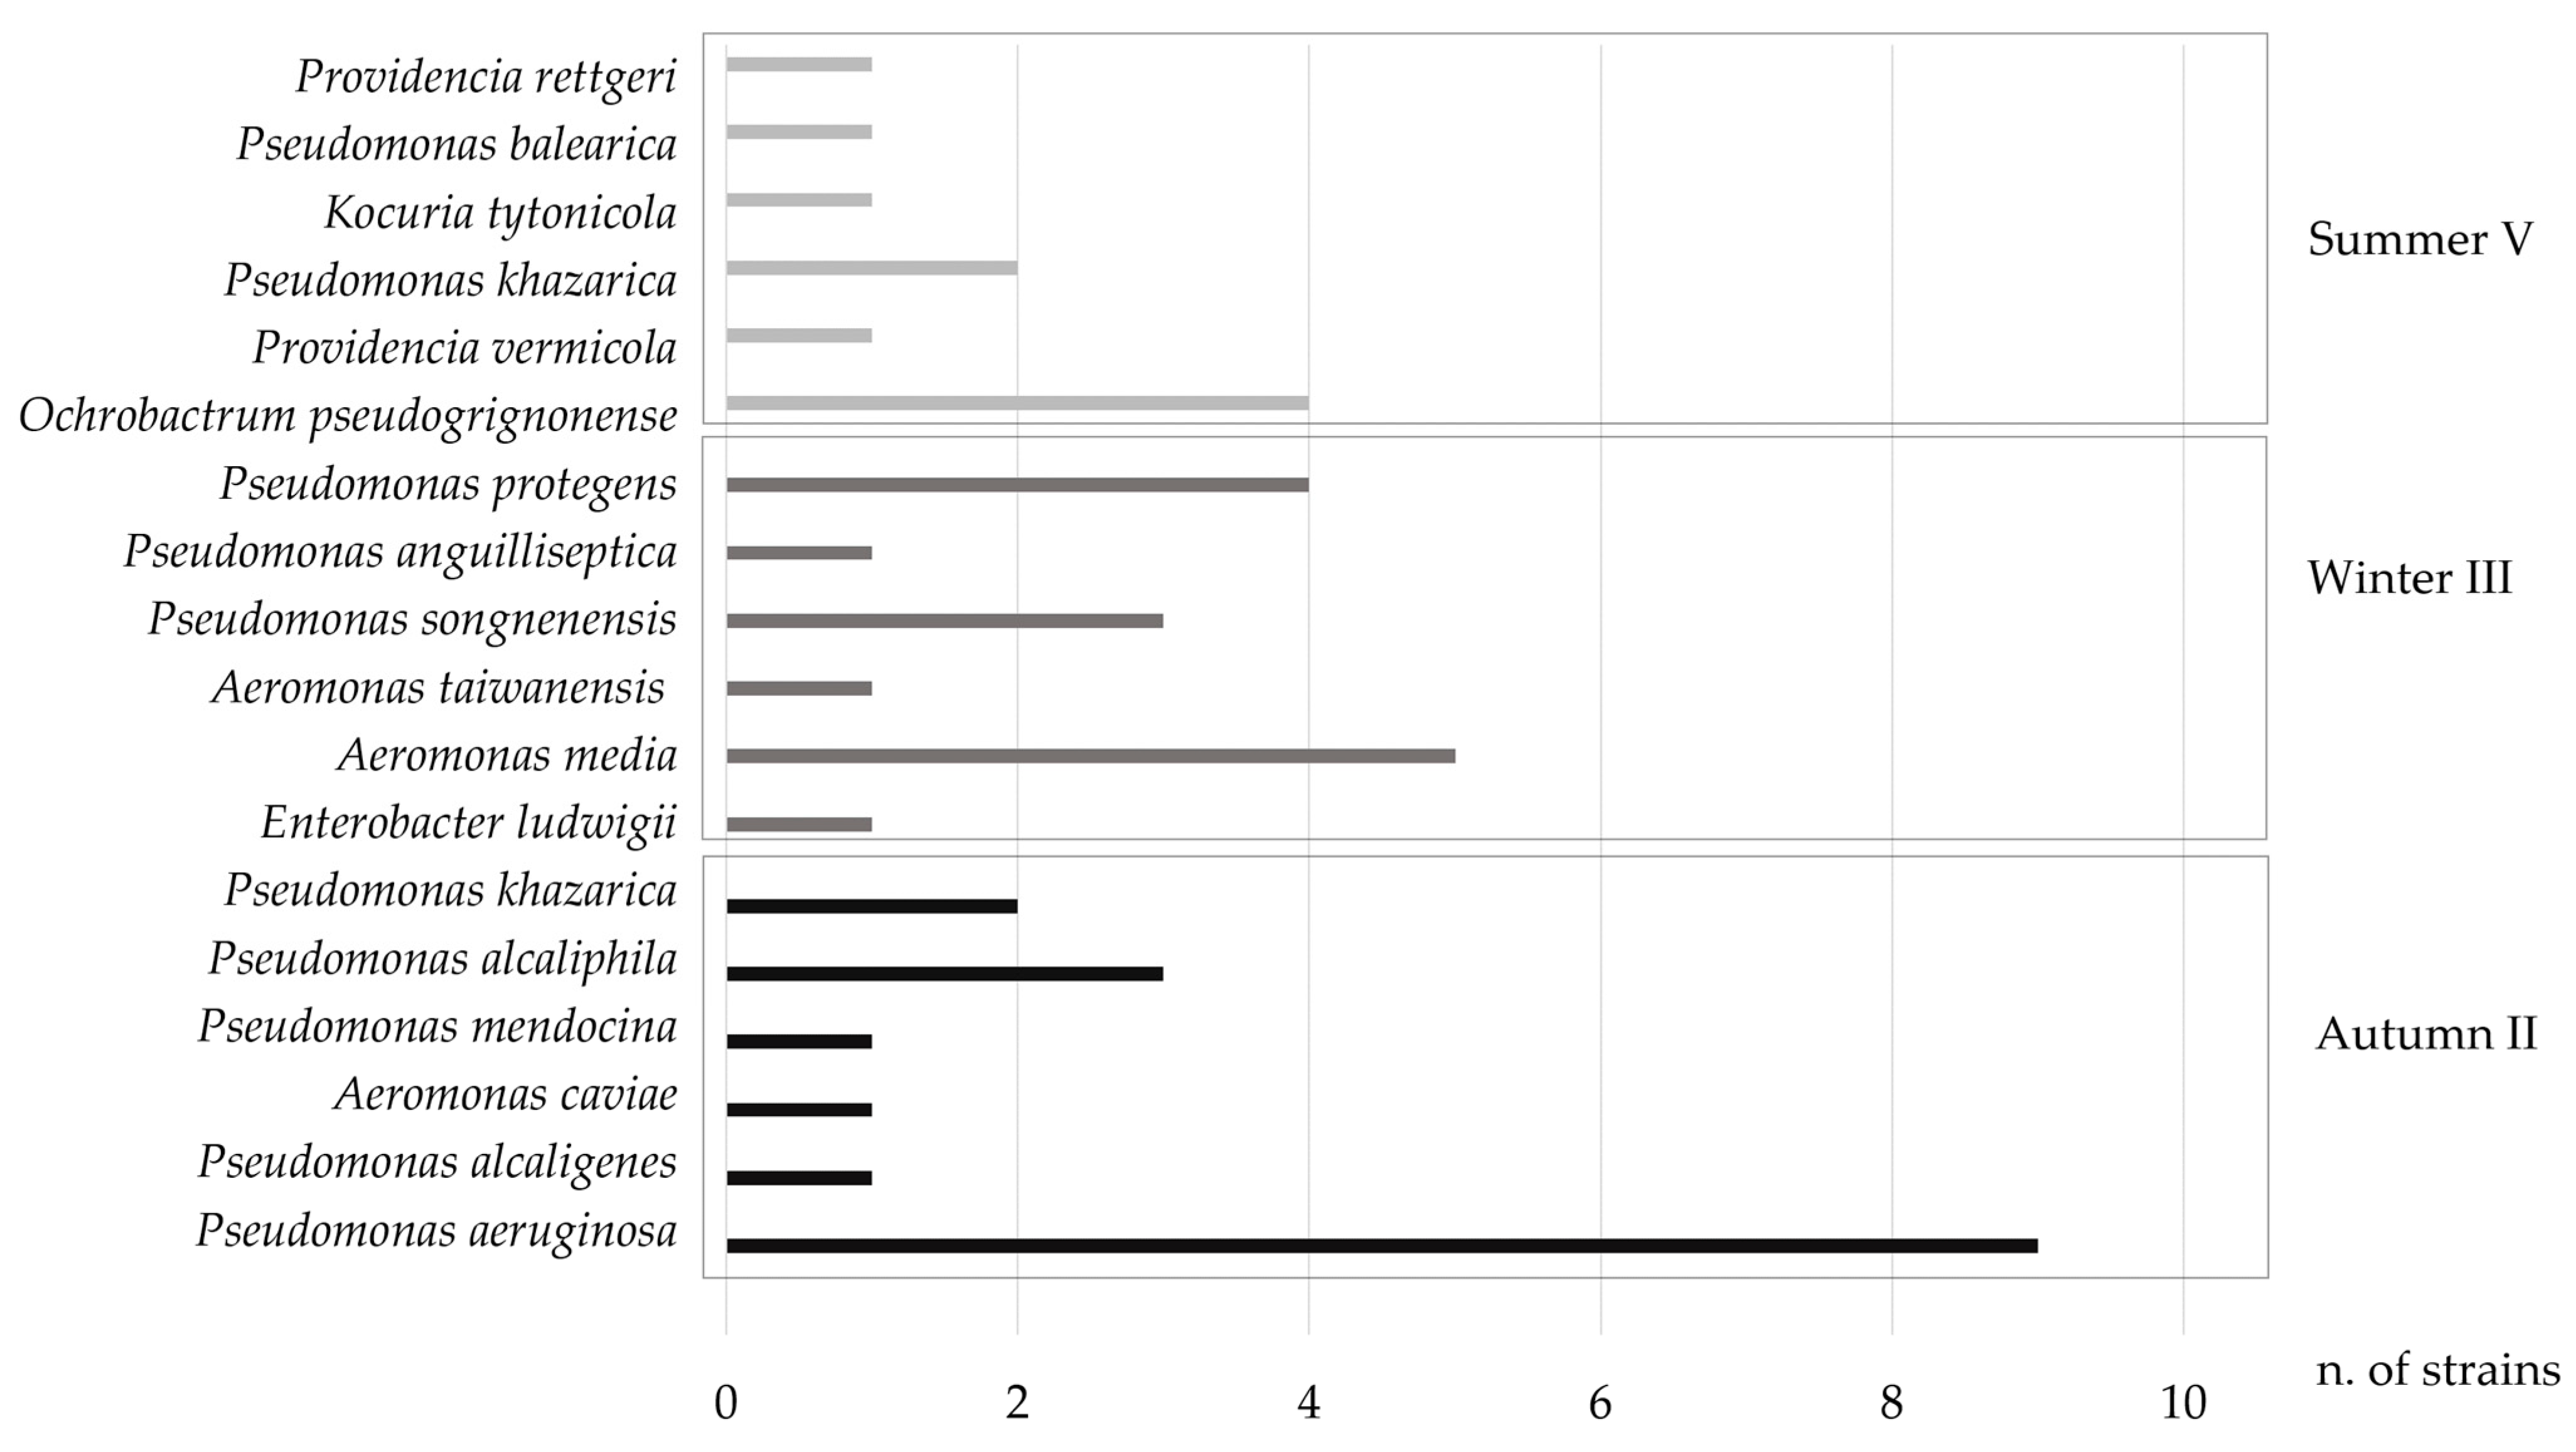
The genetic identification of intestinal bacterial colonies is presented in Table 2 which shows the next relative microbial species alignment and the accession number by Gen Bank submission of 27 representative intestinal isolates. The gut microbiota of the mullets were ascribed to 17 different species: Pseudomonas aeruginosa (9 strains), P. alcaligenes (1 strain), P. mendocina (1 strain), P. khazarica (4 strains), P. alcaliphila (3 strains), P. songnenensis (3 strains), P. anguilliseptica (1 strain), P. protegens (4 strains), P. balearica (1 strain), Aeromonas caviae (1 strain), A. media (5 strains), A. taiwanensis (1 strain), Enterobacter ludwigii (1 strain), Ochrobactrum pseudogrignonense (4 strains), Providencia vermicola (1 strain), Providencia rettgeri (1 strain), and Kocuria tytonicola (1 strain). Pseudomonas spp. (27 strains) were the dominant microbial species in the gut of all the analyzed mullets except for Chelon saliens; Aeromonas spp. (7 strains), the second dominant bacterial group identified, were found in Chelon ramada, Chelon saliens and Chelon labrosus; Ochrobactrum pseudogrignonense (4 strains) and Providencia spp. (2 strains), were isolated from the gut of Chelon labrosus and Mugil cephalus, while Enterobacter ludwigii (1 strain) from Chelon saliens and Kokuria tytonicola (1 strain) from Chelon ramada.
On the other hand, Figure 4 shows the distribution of all the different microbial species identified during the various seasons. The intestinal microflora, detected in Autumn 2018, was represented by the ubiquitous Pseudomonas spp. (94%) and Aeromonas caviae (6%), while in Winter 2019 the presence of Pseudomonas spp. (53%) so as Aeromonas spp. (40%) was consistent while Enterobacter ludwigii was less numerous (7%). The greatest number of different genera was detected in the intestinal tract of the mullets in Summer 2019, with the species Ochrobactrum pseudogrignonense (40%), Pseudomonas spp. (30%), Providencia spp. (20%) and Kocuria tytonicola (10%) (Figure 4).

3.3. Fish Metal Analysis and Biometrics

The metal contents in the 30 mullets during the period of study are shown in Table 3.
Fourteen metals concentrations varied along the seasons. Mean metal concentrations were as follows: Mg > Na > Ca > Fe > K > Zn in Autumn, Na > Mg > Ca > Fe > K > Zn in Winter and Mg > Na > Ca > Fe > Zn > Cu > K in Summer. The results of ANOVA showed that Ca, Na, B, Ni increased their concentrations significantly in Winter while P, Zn, Cu, Fe were significantly found at the highest quantities in fish sampled during Summer (p < 0.05) (Table 3). It was interesting to note that Cu concentration increased significantly in Summer (6.70 ± 8.30 mg kg−1) with respect to the other seasons. In regards to K, it was detected at the highest values in Autumn (mean values 5,140 ± 200 mg kg−1) and in Winter (mean values 4,910 ± 180 mg kg−1), wheras Mn was found only in fish collected in Autumn (mean value 0.21 ± 0.15 mg kg−1); Co was quantified only in Summer (mean values 0.65 ± 0.75 mg kg−1). No Pb was detected in all the 30 samples, whereas Cd was quantified at low level (0.123 mg kg−1) only in one fish in Summer. No significant variations were observed for Mg, S and Cr contents between Winter and Summer.
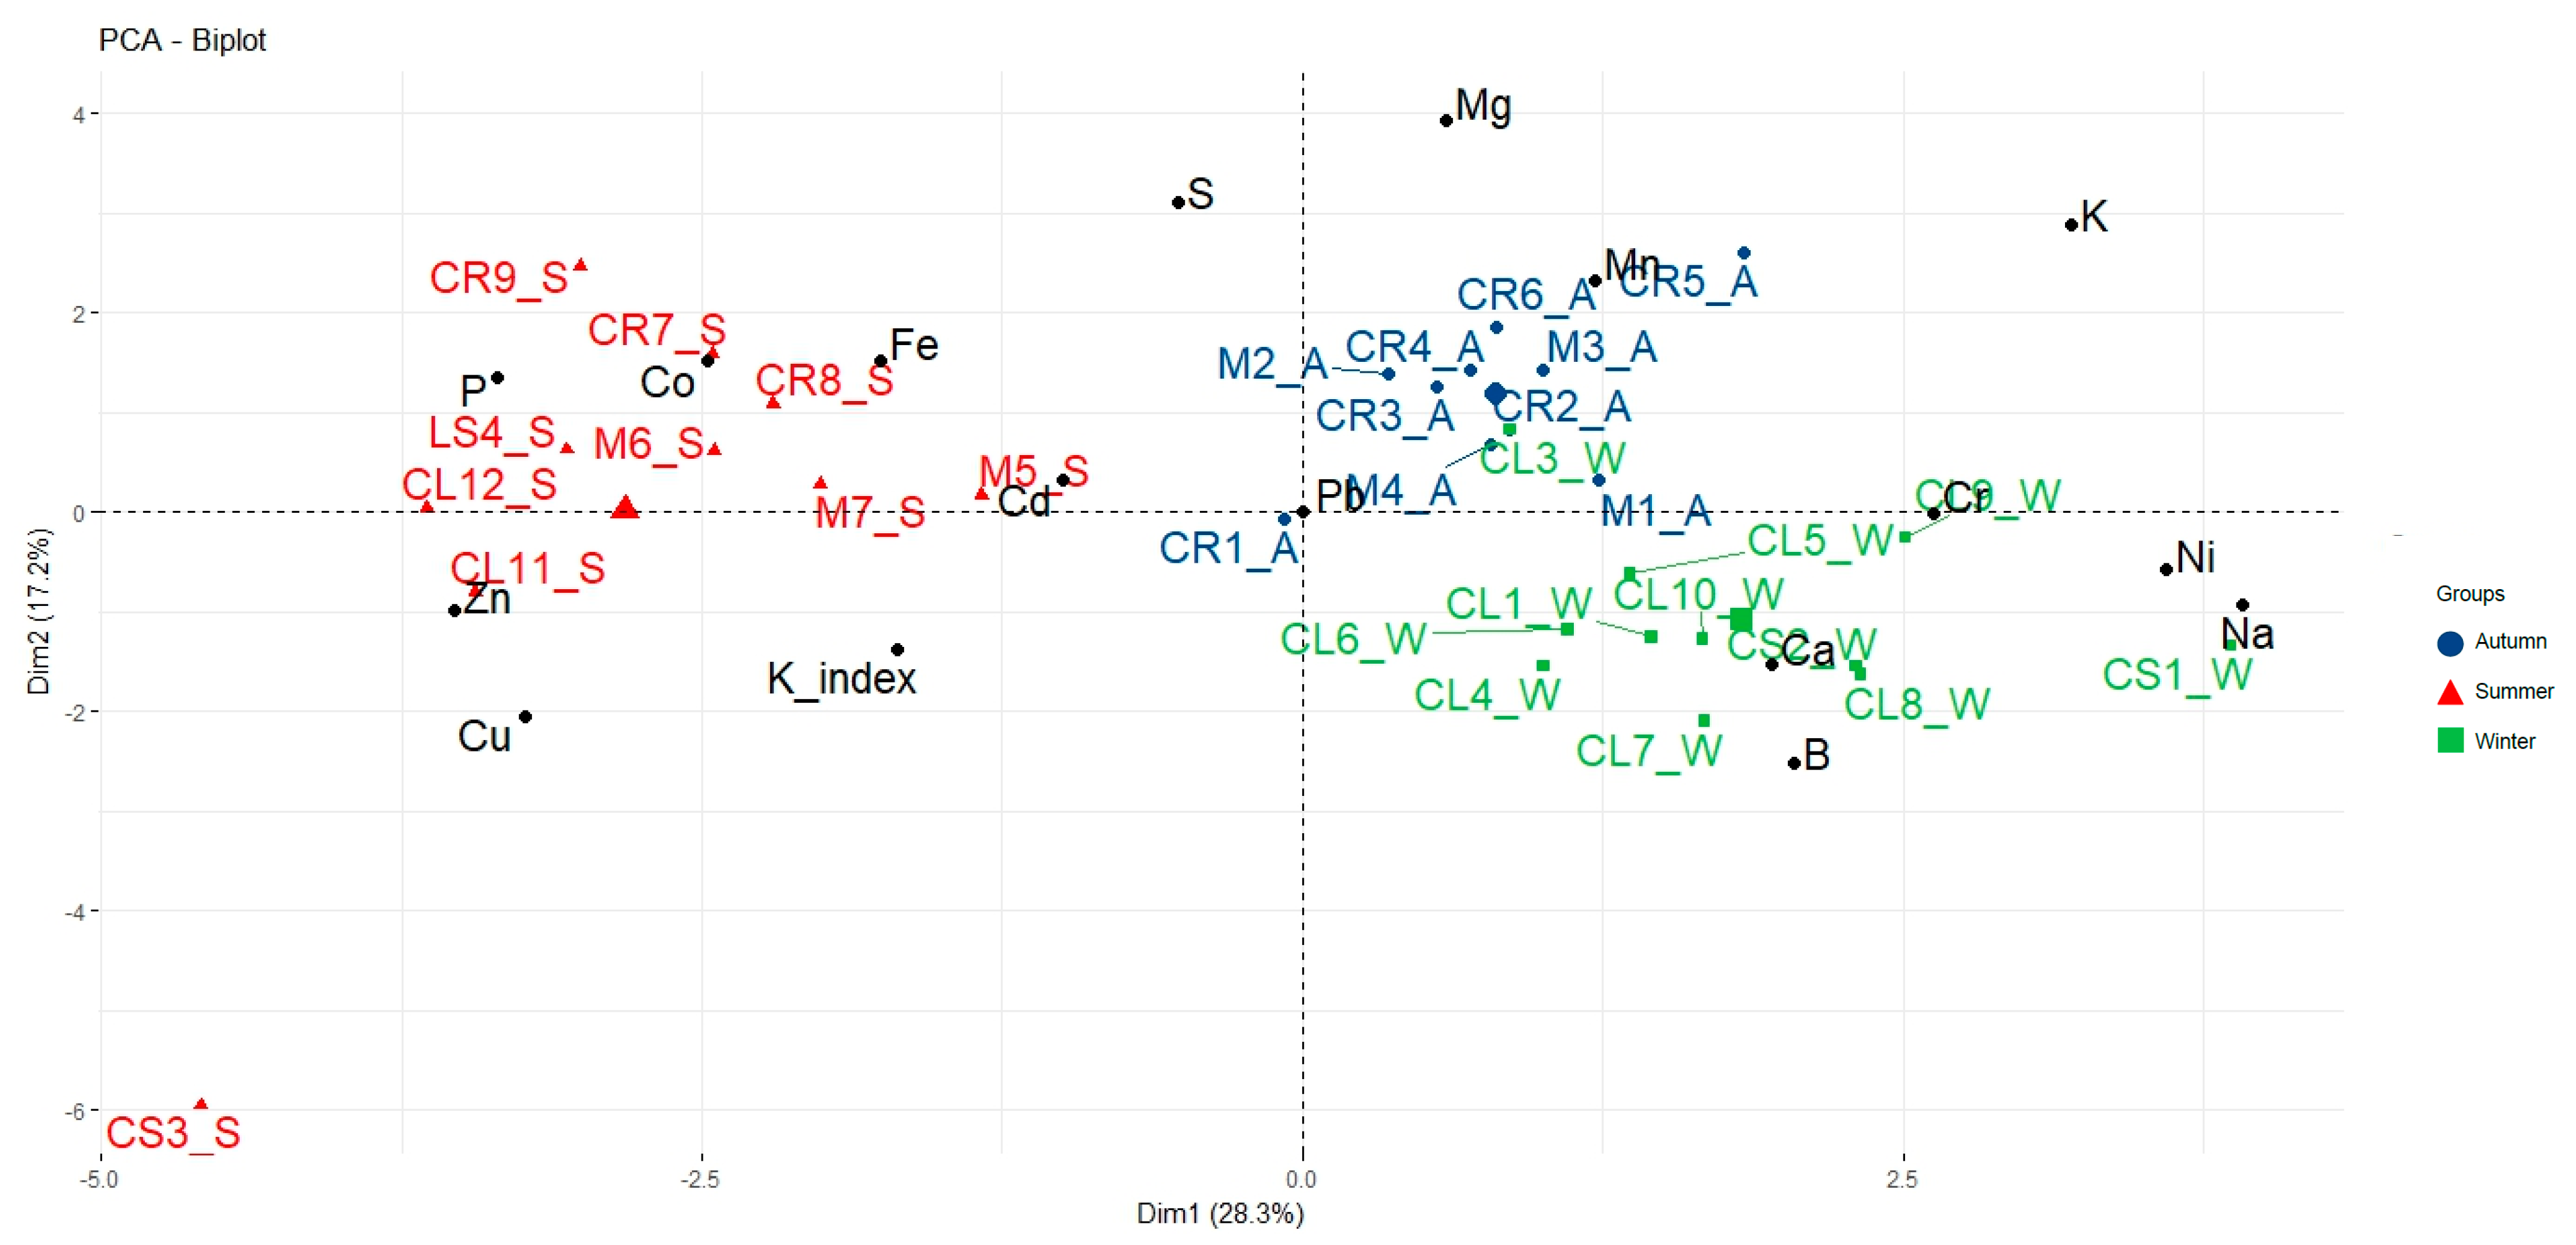
Figure 5 shows the PCA performed considering the 14 metals fillet contents and Fulton’s condition index along the different seasons. The component values of each variable were projected in the two first principal components (PC1 and PC2). The first two axes accounted for 45.5% of the total variation (28.3% and 17.2% for axis 1 and 2, respectively). The PCA on fish chemical data showed that along the PC1, Summer samples were separated, while the PC2 allowed to discriminate the Autumn from Winter samples; no separation among the fish species was observed along the two first principal components. The season separations were explained by the fillet metal contents, in fact the PCA reflected the increasing concentrations of P, Zn, Cu, Co and Fe in Summer and Na, Ni, K, Cr in Winter. Fulton’s condition index showed a relationship with Fe, Co, Cu, Zn and P in Summer.
Figure 6 shows the principal component analyses on the fillet metal contents and intestinal microbial groups. The first two components accounted for 58.6% of the total variation (34.4% and 24.2% for PC1 and PC2, respectively). The PCA showed that along the PC1 the Autumn and Winter data were discriminated from Summer ones. In fact, total heterotrophic bacteria, Enterobacteriaceae, coliforms and Mn increased in Autumn while marine heterotrophic bacteria, P, Zn, Cu, Co and Fe contents were present at the highest values in Summer; on the other hand PC2 discriminated Autumn and Winter samples. No separation among the fish species was observed along the two first principal components.
Fish size, ranged from 23 to 48 cm, and weight from 118 to 1031 g. Linear regression applied to compare the relationships between size-weight and metal concentrations, indicated a high significant relationship only between fish-weight and Fe content (r = 0.77, p < 0.001).

4. Discussion

In the present study, a multi-compartment and multi-disciplinary approach was carried out in order to investigate the microbial gut ecology and the metal contents of wild fish species from Santa Giusta Lagoon, a Mediterranean transitional ecosystem recognized as Site of Community Importance by the European Commission Habitat Directive (92/43/EEC). To the author knowledge, this work represents the first report on cultivable gut microflora of wild mullets from a Mediterranean transitional environment, since studies on mullets’ microflora referred only on the skin bacteria [33].
Grey mullets are the most representative fish species in this lagoon and, further to this, flathead grey mullet (Mugil cephalus) is widely described as indicator of metallic pollution in other Mediterranean sites [34]. Actually, the combined studies of biotic and abiotic factors outlined an interesting framework of this aquatic environment which has a long history of eutrophication, with dystrophic events documented since 1989 [23,24,27].
In the present work, the bacteria quantified on the intestinal tract of the mullets reached values one or two orders of magnitude higher than what registered on the gut of gilthead seabreams from other Sardinian transitional ecosystems, in Winter, under the same laboratory growing conditions [12].
Noteworthy, by comparing the microbial loads and the environmental variability, the highest number of total aerobic heterotrophic bacteria, Enterobacteriaceae and coliforms, was detected in Autumn; it was interesting to observe that this season resulted the rainiest period, during which the nutrient concentrations (especially PO4 and SiO4) were at the highest levels and the salinity at the lowest values. On the other hand, the greatest number of marine heterotrophic bacteria was measured in Summer, when temperature and salinity peaked. These results underline the influence of abiotic factors on the trophic chain and on the settlement of a high number of bacteria in the gut of mullets which indeed ingest water suspended particles. This conclusion confirms that the aqueous habitat selects fish microbial gut flora which therefore represents a marker of environmental origin [12]. Interestingly, Pulina et al. [35,36] reported different behaviors of autotrophic picoplankton in three Mediterranean lagoons, including Santa Giusta Lagoon, at both seasonal and composition levels; these studies indicated the temperature as an important driver for growth, especially for picocyanobacteria, and salinity for autotrophic picoeukaryotes development. This strengthens the idea of a relevant role of environmental factors, such as temperature and salinity, on the variability of fish intestinal bacterial load, other than nutritional factors, host, fish habit and physiology [37]. In a similar way, Sala et al. [38] analyzed seasonal changes in the bacterioplancton of different Catalan marine coastal ecosystems (NW Mediterranean), and found a great variability of water microbial abundance with respect to the environmental and geographical parameters as harbors and coastal ecosystems.
Estimation of bacterial abundance by fluorescent microscopy, let to quantify also non-viable bacteria; the presence of one or two orders of magnitude higher number of microbes in the intestinal tract of the mullets was in accordance with what reported in other studies [39].
The qualitative analysis of the intestinal microflora performed by sequence technology highlighted that the dominant bacterial group, composing the digestive tract of the mullets, was represented by Gammaproteobacteria. The Gammaproteobacteria group was identified as component of the cultivable intestinal microflora of different fish species as Salmo trutta [40], Atlantic herring (Clupea harengus) [41], Sparus aurata and Dicentrarcus labrax [12,13] and other aquacultured fish species [11]. Throughout this study, a group of microbial species ascribed to Ochrobactrum pseudogrignonense (Alphaproteobacteria), was isolated in Summer from Mugil cephalus and Chelon labrosus. This bacterial species was previously isolated from human clinical samples and farm animals, but, to the author’s knowledge, it does not seem to have been found in fish intestinal tract [42]. Moreover, a Gram-positive strain, ascribed to Kocuria tytonicola, was isolated in Summer. This is a new bacterial species belonging to the Actinobacteria group, recently detected in the preen glands of American barn owls (Tyto furcata) [43]. Noteworthy, this large class of bacteria was described in literature for the capacity to synthesize bioactive metabolites with a wide spectrum of bioactivities [44]. However, in this study, no specific microbial group was assigned to a specific fish species.
The overall statistical analysis of the metal content confirmed that the most discriminant factor of the study was the season. This can be explained as the consequence of different mullets feeding regimens, metabolic activity and environmental conditions, which, in fact, change significantly during seasons at Santa Giusta Lagoon as well as in other Mediterranean transitional ecosystems [45].
Taking into account the groups of intestinal bacteria and the fillet chemistry of the mullets, the greatest number of marine bacteria was associated to the highest P, Cu, Fe, Zn, S, Co contents, in Summer. We can presume that the presence of higher environmental concentrations of these metals in this season, could have favored the growth of marine bacteria and have determined the accumulation of these metals in the fish. This can be explained, for example, if considering the more marine feature of Santa Giusta Lagoon in Summer than in the other seasons [27] (i.e., a high salinity can influence halophiles bacteria as marine bacteria so as all the trophic web) [46].
Furthermore, total heterotrophic bacteria, Enterobacteriaceae and coliforms, more abundant in Autumn, were associated with metals concentrations below the detection levels except for Mn; this metal was found in the fish muscle only in Autumn and can be probably of terrestrial origin, due to the runoff occurred during the rainiest season. These results highlighted a possible role of the two compartments, gut and fillet, as proxy of environmental conditions, confirming that fish should be considered an important ecological biosensor, able to combine multiple environmental signals. In light of these considerations, these conclusions encourage further studies for analyzing the gut microbiota and the fillet chemistry to evaluate in deep their possible relations.
This work showed that the trace metals Zn, Cu, Cd were a few orders of magnitude lower than the International Standard Guidelines (UE 1881/2006 and amendments) [47], and no Pb contamination was detected in all the samples. Ihunwo et al. [9], reported a mean concentration of Cu levels (32.98 ± 3.13 mg kg−1), on grey mullet muscles from contaminated creek in Nigeria, which were much higher than what reported in this work (mean highest value 6.7 ± 8.3 mg kg−1 in Summer). However, Cu plays an essential role in the fish growth [9,48], although a high Cu concentration inhibits the hatching.
The present study indicated that Zn and Cu increased in Summer, when water temperature peaked and the accumulated rain was at the lowest levels. Studies on Brasilian fish species, from a eutrophic coastal lagoon, also registered the highest Zn levels in the dry season, but with mean concentrations (13.0 ± 4.5 mg kg−1 and 15.0 ± 3.0 mg kg−1) higher than the Zn values found in the present work (9.02 ± 4.69 mg kg−1) [2]. The same authors reported Cu mean values in Hoplias malabricus and Geophagus brasiliensis muscles (0.53 ± 0.13 and 0.56 ± 0.22 mg kg−1 respectively), which were lower than the mean Cu quantities (6.7 mg kg−1) registered in this work. Furthermore, considering the data reported by Esposito et al. [49] on Mugil cephalus from the urbanized marine area of Crotone (South of Italy), the levels of Cu (from 0.45 to 0.52 mg kg−1), Zn (from 1.69 to 3.59 mg kg−1), and Cr (from 0.03 to 0.07 mg kg−1), were lower than what detected in the present study while Mn (from 0.12 to 0.18 mg kg−1) and Ni (from 21.0 to 25.0 mg kg−1) were higher with respect to the present results. On the other hand, Ouali et al. [44], indicated a wide range of Zn (from 51 to 162 mg kg−1) and Cu (from 2.11 to 15.2 mg kg−1) in flathead grey mullet, Mugil cephalus, from north African coasts of the Mediterranean Sea, depending on the sampling sites. These authors explained their results as the consequence of the sediment composition, especially for detritus feeders.
Thus, the results of ANOVA, obtained in this study, were in accordance with PCA which confirmed that the season is the most discriminant factor. However, the variability of the PC1 and PC2 could be explained also by several other factors like the gender distribution [50], migratory behavior of the mullets due to many reasons like spawning (linked to endocrine mechanisms, photoperiod and ambient temperature), feeding activity, refuge purposes and other uncontrolled factors as daily fluctuations of the climatic variables and lunar cycle [51]. Furthermore, fishing management is another important factor which can influence fish migration. For this reason, further samplings will be necessary to clarify this complex model of study.
The linear regression analysis, performed in this work, indicated only a significant relationship between fish-weight and Fe concentrations which is different from what reported by Ouali et al., 2018 (44) who found a relation with microelements and linear fish growth in Mugil cephalus. However, other studies on different fish species indicated that concentration of heavy metals in muscle tissue either declined or remained constant with increasing body weight [52]. On the other hand, Fulton’s condition index indicated that the increasing of Fe, Co, Cu, Zn and P was related with fish weigh and length in Summer when the mullets displayed the greatest size.

5. Conclusions

  • The present work gives a novel knowledge contribution on the cultivable gut microflora and fillet metal composition of wild mullets in a transitional ecosystem of the Mediterranean area.
  • The quali-quantitative microbiological composition of mullets’ gut and the fillet metal quantities appeared to be influenced by several environmental variables, characterized by clear seasonal dynamics (e.g., meteorological conditions, temperature, salinity and nutrients).
  • Metagenomic studies are in progress to clarify the ecological role of mullet gut microbiota, both for fish and the ecosystem.
  • The multi-disciplinarity of this work proved to be a good approach for studying complex ecosystems, such as Mediterranean lagoons, characterized by a notable variability of environmental factors due to anthropogenetic and natural stressors.
  • Our findings can be valuable for management practices, especially in critical and instable aquatic environments.

Author Contributions

Conceptualization, R.F., G.S., C.T.S., A.L. and N.F.; formal analysis, R.F. and C.P.; methodology, R.F., G.S., C.T.S. and F.S.; validation, all the authors; writing—original draft preparation, R.F., G.S. and C.T.S.; project administration, N.F.; funding acquisition, N.F.; writing—review and editing, all the authors; visualization, all the authors; supervision, all the authors. All authors have read and agreed to the published version of the manuscript.

Funding

This research was funded by Sardinian Region contribution: L.R. n. 6/2012 art-3, comma 34. Interventi regionali per l’attuazione della strategia comunitaria in agricoltura.

Institutional Review Board Statement

Not applicable.

Informed Consent Statement

Not applicable.

Data Availability Statement

The data presented in this study is available on request from the corresponding author.

Acknowledgments

The authors thank Jacopo Culurgioni and Riccardo Diciotti for suggestions on samplings management, Mariella Fozzi for helping on microbiological seedings, Bastianina Manca and Pasqualina Farina (University of Sassari) for the nutrient analyses, and the Santa Giusta Cooperative for providing fish.

Conflicts of Interest

The authors declare no conflict of interest.

References

  1. Newton, A.; Brito, A.C.; Icely, J.D.; Derolez, V.; Clara, I.; Angus, S.; Schernewski, G.; Inácio, M.; Lillebø, A.I.; Sousa, A.I.; et al. Assessing, quantifying and valuing the ecosystem services of coastal lagoons. J. Nat. Conserv. 2018, 44, 50–65. [Google Scholar] [CrossRef]
  2. Beraldi, G.Q.; de Rezende, C.E.; de Almeida, G.M.; Carvalho, C.; de Lacerda, L.D.; de Farias, R.N.; Vidal, M.S.; Mouillot, D.; Souza, M.D.P.; Molisani, M.M. Assessment of a coastal lagoon metal distribution through natural and anthropogenic processes (SE, Brazil). Mar. Poll. Bull. 2019, 146, 552–561. [Google Scholar] [CrossRef] [PubMed]
  3. Holmlund, C.M.; Hammer, M. Ecosystem services generated by fish populations. Ecol. Econom. 1999, 29, 253–268. [Google Scholar] [CrossRef]
  4. Yilmaz, F. The comparison of heavy metal concentrations (Cd, Cu, Mn, Pb, and Zn) in tissues of three economically important fish (Anguilla anguilla, Mugil cephalus and Oreochromis niloticus) inhabiting Koycegiz Lake-Mugia (Turkey). Turk. J. Sci. Technol. 2009, 4, 7–15. [Google Scholar]
  5. Wilson, R.W.; Millero, F.J.; Taylor, J.R.; Walsh, P.J.; Christensen, V.; Jennings, S.; Grosell, M. Contribution of fish to the marine inorganic carbon cycle. Science 2009, 323, 359–362. [Google Scholar] [CrossRef] [Green Version]
  6. Balk, L.; Larsson, A.; Frolin, L. Baseline studies of biomarkers in the feral female perch (Perca fluviatilis) as tools in biological monitoring of anthropogenic substances. Mar. Environ. Res. 1996, 42, 203–208. [Google Scholar] [CrossRef]
  7. Curson, A.R.J.; Matthew, J.S.; Todd, J.D.; Carpenter, S.R.; Cottingham, K.L. Resilience and restoration of lakes. Conserv. Ecol. 1997, 1, 2. Available online: www.consecol.org (accessed on 1 March 2021).
  8. Diop, M.; Howsam, M.; Diop, C.; Goossens, J.F.; Diouf, A.; Amara, R. Assessment of trace element contamination and bioaccumulation in algae (Ulva lactuca), mussels (Perna perna), shrimp (Penaeus kerathurus), and fish (Mugil cephalus, Saratherondon melanotheron) along the Senegalese coast. Mar. Poll. Bull. 2016, 103, 339–343. [Google Scholar] [CrossRef]
  9. Ihunwo, O.C.; Dibofori-Orji, A.N.; Olowu, C.; Ibezim-Ezeani, M.U. Distribution and risk assessment of some heavy metals in surface water, sediment and grey mullet (Mugil cephalus) from contaminated creek in Woji, southern Nigeria. Mar. Poll. Bull. 2020, 154, 111042. [Google Scholar] [CrossRef]
  10. Jones, J.; DiBattista, J.D.; Stat, M.; Bunce, M.; Boyce, M.C.; Fairclough, D.V.; Travers, M.J.; Huggett, M.J. The microbiome of the gastrointestinal tract of a range-shifting marine herbivorous fish. Front. Microbiol. 2018, 9, 2000. [Google Scholar] [CrossRef] [Green Version]
  11. Talwar, C.; Nagar, S.; Lal, R.; Negi, R.K. Fish gut microbiome: Current Approaches and Future Perspectives. Indian J. Microbiol. 2018, 58, 397–414. [Google Scholar] [CrossRef]
  12. Floris, R.; Manca, S.; Fois, N. Microbial ecology of intestinal tract of gilthead sea bream (Sparus aurata Linnaeus, 1758) from two coastal lagoons of Sardinia (Italy). Trans. Water Bullet. 2013, 7, 4–12. [Google Scholar] [CrossRef]
  13. Nikouli, E.; Meziti, A.; Antonopoulou, E.; Mente, E.; Kormas, K.A. Gut Bacterial Communities in Geographically Distant Populations of Farmed Sea Bream (Sparus aurata) and Sea Bass (Dicentrarchus labrax). Microorganisms 2018, 6, 92. [Google Scholar] [CrossRef] [Green Version]
  14. Hovda, M.B.; Fontanillas, R.; McGurk, C.; Obach, A.; Rosnes, J.T. Seasonal variations in the intestinal microbiota of farmed Atlantic salmon (Salmo salar L.). Aquac. Res. 2012, 43, 154–159. [Google Scholar] [CrossRef]
  15. Dimitroglou, A.; Lee Merrifield, D.; Spring, P.; Sweetman, J.; Moate, R.; Davies, S.J. Effects of mannan oligosaccharide (MOS) supplementation on growth performance, feed utilisation, intestinal histology and gut microbiota of gilthead sea bream (Sparus aurata). Aquaculture 2010, 300, 182–188. [Google Scholar] [CrossRef]
  16. Carnevali, O.; Zamponi, M.C.; Sulpizio, R.; Rollo, A.; Nardi, M.; Orpianesi, C.; Silvi, S.; Caggiano, M.; Polzonetti, A.M.; Cresci, A. Administration of probiotic strain to improve sea bream wellness during development. Aquac. Int. 2004, 12, 377–386. [Google Scholar] [CrossRef]
  17. Floris, R.; Scanu, G.; Fois, N.; Rizzo, C.; Malavenda, R.; Spanò, N.; Lo Giudice, A. Intestinal bacterial flora of Mediterranean gilthead sea bream (Sparus aurata Linnaeus) as a novel source of natural surface active compounds. Aquac. Res. 2018, 49, 1262–1273. [Google Scholar] [CrossRef]
  18. Crosetti, D. Biology, Ecology and Culture of Grey Mullet (Mugilidae), 1st ed.; CRC Press Taylor & Francis Group: Boca Raton, FL, USA, 2016; pp. 42–127. [Google Scholar]
  19. Thomson, J.M. The Mugilidae of the world. Mem. Queens. Mus. 1997, 41, 457–562. [Google Scholar]
  20. Cataudella, S.; Bronzi, P. Aquacoltura Responsabile Verso le Produzioni Acquatiche del Terzo Millennio; Libreria Internazionale Hoepli: Milan, Italy, 2001; pp. 559–560. ISBN 978880000463. [Google Scholar]
  21. Bledsoe, G.E.; Bledsoe, C.D.; Rasco, B. Caviars and Fish Roe Products. Crit. Rev. Food Sci. Nutr. 2003, 43, 317–356. [Google Scholar] [CrossRef] [PubMed]
  22. Caredda, M.; Addis, M.; Pes, M.; Fois, N.; Sanna, G.; Piredda, G.; Sanna, G. Physico-chemical, colorimetric, rheological parameters and chemometric discrimination of the origin of Mugil cephalus’ roes during the manufacturing process of Bottarga. Food Res. Int. 2018, 108, 128–135. [Google Scholar] [CrossRef]
  23. Lugliè, A.; Sechi, N.; Oggiano, G.; Sanna, G.; Tapparo, A. Ecological assessment of Santa Giusta lagoon (Sardinia, Italy). Annali di Chimica 2002, 92, 239–247. [Google Scholar]
  24. Sechi, N.; Fiocca, F.; Sannio, A.; Lugliè, A. Santa Giusta Lagoon (Sardinia): Phytoplancton and nutrients before and after waste diversion. J. Limnol. 2001, 60, 194–200. [Google Scholar] [CrossRef]
  25. Satta, C.T.; Anglès, S.; Garcés, E.; Sechi, N.; Pulina, S.; Padedda, B.M.; Stacca, D.; Lugliè, A. Dinoflagellate cyst assemblages in surface sediments from three shallow Mediterranean Lagoons (Sardinia, North Western Mediterranean Sea). Estuar. Coast. 2014, 37, 646–663. [Google Scholar] [CrossRef]
  26. Cannas, A.; Cataudella, S.; Rossi, R. Gli Stagni Della Sardegna; CIRSPE: Cagliari, Italy, 1998. [Google Scholar]
  27. Satta, C.T.; Padedda, B.M.; Sechi, N.; Pulina, S.; Loria, A.; Lugliè, A. Multiannual Chattonella subsalsa Biecheler (Raphidophyceae) blooms in a Mediterranean lagoon (Santa Giusta Lagoon, Sardinia Island, Italy). Harmful Algae 2017, 67, 61–73. [Google Scholar] [CrossRef] [PubMed]
  28. Strickland, J.D.H.; Parsons, T.R. A Practical Handbook of Seawater Analysis, 2nd ed.; Fisheries Research Board of Canada: Ottawa, ON, Canada, 1972; p. 167. [Google Scholar]
  29. SCOR-UNESCO. Determination of Photosynthetic Pigments in Sea Water. In Monographs on Oceanographic Methodology; UNESCO: Paris, France, 1997. [Google Scholar]
  30. Porter, K.G.; Feig, Y.S. The use of DAPI for identifying and counting aquatic microflora. Limnol. Oceanogr. 1980, 25, 943–948. [Google Scholar] [CrossRef]
  31. Wetzel, R.G.; Likens, G.E. Limnological Analyses, 2nd ed.; Springer-Verlag: New York, NY, USA, 1991; p. 391. [Google Scholar]
  32. Ricker, W.E. Computation and Interpretation of Biological Statistics of Fish Populations, Bulletin 191; Bulletin of the Fisheries Research Board of Canada: Ottawa, ON, Canada, 1975; p. 209. [Google Scholar]
  33. Larsen, A.; Tao, Z.; Bullard, S.A.; Arias, C.R. Diversity of the skin microbiota of fishes: Evidence for host species specificity. FEMS Microbiol. Ecol. 2013, 85, 483–494. [Google Scholar] [CrossRef] [PubMed]
  34. Khemis, I.B.; Aridh, N.B.; Hamza, N.; M’hetli, M.; Sadok, S. Heavy metals and minerals contents in pikeperch (Sander lucioperca), carp (Cyprinus carpio) and flathead grey mullets (Mugil cephalus) from Sidi Salem reservoir (Tunisia): Health risk assessment related to fish consumption. Environ. Sci. Pollut. Res. 2017, 24, 19494–19507. [Google Scholar] [CrossRef]
  35. Pulina, S.; Suikkanen, S.; Satta, C.T.; Mariani, M.A.; Padedda, B.M.; Virdis, T.; Caddeo, T.; Sechi, N.; Lugliè, A. Multiannual phytoplankton trends in relation to environmental changes across aquatic domains: A case study from Sardinia (Mediterranean Sea). Plant. Biosyst. 2016, 150, 660–670. [Google Scholar] [CrossRef]
  36. Pulina, S.; Satta, C.T.; Padedda, B.M.; Sechi, N.; Lugliè, A. Seasonal variations of phytoplankton size structure in relation to environmental variables in three Mediterranean shallow coastal lagoons. Estuar. Coast. Shelf Sci. 2018, 212, 95–104. [Google Scholar] [CrossRef]
  37. Mouchet, M.A.; Bouvier, C.; Bouvier, T.; Troussellier, M.; Escalas, A.; Mouillot, D. Genetic difference but functional similarity among fish gut bacterial communities through molecular and biochemical fingerprints. FEMS Microbiol. Ecol. 2012, 79, 568–680. [Google Scholar] [CrossRef]
  38. Sala, M.M.; Estrada, M.; Gasol, J.M. Seasonal changes in the functional diversity of bacteriolplankton in contrasting coastal environments of the NW Mediterranean. Aquat. Microb. Ecol. 2006, 44, 1–9. [Google Scholar] [CrossRef]
  39. Rizzo, C.; Michaud, L.; Hörmann, B.; Gerçe, B.; Syldatk, C.; Hausmann, R.; De Domenico, E.; Lo Giudice, A. Bacteria associated with sabellids (Polychaeta: Annelida) as a novel source of surface active compounds. Mar. Poll. Bull. 2013, 70, 125–133. [Google Scholar] [CrossRef] [PubMed]
  40. Skrodenyte-Arbaciauskiene, V.; Sruoga, A.; Butkauskas, D.; Skrupskelis, K. Phylogenetic analysis of intestinal bacteria of freshwater salmon Salmo salar and sea trout Salmo trutta trutta and diet. Fish. Sci. 2008, 74, 1307–1314. [Google Scholar] [CrossRef]
  41. Curson, A.R.J.; Sullivan, M.J.; Todd, J.D.; Johnston, A.W.B. Identification of genes for dimethyl sulfide production in bacteria in the gut of Atlantic Herring (Clupea harengus). Int. Soc. Microb. Ecol. J. Short Commun. 2010, 4, 144–146. [Google Scholar] [CrossRef] [PubMed] [Green Version]
  42. Yang, Y.; Yu, X.; Zhang, R. Draft genome sequence of Ochrobactrum pseudogrignonense strain CDB2, a highly efficient arsenate-resistant soil bacterium from arsenic-contaminated cattle dip sites. Genome Announc. 2013, 1, e00173-13. [Google Scholar] [CrossRef] [PubMed] [Green Version]
  43. Braun, M.S.; Wang, E.; Zimmermann, S.; Boutin, S.; Wagner, H.; Wink, M. Kocuria tytonicola, new bacteria from the preen glands of Americanbarn owls (Tyto furcata). Syst. Appl. Microbiol. 2018, 42, 198–204. [Google Scholar] [CrossRef] [PubMed]
  44. Liu, X.; Ashforth, E.; Ren, B.; Song, F.; Dai, H.; Liu, M.; Wang, J.; Xie, Q.; Zhang, L. Bioprospecting microbial natural product libraries from the marine environment for drug discovery. J. Antibiot. 2010, 63, 415–422. [Google Scholar] [CrossRef] [Green Version]
  45. Oali, N.; Belabed, B.E.; Chenchouni, H. Modelling environment contamination with heavy metals in flathead grey mullet Mugil cephalus and upper sediments from North African coasts of the Mediterranean Sea. Sci. Total Environ. 2018, 39, 156–174. [Google Scholar] [CrossRef]
  46. Prado, P.; Vergara, C.; Caiola, N.; Ibáñez, C. Influence of salinity regime on the food-web structure and feeding ecology of fish species from Mediterranean coastal lagoons. Estuar. Coast. Shelf Sci. 2014, 139, 1–10. [Google Scholar] [CrossRef]
  47. International Standard Guidelines (UE 1881/2006). Available online: http://www.fao.org/faolex/results/details/en/c/LEX-FAOC068134/ (accessed on 1 March 2021).
  48. Zhang, Y.; Zhang, R.; Sun, H.; Chen, Q.; Yu, X.; Zhang, T.; Yi, M.; Liu, J.X. Copper inhibits hatching of fish embryos via inducing reactive oxygen species and down-regulating Wnt signalling. Aquat. Toxicol. 2018, 205, 156–164. [Google Scholar] [CrossRef]
  49. Esposito, M.; Maglio, P.; Hauber, T.; Miedico, O.; Serpe, P.; Chiaravalle, E.A. Studio sulla contaminazione da metalli in prodotti ittici provenienti dall’area marina di Crotone. La Rivista di Scienza dell’Alimentazione 2012, 1, 7–15. Available online: https://www.researchgate.net/publication/256766114 (accessed on 10 January 2020).
  50. Annabi, A.; Said, K.; Messaoudi, I. Heavy metal levels in gonad and liver tissues—effects on the reproductive parameters of natural populations of Aphanius facsiatus. Environ. Sci. Pollut. Res. 2013, 20, 7309–7319. [Google Scholar] [CrossRef] [PubMed]
  51. Katselis, G.; Koukou, K.; Dimitriou, E.; Koutsikopoulos, C. Short-term seaward fish migration in the Messolonghie-Etoliko lagoons (Western Greek coast) in relation to climatic variables and the lunar cycle. Estuar. Coast. Shelf Sci. 2007, 73, 571e582. [Google Scholar] [CrossRef]
  52. Marks, P.J.; Plaskett, D.; Potter, I.C.; Bradley, J.S. Relationship between concentration of heavy metals in muscle tissue and body weight of fish from the swan-Avon estuary, Western Australia. Mar. Freshw. Res. 1980, 31, 783–793. [Google Scholar] [CrossRef]
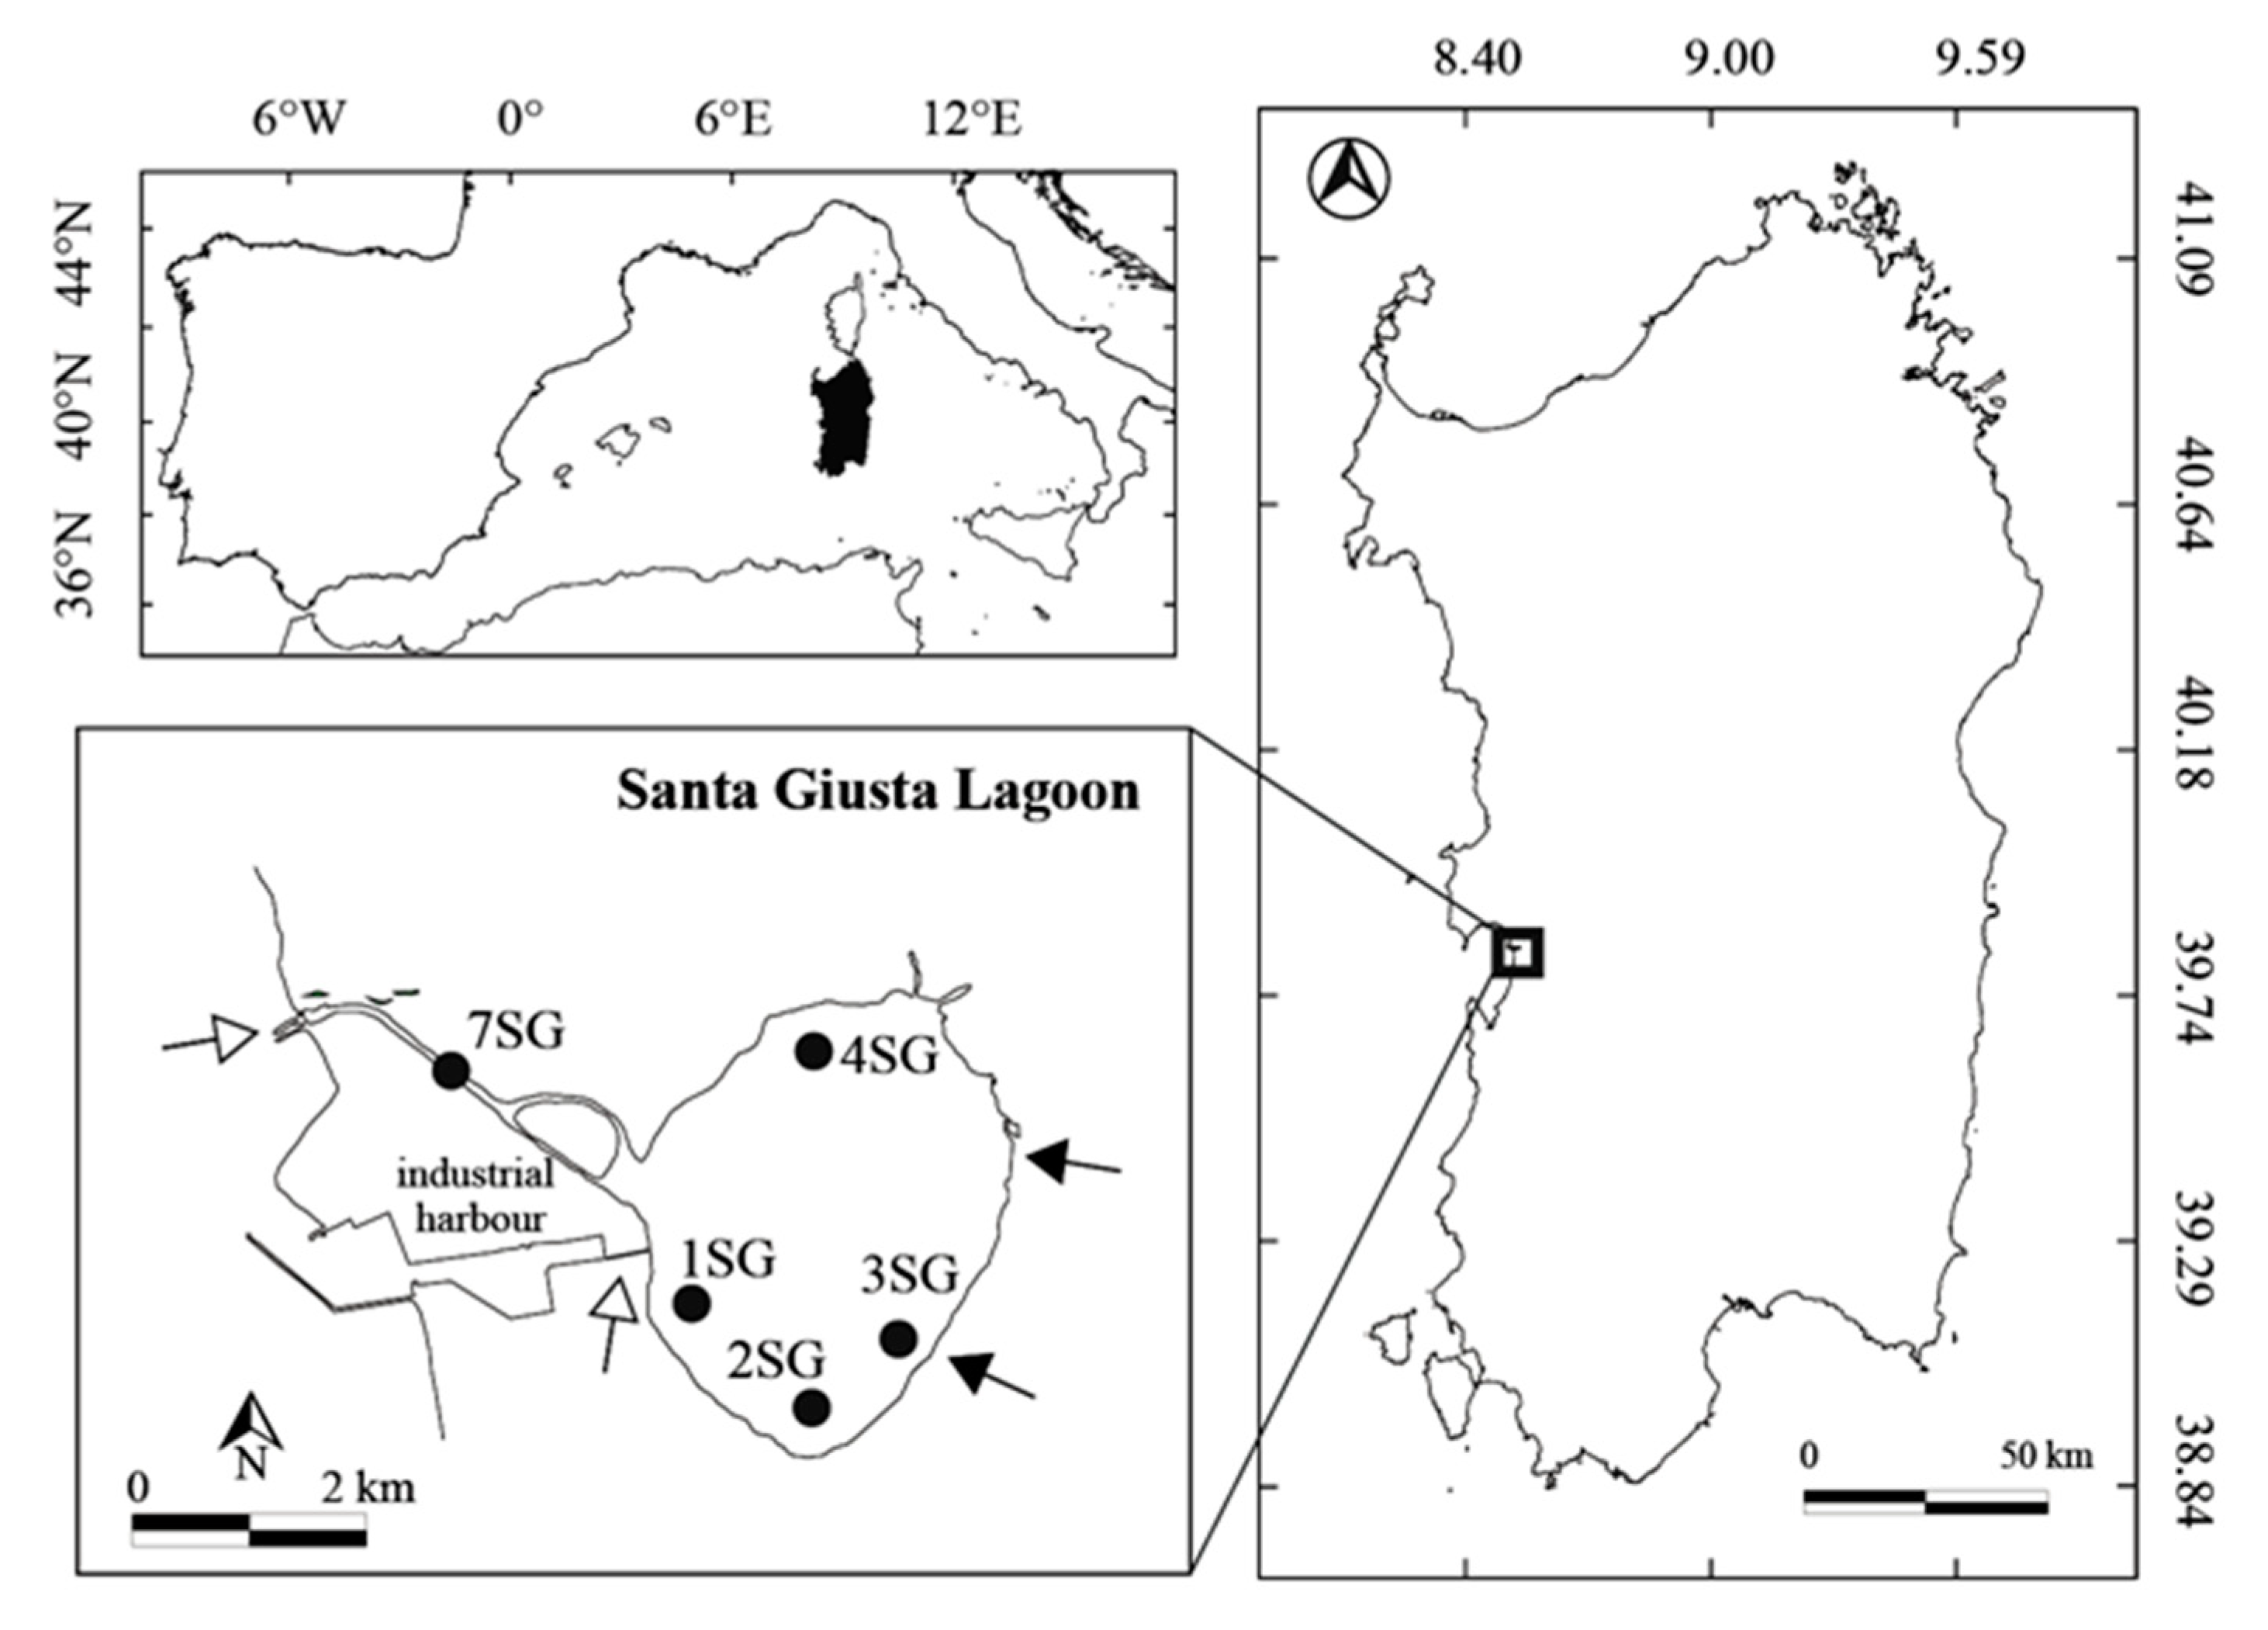
Figure 1. Study area and location of water sampling stations. Black arrows: freshwater inputs; white arrows: marine inlets.
Water 13 00879 g001
Figure 2. Seasonal dynamics of rainfall accumulation (Rain) (A), and boxplots depicting seasonality of water temperature (Temp) (B), salinity (Sal) (C), and dissolved oxygen (DO) (D) in Santa Giusta Lagoon along the study periods. Five periods were considered: Summer 2018 (I), Autumn (II), Winter (III), Spring (IV) and Summer 2019 (V). Boxplots include the entire series of data for each season. Lines represent medians; squares represent means. Bottom of box is the first quartile (Q1); upper part is the third quartile (Q3). Whiskers represent the 90th and 10th percentiles. Different letters indicate significant differences among periods (p < 0.05).
Water 13 00879 g002
Figure 3. Boxplots depicting seasonal variability of dissolved inorganic nitrogen (DIN) (A) reactive phosphorus (PO4) (B), reactive silica (SiO4) (C), and chlorophyll a (Chla) (D) in Santa Giusta Lagoon along the study periods. Five periods were considered: Summer 2018 (I), Autumn (II), Winter (III), Spring (IV) and Summer 2019 (V). Boxplots include the entire series of data for each considered period. Lines represent medians; squares represent means. Bottom of box is the first quartile (Q1); upper part is the third quartile (Q3). Whiskers represent the 90th and 10th percentiles. Different letters indicate significant differences among periods (p < 0.05).
Water 13 00879 g003
Figure 4. Distribution of intestinal bacterial species isolated along the various seasons.
Water 13 00879 g004
Figure 5. Principal component analysis of each fish species Chelon ramada (CR), Chelon labrosus (CL), Chelon saliens (CS), Mugil cephalus (MC) metal contents and Fulton’s condition index (K index) along the seasons Autumn II (A), Winter III (W), Summer V (S).
Water 13 00879 g005
Figure 6. Principal component analysis of each fish species Chelon ramada (CR), Chelon labrosus (CL), Chelon saliens (CS), Mugil cephalus (MC) metal contents, and intestinal microbial loads along the seasons Autumn II (A), Winter III (W), Summer V (S).
Water 13 00879 g006
Table 1. Intestinal cultivable and not cultivable bacteria (DAPI counts) of mullets along the different seasons (cfu g−1). ND: not detected.
Autumn IIWinter IIISummer V
Total heterotrophic bacteriamin-max1.1 × 104–3.1 × 1055.5 × 103–8.2 × 1047.0 × 103–7.0 × 10⁴
mean1.3 × 1053.7 × 1043.8 × 104
Marine bacteriamin-max1.0 × 104–1.0 × 1051.2 × 105–3.8 × 1051.2 × 105–1.1 × 10⁶
mean6.3 × 104 a2.5 × 105 a7.4 × 105 b
Enterobacteriaceaemin-max3.1 × 102–5.0 × 1045.0 × 102–2.4 × 1031.7 × 102–1.3 × 10⁴
mean2.4 × 1041.5 × 1035.4 × 103
Coliformsmin-max7.0 × 102–2.0 × 1043.5 × 102–2.5 × 10360.0 × 104
mean1.1 × 1041.1 × 1034.3 × 103
Dapimin-maxND9.0 × 105–1.9 × 1068.9 × 107–1.1 × 10⁸
mean1.5 × 106 a9.8 × 107 b
Different letters indicate significant differences among seasons (p < 0.05).
Table 2. Different bacterial affiliation of intestinal isolates from grey mullets and accession number by GenBank.
Phylum or ClassStrainBacterial AffiliationAccession NumberFish Species
Gammaproteobacteria1Pseudomonas aeruginosaMW369461Chelon ramada
Gammaproteobacteria6Pseudomonas aeruginosaMW369462Chelon ramada
Gammaproteobacteria10Pseudomonas alcaligenesMW369463Chelon ramada
Gammaproteobacteria11Aeromonas caviaeMW369464Chelon ramada
Gammaproteobacteria13Pseudomonas aeruginosaMW369465Chelon ramada
Gammaproteobacteria15Pseudomonas aeruginosaMW369466Chelon ramada
Gammaproteobacteria17Pseudomonas mendocinaMW369467Chelon ramada
Gammaproteobacteria20Pseudomonas alcaliphilaMW369468Mugil cephalus
Gammaproteobacteria24Pseudomonas khazaricaMW369469Mugil cephalus
Gammaproteobacteria26Pseudomonas khazaricaMW369470Mugil cephalus
Gammaproteobacteria28Enterobacter ludwigiiMW369471Chelon saliens
Gammaproteobacteria30Aeromonas mediaMW369472Chelon saliens
Gammaproteobacteria35Aeromonas taiwanensisMW369473Chelon saliens
Gammaproteobacteria37Aeromonas mediaMW369474Chelon labrosus
Gammaproteobacteria38Pseudomonas songnenensisMW369475Chelon labrosus
Gammaproteobacteria40Aeromonas mediaMW369476Chelon labrosus
Gammaproteobacteria41Pseudomonas anguillisepticaMW369477Chelon labrosus
Gammaproteobacteria47Pseudomonas protegensMW369478Chelon labrosus
Gammaproteobacteria54Aeromonas mediaMW369479Chelon labrosus
Gammaproteobacteria55Pseudomonas protegensMW369480Chelon labrosus
Alphaproteobacteria58Ochrobactrum pseudogrignonenseMW369481Mugil cephalus
Gammaproteobacteria66Providencia vermicolaMW369482Mugil cephalus
Gammaproteobacteria67Pseudomonas khazaricaMW369483Chelon ramada
Actinobacteria69Kocuria tytonicolaMW369484Chelon ramada
Gammaproteobacteria71Pseudomonas balearicaMW369485Chelon ramada
Alphaproteobacteria77Ochrobactrum pseudogrignonenseMW369486Chelon labrosus
Gammaproteobacteria82Providencia rettgeriMW369487Chelon labrosus
Table 3. Fish metal contents during seasons expressed as mg kg−1 fresh weight; sd = standard deviation.
Autumn IIWinter IIISummer V
MeanSDMinMaxMeanSDMinMaxMeanSDMinMax
Ca134.42 b73.5286.45338.97283.79 a108.54128.54472.81141.50 b53.7890.58255.59
Mg364.515.1329.99380.45344.3222.55307.42392.58346.9441.11239.93392.85
Na323.40 b42.99271.04422.07405.13 a47.09325.21488.01238.84 c30.57188.35285.05
K *5.14 a 0.2 4.9 5.56 4.91 a 0.18 4.68 5.21 4.37 b 0.5 3 4.76
P *2.60 b 10 2.45 2.79 2.79 b 0.14 2.6 3.02 3.60 a 0.4 2.55 3.96
S *2.97 0.24 2.6 3.37 2.95 0.14 2.76 3.18 3.05 0.32 2.28 3.41
B0.00 c0001.92 a0.521.262.650.63 b0.370.351.43
Zn5.05 b1.353.217.523.83 c0.273.364.319.02 a4.693.7216.15
Cu0.25 b0.080.150.40.22 b0.110.070.46.70 a8.30.419.59
Fe7.78 b2.284.0111.214.98 b1.612.527.359.06 a3.834.1716.03
Cr0.230.10.10.40.30.210.140.80.110.060.050.21
Ni0.10 a0.030.070.170.15 a0.10.070.360.00 b000
Mn0.2 a0.150.050.560.00 b0000.00 b000
Co000000000.650.7502.22
* = g kg−1 fresh weight. Values within rows not sharing a common superscript are significantly different (p < 0.05).
Publisher’s Note: MDPI stays neutral with regard to jurisdictional claims in published maps and institutional affiliations.