
Seasonal Variations of Dissolved Organic Matter by Fluorescent Analysis in a Typical River Catchment in Northern China


1
Tianjin Key Laboratory of Water Resources and Environment, Tianjin Normal University, Tianjin 300387, China
2
Institute of Surface-Earth System Science, Tianjin University, Tianjin 300072, China
*
Authors to whom correspondence should be addressed.
Water 2021, 13(4), 494; https://doi.org/10.3390/w13040494
Submission received: 29 December 2020
/
Revised: 4 February 2021
/
Accepted: 10 February 2021
/
Published: 14 February 2021
(This article belongs to the Section Hydrology)
Abstract
:Fluorescence (excitation-emission matrices, EEMs) spectroscopy coupled with PARAFAC (parallel factor) modelling and UV-Vis (ultraviolet visible) spectra were used to ascertain the sources, distribution and biogeochemical transformation of dissolved organic matter (DOM) in the Duliujian River catchment. Dissolved organic carbon (DOC), chromophoric dissolved organic matter (a335) (CDOM), and hydrophobic components (a260) were higher in summer than in other seasons with 53.3 m−1, while aromaticity (SUVA254) was higher in spring. Four fluorescent components, namely terrestrial humic acid (HA)-like (A/C), terrestrial fulvic acid (FA)-like (A/M), autochthonous fulvic acid (FA)-like (A/M), and protein-like substances (Tuv/T), were identified using EEM-PARAFAC modelling in this river catchment. The results demonstrated that terrestrial HA-like substances enhance its contents in summer ARE compared with BRE, whilst terrestrial FA-like substances were newly input in summer ARE, which was entirely absent upstream and downstream, suggesting that rain events could significantly input the terrestrial soil-derived DOM in the ambient downward catchments. Autochthonous FA-like substances in summer BRE could derive from phytoplankton in the downstream waters. The results also showed that DOM from wetland exhibited lower fluorescent intensity of humic-like peak A/C and fulvic-like peak A/M, molecular weight (SR) and humification index (HIX) during the low-flow season. Built-up land, cropland, and unused land displayed higher a335 (CDOM). A higher proportion of forest and industrial land in the SCs showed higher SUVA254 values. Humic-like moiety, molecular weight and aromaticity were more responsive to land use during stormflow in summer. Rainfall could increase the export of soil DOM from cropland and unused land, which influences the spatial variation of HIX. The results in this study highlighted that terrestrial DOM has a significant influence on the biogeochemical alterations of DOM compositions and thus water quality in the downward watershed catchments, which might significantly vary according to the land-use types and their alterations by human activities.
1. Introduction
Dissolved organic matter (DOM) is a key signal of water quality, nutrient content, environmental pollution, heavy metal migration and biogeochemical processes in freshwater. The characteristics of DOM generally depict molecular weight (MW) distribution, hydrophobicity, and optical properties [1]. The components of CDOM are complex and can be identified and quantitatively described by UV-Vis and fluorescence (excitation-emission matrix, EEM) spectra [2,3,4,5,6]. Chromophoric dissolved organic matter (CDOM) is defined as the chromophore element of the DOM pool that absorbs ultraviolet and photosynthetically active radiation which can be measured by UV-Vis spectra [2]. The fluorescence spectroscopy technique by a 3D excitation emission matrix (EEMs) has been widely used to characterize the fluorescent dissolved organic matter (FDOM) of CDOM in an aquatic system [3,4,5,6]. EEM-parallel factor analysis (EEM-PARAFAC) modelling is widely applied to ascertain fluorescent DOM (FDOM) sources and their biogeochemical alterations in surface waters [6]. They are a major fraction of bulk DOM and useful indicators that can identify and characterize biogeochemical processes. Autochthonous humic-like substances (M type) and aromatic amino acids or protein-like substances of phytoplankton origin are predominant in lakes and estuaries, but absent from forest streams and subsequent downstream waters [6]. Autochthonous production and photochemical decomposition of phytoplankton were major DOM sources in aquatic ecosystems. In contrast, terrestrial and anthropogenic CDOM are complex and closely related to sources from hydrological flushing from catchments [7]. Hydrological conditions (e.g., drought or rainfall events) would affect the source, concentration, export, quality and age of CDOM in river ecosystems [8,9,10,11]. Generally, terrestrial DOM became dominant sources in rivers after rainfall events, which has ultimately influence on the phytoplankton community dynamics and subsequent influences on DOM dynamics and its compositions in lakes [11].
The effects of land-use types on DOM have received more attention and it has been demonstrated that the estimation on distribution of DOM is available by using land classification [3,10,11,12]. For example, total organic carbon (TOC) export in a peatland-rich area increased with the proportion of peatland of rivers subcatchments (SCs) [10]. It reported that, linked with wetland types or areas, biodegradable dissolved organic carbon (DOC) in stream water was derived from wetland soils [12]. Apart from the export of soil-derived DOM, the nitrogen and phosphorus of upper soil also play an important role in downstream locations whereas export of total organic nitrogen (TON) originating from agricultural land increase with the increasing percentage of agricultural land [10]. The transportation of soil DOM along with nitrogen and phosphorus influences the water quality (e.g., growing of phytoplankton community) of freshwater [11], which is another reason for increasing endogenous organic carbon in fluvial ecosystems [13]. The research focusing on the coupling of DOM seasonal variability and land-use or cover change is relatively limited, particularly the examining the FDOM composition using EEM-PARAFC modelling.
By utilizing points, lines, and areas in the geographic database, the buffer area with certain width bounds can be divided automatically with the environment for visualizing images (ENVI), establishing a buffering model. In recent years, it is widely used to solve the problem of proximity between ground objects to study the influence of buffer distance on ground objects [14]. The flow path between the developed land and drainage networks was confirmed to affect DOC in stream water [15]. The objectives of this study were to: (1) analyze of the source and seasonal variation of DOM compositions according to UV-Vis spectra and EEM-PARAFAC modeling under various hydrological conditions; (2) evaluate the effect of flow path or runoff on DOM content; and (3) assess the relationship of CDOM optical properties to land use.
2. Materials and Methods
2.1. Study Area
The Duliujian River is located on the North China Plain, and is the largest river, at 67 km in length in the area of the lower reaches of the Haihe south system in Binhai New Area. It is an artificial river that leads to Daqinghe River and Ziya River flowing directly into the sea, having been an important water source of the Tuanbowa and the Beidagang reservoirs (Figure 1). Beidagang reservoir (38°36′–38°57′ N and 117°11′–117°37′ E), which has an area of about 348.87 km2, is situated on the coast of Bohai Bay and one of the natural wetland reserves in northern China. The Duliujian River catchment is affected by the monsoon circulation and forms four distinct seasons—rainless and windy in spring, cold and dry in winter (both dry seasons) and hot and rainy in summer (flood season). The average daytime temperature is 12.8 °C; stormflow duration is mainly from July to September and the perennial average precipitation is 533.3 mm and average potential evaporation over 40 years is 1159.9 mm [16,17]. The Duliujian River is connected with canals, wetlands, depressions and reservoirs in the natural landform. To prevent flooding, dams have been built along the shores of the Duliujian River and Beidagang reservoir, into which flow many tributaries. With the development of cities and industries, the Duliujian River is a typical “reservoir-type” river with small runoff, slow flow rate and poor self-purification ability. In addition to the annual decrease in transit water, the local pollution spreads. Pollutants discharged by local chemical plants is an urgent water problem; more than 30 years of industrial pollution has far exceeded safety limits, resulting in river water quality that is mostly in Class V or inferior [17].
2.2. Field Sampling and Water Quality Determination
Pool water (K1–K6) in Beidagang reservoir, T in Tuanbowa reservoir) and river water (R1–R12) were sampled in April (spring), before and after rainfall twice in July (summer), and in November (winter) (Figure 1). K represents the sampling sites around the Beidagang Reservoir. The site T was collected in Tuanbowa reservoir. The sites R5, R10, R11 and R12 were respectively located at South Ground Canal, Majuanyin River, Daqing River and Ziya River, respectively, which are the main tributaries of Duliujian River (Figure 1), other samples were all collected where the tributaries flow in. The water quality parameters of samples were measured by Multiline® Multi 3630 IDS (WTW, Germany), including temperature (T, °C), pH, dissolved oxygen (DO, mg·L−1) and electrical conductivity (EC/ms·cm−1) (Table 1). The samples were collected in polyethylene (PE) bottles (Thermo Scientific Nalgene, Wyman Street, Waltham, MA, USA) and transported to the laboratory, then filtered through a 0.22 µm cellulose acetate filter membrane (Whatman, UK). Clean procedures were employed to avoid contamination, all polyethylene samples bottles were acid washed (10% HNO3) for 24 h and rinsed with distilled water four times. This procedure was repeated for each sampling series. DOC was measured by high-temperature catalytic oxidation (Aurora 1030W TOC). Milli-Q water (18.2 MΩ·cm) was obtained from millipore ultrapure water system. The ultrapure water was analyzed as blank during the DOC detection, and potassium hydrogen phthalate solution of gradient concentrations was taken as standard reagent. Analysis of blanks and replicates showed a detection limit of 0.5 mg·L−1 and precision of 5% at concentration of 4 mg·L−1. Experimental data of three seasons (spring, summer and winter in 2019) were used to analyze the source and seasonal variation of DOM compositions. In addition, the other two groups of data (before and after rainfall in summer) were used to analyze the effect of rainfall events on riverine DOM compositions and its transportation in summer.
2.3. Optical Analysis
The UV-Vis absorption spectra were recorded between 200 and 700 nm with a 1 cm quartz cuvette at 1-nm intervals (Shimadzu UV-2700), Milli-Q water (18.2 MΩ) was used as a reference for CDOM absorption measurements. The absorbance A(λ) of the measured water samples was converted to uncorrected CDOM absorption coefficient a(λ′) by Equation (1), and absorption coefficient a(λ) was corrected by the absorption coefficient a(700) following Equation (2) [2]. The specific UV absorption coefficients (UV-Vis indicators) generally include a335, a260, SUVA254 (UV-Vis absorbance is divided by DOC concentration, then multiplied by 100), ratio of a250/a365 and SR. a335 characterizes the content of CDOM [18], a260 characterizes the content of hydrophobic CDOM containing the aromatic C moieties [19]. The ratio of a250/a365 indicates the relative proportion for the distinguishable fulvic- and humic-like substances in DOM, namely the humification degree of organic matter as about 4 [20]. The spectral slope (SR) of the absorption curve was calculated as the ratio of slope over 275–295 nm to 350–400 nm by Equation (3), referring to MW and CDOM source [21]. The specific UV absorbance at 254 nm (SUVA254), which represents the absorbance per unit C and is positively associated with aromaticity, was calculated as the following Equation (4) [22].
where γ is the cuvette path length in meters; A(λ) is the absorbance at wavelength λ, a (λ′) is the uncorrected CDOM absorption coefficient at wavelength λ, a(λ) is the corrected CDOM absorption coefficient at wavelength λ. The Equation (2) is used to correct the baseline drift caused by the scattering of the small and medium particles in water samples.
a(λ′) = 2.303 A(λ)/γ
a(λ) = a(λ′) − a(700′) × λ/700
a(λ) = a(λ0) exp([S(λ0 − λ)])
SUVA254 = a254/DOC
CDOM fluorescence measurements were performed using an F-7000 fluorescence spectrophotometer (Hitachi Ltd., Tokyo, Japan). The scanning ranges were 220–450 nm for the excitation (Ex) wavelength and 280–550 nm for the emission (Em) wavelength with a 1-cm quartz cuvette. Fluorescence readings were collected at intervals of 5-nm excitation and 1-nm emission wavelengths with a scanning speed of 1200 nm·min−1. Fluorescence data were corrected using Milli-Q as a reference, the fluorescence intensity was calibrated using the quinine sulfate standard (4 µg·L−1 in 0.01 mol·L−1 H2SO4) at the peak Ex/Em = 350/450 nm (1 μg·L−1 =1 QSU unit) to the normalization of fluorescence [6]. The PARAFAC was performed using the N-way toolbox in MATLAB after subtracting the inner-filter and Rayleigh scattering effect of fluorescence, which can effectively avoid the overlap of different fluorescent peaks and obtain the final fluorescent intensities of components. Non-negative constraints are applied in the PARAFAC model to avoid negative values for the three decomposition components, such as excitation values, emission value and concentration value of each sample (fluorescence intensity). The fluorescence index (FI) (the ratio of the emission intensity at 450 nm and 500 nm at 370 nm excitation) was used to distinguish microbial sources of DOC from terrestrial derivation [23]. The humification index (HIX) is a ratio of the areas under the emission wavelengths of 435–480 nm to 300–345 nm at the excitation wavelength of 255 nm [24]. Biological index (BIX) is a ratio of the emission intensity at the wavelength 380 nm to that of 430 nm at the excitation wavelength of 310 nm [25].
2.4. Land Use Classification and Statistical Analysis
Subcatchments of the Duliujian River were extracted by using the Arc Hydro tools in ArcGIS (version 10.2) based on data from a digital elevation model (DEM, 30 m), through the steps of “fill (obtaining DEM without depressions)-flow direction-basin analysis”. Landsat remote sensing images were downloaded from the United States Geological Survey (USGS) website in corresponding seasons. The regions of interest were selected, and a Support Vector Machine method was used for supervision classification (ENVI, version 5.3). 5 m, 10 m, 15 m, 30 m, 45 m, 60 m, 90 m, 120 m and 150 m riparian buffer scales were established based on the drainage network based on buffer analysis, and overlay analysis was used for extracting land-use information from different riparian buffer scales to calculate land-use ratios in Projected Coordinate System. Land-use types were divided into five groups: wetland, built-up area, forest, unused and industrial land.
The relationship between the specific UV absorption coefficients, the intensity of fluorescence peaks and land-use ratios after normalization was tested by a Kolmogorov-Smirnov test and a one-way analysis of variance in normal distribution, which was applied to analyze the homogeneity and heterogeneity of the seasonal variation in CDOM optical properties (SPSS, version 22). The correlation analyses (CA) between the percentage of land-use patterns and optical properties were studied through Redundancy (Canoco, version 5.0) and Pearson (SPSS, version 22) analysis.
3. Results
3.1. Variation in Water Quality Parameters
Table 1 shows a summary of water parameters of the Duliujian River catchment. The pH ranged from 7.96 to 9.31 and was weakly alkaline during the study period. In detail, it was much lower in summer (mean: 8.37 ± 0.40) than in spring and winter (mean: 8.73 ± 0.20 and 8.64 ± 0.29, respectively), and increased to 8.63 ± 0.31 after rainfall. As for as pH, the values differed significantly in spring from that in summer after the rain event (ARE) (r = −0.56, p ≤ 0.05). Similarly, DO in summer (mean: 8.94 ± 3.17 mg·L−1) was significantly lower than that found in spring and winter (mean: 11.76 ± 1.44 and 13.03 ± 1.79 mg·L−1), and was contrary to the seasonal variation of water temperature (T). Conversely, DO in summer increased sharply from 8.94 ± 3.17 mg·L−1 before the rain event (BRE) to 11.35 ± 2.22 mg·L−1 after the rain event (Table 1). Electric conductivity (EC) in the upper course (R7–R12) was substantially low, on average, 2.85 ± 2.13, 3.21 ± 1.67 before rainfall, 2.71 ± 1.52 (ARE) and 2.15 ± 1.67 ms·cm−1 in spring, summer and winter. However, EC in downstream water (R1–R6) averaged 28.84 ± 15.43, 34.86 ± 16.91 before rainfall, 32.72 ± 15.77 (ARE), and 7.89 ± 4.57 ms·cm−1 in spring, summer and winter, nearly 6 times and 10 times higher than that upstream and in the reservoir (K1–K6 and T, 5.05 ± 2.02, 4.65 ± 2.42 of BRE, 4.70 ± 2.4 of ARE, 4.56 ± 1.87 ms·cm−1) for all seasons, suggesting the influence of upstream water in downstream locations.
3.2. Component Identification by PARAFAC Modelling
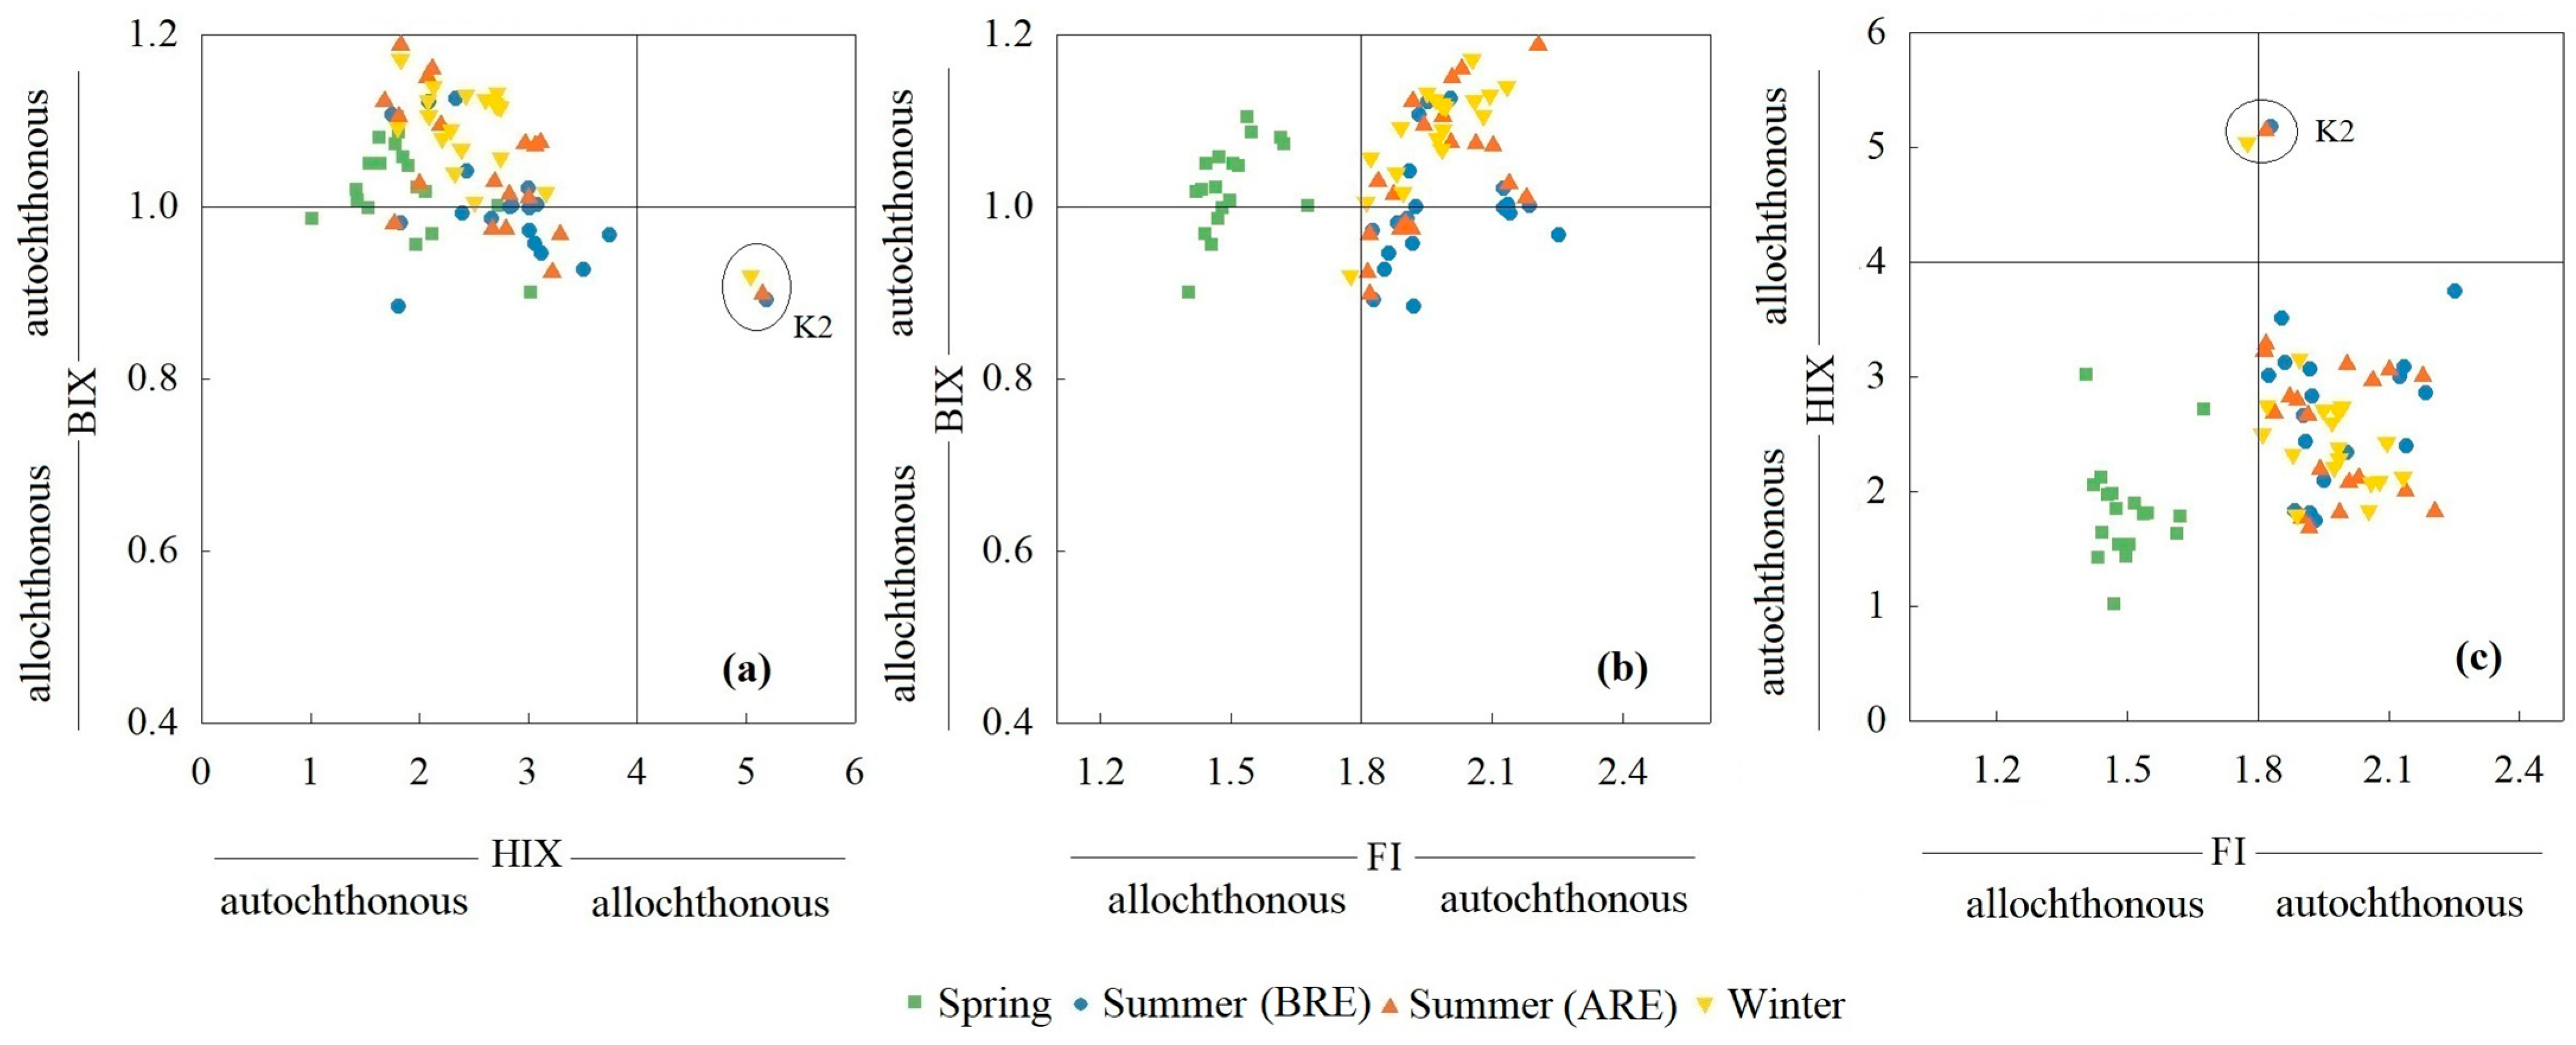
Four types of fluorescent components were validated in samples of the Duliujian River catchment in different seasons (Figure 2). Component 1 was traditionally defined as terrestrial humic-like fluorophores with two peaks (humic-A: Ex/Em = 245~270/440~477 nm and humic-C: Ex/Em = 325~355/440~470 nm) (Figure 2). Similar terrestrial humic like substances are reported elsewhere in surface waters [26,27,28,29,30,31]. Component 2 was typically categorized as terrestrial fulvic-like substances with two peaks (fulvic-A: Ex/Em = 235~295/391~407 nm and fulvic-M: Ex/Em = 235~315/391~407 nm) (Figure 2), apart from downstream water in summer BRE (A: and M:) which was denoted as autochthonous fulvic acid-like substances that are derived from phytoplankton whereas peak M intensity is greater than peak A (Figure 2; 27). Autochthonous fulvic acid-like substances of phytoplankton origin was further confirmed by the absence of terrestrial fulvic acid-like substances in upstream locations (Figure 2). Similar terrestrial fulvic-like substances are reported elsewhere in surface waters [30,31]. Component 3 was previously reported as resembling low-molecular-weight protein-like fluorophores with two peaks (protein-TUV: Ex/Em = 225~230/337~350 nm and protein-T: Ex/Em = 275–280/337~350 nm) (Figure 2). The third component-protein-like substances are of phytoplankton origin, as reported elsewhere [29,30,31,32]. In addition, a strong linear correlation between humic-A/C and fulvic-A/M (r = 0.97, p < 0.01) in the whole SCs in baseflow was observed in each season, implying that humic-/fulvic-like DOM may have the same terrestrial source, but bulk DOM was originated from autochthonous materials which could be reflected by the fluorescent index (FI) value of 1.98. The site K2 has the highest fluorescent intensity of humic- and fulvic-component for reservoir water, with a variation trend of increasing-decreasing. Both components at K2 were as high as 363.9 and 336.7 QSU in summer (ARE). The HIX values in summer (mean: 2.83) were higher than those in spring and winter (mean: 1.84 and 2.55), and the BIX values in summer (mean: 1.00) were lower than those in spring and winter (mean: 1.02 and 1.09).
3.3. Content and Properties of DOM
Seasonal patterns of CDOM showed great variability across the seasons, and performed basically consistently throughout the year (p ≤ 0.01). In summer, DOC (mean: 12.9 ± 4.10 mg C·L−1, BRE) was observed to be higher than in spring and winter (mean: 5.78 ± 3.32 and 7.31 ± 4.02 mg C·L−1, respectively) and the peak value of DOC amounted to 14.9 ± 5.2 mg C·L−1 in summer after rainfall. Downstream, DOC was low in spring and summer, averaging 2.06 ± 1.53 in (spring), 10.0 ± 5.2 (summer, BRE) and 10.6 ± 5.3 mg C·L−1 (summer, ARE), whereas it became the highest downstream in winter comparing to other water areas, averaging 10.1 ± 4.2 mg C·L−1. DOM exhibited somewhat discrepancy in winter compared with spring and summer, the similar variation trends appeared in spring and summer (p ≤ 0.01). The absorption coefficients a335 and a260 were also higher in summer (mean: 17.8 ± 3.57 and 53.3 ± 15.9 m−1, BRE) and lower in winter (mean: 7.48 ± 3.51 and 32.7 ± 15.6 m−1) as for the entire sampling area (Table 2). E2/E3(a250/a365) ranged from 3.37 to 11.8; only 5 sites showed a lower value (<4). SUVA254 averaged 14.0 ± 12.6 L·m−1·(mg C)−1 with the highest aromaticity in spring, dropping dramatically to the lowest value of 4.92 ± 2.11 L·m−1·(mg C)−1 in summer (Table 2). It was more than 27.0 L·m−1·(mg C)−1 at sites R1-R4 in spring, greatly exceeding the others over the year. SR, ranging from 1.07 to 2.59, was higher in spring (mean: 1.79 ± 0.23) than that found in summer and winter (mean: 1.66 ± 0.21 and 1.17 ± 0.08). E2/E3 variation in winter deviated from that in spring and winter, SUVA254 folded the correlations among different seasons except for the only significant consistency be-tween spring and summer (ARE) (r = 0.64, p ≤ 0.01).
Generally, the highest intensities of three types of fluorophores were all observed in summer for stormflow that averaged 442.5 ± 352.0, 549.8 ± 192.9, 733.7 ± 219.4 quinine sulfate unit (QSU) for humic-, fulvic- and protein-like moieties respectively, and the total content of FDOM (fluorescent dissolved organic matter) amounted to 1726 ± 705.3 QSU by this time. Regionally, the fluorescent intensity in the upstream and reservoir water increased to the highest level of 1535.9 ± 213.0 and 2381.3 ± 550.3 QSU in summer (ARE), and the highest value was 1240.2 ± 219.8 QSU for downstream water, which appeared in winter. Humic-like and proteinaceous substances in upstream water greatly increased to 386.6 ± 31.5 and 793.4 ± 59.1 QSU in summer (BRE), then dropped to 181.0 ± 96.3 and 430.4 ± 255.5 QSU in winter. The humic-like component was considered as the least abundant, only accounting for 17.7% in the total intensity of fluorophores in spring, and the protein-like moiety accounted for 46.6% as the most abundant for this season and even for the year. The fulvic-like moiety only accounted for 23.2% for baseflow in summer (BRE), becoming the valley value throughout the year, whereas the humic-like moiety shared the highest proportion with 31.2%. The humic-like component in winter positively correlated that of spring and summer (ARE) (r = 0.718, p ≤ 0.01), but greatly varied during summer drought (BRE) period. The fulvic-like component is linked other components, which varied similarly between spring and winter (r = 0.643, p ≤ 0.05).
After rainfall, DOC, a335 and SR generally increased in summer. The mean value increased from 12.9 ± 4.1 mg C·L−1 to 14.9 ± 5.3 mg C·L−1 of DOC, from 17.8 ± 3.6 m−1 to 18.4 ± 3.5 m−1 of a335, from 1.66 ± 0.21 to 1.70 ± 0.22 of SR (Table 2). Conversely, SUVA254, E2/E3 showed a downward trend, decreasing from 4.78 to 4.50 and from 4.95 to 4.28 L·m−1·(mg C)−1 for SUVA254 (Table 2), while humic- and fulvic-like moieties were also much higher than those found in baseflow, averaging 442.5 ± 352.0 and 549.7 ± 192.9 QSU in stormflow, and 318.50 ± 94.72 and 245.3 ± 118.5QSU in baseflow, for humic-like and fulvic-like moieties, respectively. Humic-peak C was re-detected at the excitation/emission wavelength pair of 350/458 nm after rainfall in upstream waters and the average fluorescence intensity was 117.5 ± 17.45 QSU (Figure 2c). In contrast, the fluorescence intensity of protein-like DOM decreased slightly, from 793.4 QSU to 777.4 QSU for upstream waters. However, as for all of the samples, proteinaceous substances significantly increased from 521.2 QSU in baseflow to 733.7 QSU in stormflow, and the protein increment in reservoir water amounted to 556.8 QSU (Figure 2c).
3.4. Land-Use Change in Three Seasons
Land use or cover varied greatly between the SCs in the Duliujian River catchment over changing seasons. The wetland and cropland area showed a shrinking trend through the seasons, with the wetlands accounting for the highest proportion in spring (16.0%) and gradually decreasing in summer and winter (13.1% and 11.9%, respectively). The highest cropland area also appeared in spring (43.3%), and then fell to about 35% in summer and winter. In contrast, rapid urbanization and industrialization led to an expanding trend for built-up and industrial areas, which increased from 11.9% and 6.6% in spring to 24.3% and 11.9% in winter. Unused land in spring and winter (9.42% and 10.3%) accounted for a relatively higher proportion of areas compared with that found in summer (5.83%), but forest land area in summer (17.0%) was a much higher proportion than in spring and winter (12.8% and 6.51%).
4. Discussion
4.1. Characterization of DOM and Spatio-Temporal Variations
The DOC in water samples of Duliujian River was relatively higher, and has been detected at up to 19.2 mg C·L−1 in summer and 21.2 mg C·L−1 in summer-ARE, which is substantially higher than other major rivers and lakes in China, such as Yellow River (9.30 mg C·L−1), Songhua River (14.9 mg C·L−1) and Lake Dianchi (6.24 mg C·L−1) [33,34,35]. Such high DOC in the Duliujian River basin could deteriorate water quality and thus result in serious water pollution. The decomposition of DOM could be associated with water quality of fluvial systems whereas the pH exhibited a significant positive correlation with DO values (r = 0.82, p ≤ 0.01) along with the river flow, in contrast with the sites at Beidagang reservoir, and irrespective of the seasons. This indicates that the aerobic degradation of organic matter was ongoing throughout the year due to weak hydrodynamic conditions in the reservoir [9,27]. However, the migration and transformation of DOM reflected by pH/DO/EC was only observed to occur downstream. The pH/DO had significant positive correlations with DOC or CDOM (r = 0.87, p ≤ 0.01) downstream, exclusive of the anti-correlations (r = −0.81, p ≤ 0.01) in summer before rain, demonstrating the great divergence of source materials and the degradation process in different seasons [15]. Higher water temperature and sunshine in summer also promoted the microbial degradation and photodegradation of particulate organic matter (POM) to increase the consumption of DO [13,15], so DO was relatively lower in summer (BRE) (Table 1). Given that the consumption of DO mainly occurred in the upper course and the enclosed reservoir, it was postulated that the transformation of POM to DOM occurred, with the result that DOC in these two water areas was kept at a high level in summer before the storms. Meanwhile, the flushing processes during rainfall would transport a lot of terrestrial organic matter into the aquatic system [9]. The FDOM components in different seasons highlighted the sources of DOM and their biogeochemical changes [27]. The FDOM results showed that terrestrial fulvic acid-like substances were absent in summer BRE in upstream water, but greatly present in ARE (Figure 2b,c), suggesting that the fulvic acid-like substance is the key signature of terrestrial input of soil-derived DOM in the catchments. Moreover, an autochthonous fulvic acid-like substance of phytoplankton origin, showing peak M intensity than in peak A intensity (Figure 2b) occurred in summer BRE, which was absent in summer ARE, where only the terrestrial fulvic acid-like substances appeared (Figure 2c). However, terrestrial fulvic acid-like substances are similar to each other in summer BRE and ARE in reservoir waters, suggesting that reservoir waters are not affected by terrestrial input, possibly due to the relatively low input of rainwater with respect to the large volume of reservoir water that mix with each other, but are largely affected by terrestrial input in upstream and downstream waters.
In addition, terrestrial humic acid-like substance is apparently identical between summer BRE and ARE, but its intensity is significantly higher in ARE samples than in BRE (Figure 2b,c), which suggests that terrestrial humic acid-like substances could be an additional signature for input of soil-derived DOM. Note that humic acid-like substances from terrestrial material have larger molecular size, more of a benzene ring structure, and higher aromaticity degree [26,27]. Conversely, protein-like substances were relatively higher in summer BRE, which decreased their contents in summer ARE, suggesting that mixing of terrestrial water with each upstream, downstream and reservoir waters can cause the dilution, thereby being responsible for protein-like substances. However, protein-like substances are higher in spring season than summer and winter season, but terrestrial humic-like and fulvic-like substances are differed with each other among upstream, downstream and reservoir, possibly high degradation in summer period (Figure 2). Protein-like substances were produced by the metabolic activities of autochthonous phytoplankton and macrophytes, partly decomposed by microorganisms [29,30,31]. Terrestrial fulvic acid-like substance was absent in winter season, which is similar to summer BRE, possibly due to low precipitation in winter season, which is present in spring and summer ARE, suggesting high precipitation could enhance the terrestrial fulvic acid-like substances in the catchments.
DOM was characterized by higher SR and E2/E3 values in water samples of the reservoir, which had lower MW and more fulvic acid all year [20,36]. Fulvic-like and protein-like DOM have a lighter MW than humic-like DOM [21], supporting the finding that higher content of fulvic- and protein-like substances relative to humic substances made the MW decrease (Table 2). Eighty-one percent of fulvic- and protein-like components in spring resulted in the highest SR value 1.79 and the lowest MW. Correspondingly, the MW increased with the percentage diminution of both components such that they occupied only 77.0% in winter, and the SR value reduced to 1.17, resulting in the MW becoming the largest. As indicated by Figure 3, an FI in the range of 1.40–2.25 was used to identify the source and contribution of organic components [32], suggesting that CDOM was affected by both terrestrial and autochthonous sources. In contrast, the HIX indices were all less than 4 except at site K2, and the BIX values ranged from 0.89 to 1.19 (mostly more than 1), indicating that most DOM was associated with weak humification and autochthonous production of protein-dominant substances. The seasonal variations of HIX values suggested that there were more allochthonous sources of humus in summer and a higher bioreactivity in spring and winter (Figure 3). This could be attributed to the anthropogenic input of nutrients during agricultural production, which resulted in increase of bioactivities in spring [13,27].
The rainfall event had an important impact on organic content, constituents and even peak sites of fluorescent fractions [9,27]. Frequent rainfall combined with higher temperatures resulted in the great distinctions in seasonal patterns of DOM in a rainy summer. Storms/rainfall enhanced the association of terrestrial soil to the streams [42], so DOM in the leaching solution was mainly composed of soil humus and was characteristic of hydrophobicity. Higher temperatures stimulated life activities of phytoplankton to release more labile DOM, which mostly belonged to protein-like DOM, so the DOM and CDOM content also increased to the maximum in summer. Also, strong light irradiation and higher temperatures accelerated the photodecomposition of humic-like DOM [43], so no humic-C was detected in upstream water in summer (BRE) (Figure 2b). The peak sites of various components changed in different environmental media, e.g., fresh water, coastal water and wastewater (Table 3). The detected fluorescent fractions in this study were generally within the ranges of different environmental media listed in Table 3. Before the rain event this was produced from phytoplankton, and after rain events, it was decoupled by the higher contents of the terrestrial fulvic acid-like substances.
In essence, the river water downstream was most influenced by seawater invasion under high water temperature in the drought season. The fluorescent intensity of organic fractions generally increased with the seasonal changes [9], but upon entering the winter, humic-, fulvic-, and protein-like moieties all decreased whether in upstream or reservoir water, which caused the total fluorescent intensity to decrease from 1726 QSU in summer (ARE) to 1095.4 QSU in winter. Actually, the spatio-temporal variation of DOM in the catchment was not only related to physical migration of materials from land to water and from upstream to downstream, but also to the chemical transformation of the organic fraction [6]. The fulvic acid-like moiety in upstream water was not detected in summer (BRE) or in winter, but the humic- and protein-like proportion in these two seasons was elevated instead, presumably because of low precipitation in both timescales during the sampling period.
Overall, the contents of three moieties were all elevated after the rainfall because of the runoff transportation, whereas the relative proportion of fulvic-like moiety increased from 23.2% to 31.9% and decreased from 31.2% to 25.6% for the humic-like moiety, resulting predominantly from the photolysis of humic-like moiety into the fulvic-like moiety of lower MW and simpler structures in upstream and downstream water. Meanwhile, the reduction of protein was mainly triggered by the diminution of protein in upstream water, indicating that the protein was probably decomposed or polymerized into larger molecules of fulvic-like moiety. It seemed that the fluorescent fraction easily accumulated in winter due to weak hydrological condition or low precipitation [9,27]. It amounted to 1240.2 QSU in downstream water and seawater had little impact on low-temperature river water.
4.2. Effect of Land Use on DOM in the Subcatchments
Transport of terrestrial DOM is generally dependent on steady flow dynamics in flow path/runoff [7,33], and rainfall is seasonal and highly varied in Duliujian River catchment. It was reported that in glacial-fed rivers, DOC, a254 and aromaticity were enhanced corresponding to the increasing distance from the glacial terminus, which was controlled largely by glacial or snow meltwater [44]. Two aspects (rainfall and buffer distance from water source) were considered to utilize spatial geographic analysis techniques to probe the effect of land use on organic matter in the catchment. As illustrated by Figure 4, CDOM in spring mainly originated from cropland and built-up areas. In the nearer buffer distance (within 60 m), cropland played an important role in CDOM production, but built-up land became the predominant controlling factor influencing CDOM distribution in the SCs. Cropland would accumulate large amounts of organic matter in land due to growth of crops each year, and supply a lot of DOM for flushing after rainfall.
The effect of land-use types on a335 appeared to exhibit seasonal differences with buffer distance, with CDOM content in winter mainly affected by unused land (Figure 4d). The content of CDOM or DOC seems to be strongly associated with the industrial land in summer, even in the whole SCs, especially after a rainfall event (Figure 4b,c). Storms are vital in the catchment for the annual output flux of DOC, with shifts in the biodegradability and chemical quality of DOM [45], and more storms in summer may be the driver of CDOM variance, especially in the monsoon zone [9]. Land use in SCs or farther riparian buffer zones (such as a 150 m scale) was concentrated and contiguous (Figure 4c), and CDOM was also affected through a nonpoint source, like cropland and unused land (p < 0.05), except for industrial land after a storm. Comprehensively taking into account the significant correlations between land use of different types and DOC or CDOM, it is shown that 60 m and the whole SCs were the critical buffer distance and the key research area.
Wastewater could affect DOM biodegradability by changing hydrophobicity, MW and the main components [1]. The negative influence of industrial land on DOM could be applied to the SCs (p < 0.05), so this kind of land type did not play a role in replenishing DOC or CDOM in summer before rain (Figure 5b), or even suppressing the production or accumulation of DOM. The adverse relationship became more obvious between the industrial land area and DOM/CDOM with the enlarging buffer range, for SCs, when the industrial land was widespread, the DOM/CDOM content instead reduced (r = −0.88/−0.88, p < 0.05 in summer) (Figure 5b). The discharge of industrial effluent DOM into the environment not only influences nutrient uptake by bacteria, plankton and algae but also changes DOM level and physicochemical properties of sediments [1]. Toxic metals in industrial wastewater can limit the photosynthesis of algae, especially excessive Hg, Pb, Cr in the Duliujian River catchment [46]. The presence of Hg in the medium causes a lag in growth, and the binding and absorption of mercury by cells do not depend on temperature, as with Cr [47]. However, due to the differences of wastewater sources, area, seasonal changes and operational conditions, the transformations of DOM may not always catch this change of industrial area (p > 0.05 in spring and winter). In spring/summer, SUVA254 increased with the expansion of industrial land (60 m/SCs: r = 0.82/0.76) (Figure 5a,b,d,e), and manufacturing activity contributed much to the aromaticity of DOM. The aromaticity (SUVA254) in spring reached its peak, mainly caused by the high aromaticity of DOM in the lower course, at 28.8 L·m−1·(mg C)−1 (Table 2), indicating that low-MW of DOM had higher aromaticity without intense photolysis and was primarily related to the anthropogenic discharge of industrial pollutants downstream. Cement and asphalt roads with the development of construction business reduced runoff leaching and directly resulted in more terrestrial soil-derived DOM being transported into streams [48]. Domestic sewage in the built-up area and excretion/degradation of vegetation in forest land contributed to SUVA254 in the summer (BRE, SCs) and winter (60 m) (Figure 5b,f).
The built-up area alters the permeability and connectivity of soil compartments in the catchment and further affects the optical properties of organic matter by runoff response [7,49]. CDOM content (a335), protein-Tuv/T and hydrophobic CDOM (a260) increased as the built-up area was enlarged (SCs: r = 0.71, 0.76 and 0.72, p < 0.05 especially in spring) (Figure 5d). The intensive anthropogenic urban area enhanced protein-rich DOM input and accumulation, and frequent microbial and phytoplankton activities may be stimulated owing to nitrogen and phosphorus input from domestic sewage [48]. Domestic sewage (commercial detergent, etc.) and litter leachate have also been confirmed as the main sources of the labile, the easily degradable protein-rich DOM of the river water [14], and further affected CDOM content (a335) (Figure 5d). Also, a higher percentage of built-up areas in SCs mean more human activities, and hydrophobic CDOM such as terrestrial humus could more easily be carried into surrounding streams with the land development activities around the near riparian zones to increase the a260 [7,48].
Fibrous plants in the catchment are an important subsidiary source for soil carbon pools, and upper soil layers have a plant-derived DOM [14,50]. Compared with the built-up areas, forest land could produce more DOM with a larger MW in the soil [48]. As illustrated in Figure 5a,c,d,f, the higher percentage of forest land showed higher DOC whether in the SCs or 60-m buffer scale in spring and winter than in summer before rainfall, probably due to lack of runoff which drove DOM migration into streams in drought season [51]. From epiphytes and atmospheric deposition, DOM from fresh leaf litter is a mixture of multi-sources and may show a protein-rich DOM signal [50], but we could not find any significant correlation between protein-rich DOM and the forest land proportion in this study. The loss of DOM for flow paths below 0.3 m is significant enough to alter seasonal patterns of DOM [14]. Terrestrial CDOM (like fulvic-like DOM) may be adsorbed to soil particles and colloids, followed by the preferential removal of humic and aromatic constituents in the upper soil profiles by runoff or even strong winds. Thus, a335 increased as the unused land proportion increased (r = 0.67, p < 0.05) (Figure 5b).
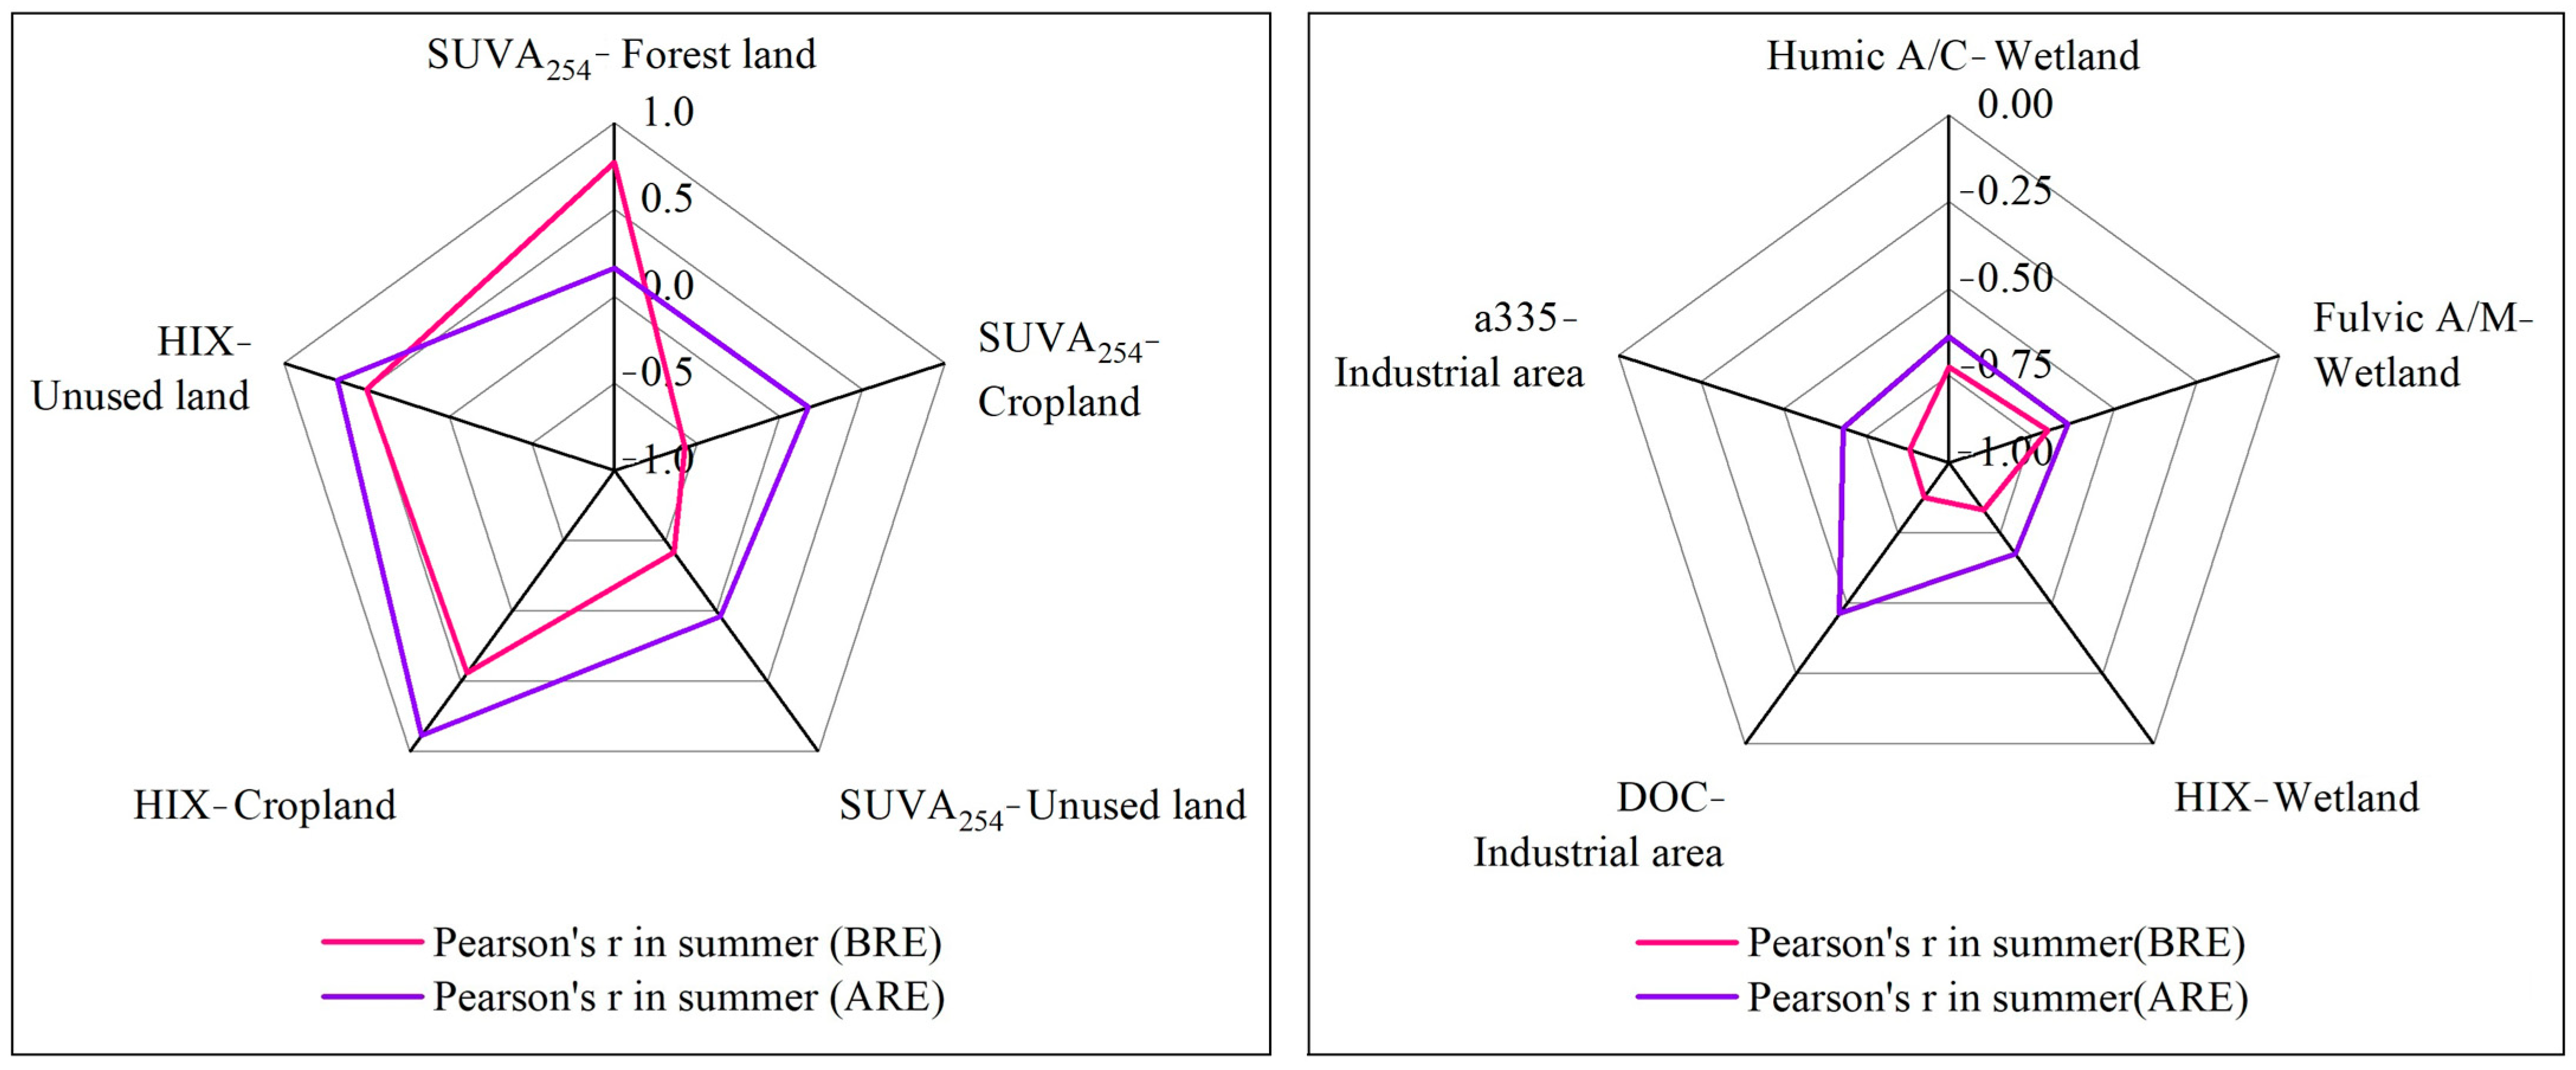
Erosion of nitrogen and phosphorus from agricultural fertilizer led to water eutrophication and algae growth, which increased CDOM content in summer [52]. The anthropogenic input of organic fertilizer increased nutrients N and P in spring and summer, with the result that the microbial behavior was activated and BIX varied positively with cropland use (Figure 5a,b,d,e). Increasing of microbial activity and algal growth in the aquatic environment by agricultural practices would lead to high transformation of the source of organic matter in waters [13,26]. This is probably responsible for the observed pattern.
Wetland became the predominant factor influencing BIX with agricultural activities attenuating in winter. Wetland could not well quantify the effect on CDOM in spring/winter (p > 0.05), but had a significant negative impact in summer (Figure 5b). The smaller intensity of humic-A and fulvic-A/M was related to the larger percentage of wetland area (SCs: r = −0.72/−0.70, p < 0.05, especially in summer). Rainwater could also be intercepted by a low-lying terrain with many ponds/ditches, resulting in a weakening of overland runoff. Organic matter in wetland soil or sediment gradually accumulated and decomposed due to long-term anaerobic conditions [53,54]. DOM was sorbed to mineral soil horizons and lost along with groundwater flow paths [14]. This further adversely affected HIX and positively affected SR in fluvial systems (SCs: r = −0.78, p < 0.05 and r = 0.83, p < 0.01, especially in summer), which showed that a higher percentage of wetland in the SCs was in favor of producing DOM of lower MW and humification (Figure 5b).
Generally, reducing the proportion of industrial land in subcatchments would help reduce the DOM aromaticity in surrounding rivers and restore the productivity of algae and other phytoplankton. Expansion of controlling the ratio of built-up area and cropland usually inhibits the protein-like DOM content and avoids water eutrophication. Enlarging the proportion of wetland in subcatchments decreases humic-derived or fulvic-derived DOM content, namely humification degree. In summary, controlling the discharge from cropland and domestic sewage in spring and winter, elevating the proportion of unused land and especially regulating the industrial land in summer can effectively avoid serious pollution and water quality deterioration, and then improve water quality.
4.3. Effects of Rainfall on Organic Matter Characteristics under Different Land-Use Types
The differences in linear correlations between optical properties and land-use types before/after rainfall are shown in Figure 6. Rainwater could wash the upper soil and carry humic substances and aromatic CDOM into streams [14,33], especially for the cropland and unused land in the present study. A high proportion of industrial area could enhance the DOM flushing processes during a storm due to slow the filtration of rain [9]. Unused land and cropland negatively affected SUVA254 (r = −0.42/−0.57, p > 0.05), but this effect turned positive after rainfall (r = 0.04/0.17, p > 0.05) (Figure 6a) due to new DOM from flushing processes [9], suggesting that rainfall and leaching carried the soil-derived aromatic-rich DOM from cropland/unused land in a flood season. Furthermore, cropland and unused land contributed more to the HIX of DOM (BRE: r = 0.44/0.50, p > 0.05; ARE: r = 0.886/0.678, p < 0.05) (Figure 6a). Thus, enhanced release of terrestrial humic substances from cropland and unused land by rainwater discharge after rainfall is primarily responsible for changing DOM composition in the ambient aquatic environments and catchments.
In a summer drought, the wetland area gradually shrank before a rainfall event, but a large amount of terrestrial/anthropogenic organic matter (especially rich in humic-like A/C, fulvic-like A/M) was still carried mainly from upstream into the water of SCs by surface or groundwater runoff [55]. Humic-A/C and fulvic-A/M anti-correlated to wetland proportion (BRE: r = −0.72/−0.70, p < 0.05), but the effect was weakened by heavy rainfall (ARE: r = −0.64/−0.64, p > 0.05) (Figure 6b). There is relatively strong buffering capacity of material transportation in wetland [3,27]. We have not found great variations in protein-like components related to land-use types after a storm. In general, protein-like components were easily produced, used, and degraded by microbiology [27]. Large molecular humus was more sensitive to different types of land use compared with protein-like DOM during stormflow. Other than the input of organic matter upstream, this difference in DOM was also probably attributed to preferential preservation of humic/aromatic DOM in the upper soil profile by sorption on mineral soil surfaces before rain [14]. In this process, DOM migration also eventually reflected the variation in optical characteristics, humification and aromaticity indices of DOM responded relatively more sensitively to land-use types after the storm. The correlation between industrial area proportion and attenuated DOC or CDOM content (BRE: r = −0.88/−0.88, p < 0.05; ARE: r = −0.64/−0.68, p > 0.05), may be related to the input of allochthonous organic matter in the rainy season (Figure 6b). Differentiated land-use types resulted in the content and properties of DOM changing significantly in the studied SCs. Vegetation cover and human activities under various subcatchments would influence the supply of enhanced terrestrial DOM to downstream catchments [3,10,13]. Land use could be a major driver on riverine DOM compositions in the Duliujian River basin.
5. Conclusions
The spatio-temporal distribution of DOM and its optical properties, the sources of DOM, were analyzed through seasonal observation. The influence of different land-use types associated with seasonal change on the content of DOM and characteristics in the SCs was investigated in a typical river of Northern China. Four fluorescent components were identified by EEM-PARAFAC analysis and they were denoted as terrestrial humic acid-like, terrestrial fulvic acid-like, autochthonous fulvic acid-like, and protein-like substances. The contents of DOC, CDOM and hydrophobic DOM were higher in summer, but aromaticity was lower in spring. The results of this research suggested that rainfall increased DOC, CDOM content, but reduced CDOM aromaticity and MW during the period after a storm.
DOM in surface water was mostly affected in summer ARE by the soil-derived terrestrial HA-like substances and terrestrial FA-like substances in the downward catchments, such as upstream and downstream. The built-up area benefited the accumulation of FDOM (especially protein-like DOM). A storm accelerated the material cycle, and humic-rich DOM and MW/aromaticity were relatively more sensitive to land use. Rainfall-induced changes can ultimately enhance high aromatic ingredients and DOM aromaticity. Comprehensive analysis of DOM characteristics and land-use types provides a new perspective for investigating the carbon cycle and urbanization process in the catchment. This study will be conducive to improving the understanding of aquatic ecosystem metabolism and strengthen water quality management in a seriously polluted catchment.
Author Contributions
Z.H., conceptualization, software, formal analysis, investigation, data curation, writing—original draft preparation; M.X., conception, methodology, validation, formal analysis, data curation, writing—original draft preparation, writing—review and editing, visualization, supervision, project administration, project administration, funding acquisition; F.Y., methodology, investigation, resources; Y.Y., formal analysis; K.M.G.M., validation, visualization. All authors have read and agreed to the published version of the manuscript.
Funding
This research was funded by the National Natural Science Foundation China (41373138), Talent Introduction Project (5KGCC18002) from Tianjin Normal University, China and The Post-graduate and doctoral Innovation Project of Tianjin (2019YJSS123).
Institutional Review Board Statement
Not applicable.
Informed Consent Statement
Not applicable.
Data Availability Statement
The data presented in this study are available on request from the corresponding author. The data are not publicly available due to funding requirement.
Acknowledgments
We thank Eileen Richardson from University of Glasgow for polishing the English of this manuscript.
Conflicts of Interest
The authors declare no conflict of interest.
References
- Wang, M.; Chen, Y. Generation and characterization of DOM in wastewater treatment processes. Chemosphere 2018, 201, 96–109. [Google Scholar] [CrossRef]
- Singh, S.; D′Sa, E.J.; Swenson, E.M. Chromophoric dissolved organic matter (CDOM) variability in Barataria Basin using excitation-emission matrix (EEM) fluorescence and parallel factor analysis (PARAFAC). Sci. Total Environ. 2010, 408, 3211–3222. [Google Scholar] [CrossRef] [PubMed]
- Lambert, T.; Bouillon, S.; Darchambeau, F.; Morana, C.; Roland, F.A.E.; Descy, J.-P.; Borges, A.V. Effects of human land use on the terrestrial and aquatic sources of fluvial organic matter in a temperate river basin (The Meuse River, Belgium). Biogeochemistry 2017, 136, 191–211. [Google Scholar] [CrossRef] [Green Version]
- Persson, T.; Wedborg, M. Multivariate evaluation of the fluorescence of aquatic organic matter. Anal. Chim. Acta 2001, 434, 179–192. [Google Scholar] [CrossRef]
- Huguet, A.; Vacher, L.; Relexans, S.; Saubusse, S.; Froidefond, J.-M.; Parlanti, E. Properties of fluorescent dissolved organic matter in the Gironde Estuary. Org. Geochem. 2009, 40, 706–719. [Google Scholar] [CrossRef]
- Mostofa, K.M.G.; Yuan, J.; Sakugawa, H.; Liu, C.-Q. Equal treatment of different EEM data on parafac modeling produces artifact fluorescent components that have misleading biogeochemical consequences. Environ. Sci. Technol. 2019, 53, 561–563. [Google Scholar] [CrossRef] [Green Version]
- Shao, T.; Wang, T. Effects of land use on the characteristics and composition of fluvial chromophoric dissolved organic matter (CDOM) in the Yiluo River watershed, China. Ecol. Indic. 2020, 114, 106332. [Google Scholar] [CrossRef]
- Evans, C.D.; Freeman, C.; Monteith, D.T.; Reynolds, B.; Fenner, N. Climate change (Communication arising): Terrestrial export of organic carbon. Nature 2002, 415, 862–863. [Google Scholar] [CrossRef]
- Shin, Y.; Lee, E.-J.; Jeon, Y.-J.; Hur, J.; Oh, N.-H. Hydrological changes of DOM composition and biodegradability of rivers in temperate monsoon climates. J. Hydrol. 2016, 540, 538–548. [Google Scholar] [CrossRef]
- Mattsson, T.; Kortelainen, P.; Räike, A. Export of DOM from boreal catchments impacts of land use cover and climate. Biogeochemistry 2005, 76, 373–394. [Google Scholar] [CrossRef]
- Stockwell, J.D.; Doubek, J.P.; Adrian, R.; Anneville, O.; Carey, C.C.; Carvalho, L.; De Senerpont Domis, L.N.; Dur, G.; Frassl, M.A.; Grossart, H.-P.; et al. Storm impacts on phytoplankton community dynamics in lakes. Glob. Chang. Biol. 2020, 26, 2756–2784. [Google Scholar] [CrossRef] [PubMed] [Green Version]
- Fellman, J.B.; D′Amore, D.V.; Hood, E.; Boone, R.D. Fluorescence characteristics and biodegradability of dissolved organic matter in forest and wetland soils from coastal temperate watersheds in southeast Alaska. Biogeochemistry 2008, 88, 169–184. [Google Scholar] [CrossRef]
- Wilson, H.F.; Xenopoulos, M.A. Effects of agricultural land use on the composition of fluvial dissolved organic matter. Nat. Geosci. 2009, 2, 37–41. [Google Scholar] [CrossRef]
- Zhao, Q.; Liu, S.; Deng, L.; Dong, S.; Yang, Z.; Liu, Q. Determining the influencing distance of dam construction and reservoir impoundment on land use: A case study of Manwan Dam, Lancang River. Ecol. Eng. 2013, 53, 235–242. [Google Scholar] [CrossRef]
- Singh, S.; Inamdar, S.; Mitchell, M.; McHale, P. Seasonal pattern of dissolved organic matter (DOM) in watershed sources: Influence of hydrologic flow paths and autumn leaf fall. Biogeochemistry 2014, 118, 321–337. [Google Scholar] [CrossRef]
- Chen, Y.; Song, Q.; Pan, L.; Jia, M.; Li, C.; Hu, B.; Wu, G. Trace metals, organic carbon and nutrients in the Beidagang Wetland Nature Reserve, northern China. PLoS ONE 2018, 13, e0204812. [Google Scholar] [CrossRef] [PubMed] [Green Version]
- Liang, X.Q.; Sun, X.W.; Huang, T.S.; Huang, H.; Zhang, H.Y. Spatial distribution characteristics of total nitrogen, total phosphorus and organic matter in surface sediments of Duliujianhe River. IOP Conf. Ser. Mater. Sci. Eng. 2018, 392, 042044. [Google Scholar] [CrossRef]
- Rochelle-Newall, E.J.; Fisher, T.R. Chromophoric dissolved organic matter and dissolved organic carbon in Chesapeake Bay. Mar. Chem. 2002, 77, 23–41. [Google Scholar] [CrossRef]
- Dilling, J.; Kaiser, K. Estimation of the hydrophobic fraction of dissolved organic matter in water samples using UV photometry. Water. Res. 2002, 36, 5037–5044. [Google Scholar] [CrossRef]
- Barreto, S.R.G.; Nozaki, J.; Barreto, W.J. Origin of Dissolved Organic Carbon Studied by UV-vis Spectroscopy. Acta Hydrochim. Hydrobiol. 2003, 31, 513–518. [Google Scholar] [CrossRef]
- Helms, J.R.; Stubbins, A.; Ritchie, J.D.; Minor, E.C.; Kieber, D.J.; Mopper, K. Absorption spectral slopes and slope ratios as indicators of molecular weight, source, and photobleaching of chromophoric dissolved organic matter. Limnol. Oceanogr. 2008, 53, 955–969. [Google Scholar] [CrossRef] [Green Version]
- Weishaar, J.L.; Aiken, G.R.; Bergamaschi, B.A.; Fram, M.S.; Fujii, R.; Mopper, K. Evaluation of specific ultraviolet absorbance as an indicator of the chemical composition and reactivity of dissolved organic carbon. Environ. Sci. Technol. 2003, 37, 4702–4708. [Google Scholar] [CrossRef] [PubMed]
- Murphy, K.R.; Butler, K.D.; Spencer, R.G.; Stedmon, C.A.; Boehme, J.R.; Aiken, G.R. Measurement of dissolved organic matter fluorescence in aquatic environments: An interlaboratory comparison. Environ. Sci. Technol. 2010, 44, 9405–9412. [Google Scholar] [CrossRef] [PubMed]
- Zsolnay, A.; Baigar, E.; Jimenez, M.; Steinweg, B.; Saccomandi, F. Differentiating with fluorescence spectroscopy the sources of dissolved organic matter in soils subjected to drying. Chemosphere 1999, 38, 45–50. [Google Scholar] [CrossRef]
- Tedetti, M.; Cuet, P.; Guigue, C.; Goutx, M. Characterization of dissolved organic matter in a coral reef ecosystem subjected to anthropogenic pressures (La Réunion Island, Indian Ocean) using multi-dimensional fluorescence spectroscopy. Sci. Total Environ. 2011, 409, 2198–2210. [Google Scholar] [CrossRef]
- Ishii, S.K.; Boyer, T.H. Behavior of reoccurring PARAFAC components in fluorescent dissolved organic matter in natural and engineered systems: A critical review. Environ. Sci. Technol. 2012, 46, 2006–2017. [Google Scholar] [CrossRef]
- Mostofa, K.M.G.; Yoshioka, T.; Mottaleb, A.; Vione, D. Photobiogeochemistry of Organic Matter; Springer: Berlin/Heidelberg, Germany, 2013. [Google Scholar]
- Ni, B.-J.; Fang, F.; Xie, W.-M.; Sun, M.; Sheng, G.-P.; Li, W.-H.; Yu, H.-Q. Characterization of extracellular polymeric substances produced by mixed microorganisms in activated sludge with gel-permeating chromatography, excitation–emission matrix fluorescence spectroscopy measurement and kinetic modeling. Water Res. 2009, 43, 1350–1358. [Google Scholar] [CrossRef] [PubMed]
- Romera-Castillo, C.; Sarmento, H.; Alvarez-Salgado, X.A.; Gasol, J.M.; Marrasé, C. Net production and consumption of fluorescent colored dissolved organic matter by natural bacterial assemblages growing on marine phytoplankton exudates. Appl. Environ. Microbiol. 2011, 77, 7490–7498. [Google Scholar] [CrossRef] [Green Version]
- Mostofa, K.M.G.; Li, W.; Wu, F.C.; Liu, C.Q.; Liao, H.; Zeng, L.; Xiao, M. Environmental characteristics and microbial changes of sediment pore water dissolved organic matter in four Chinese. Environ. Sci. Pollut. Res. 2018, 25, 2783–2804. [Google Scholar] [CrossRef]
- Zhang, Y.; Liu, X.; Wang, M.; Qin, B. Compositional differences of chromophoric dissolved organic matter derived from phytoplankton and macrophytes. Org. Geochem. 2013, 55, 26–37. [Google Scholar] [CrossRef]
- McKnight, D.M.; Boyer, E.W.; Westerhoff, P.K.; Doran, P.T.; Kulbe, T.; Andersen, D.T. Spectrofluorometric characterization of dissolved organic matter for indication of precursor organic material and aromaticity. Limnol. Oceanogr. 2001, 46, 38–48. [Google Scholar] [CrossRef]
- Ran, L.; Lu, X.X.; Sun, H.; Han, J.; Li, R.; Zhang, J. Spatial and seasonal variability of organic carbon transport in the Yellow River, China. J. Hydrol. 2013, 498, 76–88. [Google Scholar] [CrossRef]
- Xiao, M.; Wu, F.C.; Yi, Y.B.; Han, Z.; Wang, Z. Optical Properties of Dissolved Organic Matter and Controlling Factors in Dianchi Lake Waters. Water 2019, 11, 1967. [Google Scholar] [CrossRef] [Green Version]
- Zhao, Y.; Song, K.; Lv, L.; Wen, Z.; Du, J.; Shang, Y. Relationship changes between CDOM and DOC in the Songhua River affected by highly polluted tributary, Northeast China. Environ. Sci. Pollut. Res. 2018, 25, 25371–25382. [Google Scholar] [CrossRef]
- Zhou, Y.; Zhang, Y.; Shi, K.; Liu, X.; Niu, C. Dynamics of chromophoric dissolved organic matter influenced by hydrological conditions in a large, shallow, and eutrophic lake in China. Environ. Sci. Pollut. Res. 2015, 22, 12992–13003. [Google Scholar] [CrossRef] [PubMed]
- Maie, N.; Scully, N.M.; Pisani, O.; Jaffé, R. Composition of a protein-like fluorophore of dissolved organic matter in coastal wetland and estuarine ecosystems. Water Res. 2007, 41, 563–570. [Google Scholar] [CrossRef] [PubMed]
- McIntyre, A.M.; Guéguen, C. Binding interactions of algal-derived dissolved organic matter with metal ions. Chemosphere 2013, 90, 620–626. [Google Scholar] [CrossRef]
- Yu, H.; Song, Y.; Tu, X.; Du, E.; Liu, R.; Peng, J. Assessing removal efficiency of dissolved organic matter in wastewater treatment using fluorescence excitation emission matrices with parallel factor analysis and second derivative synchronous fluorescence. Bioresour. Technol. 2013, 144, 595–601. [Google Scholar] [CrossRef]
- Wang, J.; Li, H.; Chen, Y.; Fang, Y.; Wang, Z.; Tao, T.; Zuo, Y. Comparative characterisation of two fulvic acids from East Lake and Liangzi Lake in central China. Environ. Chem. 2015, 12, 189–197. [Google Scholar] [CrossRef]
- Du, X.; Xu, Z.; Li, J.; Zheng, L. Characterization and removal of dissolved organic matter in a vertical flow constructed wetland. Ecol. Eng. 2014, 73, 610–615. [Google Scholar] [CrossRef]
- Correll, D.L.; Jordan, T.E.; Weller, D.E. Effects of precipitation, air temperature, and land use on organic carbon discharges from Rhode River watersheds. Water. Air. Soil. Pollut. 2001, 128, 139–159. [Google Scholar] [CrossRef]
- Yang, X.M.; Yuan, J.; Yue, F.J.; Li, S.L.; Wang, B.L.; Mohinuzzaman, M.; Liu, Y.J.; Senesi, N.; Lao, X.Y.; Li, L.L. New insights into mechanisms of sunlight- and dark-mediated high-temperature accelerated diurnal production-degradation of fluorescent DOM in lake waters. Sci. Total Environ. 2021, 760, 143377. [Google Scholar] [CrossRef] [PubMed]
- Zhou, Y.; Zhou, L.; He, X.; Jang, K.-S.; Yao, X.; Hu, Y.; Zhang, Y.; Li, X.; Spencer, R.G.; Brookes, J.D. Variability in dissolved organic matter composition and biolability across gradients of glacial coverage and distance from glacial terminus on the Tibetan Plateau. Environ. Sci. Technol. 2019, 53, 12207–12217. [Google Scholar] [CrossRef]
- Fellman, J.; Hood, E.; Edwards, R.; D′Amore, D. Changes in the concentration, biodegradability, and fluorescent properties of dissolved organic matter during stormflows in coastal temperate watersheds. J. Geophys. Res. 2009, 114, 114. [Google Scholar] [CrossRef]
- Zeng, S.; Dong, X.; Chen, J. Toxicity assessment of metals in sediment from the lower reaches of the Haihe River Basin in China. Int. J. Sediment Res. 2013, 28, 172–181. [Google Scholar] [CrossRef]
- Vignati, D.A.L.; Dominik, J.; Beye, M.L.; Pettine, M.; Ferrari, B.J.D. Chromium(VI) is more toxic than chromium(III) to freshwater algae: A paradigm to revise? Ecotoxicol. Environ. Saf. 2010, 73, 743–749. [Google Scholar] [CrossRef] [PubMed]
- Shi, Y.; Zhang, L.; Li, Y.; Zhou, L.; Zhou, Y.; Zhang, Y.; Huang, C.; Li, H.; Zhu, G. Influence of land use and rainfall on the optical properties of dissolved organic matter in a key drinking water reservoir in China. Sci. Total Environ. 2020, 699, 134301. [Google Scholar] [CrossRef] [PubMed]
- Endreny, T.A. Land Use and Land Cover Effects on Runoff Processes: Urban and Suburban Development. In Encyclopedia of Hydrological Sciences; Anderson, M.G., McDonnell, J.J., Eds.; John Wiley & Sons, Ltd.: Chichester, UK, 2005; p. 122. [Google Scholar]
- Van Stan, J.T.; Stubbins, A. Tree-DOM: Dissolved organic matter in throughfall and stemflow. Limnol. Oceanogr. Lett. 2018, 3, 199–214. [Google Scholar] [CrossRef]
- Li, B.; Xiao, W.; Wang, Y.; Yang, M.; Huang, Y. Impact of land use/cover change on the relationship between precipitation and runoff in typical area. J. Water. Clim. Chang. 2018, 9, 261–274. [Google Scholar] [CrossRef]
- Lee, G.F.; Jones-Lee, A. Assessing the Water Quality Impacts of Phosphorus in Runoff from Agricultural Lands. In Environmental Impact of Fertilizer on Soil and Water, ACS Symposium Series; American Chemical Society: Washington, DC, USA, 2003; pp. 207–219. [Google Scholar]
- Dalmagro, H.J.; Johnson, M.S.; de Musis, C.R.; Lathuillière, M.J.; Graesser, J.; Pinto-Júnior, O.B.; Couto, G. Spatial patterns of DOC concentration and DOM optical properties in a Brazilian tropical river-wetland system. J. Geophys. Res. Biogeosci. 2017, 122, 1883–1902. [Google Scholar] [CrossRef]
- Hansen, V.D.; Nestlerode, J.A. Carbon sequestration in wetland soils of the northern Gulf of Mexico coastal region. Wetl. Ecol. Manag. 2014, 22, 289–303. [Google Scholar] [CrossRef]
- Winter, T.C. Relation of streams, lakes, and wetlands to groundwater flow systems. Hydrogeol. J. 1999, 7, 28–45. [Google Scholar] [CrossRef]
Figure 1.
(a) The Duliujian River catchment in China; (b) Sampling sites and land-use types in the Duliujian River catchment based on Landsat satellite data in 2019. K, T represents the sampling sites of Beidagang and Tuanbowa Reservoir, R1–R6 denotes the sampling sites of downstream, R7–R12 indicates the sampling sites of upstream. (c) Buffer zones of different river areas (trunk and tributaries).
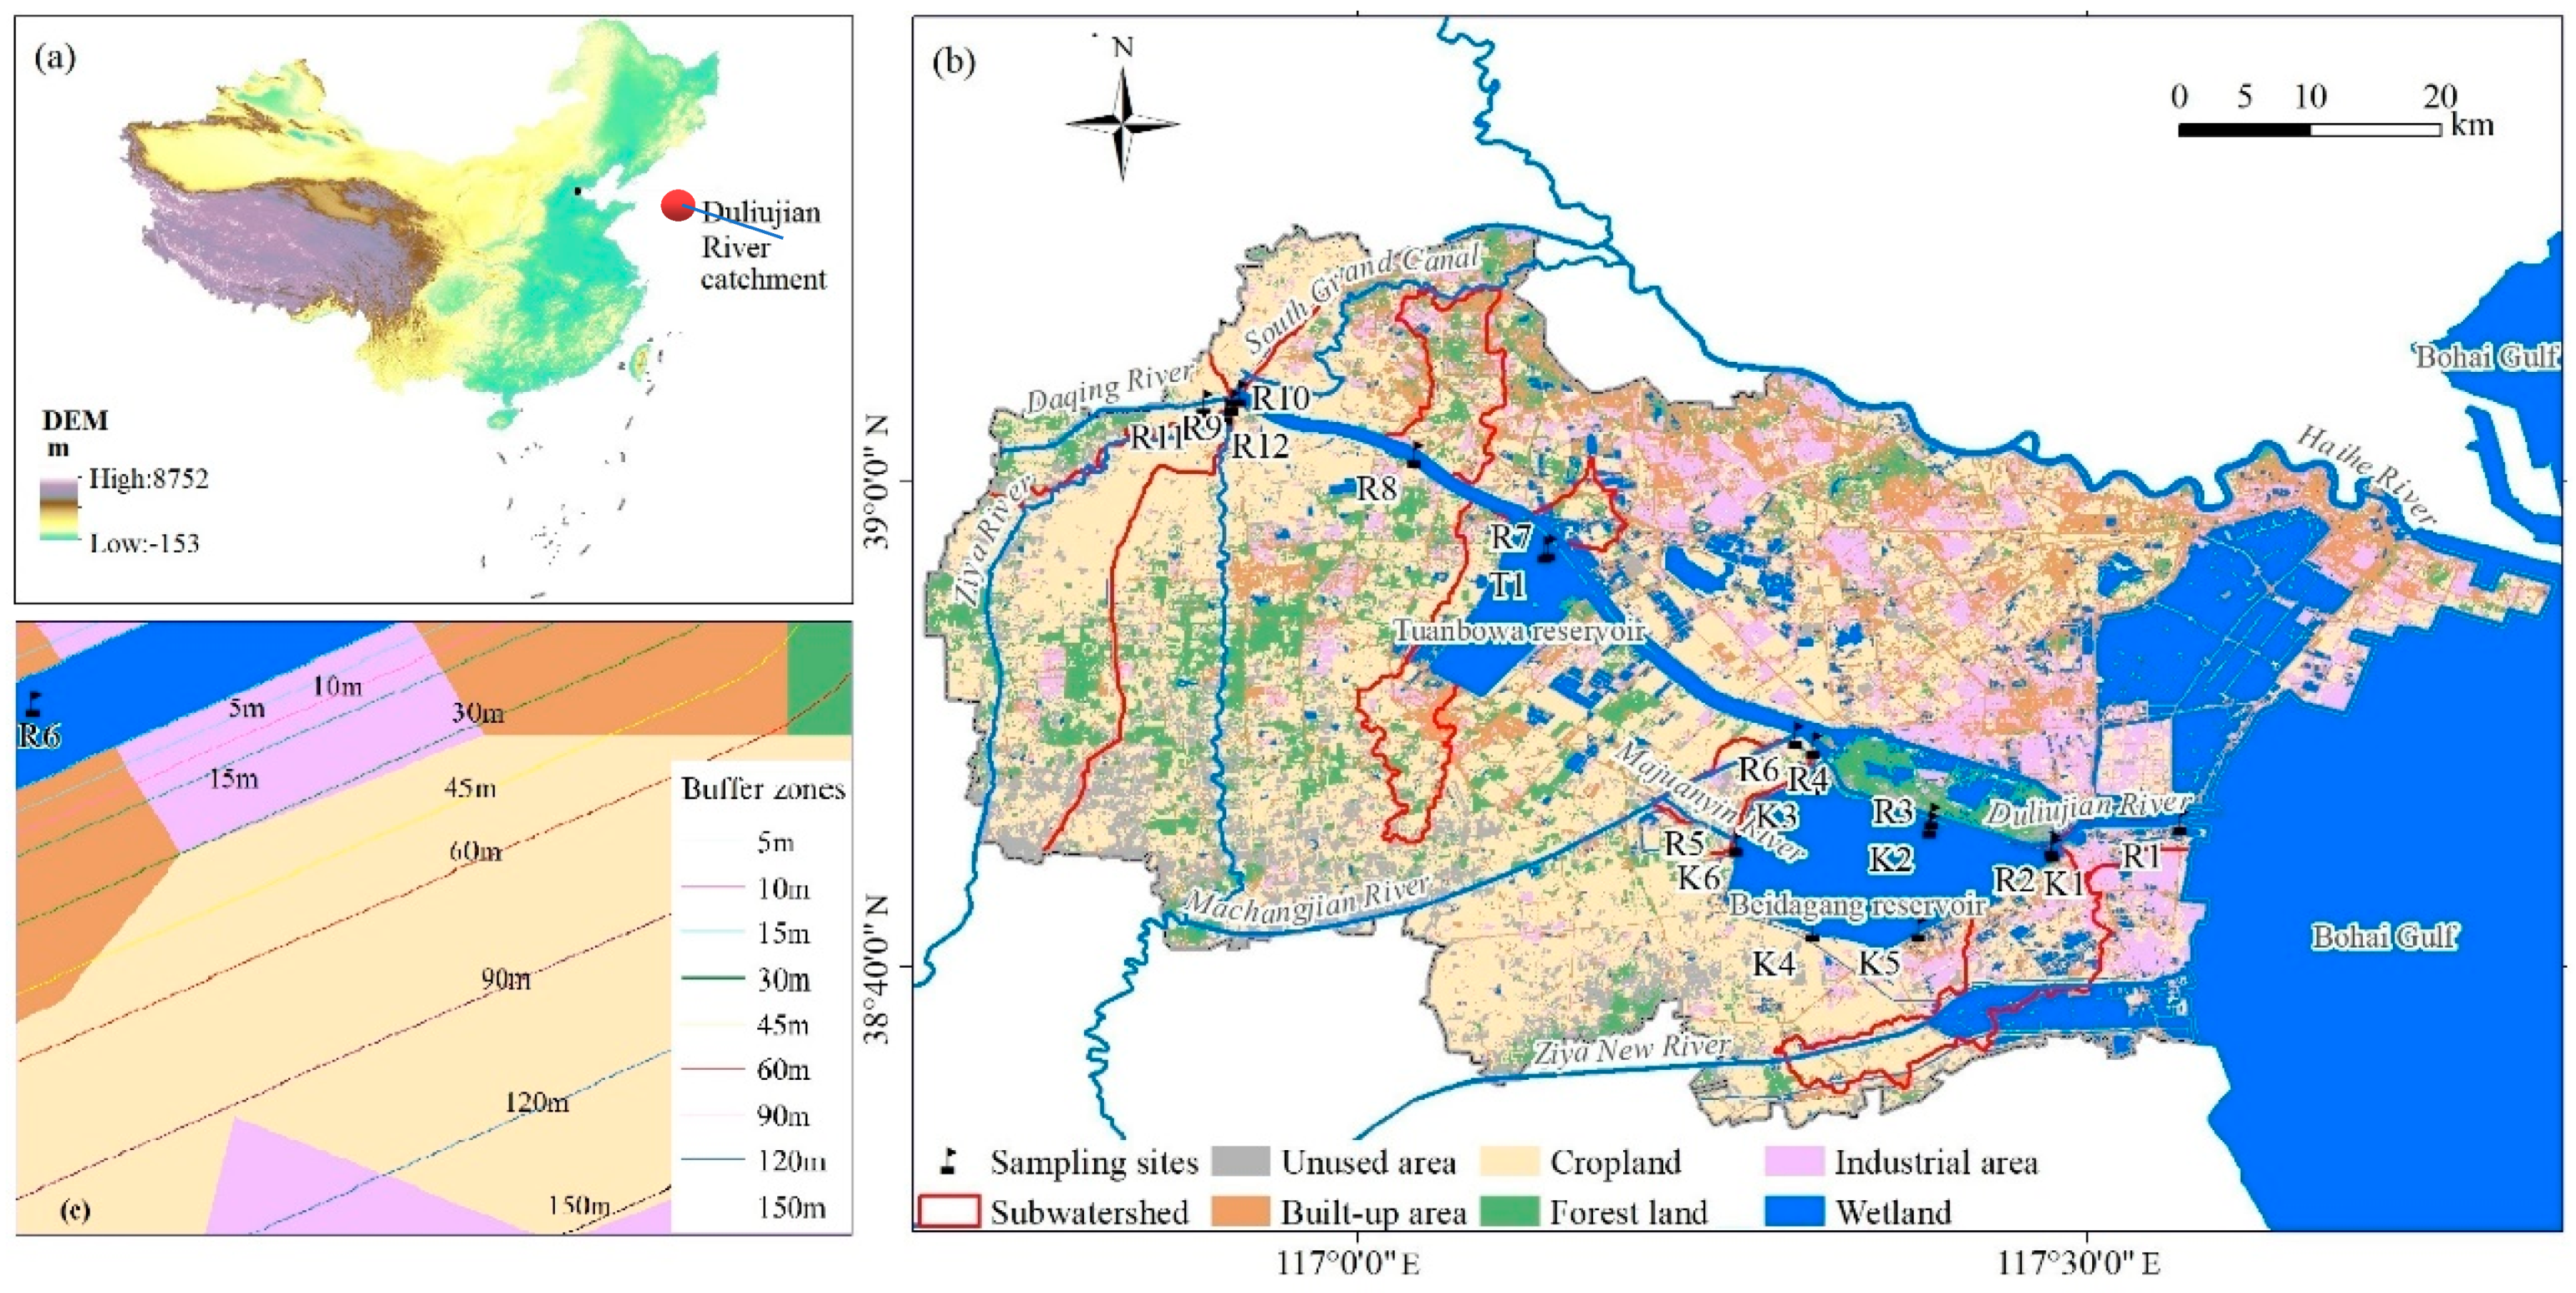
Figure 2.
Identification of fluorescent components in the Duliujian River catchment. (a) demonstrated the fluorescent components in spring; (b) demonstrated fluorescent components in summer before rainfall event (BRE); (c) demonstrated fluorescent components in summer after rainfall event (ARE) and (d) demonstrated fluorescent components in winter.) Upstream: R7–R12; Downstream: R1–R6; Reservoir: T, K1–K6).
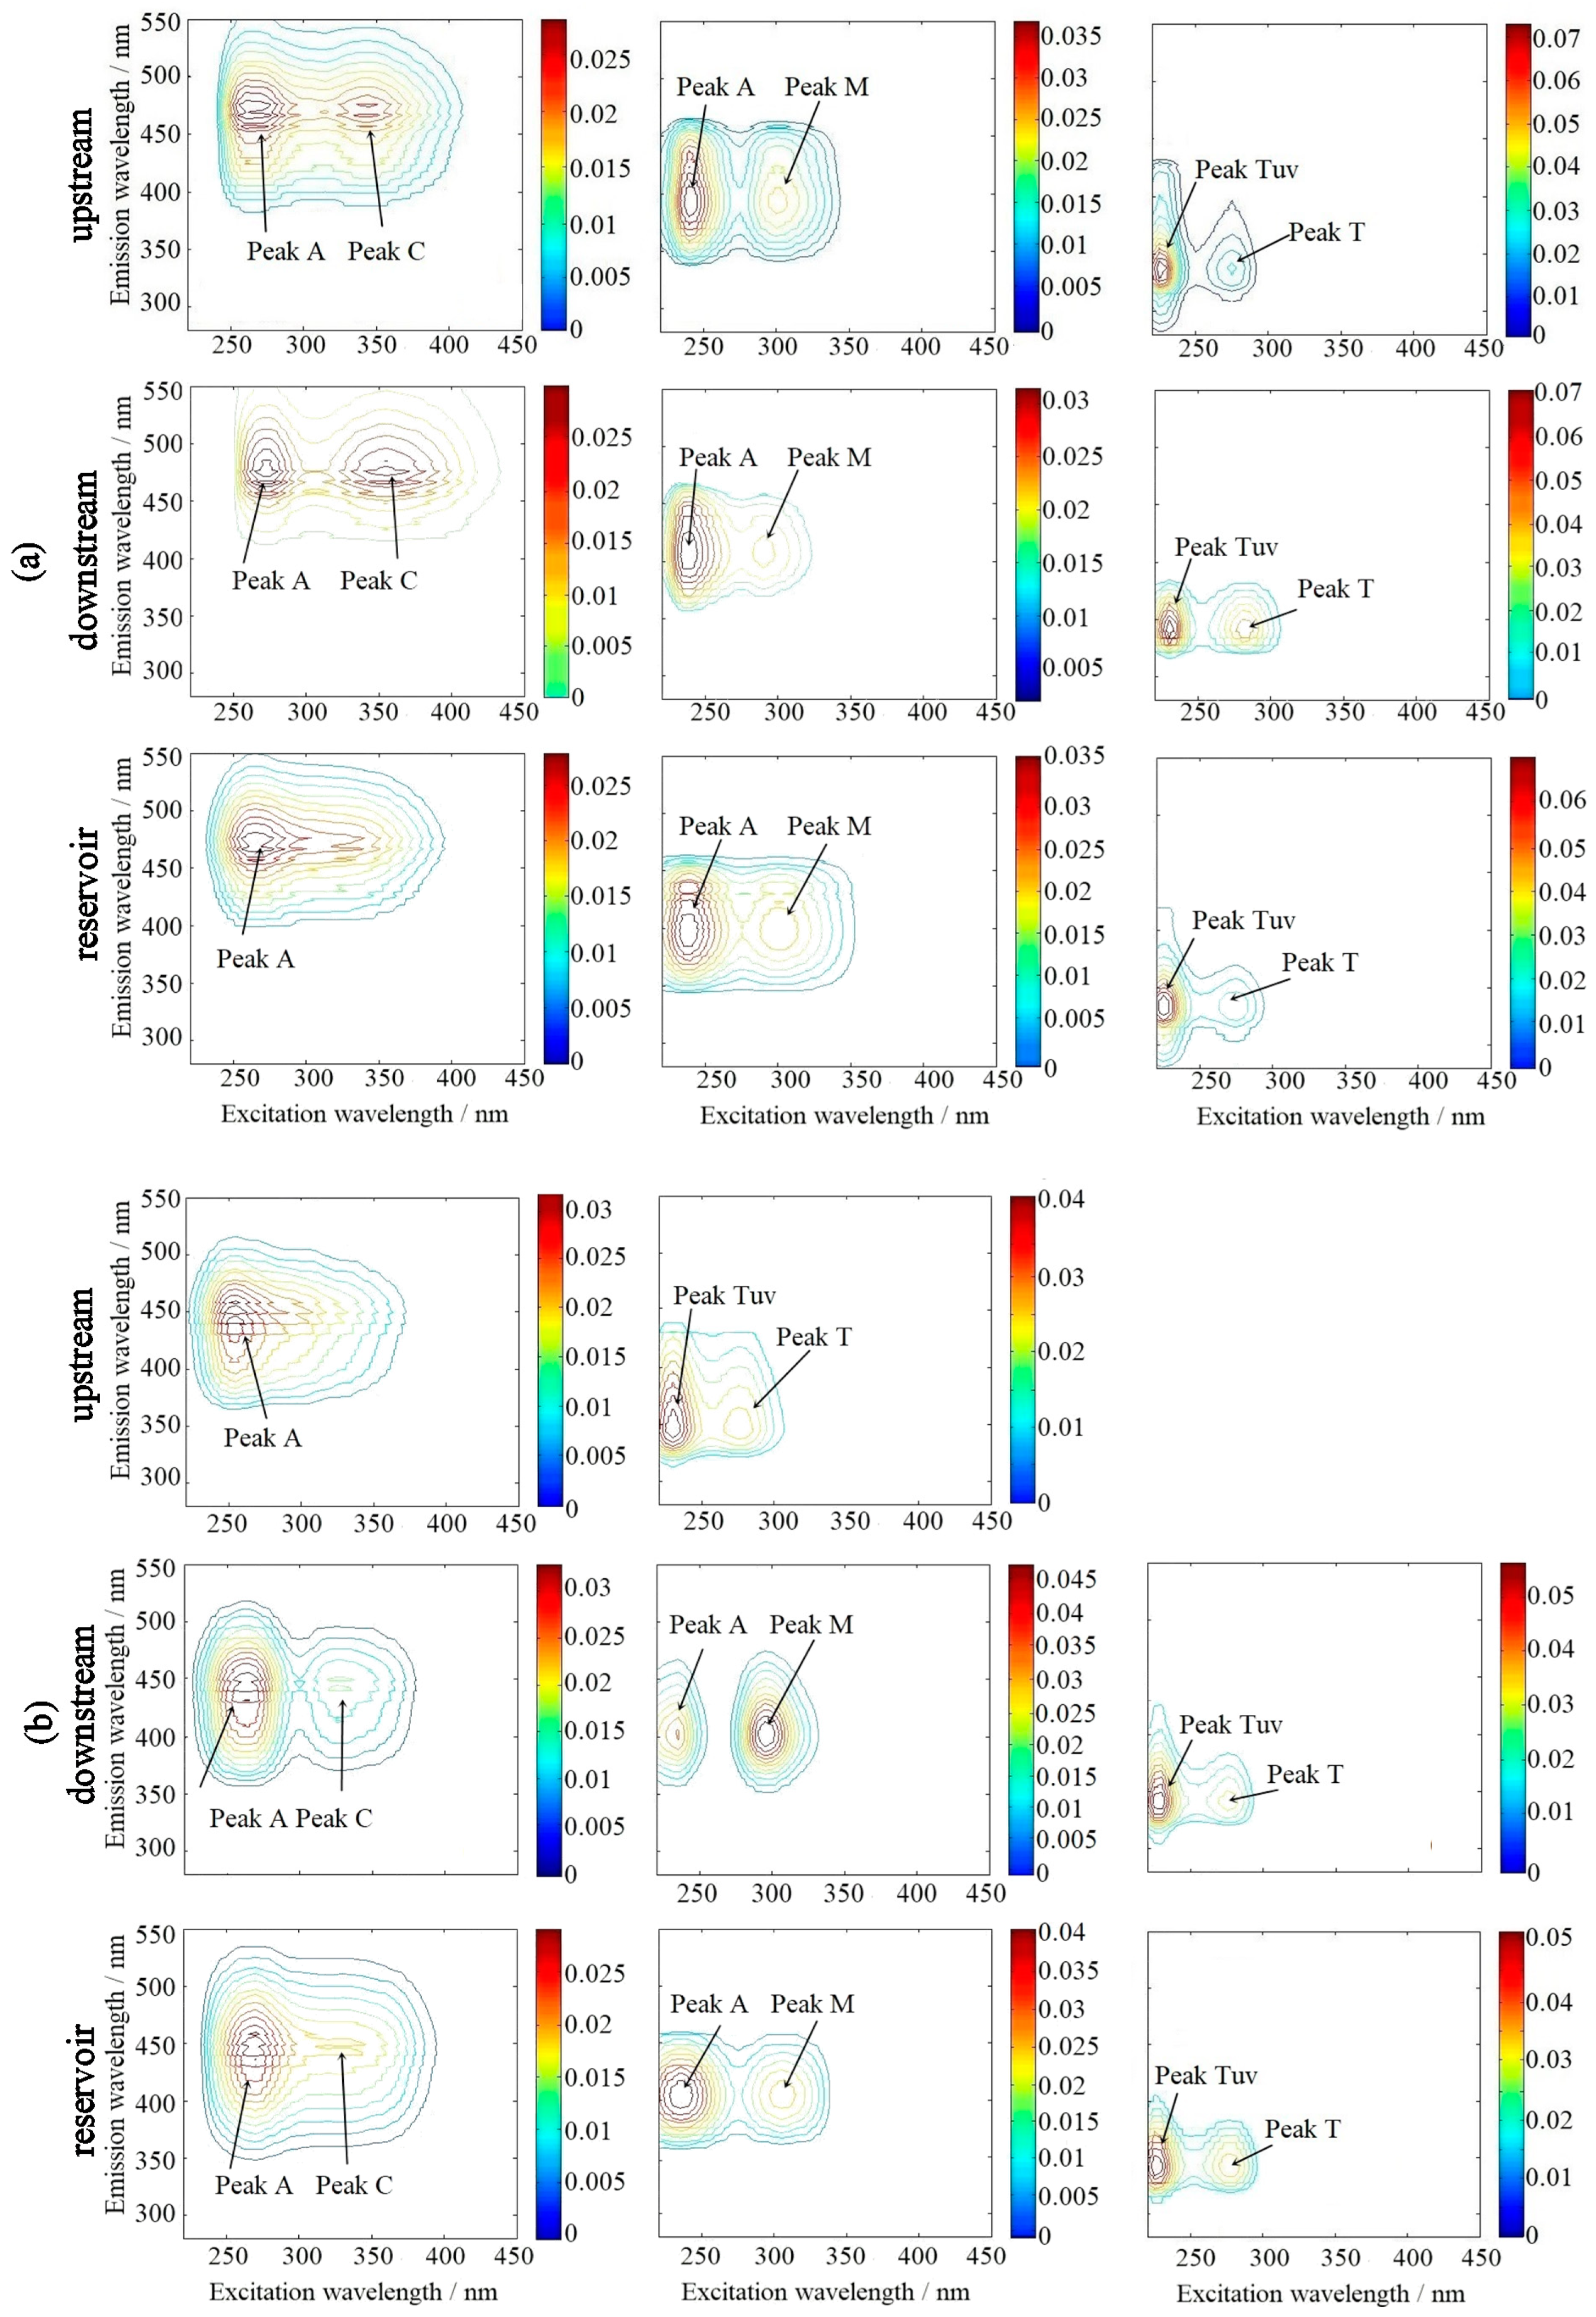
Figure 3.
Seasonal variation of the humification index (HIX), biological index (BIX) and fluorescence index (FI) in the water samples of Duliujian River catchment. BRE: before a rainfall event; ARE: after a rainfall event. a means BIX vs. HIX. b means BIX vs. FI. c means HIX vs. FI.
Figure 3.
Seasonal variation of the humification index (HIX), biological index (BIX) and fluorescence index (FI) in the water samples of Duliujian River catchment. BRE: before a rainfall event; ARE: after a rainfall event. a means BIX vs. HIX. b means BIX vs. FI. c means HIX vs. FI.

Figure 4.
Correlation between DOC, chromophoric dissolved organic matter (CDOM) content (a335) and land-use types in different riparian buffer scales and the subcatchments. SCs denotes the buffer scales of the whole subcatchment. * was sig. at the level of 0.05; ** was sig. at the level of 0.01. BRE: before a rainfall event; ARE: after a rainfall event.

Figure 5.
Redundancy analysis (RDA) of the correlation between multiple land-use types and CDOM specific UV absorption coefficient, and the fluorescence peak intensity in the SCs (a–c) and riparian buffer zones of 60 m (d–f). (a,b) the results in spring; (c,d) the results before rainfall in summer; (e,f) the results in winter.
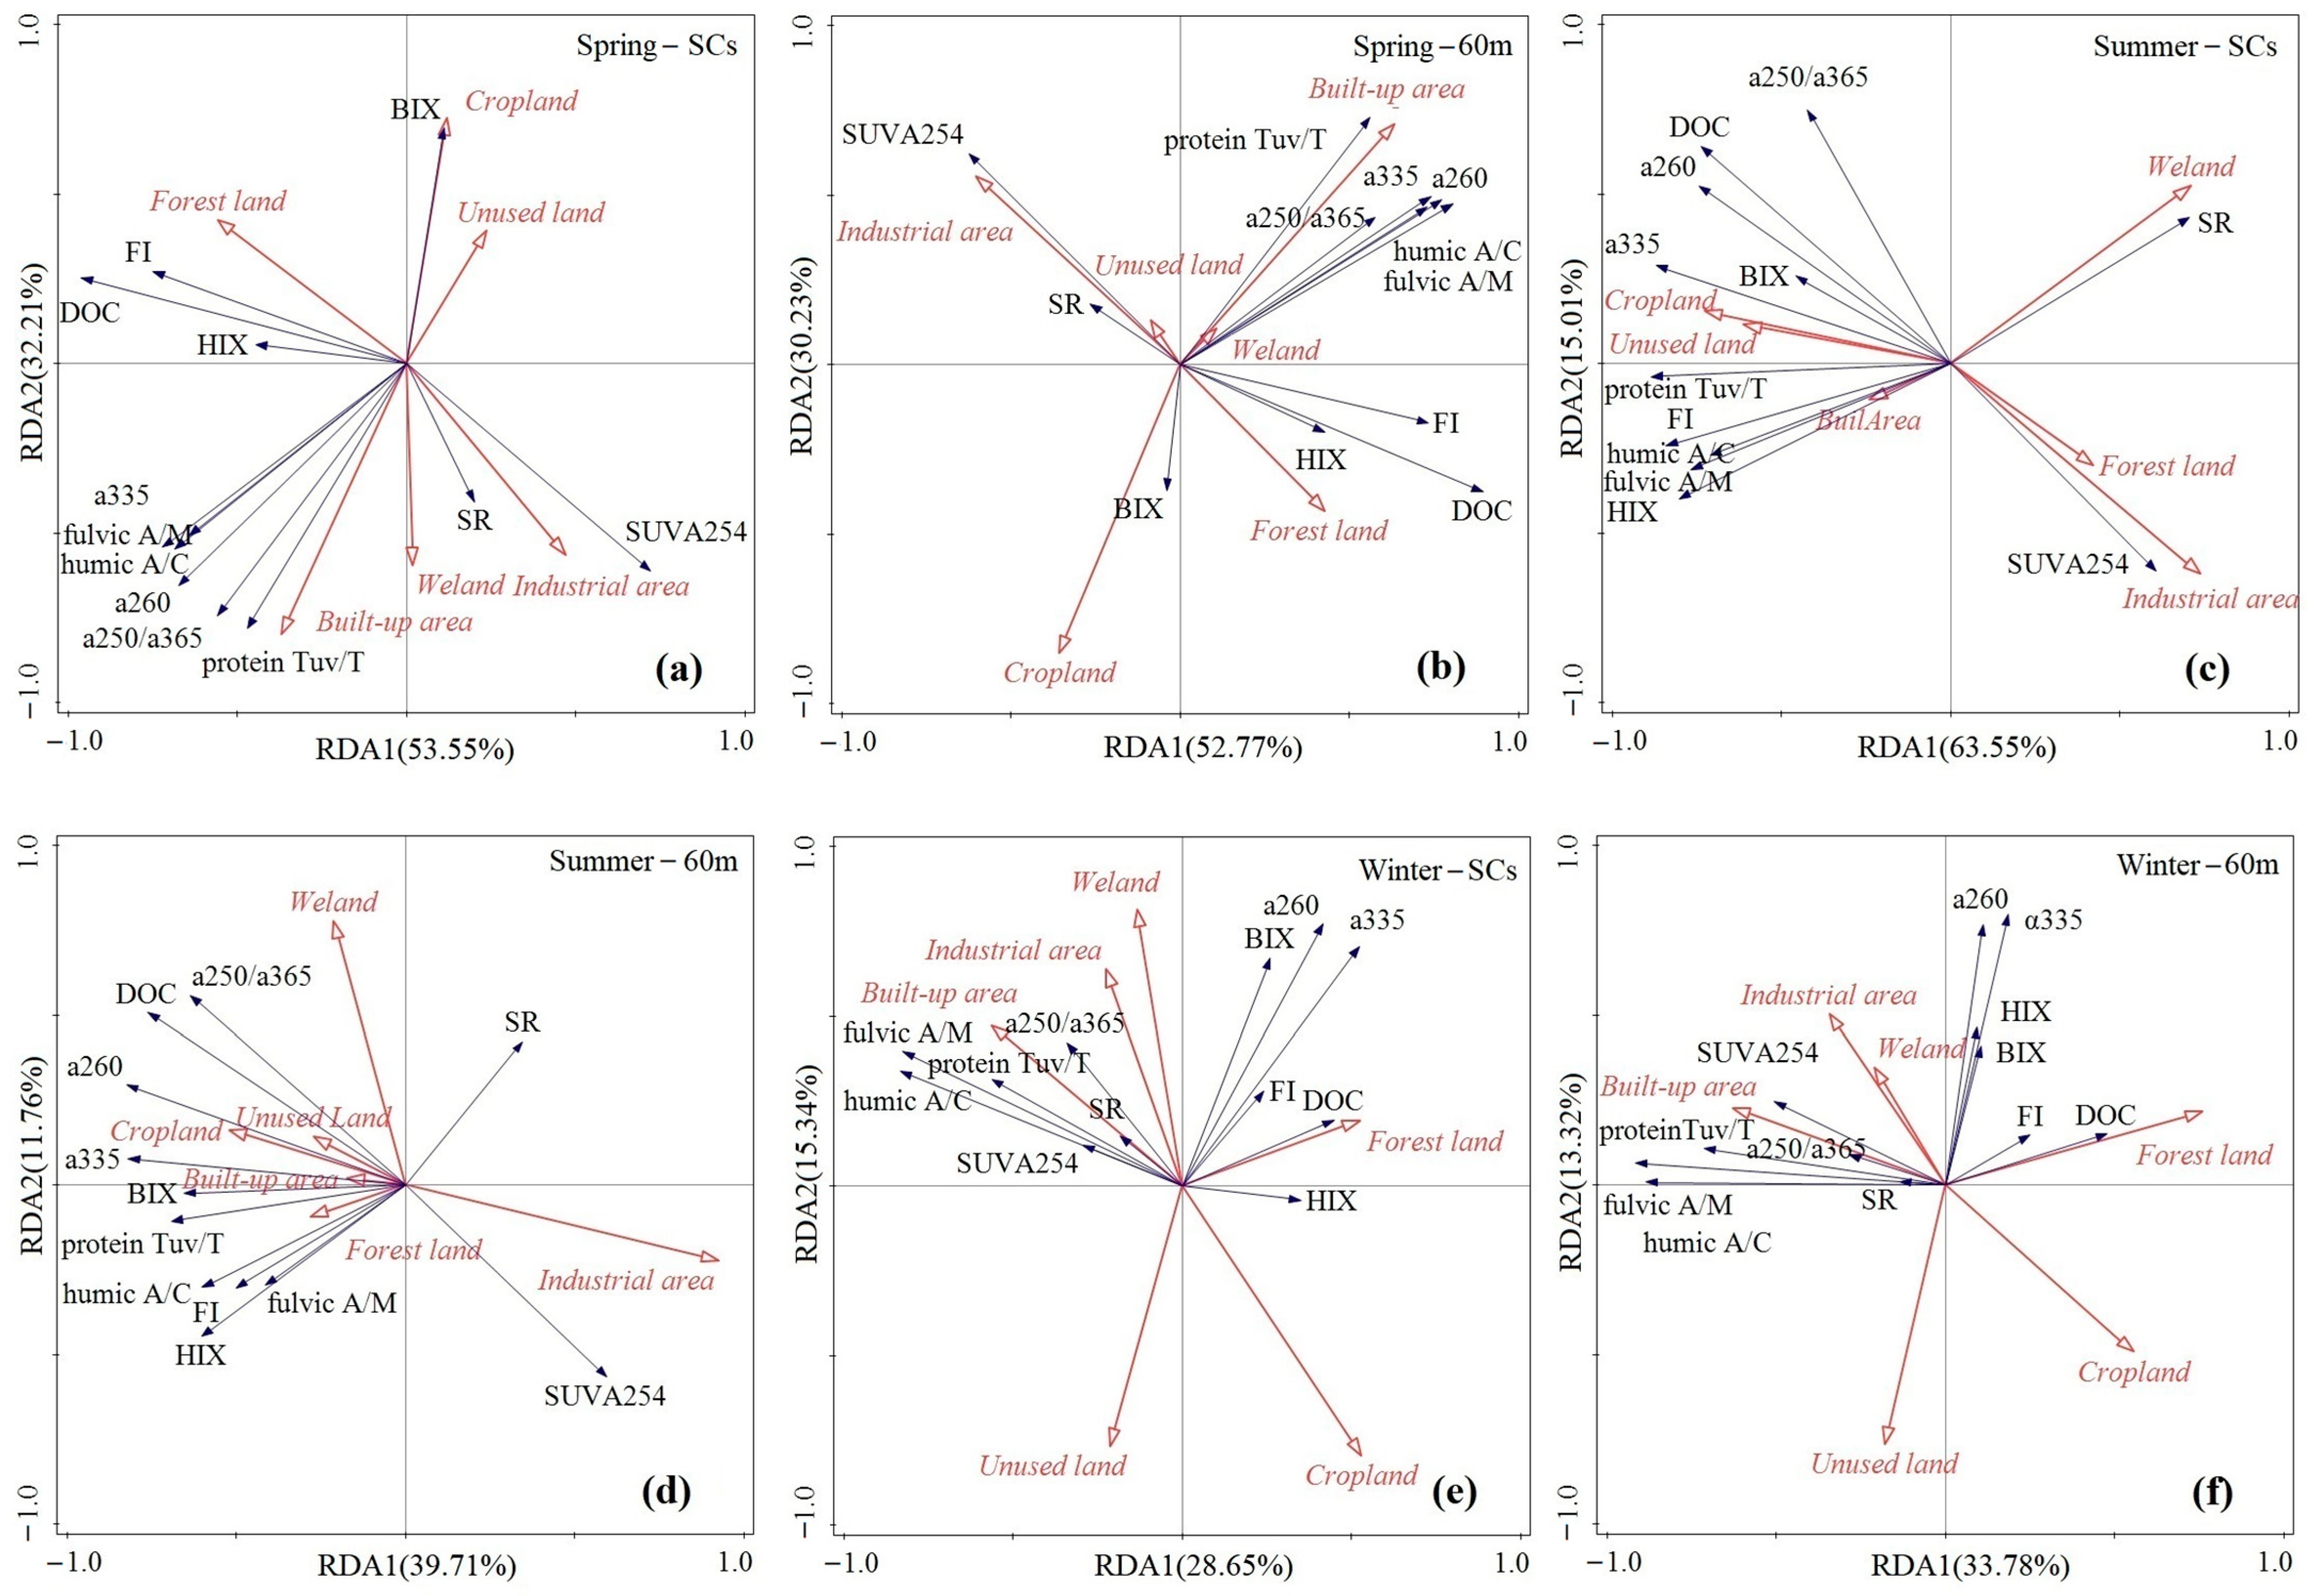
Figure 6.
Comparison of correlations between characteristics of DOM and land-use types in SCs before/after rainfall in summer. BRE: before a rainfall event; ARE: after a rainfall event.
Figure 6.
Comparison of correlations between characteristics of DOM and land-use types in SCs before/after rainfall in summer. BRE: before a rainfall event; ARE: after a rainfall event.


Table 1.
Mean values of water quality parameters in different seasons of Duliujian River catchment (K, T, R represented the sampling sites at reservoir, Tuanbo Lake, and Duliujian River, respectively).
Table 1.
Mean values of water quality parameters in different seasons of Duliujian River catchment (K, T, R represented the sampling sites at reservoir, Tuanbo Lake, and Duliujian River, respectively).
| Sampling Sites | Spring | Summer (BRE) | Summer (ARE) | Winter | ||||||||||||
|---|---|---|---|---|---|---|---|---|---|---|---|---|---|---|---|---|
| pH | EC ms·cm−1 | T °C | DO mg·L−1 | pH | EC ms·cm−1 | T °C | DO mg·L−1 | pH | EC ms·cm−1 | T °C | DO mg·L−1 | pH | EC ms·cm−1 | T °C | DO mg·L−1 | |
| Upstream (R7–R12) | 8.68 | 2.85 | 11.4 | 11.22 | 8.45 | 3.21 | 29.7 | 8.72 | 8.63 | 2.71 | 31.57 | 11.46 | 8.64 | 2.15 | 4.61 | 13.11 |
| Downstream (R1–R6) | 8.81 | 28.84 | 12.43 | 12.92 | 8.35 | 34.86 | 31.45 | 10.92 | 8.68 | 32.72 | 34.2 | 12.83 | 8.86 | 7.89 | 4.43 | 14.44 |
| Reservoir (T, K1–K6) | 8.69 | 5.05 | 12.92 | 11.11 | 8.29 | 4.65 | 30.6 | 7.22 | 8.54 | 4.70 | 34.4 | 9.73 | 8.41 | 4.56 | 4.93 | 11.53 |
Table 2.
Seasonal variation of dissolved organic carbon (DOC), a260, a335, SR, a250/a365 and SUVA254 in Duliujian River catchment.
Table 2.
Seasonal variation of dissolved organic carbon (DOC), a260, a335, SR, a250/a365 and SUVA254 in Duliujian River catchment.
| Parameter Values | DOC mg C·L−1 | a335 m−1 | a260 m−1 | a250/a365 | SR | SUVA254 L·(mg C)−1·m−1 | |
|---|---|---|---|---|---|---|---|
| Seasons | |||||||
| spring | Range | 0.73–11.6 | 11.1–25.68 | 23.6–82.3 | 3.37–5.42 | 1.48–2.59 | 4.72–46.8 |
| Mean ± Std | 5.78 ± 3.32 | 15.5 ± 3.72 | 43.5 ± 13.9 | 4.32 ± 0.60 | 1.79 ± 0.23 | 14.0 ± 12.6 | |
| summer (BRE) | Range | 4.93–19.2 | 11.6–30.6 | 27.1–110.1 | 3.68–6.34 | 1.38–2.13 | 3.15–12.6 |
| Mean ± Std | 12.9 ± 4.10 | 17.8 ± 3.57 | 53.3 ± 15.9 | 4.78 ± 0.58 | 1.66 ± 0.21 | 4.95 ± 2.11 | |
| summer (ARE) | Range | 5.27–21.2 | 14.3–30.4 | 34.6–106.2 | 3.44–5.93 | 1.46–2.18 | 2.12–7.15 |
| Mean ± Std | 14.9 ± 5.23 | 18.4 ± 3.49 | 53.3 ± 14.5 | 4.50 ± 0.57 | 1.70 ± 0.22 | 4.28 ± 1.46 | |
| winter | Range | 0.83–14.4 | 2.76–19.6 | 11.8–86.6 | 7.50–11.8 | 1.07–1.40 | 2.16–25.7 |
| Mean ± Std | 7.31 ± 4.02 | 7.48 ± 3.51 | 32.7 ± 15.6 | 8.60 ± 0.98 | 1.17 ± 0.08 | 7.48 ± 6.30 |
Std: standard deviation; BRE: before rain event; ARE: after rain event.
Table 3.
Sites of fluorescence peaks in the different aquatic environment.
| Type | Humic-Like Peak Ex/Em(nm) | Fulvic-Like Peak Ex/Em(nm) | Protein-Like Peak Ex/Em(nm) | References |
|---|---|---|---|---|
| Coastal wetland and estuarine | <265/460; 350/470 | — | 280/325; 275/303 | [37] |
| Algal culturing | 255/455; 340/455 | — | 275/340 | [38] |
| Wastewater treatment plant | — | 245/425; 323/425 | 230, 275/345; 220/305, 345 | [39] |
| Lake water | 345/556; 495/556 | 320/420 | — | [40] |
| Vertical flow constructed wetland | — | 240~270/370~440; 310~360/370~450 | 220~230/320~350; 270~280/320~350 | [41] |
Publisher’s Note: MDPI stays neutral with regard to jurisdictional claims in published maps and institutional affiliations. |
© 2021 by the authors. Licensee MDPI, Basel, Switzerland. This article is an open access article distributed under the terms and conditions of the Creative Commons Attribution (CC BY) license (http://creativecommons.org/licenses/by/4.0/).
Share and Cite
MDPI and ACS Style
Han, Z.; Xiao, M.; Yue, F.; Yi, Y.; Mostofa, K.M.G. Seasonal Variations of Dissolved Organic Matter by Fluorescent Analysis in a Typical River Catchment in Northern China. Water 2021, 13, 494. https://doi.org/10.3390/w13040494
AMA Style
Han Z, Xiao M, Yue F, Yi Y, Mostofa KMG. Seasonal Variations of Dissolved Organic Matter by Fluorescent Analysis in a Typical River Catchment in Northern China. Water. 2021; 13(4):494. https://doi.org/10.3390/w13040494
Chicago/Turabian StyleHan, Zenglei, Min Xiao, Fujun Yue, Yuanbi Yi, and K. M. G. Mostofa. 2021. "Seasonal Variations of Dissolved Organic Matter by Fluorescent Analysis in a Typical River Catchment in Northern China" Water 13, no. 4: 494. https://doi.org/10.3390/w13040494
Note that from the first issue of 2016, this journal uses article numbers instead of page numbers. See further details here.