Abstract
The coastal aquifers of the Mediterranean region are highly susceptible to seawater intrusion due to a combination of challenges such as land subsidence, high aquifer permeability, urbanization, drainage, and an unsustainable use of water during the dry summer months. The present study is focused on a statistical analysis of groundwater data to evaluate the spatial changes of water level and electrical conductivity in the coastal phreatic aquifer of the Emilia-Romagna (Northeast Italy) for the period from 2009 to 2018. Data from 35 wells distributed across the entire regional coastal area are used to establish a temporal trend, as well as correlations between salinity, water table level, and rainfall. Water table and salinity distribution maps for the entire study area are discussed regarding surface geology and water management. Most of the wells are in the beach wedge sand unit, which allows for easy connectivity between groundwater and surface water. Surface water and groundwater salinization are enhanced along the surface water bodies connected to the sea. The lowest water table level occurs in the western and northern parts of the study area, because of the semiconfined behavior of the aquifer. Only in the northernmost, close to the Po River, and in the southernmost parts of the study area does the groundwater remain fresh for the whole period considered due to river aquifer recharge. In the rest of the region, the thickness of freshwater lenses, where present, is less than 4.5 m. The existence of a water table level below sea level and high saline water at the bottom of the aquifer in most of the study area suggest that the aquifer is in unstable hydrodynamic conditions and groundwater quality is not fit for human consumption or for irrigation. This study is the first to provide a regional overview of the state of groundwater level and salinization within the coastal aquifer of the Emilia-Romagna Region; it also suggests that, overall, the salinization trend has slightly decreased from 2009 to 2018.
1. Introduction
Water in the coastal zone is crucial for life, but its availability at a sustainable quality and quantity is challenged by population growth, tourism, land subsidence, agriculture, and climate variability. Changes in climate variables can significantly alter groundwater recharge rates for major aquifer systems and thus affect the availability of fresh groundwater resources [1]. Saltwater intrusion into coastal aquifers by rising seawater levels is an example of how climate change impacts water quality. In this case, shallow coastal aquifers are at greatest risk. Rainfall increases because of climate change, on the other hand, enhances freshwater storage in the coastal aquifers. Groundwater recharge is also a sensitive function of local geology, topography, and land use. An unconfined aquifer is recharged directly by local rainfall, rivers, and lakes, and the rate of recharge will be influenced by the hydraulic conductivity of overlying rocks, sediments and soil [2,3].
Deltaic coastal plains all over the world are highly vulnerable to impacts from climate change, land subsidence, coastal erosion, land loss, groundwater salinization, and environmentally damaging land use practices [4]. In many low-lying coastal areas, groundwater is also saline because saltwater from the Holocene marine transgression has not yet been flushed completely by rainfall recharge [5]. Up-coning or seepage of saltwater from deeper parts of the aquifer or underlying formations often plays an important role in the salinization process [6].
The coastal aquifers of the Mediterranean region are highly susceptible to seawater intrusion due to a combination of factors, most importantly an unsustainable use of water during the dry summer months and the high aquifer hydraulic conductivity [3]. Artificial drainage and high rates of anthropogenic and natural subsidence, among other causes, have caused groundwater salinization in the coastal unconfined and semiconfined aquifers of Ravenna, along the northern Adriatic Sea [7,8,9,10,11]. The land reclamation drainage system controls the water table level and creates a vertical gradient, forcing groundwater to flow from the bottom toward the top of the aquifer. Therefore, the connate saline groundwater previously preserved in the deepest portion of the aquifer can be mobilized and transported upward [11]. The drainage also causes a decrease in the effective recharge of the aquifer [12]. The water table in the coastal area is, on average, close to or below sea level with a general inland-directed hydraulic gradient that is mainly forced by the drainage [13]. Since, among the factors causing coastal aquifer salinization, water drainage driven by a sinking topography is so important in lowering the hydraulic head and favoring saltwater up-coning (seepage), the area will experience negative effects on coastal groundwater resources and freshwater availability as long as land subsidence continues in the future. Land subsidence has led to the rise of the water table in the shallow unconfined aquifer that has consequently required an increase in mechanical pumping drainage rates [14]. The greater the amount of subsidence, the larger the amount of water that needs to be drained. Consequently, less freshwater is able to recharge the aquifer and the system ends up being poorly flushed [8]. As result of this, the phreatic coastal aquifer of Ravenna is almost completely brackish to saline except for some isolated freshwater lenses [7,15]. The salinization has strongly increased during the past century and it is threatening the ecosystems of all natural areas in this territory [7,16]. The coastal aquifer is a closed system and water recharge can only occur via rainfall or excess irrigation infiltration in the dune areas and where sandy deposits are exposed at the surface. The limited rainfall, strong evaporation rate, sea-level rise, and land subsidence have limited the amount of freshwater infiltrating into the aquifer [17]. Moreover, encroachment of seawater along rivers and canals contributes to enhance the salinization process [7] due to the lack of barriers towards the sea, the presence of a low gradient (except for the Po River), and low discharge river estuaries in microtidal conditions. In several cases, inverse riverbed slopes and deep holes at the bottom of riverbeds [18] easily allow the saltwater to enter the river and remain trapped for long time. The salt pools on the bottom of the river may represent one of the major sources of salinization of the adjacent aquifer where surface water and groundwater are connected.
Water table and quality maps are key tools for water resource management. Surface-water features such as ponds, lakes, streams, and rivers can interact with the groundwater table. All this must be considered when preparing a water table and quality maps. However, the interaction status between surface water and groundwater depends on the hydrological and geological parameters such as the surface water level, water table, riverbed geometry, and hydrogeological parameters of the substratum [19]. Despite the many studies carried out in this area and the many factors for the salinization of the coastal aquifer, no spatial analysis of water table level and groundwater electrical conductivity at a regional scale considering surface water features has been performed in the study area so far.
The main objective of our work, therefore, is to assess, for the first time, the water table levels and the extent of groundwater salinization in the coastal zone of the Emilia-Romagna region at a regional level. Based on the available data, which span a period of almost ten years (2009–2018), we also want to establish if there is any trend in water table and groundwater salinity data. We tackle these issues by considering the effects of the climate variability and surface geology on aquifer status. A statistical analysis was performed on the available dataset to identify possible trends of salinization/freshening processes.
1.1. Study Area
The Emilia-Romagna coast (Figure 1) consists of a low, sandy coast and a delta lagoon system in the south of the Po River delta. In the northern part, the area behind the coast lies below sea level and includes wetlands with a pristine natural environment.
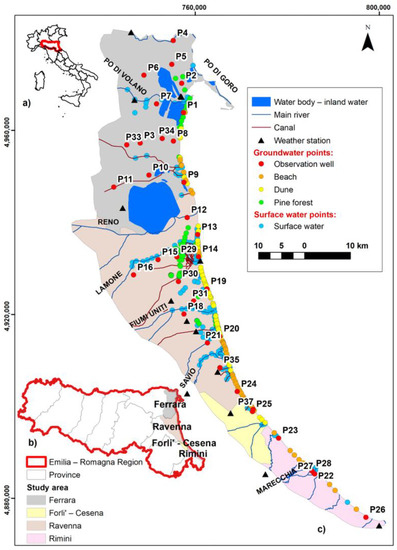
Figure 1.
Location of the coastal phreatic aquifer (c) of the Emilia-Romagna region (b), Northeast Italy (a). All monitoring points of surface and ground waters, weather stations and the main hydrology are also shown. Note: scale bar refers to the coastal study area only (c); coordinate reference system: WGS 1984 UTM Zone 32 N.
Many different and unique environments are present in the coastal plain of the Emilia-Romagna Region, which is strongly affected not only by the features of depositional systems and their geomorphologies, but also by anthropogenic activities [20]. The sandy coastal zone is characterized by river and canal mouths, lagoons, pine forests, heavily urbanized areas, industrial facilities, low topography, land subsidence, coastal erosion, soil and groundwater salinization, and reclaimed agricultural [7].
1.2. Hydrogeological Characterization
The evolution of the Po Plain coastal zone was controlled by alternating erosive and depositional phases. During the Quaternary, subsidence and alluvial continental deposits overlapped marine ones. The Holocene geomorphic evolution of the area has been driven by continental (Würmian) and marine depositions (post-Würmian transgression) in a coastal environment [21]. Figure 2 shows a schematic stratigraphic section of the last post-Flandrian deposits across the Adriatic coast south of the Po River from east to west. The major sedimentary packages consist of a wedge of fine-grained (fine sand to silty clays, named prodelta) sediments deposited in shallow marine water, and littoral sands that formed in the foreshore, deep-shore, and in the adjacent beach sand dune environments. Clay backshore lagoon deposits are also present in the westernmost area [22,23,24]. Westward, some continental alluvial deposits (mostly clay and silt) are laid upon the littoral sands and the lagoon sediments making the aquifer semiconfined. The coastal phreatic aquifer is primarily located within the littoral sands and in the shallow marine wedge deposits.
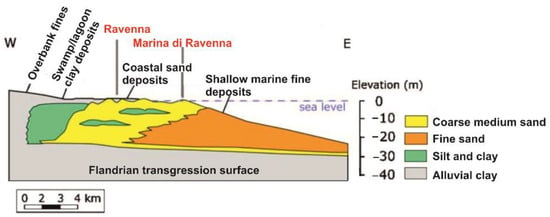
Figure 2.
Schematic stratigraphic section of the phreatic coastal aquifer (modified from Antonellini et al., 2008).
The hydrological system of the area is complex because it comprises natural and artificial water bodies and watercourses with different destinations for use. The most relevant elements of this area are the brackish lagoon, wetlands, rectified rivers and dikes, complex land reclamation drainage network, pumping stations, intake structures for irrigation, and the Adriatic Sea. Many watercourses cross this territory and interact with the aquifer—i.e., the Po, Reno, Lamone, Fiumi Uniti, and Savio Rivers (Figure 1).
2. Methodology
2.1. Data Collection
To meet the stated objectives, the groundwater observation wells and precipitation data (water table level—WT, electrical conductivity—EC, rainfall—RF), as well as surface geology maps, were collected from the Emilia-Romagna geoportal and database for the years 2009 to 2018.
WT and EC data were measured in 35 observation wells every meter along their depth on a quarterly basis, from 2009 till 2012, and then twice a year in the following period, until 2018. Thirteen wells are in the province of Ferrara, 15 in Ravenna, 2 in Forlì-Cesena, and 5 in Rimini province (Figure 1). These observation wells are part of the saltwater intrusion monitoring network of the Emilia-Romagna Region [20]. This network was created with the aim of building an updated knowledge framework that highlights the physical characteristics, dynamics, and possible vulnerability of the groundwater system. The wells were located and drilled to obtain a homogeneous distribution of data in the phreatic aquifer and to capture the phenomenon of ingression of the saline wedge in the different sectors of the coastal aquifer. In some cases, it was decided to locate an observation point that would also allow the evaluation of the relationships between surface water and groundwater or the possible different responses of the system in the presence of semiconfined and confined aquifers. Most wells were drilled where the coastal aquifer is phreatic, except two cases within the province of Ravenna where the wells intersect the portion of aquifer that is semiconfined by the overlying alluvial fine sediments (Figure 2).
The wells were fully screened, and their depths ranged between 6.9 and 23 m.
Thirty days of premonitoring cumulative RF data were collected from 13 meteorological stations nearby the observation wells (Figure 1) with the aim of finding the best correlation between EC and WT parameters.
2.2. Statistical Analysis
Annual time series trends and estimation of Sen’s slope were analyzed using the Mann–Kendall test [25,26] and the Sen method [27], respectively, for WT, EC, and RF datasets. Both tests make no assumptions on distribution; missing data or outliers are permitted [28].
The Mann–Kendall test is a nonparametric test for finding trends in time series. This test compares the relative magnitudes of data rather than the data values themselves [29]. This test is commonly used for identifying and analyzing trends in hydrological data time series [30]. The major advantage is that the test is free from a statistical distribution that is required in the parametric test. In this test, each data value of the time series is compared with all subsequent values.
The Mann–Kendall statistics (S) were calculated as shown in Equation (1):
where, xj and xi are annual values in years j and i, and j > I, respectively; n is the number of data points, and sցn(xj − xi) is calculated using Equation (2):
A positive or negative value of S indicates an upward (increasing) or downward (decreasing) trend, respectively.
If the number of data values are 10 or more, the S-statistic approximately behaves as normally distributed and the test is performed assuming normal distribution with the mean and variance as given in Equations (3) and (4):
where n is the number of tied groups (zero difference between compared values) and ti is the number of data points in the ith tied group.
E(S) = 0
The standard normal distribution (Z-statistics) was computed using Equation (5):
Statistically, the significance of the trend was assessed using the Z value at a 1.96 significance level corresponding to a confidence level of 95% for a two-sided probability. A positive Z value shows an upward (increasing) trend, whereas a negative Z value indicates a downward (decreasing) trend. The Mann–Kendall statistic identifies whether a trend exists or not, but it does not indicate the magnitude of the slope neither estimates the trend line itself even when a trend is present.
The Theil Sen trend line is a nonparametric alternative to linear regression, which can be used in conjunction with the Mann–Kendall test to determine how steeply the significant trend is increasing or decreasing over time. Thus, this test provides an estimate of the true slope of an existing trend (as a change per year) [31].
A simple linear regression is one of the most widely used models to detect linear trends. However, this method requires the assumption of the normality of residuals [32]. Thus, the Sen slope estimator is a powerful tool to develop linear relationships [27].
Sen’s slope has an advantage over the regression slope—it is not much affected by gross data errors and outliers. This method uses a linear model for trend analysis. The slope (Ti) of all data pairs was calculated using Equation (6):
where xj and xk are data values at times j and k (j > k). A positive Sen’s slope indicates a rising trend whereas a negative Sen’s slope indicates a falling trend in the time series data. If the slope is zero, there is no trend.
2.3. Spatial Analysis
The spatial analysis of WT levels and groundwater EC was performed using the Kriging interpolation integrated into the ArcGIS software [33]. Kriging is a widely used interpolation technique in geostatistics. It is based on a spatial linear model for the data, which specifies a parametric spatial mean function and spatial dependence structure [34]. In the estimation procedure, Kriging weights each observation according to the distance and direction between that point and the point to be estimated.
In order to predict an unknown value for a specific location, Kriging uses the fitted model from the variogram, the spatial data configuration, and the values of the measured sample points around the prediction location [35]. Among the various forms of Kriging, Ordinary Kriging (OK) was used in the present work [36].
An initial exploratory data investigation, consisting in trend analysis and data distribution analysis, was performed to assess data consistency and uniformity.
The trend analysis helped us to identify trends in the input datasets and to provide a three-dimensional perspective of the data. If the line is flat, it indicates that there is no trend [37]. Kriging assumes that no regional trend exists in the data. In this study, most of the data show no trend. Then, a semivariogram was built to provide a picture of the spatial correlation in the dataset. The selected semivariogram model was spherical.
Before producing the final surface, cross-validation was carried out to gain some idea of how well the model predicts the values at unknown locations. The model which gives the best prediction was obtained by evaluating the statistical prediction errors as: mean error (ME), mean square error (MSE), root mean square error (RMSE), average standard error (ASE), and root mean square standardized error (RMSSE). These errors were estimated to test the performance of the developed models. The parameters to judge if a model provides accurate predictions are:
- The predictions are unbiased when the MSE is close to 0;
- The standard errors are accurate when the RMSSE is close to 1;
- The predictions do not deviate much from the measured values, where the RMSE and ASE are as small as possible;
- Moreover, when ASE values are close to the RMSE from cross-validation, we can be confident that the model is appropriate.
After cross-validation was performed and the Ordinary Kriging method was chosen as the best method for interpolation, the Geostatistical Analyst tool in ArcGIS was used to build isophreatic and water quality maps showing the areal extent of fresh-, brackish, and salt-water, as well as maps of the average thickness of freshwater lenses in the shallow coastal aquifer.
In order to acquire better surface maps and to consider the effect of surface water features, some assumptions were made, and additional data were collected from the rivers, open water bodies, dunes, beaches, and pine forests and added to the monitoring dataset (Figure 1). If the surface geology consists of sand units, the surface water bodies and coastal aquifer are considered to be hydraulically connected. The open water bodies that are connected to the sea were assigned a WT equal to 0 m a.s.l. The WTs below dunes and beaches were set equal to 0.2–0.3 and 0 m a.s.l., respectively [13]. For the pine forests, the dataset was integrated by WT and EC values obtained from the works of Giambastiani et al. [10,11,38], Greggio et al. [39], Antonellini et al. [7], and Antonellini and Mollema [16].
For rivers and open water bodies connected to sea, the value of Adriatic seawater (56 mScm−1) [40] was used. For the dunes, where present, freshwater lenses of 1–2 m in thickness and EC values around 2.5 mScm−1 (S = 1.5 gL−1) were used. Along the beach, where there are no dunes, the groundwater EC ranges from 11 to 16 mScm−1 (S = 8–10 gL−1). In the coastal pine forests, groundwater EC at the top of the water table is around 11–13 mScm−1 (S = 7–8 gL−1) [13].
Finally, maps of groundwater quality and freshwater–saltwater interface depths of the entire coastal area for the 2009–2018 interval were built. The groundwater quality maps were generated considering an average EC value along the whole water column within each observation well and the classification was carried out by considering three classes: freshwater, brackish, and saline water. According to the Emilia Romagna Region groundwater EC classification standard (Legislative Decree n. 31 2/02/01) [41], the limit up to 2.5 mScm−1 is for freshwater, a limit up to 10 mS/cm distinguishes brackish from saline waters, and the value of 56 mScm−1 is the average EC of the Adriatic Sea [40]. The freshwater–saltwater interface was selected at an EC value equal to 2.5 mScm−1.
3. Results
3.1. Correlation Analysis
Correlation coefficients are computed to establish the influences of RF on WT and groundwater EC. The results of correlation analysis show that both negative and positive correlations exist between EC and WT and RF, as well as between WT and RF (Figure 3 and Table S1 in Supplementary Materials).
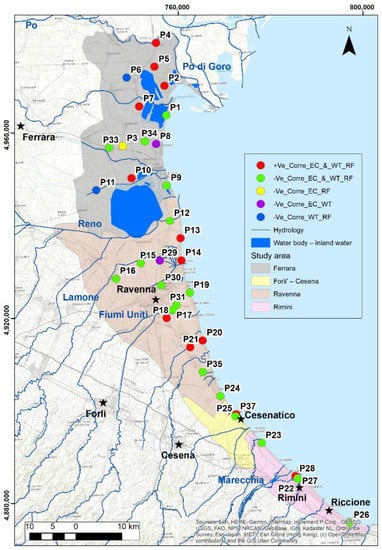
Figure 3.
Correlation map of electrical conductivity (EC), water table level (WT) and rainfall (RF) parameters. (Key: +Ve_corre_EC_&_WT_RF: positive correlation between EC and with both WT and RF; −Ve_corre_EC_&_WT_RF: negative correlation between EC and with both WT and RF; −Ve_corre_EC_RF: negative correlation between EC and RF, and positive correlation between EC and WT; −Ve_corre_EC_WT: negative correlation between EC and WT; −Ve_corre_WT_RF: negative correlation between WT and RF).
3.2. Trend Analysis
The Mann–Kendall and Sen’s tests performed on groundwater EC show that 12 (34%) of 35 wells exhibit statistical significance trends at a 95% confidence level (Table 1). The trend analysis results indicates that 9% of the wells (P4, P9, and P37) show statistically significant increasing trends in EC with average values of 0.01, 0.06, and 1.01 mScm−1 year−1, respectively, over the 10-year period; 26% of the wells (P2, P3, P7, P8, P13, P15, P18, P21, P22) show statistically significant decreasing trends with an average value of 0.42 mScm−1 year−1, respectively; 65% of the total wells show relatively stable trends (Figure 4). The EC trend is shown to be decreasing in 22 wells, increasing in 12 wells, and one well shows no trend.

Table 1.
Mann–Kendall test and Sen’s slope trend analysis of annual groundwater EC from 2009 to 2018. (Note: Mann–Kendall Test: for absolute computed probability greater than the 1.96 level of significance (green color cells), the trend is said to be decreasing or increasing if Z value is negative or positive, respectively. For absolute computed probability smaller than the 1.96 significance level, the identified trend is not significant. Sen’s slope test: positive Sen’s slope values indicate increasing trend, whereas negative values indicate decreasing trend; if the slope is zero, there is no trend.)
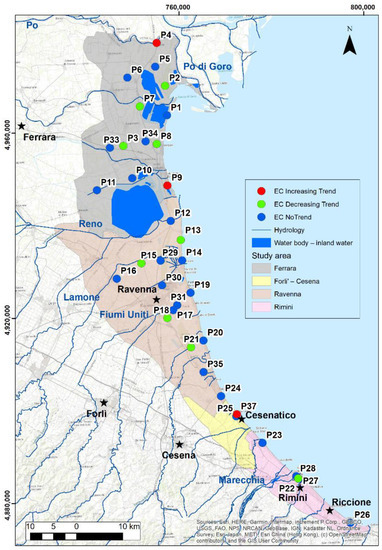
Figure 4.
Map of the significant EC trend of groundwater over the period 2009–2018.
The same trend analysis is performed on the mean annual WT levels from 2009 to 2018 (Table 2). In total, 9% of the wells show significant increasing trends of 0.02–0.04 m year−1. The map in Figure 5 shows the annual trend of WT in the study area. The WT table trend rises in 19 wells and falls in 8 wells, whereas the rest of the wells show no trend.

Table 2.
Mann–Kendall test and Sen’s slope results for trend analysis of mean WT level from 2009 to 2018. (Note: Mann–Kendall Test: for absolute computed probability greater than the 1.96 level of significance (green color cells), the trend is said to be decreasing (falling WT) or increasing (rising WT) if Z value is negative or positive, respectively. For absolute computed probability smaller than the 1.96 significance level, the identified trend is not significant. Sen’s slope test: positive Sen’s slope values indicate increasing trend, whereas negative values indicate decreasing trend; if the slope is zero, there is no trend.)
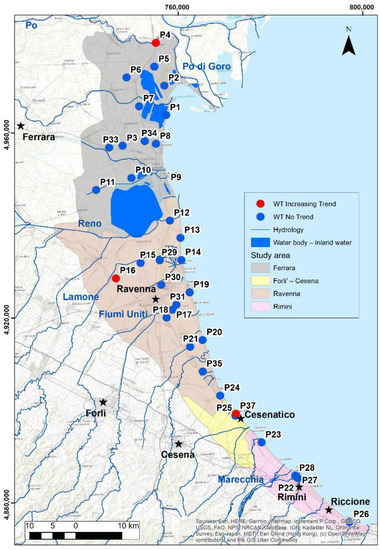
Figure 5.
Map of the significant annual trend of WT level over the period 2009–2018.
3.3. Surface Geology
Figure 6 shows the surface geology of the coastal phreatic aquifer. Most of the wells (28 out of 35) are in shoreface and coastal deposits (sandy sediments). The remaining wells, in the western part of the Ferrara coast, are located in continental fine alluvial sediment (silty clay with peat and silty sand), which makes the aquifer locally semiconfined.
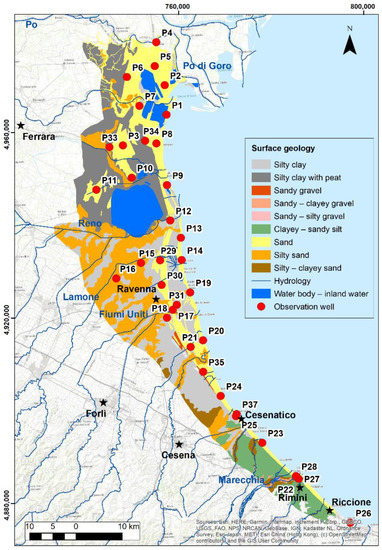
Figure 6.
Surface geology of the coastal phreatic aquifer (modified from the Emilia-Romagna surface geology map 1:50,000).
3.4. Spatial Analysis of Water Table Level and Electrical Conductivity
The best-fitted variogram models for WT and EC are reported in Figures S1A and S2A of the Supplementary Materials, respectively; while Table 3 lists the statistics of best-fitted semivariogram models for each parameter used in the interpolations.

Table 3.
Best-fit semivariogram model parameters for WT and EC. (Note: ME = Mean Error; RMSE = Root Mean Square Error; MSE = Mean Standardized Error; RMSSE = Root Mean Square Standardized Error; ASE = Average Standard Error).
The MSE values are close to 0 and their corresponding RMSSE values are close to 1, which represents a good prediction model. Small values of RMSE and ASE for all seasons of WT levels and EC also show good agreement with the model. The ASE values are close to the RMSE from cross-validation, so that we can be confident that the model is appropriate.
Figure 7 and Figure 8 show the average WT and EC maps of the coastal phreatic aquifer in the period from 2009 to 2018, respectively.
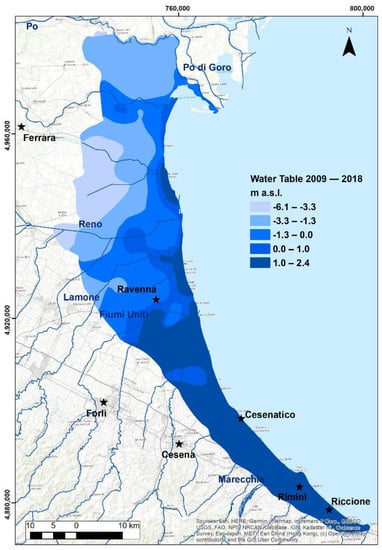
Figure 7.
Average WT map in the unconfined coastal aquifer over the period 2009–2018.
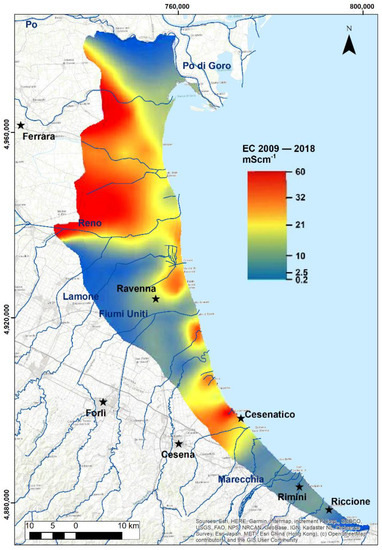
Figure 8.
Average EC distribution map in the unconfined coastal aquifer over the period 2009–2018.
In most of the aquifer, the WT is around 0 m a.s.l. or below water level. The WT ranges from −6.1 to 2.4 m a.s.l., with the lowest levels being in the northern and western parts of the Ferrara province and maximum in the southern part of Rimini province, with an average value of 1.7 m a.s.l.
Most of the groundwater EC values measured fall in the range between 10 and 56 mScm−1, with the lowest values (0.2–11.3 mScm−1) in the inner central part of the study area (western part of the aquifer) and northward, close to the Po River. The most saline water is found along the coastline and in the northwestern part of the aquifer (Ferrara province).
Figure 9 shows the groundwater quality from 2009 to 2018. Approximately 6.2% of the groundwater has good quality (EC ≤ 2.5 mScm−1) down to the bottom of the unconfined aquifer, meaning that the water column is fresh for the entire aquifer thickness; in 19 wells, the EC range is 10–56 mScm−1, showing a complete salinization of the aquifer; the remaining wells show shallow freshwater lenses floating on salty water with an oscillating freshwater–saltwater interface. Freshwater is confined in the northernmost part, along the Po River, west of Ravenna, and in the southernmost part; the rest of the aquifer has, on average, brackish-saline waters (EC range of 2.5–10 mScm−1).
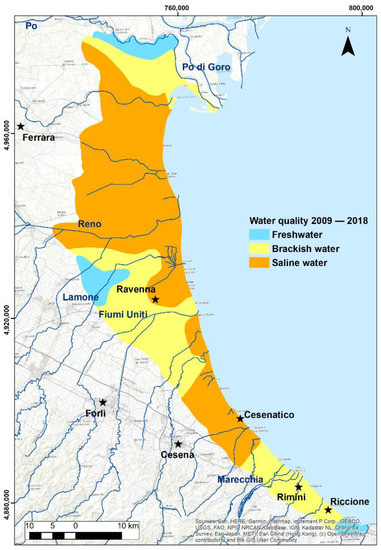
Figure 9.
Average water quality map of the unconfined aquifer showing the areal extent of freshwater, brackish, and saline water from 2009 to 2018.
Figure 10 shows the depth of the freshwater–saltwater interface and it allows the assessment of the average freshwater lens thickness in the coastal aquifer during the 2009–2018 period. The map also indicates that the freshwater aquifer thickness is larger than 4 m only in the northernmost part of the study area; the minimum thickness (≤0.1 m) is found in between the central part of the Ferrara and Ravenna provinces and the average thickness (3 m) is in the southern part of the study area. In the red zone of Figure 10, the whole water column is salty; the depth of freshwater–saltwater interface is ≤0.1 m. In the orange zone, there is a thin freshwater layer above the transition zone (0.1 to 0.4 m); in the green zone, the freshwater thickness is a bit larger (0.4 to 1.4 m); in the light blue zone, there is the largest freshwater thickness (1.4 to 4.6 m), and in the dark blue zone, the water column is completely fresh.
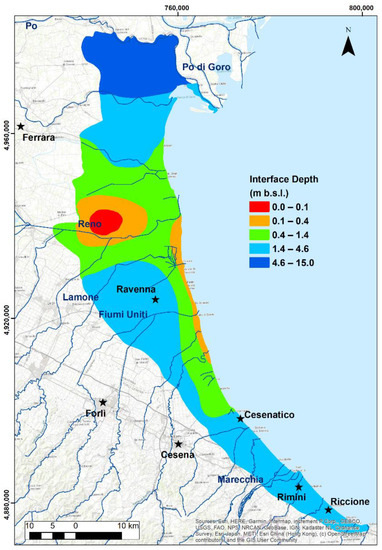
Figure 10.
The freshwater–saltwater interface depth over the period 2009–2018.
4. Discussion
4.1. Correlations and Statistical Analysis
The correlation analysis results (Table S1 in Supplementary Materials) show that there are expected and unexpected correlations among WT, EC, and RF through space and time. This is due to local geology, soil type, and geomorphology, as well as interactions between surface water and groundwater that locally affect rainfall infiltration.
In most wells, there is a negative relationship between EC and both WT and RF (Figure 3). The negative sign indicates that where the WT level and RF increase, the EC decreases. This implies that EC decrease over time in these wells depends on both WT level increase and aquifer recharge from precipitation.
There is a positive correlation for some wells between EC with both WT and RF. The positive sign indicates that as the WT and RF increase, the EC also increases due to the downward movement of the infiltrating waterfront through the unsaturated zone and the dissolution and migration of salt accumulated between two sequential rainfall periods. Climate is an important factor for mass movement in the unsaturated zone. During the dry season, salts accumulate in the sediments of the vadose zone, because of the recession of saline groundwater and evaporation of pore water. Rainfall that infiltrates and percolates along with the rise of water table can cause dissolution of salts deposited in the vadose zone during the previous dry period. Accordingly, after the first rain event at the beginning of each wet season, deep percolation leaches salt from the soil and adds saline water to the saturated zone, so that groundwater salinity increases. However, percolation through the unsaturated zone does not leach out all soluble salts from the sediment. Additional salts are released to the groundwater upon the rise of the water table and saturation of the vadose zone. As a result, as both the rainfall amount and water table level increase, the salinity also increases.
Some wells only have a positive correlation between EC and RF, but negative correlation between EC and WT, as in P8 and P29 (Figure 3). The positive correlation might be due to the first episode of salt added to the upper part of the aquifer during rainfall that flushed salt from the vadose zone, while the negative correlation is related to the water management in the agricultural area. For instance, near piezometer P8, the groundwater fluxes are governed by the current irrigation practice and drainage system, which consists of a dense network of canals [9]. In this area, during the spring and summer seasons, the canals used for irrigation recharge the aquifer. During the cold season, the canals are no longer used for irrigation and, consequently, the freshwater recharge stops, so that the freshwater lenses shrink. An increase in extreme rainfall events only has a minor influence on the aquifer salinization rate, whereas interruption of the usage of the irrigation water could create a serious upward seepage of high salinity groundwater from the bottom of the aquifer [9].
In wells P3 and P22, the correlation between EC and WT is positive and between EC and RF the correlation is negative. The reason for a positive EC–WT correlation might be due to hydraulic connectivity between sand below the prodelta unit and the overlying shallow aquifer. In the coastal aquifer of both Ravenna and Ferrara, Antonellini et al. [7,8] and Giambastiani et al. [10,11] highlighted the presence of vertical hydraulic gradients due to the drainage system, which forces groundwater to flow upwards from the bottom of the aquifer. This vertical seepage consists of saltwater that contributes to the increasing trend of salinization observed in the area [7,8,10,11] and could explain the behavior of these wells.
In wells P6, P8, and P11, the correlation between WT and RF is negative. There might be a lag between rainfall and water table rise; this correlation behavior is due to the presence of a semiconfined aquifer where a layer of silty clay material lies above the sand at those well locations. Observed differences in recharge rates and lag times between groundwater level response times to rainfall are primarily attributed to lithological controls on the transmission and storage of rain-fed recharge and thickness of the unsaturated zone. The presence of thick alluvial clay lenses is responsible for the lag time due to their low permeability characteristics. In all other wells, the correlation between WT and RF is positive. The maximum positive correlation (0.92) is found between RF and WT at P31 (Table S1 in Supplementary Materials).
In most wells, the surface geology is sand (Figure 6), which increases the aquifer vulnerability to salinization [42]. In the sandy area, seasonal changes are more pronounced where the aquifer hydraulic conductivity is high, whereas they are not significant where the hydraulic conductivity is relatively low [7]. A few studies [43,44] show that groundwater vertical seepage can occur through preferential pathways (permeable sandy units), where groundwater discharges upward at high velocities. During the dry and warm summer, the water table falls, and the salinity increases due to the increased vertical seepage from the bottom of the aquifer. According to Schneider and Kruse [45], this effect is more severe in sandy aquifers and in aquifers with small volumes, whereas seasonal variations are felt less strongly in fine-grained and large volume aquifers. In the western part of the Ferrara province, the surface geology is silty clay with peat, which leads to the reduction in the infiltration from precipitation or irrigation water. This, in turn, affects the water table level. In some cases, however, the upward seepage flow is contrasted by small silty and clayey lenses that locally confine the aquifer and prevent the complete salinization of the upper shallow aquifer [14].
The rising trends of groundwater EC in P4, P9, and P37 (Figure 4) are associated with sites located next to surface water bodies, rivers, and areas close to the sea. Presence of saltwater of marine origin, which was trapped during the Holocene transgression or the solution of evaporite salts formed during the Holocene transgression, might be the cause of the increased EC trend in these wells. The drainage system causes both an upward seepage of saltwater from the bottom of the aquifer [14], and inland migration of hypersaline lagoon and connate waters that affect the hydrochemistry in the different coastal environments of the study area (coastal forests, wetlands, etc.) [15,46].
Despite the limited length of the time series data (10 years), trends in Table 1 and Table 2 indicate an increase in freshwater stored in the aquifer (rising WT in 19 wells) and a decrease in the salinization process (decreasing EC in 22 wells). It should be noted that rainfall analysis performed over a 10-year period cannot show trends in climate change but it can provide insights on the climate variability in the study area. The rainfall trends calculated in this paper are uncertain (data not included here) and no statistically significant increase in annual rainfall, from 2009 to 2018, is evident. These results are in agreement with the ISPRA report [47], at the Italian national level, Cervi and Nistor’s work [48] on the Emilia-Romagna region, and are confirmed by Giambastiani et al. [14], who demonstrated no well-defined trends and no change of rainfall, in terms of intensity and extreme events, in the last 50 years (1971–2017) in the Ravenna territory.
4.2. Water Table Map
If one excludes the remnants of beach dunes along the coast and fossil paleo-dunes in the alluvial plain, most of the territory is below the mean sea level with a minimum elevation down to −4 m [7]. As a result, the WT level is mostly below sea level (Figure 7), which suggests that the aquifer is in unstable hydrodynamic conditions. These conditions allow for the active ingression of seawater from the east and the upwelling of the salty brackish water from the bottom of the aquifer [7,17]. This means that there cannot be a static hydraulic equilibrium in most of the studied coastal aquifer, so that the hydraulic head is not sufficient to avoid water to flow inland from the sea. The water table below sea level is maintained by the land reclamation pumping machines that need to drain a territory that would otherwise be flooded. The water level rapidly decreases everywhere during the summer, except for the area surrounding the irrigation channels where the water level is kept above sea level during the whole irrigation period, thus recharging the shallow aquifer. At the end of the irrigation season, the water level in the ditches returns to match the groundwater level, which is almost below sea level everywhere [12].
4.3. EC Distribution Map
In the 2009–2018 period, the water remains fresh only in the northernmost, western (Ravenna province), and southernmost parts of the study area (Figure 8). This is likely caused by the connection and contribution of the Po and the Apennine Rivers in the northernmost and southernmost areas, respectively [20]. One of the few places where there is currently a continuous dune belt is also where there is a healthy freshwater aquifer, proving the role of dunes as freshwater reservoirs [7,13]. In the southern part of the aquifer (Rimini province), the EC is low (Figure 8), because the hydraulic gradient in the aquifer is relatively high and directed towards the sea. This situation is due to the relative vicinity of the Apennines to the coast.
The high EC (average 45 mScm−1) in the western coastal area of the Ferrara province (Figure 8) is due to the paleogeography of the region. Here, saline and hypersaline waters are associated with fine sediments of back-barrier, saltmarsh, and lagoon environments, relics of the Holocene transgression [11]. Other high EC spots in Figure 8 corresponds to strongly subsiding areas (i.e., Cesenatico) and where rivers, channels, harbor channels, and open water bodies adjacent to the sea are salty and hydraulically connected to groundwater (sandy areas in Figure 6). Saltwater encroachment along the surface water bodies promotes aquifer salinization, especially in summer, due to saltwater infiltration along the river bottom and riverbanks given that the river always has a hydraulic head higher than that of the aquifer. The saltwater encroachment along rivers and canals increases from south to north as river gradients quickly diminish [7]. Greggio et al. [12] state that, near Ravenna, more than 68 km2 are at risk for salinization caused by saltwater intrusion in the coastal aquifer and along main rivers, such as the Fiumi Uniti, Lamone, and Reno Rivers (Figure 1).
4.4. Water Quality Map and Freshwater–Saltwater Interface
The water quality map in Figure 9 shows that most of the water in the aquifer cannot be used as it is salty. The water quality data were averaged over the whole aquifer column, so that in many places a thin freshwater lens still exists above what is mostly saltwater. The most saline portion of the aquifer coincides with the low-lying topographic coastal area and reclamation land between Ravenna and Ferrara [9,11]. Salinity is also high in the south of Ravenna, along the coast from Cervia to Cesenatico, due to low topography, saltwater encroachment along the harbor canals, and many canals being open to the sea [7]. The only places where the whole coastal aquifer is fresh are next to the Po River, in the southernmost portion where it is pinching out, and in the western Ravenna province. The inflow of freshwater from the Po (in the north) and the Marecchia (in the south) Rivers seem to be the most important control on the existence of a freshwater coastal aquifer in Emilia-Romagna. This is something that needs to be considered in the integrated coastal and water resource management.
The depth of the freshwater–saltwater interface is at a maximum in the north close to the Po River (Figure 10), where there is hydraulic connection between aquifer and river. Additionally, in the southwestern and southern parts of the aquifer, the interface is relatively deep (1.4–4.6 m, Figure 10). In this area, the aquifer is thin (<11 m), but the high hydraulic gradients and the recharge from the Marecchia River contributes to preserve a consistent fresh groundwater volume. In the central and westernmost parts of the aquifer, the interface is very shallow (0.0–0.4 m), due to the strong land subsidence and the lack of aquifer recharge. In fact, in this area, the surface aquifer is overlain by silty clay units that limit the rainfall infiltration and percolation. The remnant of coastal dune and palaeodune systems along the coast permit the formation of a freshwater lens that can be 0.4 to 1.4 m thick, as confirmed also by Cozzolino et al. [13]. Where the dune systems are lacking or where the coastal dunes have been covered by pine forests, the thickness of the freshwater lens is more limited (0.1–0.4 m, Figure 10) due to the increase in evapotranspiration [49], and the presence of forest drainage canals [13].
5. Conclusions
This research assesses the distribution of water level and salinization at the regional scale in the coastal aquifer of the Emilia-Romagna region (Northeast Italy) and evaluates their trends in time during the period 2009–2018. The rationale behind this research is that the aquifer is currently affected by salinization, which reduces freshwater availability, induces soil salinization, and threatens the local ecosystems. In general terms, the results show that the presence of freshwater in the coastal aquifer is mainly controlled by strong seaward-directed hydraulic gradients, a good connectivity between aquifer and high discharge rivers, as well as by the presence of a coastal dune systems without pine forests.
The statistical analysis of groundwater and rainfall data shows that 22 wells out of 35 were freshening, whereas 12 wells were becoming saltier in the period 2009–2018. This is a positive development, which cannot be related to the rainfall variability that does not show significant change in the same period.
The spatial distribution maps shows that water table level is low in the western and northern parts of the study area because of the semiconfined behavior of the aquifer. The existence of water table level below sea level and high salinity at the bottom of the aquifer in many zones suggest that the aquifer is in unstable hydrodynamic conditions and that strong vertical seepage of saltwater from the bottom towards the top aquifer occurs. The limited rainfall, along with fine overbank deposits and heavy drainage, result in small effective recharge of the coastal aquifer.
Groundwater salinity is promoted by land subsidence (causing increased drainage) and where saline surface water bodies are hydraulically connected to the aquifer. Encroachment of sea water along rivers and canals combined with drainage of agricultural lands contribute to increase the aquifer salinization. Only in the northernmost (next to the Po River), in the west of Ravenna, and in the southernmost (next to the Marecchia River) areas does the groundwater remain fresh for the whole 2009–2018 period. This suggests that inflow of freshwater into the aquifer from high discharge rivers is important to preserve freshwater in the aquifer and should be carefully maintained and managed in the future.
Overall, the aquifer salinization did not increase and the water table level did not decrease in the ten-year period under examination and there are some encouraging local signs of freshening.
Supplementary Materials
The following are available online at https://www.mdpi.com/2073-4441/13/3/372/s1, Table S1: Correlation coefficients between EC and WT, EC and RF, and WT and RF data; Figure S1A: Fitting semi-variogram models for the mean WT levels; Figure S2A: Fitting semi-variogram models for the mean EC.
Author Contributions
Conceptualization, B.M.S.G. and M.A.; Data curation, B.M.S.G. and M.A.; Methodology, A.K., B.M.S.G. and M.A.; Supervision, B.M.S.G. and M.A.; Visualization: B.M.S.G.; Writing—original draft, A.K.; Writing—review and editing, B.M.S.G., A.D. and M.A. All authors have read and agreed to the published version of the manuscript.
Funding
This research received no external funding.
Acknowledgments
The authors would like to thank Paolo Severi, Luciana Bonzi, Lorenzo Calabrese and their colleagues of the Geological, Seismic and Soil Survey of the Emilia-Romagna Region for providing the regional dataset used in this study, as well as the Coastal Saltwater Intrusion (CSI) project. The authors also like to thank WACOMA (Water and Coastal Management) Programme for the financial support.
Conflicts of Interest
The authors declare that they have no conflicts of interest.
References
- Neumann, B.; Ott, K.; Kenchington, R. Strong sustainability in coastal areas: A conceptual interpretation of SDG 14. Sustain. Sci. 2017, 12, 1019–1035. [Google Scholar] [CrossRef] [PubMed]
- Kumar, C. Climate change and its impact on groundwater resources. Int. J. Eng. Sci. 2012, 1, 43–60. [Google Scholar]
- Post, V.E.A.; Eichholz, M.; Brentführer, R. Groundwater Management in Coastal Zones; Bundesanstalt für Geowissenschaften und Rohstoffe (BGR): Hannover, Germany, 2018; p. 107. [Google Scholar]
- Ericson, J.P.; Vörösmarty, C.J.; Dingman, S.L.; Ward, L.G.; Meybeck, M. Effective sea-level rise and deltas: Causes of change and human dimension implications. Glob. Planet. Chang. 2006, 50, 63–82. [Google Scholar] [CrossRef]
- Custodio, E.; Bruggeman, G.A. Groundwater Problems in Coastal Areas; Studies and Reports in Hydrology 45; UNESCO: París, France; 596p.
- Vengosh, A. Salinization and Saline Environments. In Treatise on Geochemistry, 2nd ed.; Elsevier: Amsterdam, The Netherlands, 2014; pp. 325–378. [Google Scholar] [CrossRef]
- Antonellini, M.; Mollema, P.; Giambastiani, B.M.S.; Bishop, K.; Caruso, L.; Minchio, A.; Pellegrini, L.; Sabia, M.; Ulazzi, E.; Gabbianelli, G. Salt water intrusion in the coastal aquifer of the southern Po Plain, Italy. Hydrogeol. J. 2008, 16, 1541–1556. [Google Scholar] [CrossRef]
- Antonellini, M.; Allen, D.M.; Mollema, P.N.; Capo, D.; Greggio, N. Groundwater freshening following coastal progradation and land reclamation of the Po Plain, Italy. Hydrogeol. J. 2015, 23, 1009–1026. [Google Scholar] [CrossRef]
- Colombani, N.; Mastrocicco, M.; Giambastiani, B.M.S. Predicting Salinization Trends in a Lowland Coastal Aquifer: Comacchio (Italy). Water Resour. Manag. 2015, 29, 603–618. [Google Scholar] [CrossRef]
- Giambastiani, B.M.S.; Antonellini, M.; Essink, G.O.; Stuurman, R.J. Saltwater intrusion in the unconfined coastal aquifer of Ravenna (Italy): A numerical model. J. Hydrol. 2007, 340, 91–104. [Google Scholar] [CrossRef]
- Giambastiani, B.M.S.; Colombani, N.; Mastrocicco, M.; Fidelibus, M.D. Characterization of the lowland coastal aquifer of Comacchio (Ferrara, Italy): Hydrology, hydrochemistry and evolution of the system. J. Hydrol. 2013, 501, 35–44. [Google Scholar] [CrossRef]
- Greggio, N.; Mollema, P.N.; Antonellini, M.; Gabbianelli, G. Irrigation Management in Coastal Zones to Prevent Soil and Groundwater Salinization. In Resource Management for Sustainable Agriculture; Abrol, V., Ed.; IntechOpen: London, UK, 2012. [Google Scholar] [CrossRef][Green Version]
- Cozzolino, D.; Greggio, N.; Antonellini, M.; Giambastiani, B.M.S. Natural and anthropogenic factors affecting freshwater lenses in coastal dunes of the Adriatic coast. J. Hydrol. 2017, 551, 804–818. [Google Scholar] [CrossRef]
- Giambastiani, B.M.S.; Macciocca, V.R.; Molducci, M.; Antonellini, M. Factors Affecting Water Drainage Long-Time Series in the Salinized Low-Lying Coastal Area of Ravenna (Italy). Water 2020, 12, 256. [Google Scholar] [CrossRef]
- Mollema, P.N.; Antonellini, M.; Dinelli, E.; Gabbianelli, G.; Greggio, N.; Stuyfzand, P.J. Hydrochemical and physical processes influencing salinization and freshening in Mediterranean low-lying coastal environments. Appl. Geochem. 2013, 34, 207–221. [Google Scholar] [CrossRef]
- Antonellini, M.; Mollema, P.N. Impact of groundwater salinity on vegetation species richness in the coastal pine forests and wetlands of Ravenna, Italy. Ecol. Eng. 2010, 36, 1201–1211. [Google Scholar] [CrossRef]
- Mollema, P.N.; Antonellini, M.; Gabbianelli, G.; Laghi, M.; Marconi, V.; Minchio, A. Climate and water budget change of a Mediterranean coastal watershed, Ravenna, Italy. Environ. Earth Sci. 2012, 65, 257–276. [Google Scholar] [CrossRef]
- Laghi, M.; Mollema, P.N.; Antonellini, M. The Influence of River Bottom Topography on Salt Water Encroachment Along the Lamone River (Ravenna, Italy), and Implications for the Salinization of the Adjacent Coastal Aquifer. In Proceedings of the World Environmental and Water Resources Congress 2010: Challenges of Change, Providence, RI, USA, 16–20 May 2010; ASCE, Ed.; pp. 1124–1135. [Google Scholar]
- Rivière, A.; Gonçalvès, J.; Jost, A.; Font, M. Experimental and numerical assessment of transient stream–Aquifer exchange during disconnection. J. Hydrol. 2014, 517, 574–583. [Google Scholar] [CrossRef]
- Bonzi, L.; Calabrese, L.; Severi, P.; Vincenzi, V. L’Acquifero Freatico Costiero della Regione Emilia-Romagna: Modello Geologico e Stato di Salinizzazione. Il Geologo dell’Emilia-Romagna 2010, 39, 21–34. [Google Scholar]
- Amorosi, A.; Colalongo, M.I.; Pasini, G.; Preti, D. Sedimentary response to Late Quaternary sea-level changes in the Romagna coastal plain (northern Italy). Sedimentology 1999, 46, 99–121. [Google Scholar] [CrossRef]
- Bondesan, M.; Favero, V.; Viñals, M.J. New evidence on the evolution of the Po-delta coastal plain during the Holocene. Quat. Int. 1995, 29, 105–110. [Google Scholar] [CrossRef]
- Amorosi, A.; Centineo, M.C.; Dinelli, E.; Lucchini, F.; Tateo, F. Geochemical and mineralogical variations as indicators of provenance changes in Late Quaternary deposits of SE Po Plain. Sediment. Geol. 2002, 151, 273–292. [Google Scholar] [CrossRef]
- Campo, B.; Amorosi, A.; Vaiani, S.C. Sequence stratigraphy and late Quaternary paleoenvironmental evolution of the Northern Adriatic coastal plain (Italy). Palaeogeogr. Palaeoclim. Palaeoecol. 2017, 466, 265–278. [Google Scholar] [CrossRef]
- Mann, H.B. Nonparametric tests against trend. Econometrica 1945, 13, 245–259. [Google Scholar] [CrossRef]
- Kendall, M.G.; Gibbons, J.D. Rank Correlation Methods (Charles Griffin Book Series); Oxford University Press: Oxford, UK, 1990; p. 272. [Google Scholar]
- Sen, P.K. Estimates of the regression coefficient based on Kendall’s Tau. J. Am. Stat. Assoc. 1968, 63, 1379–1389. [Google Scholar] [CrossRef]
- Gibbons, R.D.; Bhaumik, D.K.; Aryal, S. Statistical Methods for Groundwater Monitoring; John Wiley & Sons: Hoboken, NJ, USA, 2009; p. 400. [Google Scholar]
- Gilbert, R.O. Statistical Methods for Environmental Pollution Monitoring; Van Nostrand Reinhold Co: New York, NY, USA, 1987; p. 336. [Google Scholar]
- Yue, S.; Pilon, P.; Phinney, B.; Cavadias, G. The influence of autocorrelation on the ability to detect trend in hydrological series. Hydrol. Process. 2002, 16, 1807–1829. [Google Scholar] [CrossRef]
- Salmi, T.; Määttä, A.; Anttila, P.; Ruoho-Airola, T.; Amnell, T. Detecting Trends of Annual Values of Atmospheric Pollutants by the Mann-Kendall Test and Sen’s Slope Estimates: The Excel Template Application MAKESENS; Finnish Meteorological Institute: Helsinki, Finland, 2002; p. 35. [Google Scholar]
- McBean, E.; Motiee, H. Assessment of impact of climate change on water resources: A long term analysis of the Great Lakes of North America. Hydrol. Earth Syst. Sci. 2008, 12, 239–255. [Google Scholar] [CrossRef]
- Johnston, K.; Hoef, J.M.V.; Krivoruchko, K.; Lucas, N. Using ArcGIS Geostatistical Analyst; ESRI: Redlands, CA, USA, 2001; p. 307. [Google Scholar]
- Berke, O. Estimation and Prediction in the Spatial Linear Model. Water Air Soil Pollut. 1999, 110, 215–237. [Google Scholar] [CrossRef]
- Mustapha, A. Detecting surface water quality trends using Mann-Kendall tests and Sen’s slope estimates. IJAIR 2013, 108–114. [Google Scholar]
- Obaje, N.G. Geology and Mineral Resources of Nigeria; Series: Lecture Notes in Earth Sciences; Springer: Berlin/Heidelberg, Germany, 2009; Volume 120. [Google Scholar] [CrossRef]
- Cay, T.; Uyan, M. Spatial and temporal groundwater level variation geostatistical modeling in the city of Konya, Turkey. Water Environ. Res. 2009, 81, 2460–2470. [Google Scholar] [CrossRef] [PubMed]
- Giambastiani, B.M.S.; Greggio, N.; Nobili, G.; Dinelli, E.; Antonellini, M. Forest fire effects on groundwater in a coastal aquifer (Ravenna, Italy). Hydrol. Process. 2018, 32, 2377–2389. [Google Scholar] [CrossRef]
- Greggio, N.; Giambastiani, B.M.S.; Balugani, E.; Amaini, C.; Antonellini, M. High-Resolution Electrical Resistivity Tomography (ERT) to Characterize the Spatial Extension of Freshwater Lenses in a Salinized Coastal Aquifer. Water 2018, 10, 1067. [Google Scholar] [CrossRef]
- Piccinini, L.; Vincenzi, V.; Gargini, A. Monitoraggio di flusso a densità variabile di un acquifero freatico salinizzato. Giornale Geologia Applicata 2008, 9, 249–261. [Google Scholar]
- Legislative Decree. Attuazione della direttiva 98/83/CE relativa alla qualità delle acque destinate al consumo umano. Implement. Dir. 2001, 98, 83. [Google Scholar]
- Rose, D.A.; Konukcu, F.; Gowing, J.W. Effect of watertable depth on evaporation and salt accumulation from saline groundwater. Soil Res. 2005, 43, 565. [Google Scholar] [CrossRef]
- Boonstra, J.; Bhutta, M.N. Groundwater recharge in irrigated agriculture: The theory and practice of inverse modelling. J. Hydrol. 1996, 174, 357–374. [Google Scholar] [CrossRef]
- Bouwer, H. Chapter 24—Artificial Recharge of Groundwater: Systems, Design, and Management. In Hydraulic Design Handbook; Mays, L.W., Ed.; McGraw-Hill: New York, NY, USA, 1999. [Google Scholar]
- Schneider, J.C.; Kruse, S.E. Assessing selected natural and anthropogenic impacts on freshwater lens morphology on small barrier Islands: Dog Island and St. George Island, Florida, USA. Hydrogeol. J. 2006, 14, 131–145. [Google Scholar] [CrossRef]
- Vandenbohede, A.; Mollema, P.N.; Greggio, N.; Antonellini, M. Seasonal dynamic of a shallow freshwater lens due to irrigation in the coastal plain of Ravenna, Italy. Hydrogeol. J. 2014, 22, 893–909. [Google Scholar] [CrossRef]
- ISPRA. Variazioni e Tendenze Degli Estremi di Temperatura e Precipitazione in Italia. Stato dell’Ambiente. 2013. Available online: https://www.isprambiente.gov.it/it/pubblicazioni/stato-dellambiente/variazioni-e-tendenze-degli-estremi-di-temperatura-e-precipitazione-in-italia (accessed on 15 January 2021).
- Cervi, F.; Nistor, M.-M. High Resolution of Water Availability for Emilia-Romagna Region over 1961–2015. Adv. Meteorol. 2018, 2018, 2489758. [Google Scholar] [CrossRef]
- Mollema, P.N.; Antonellini, M.; Gabbianelli, G.; Galloni, E. Water budget management of a coastal pine forest in a Mediterranean catchment (Marina Romea, Ravenna, Italy). Environ. Earth Sci. 2013, 68, 1707–1721. [Google Scholar] [CrossRef]
Publisher’s Note: MDPI stays neutral with regard to jurisdictional claims in published maps and institutional affiliations. |
© 2021 by the authors. Licensee MDPI, Basel, Switzerland. This article is an open access article distributed under the terms and conditions of the Creative Commons Attribution (CC BY) license (http://creativecommons.org/licenses/by/4.0/).