
Estimating Yield and Water Productivity of Tomato Using a Novel Hybrid Approach

 ,
,  ,
, 
Abstract
:1. Introduction
2. Materials and Methods
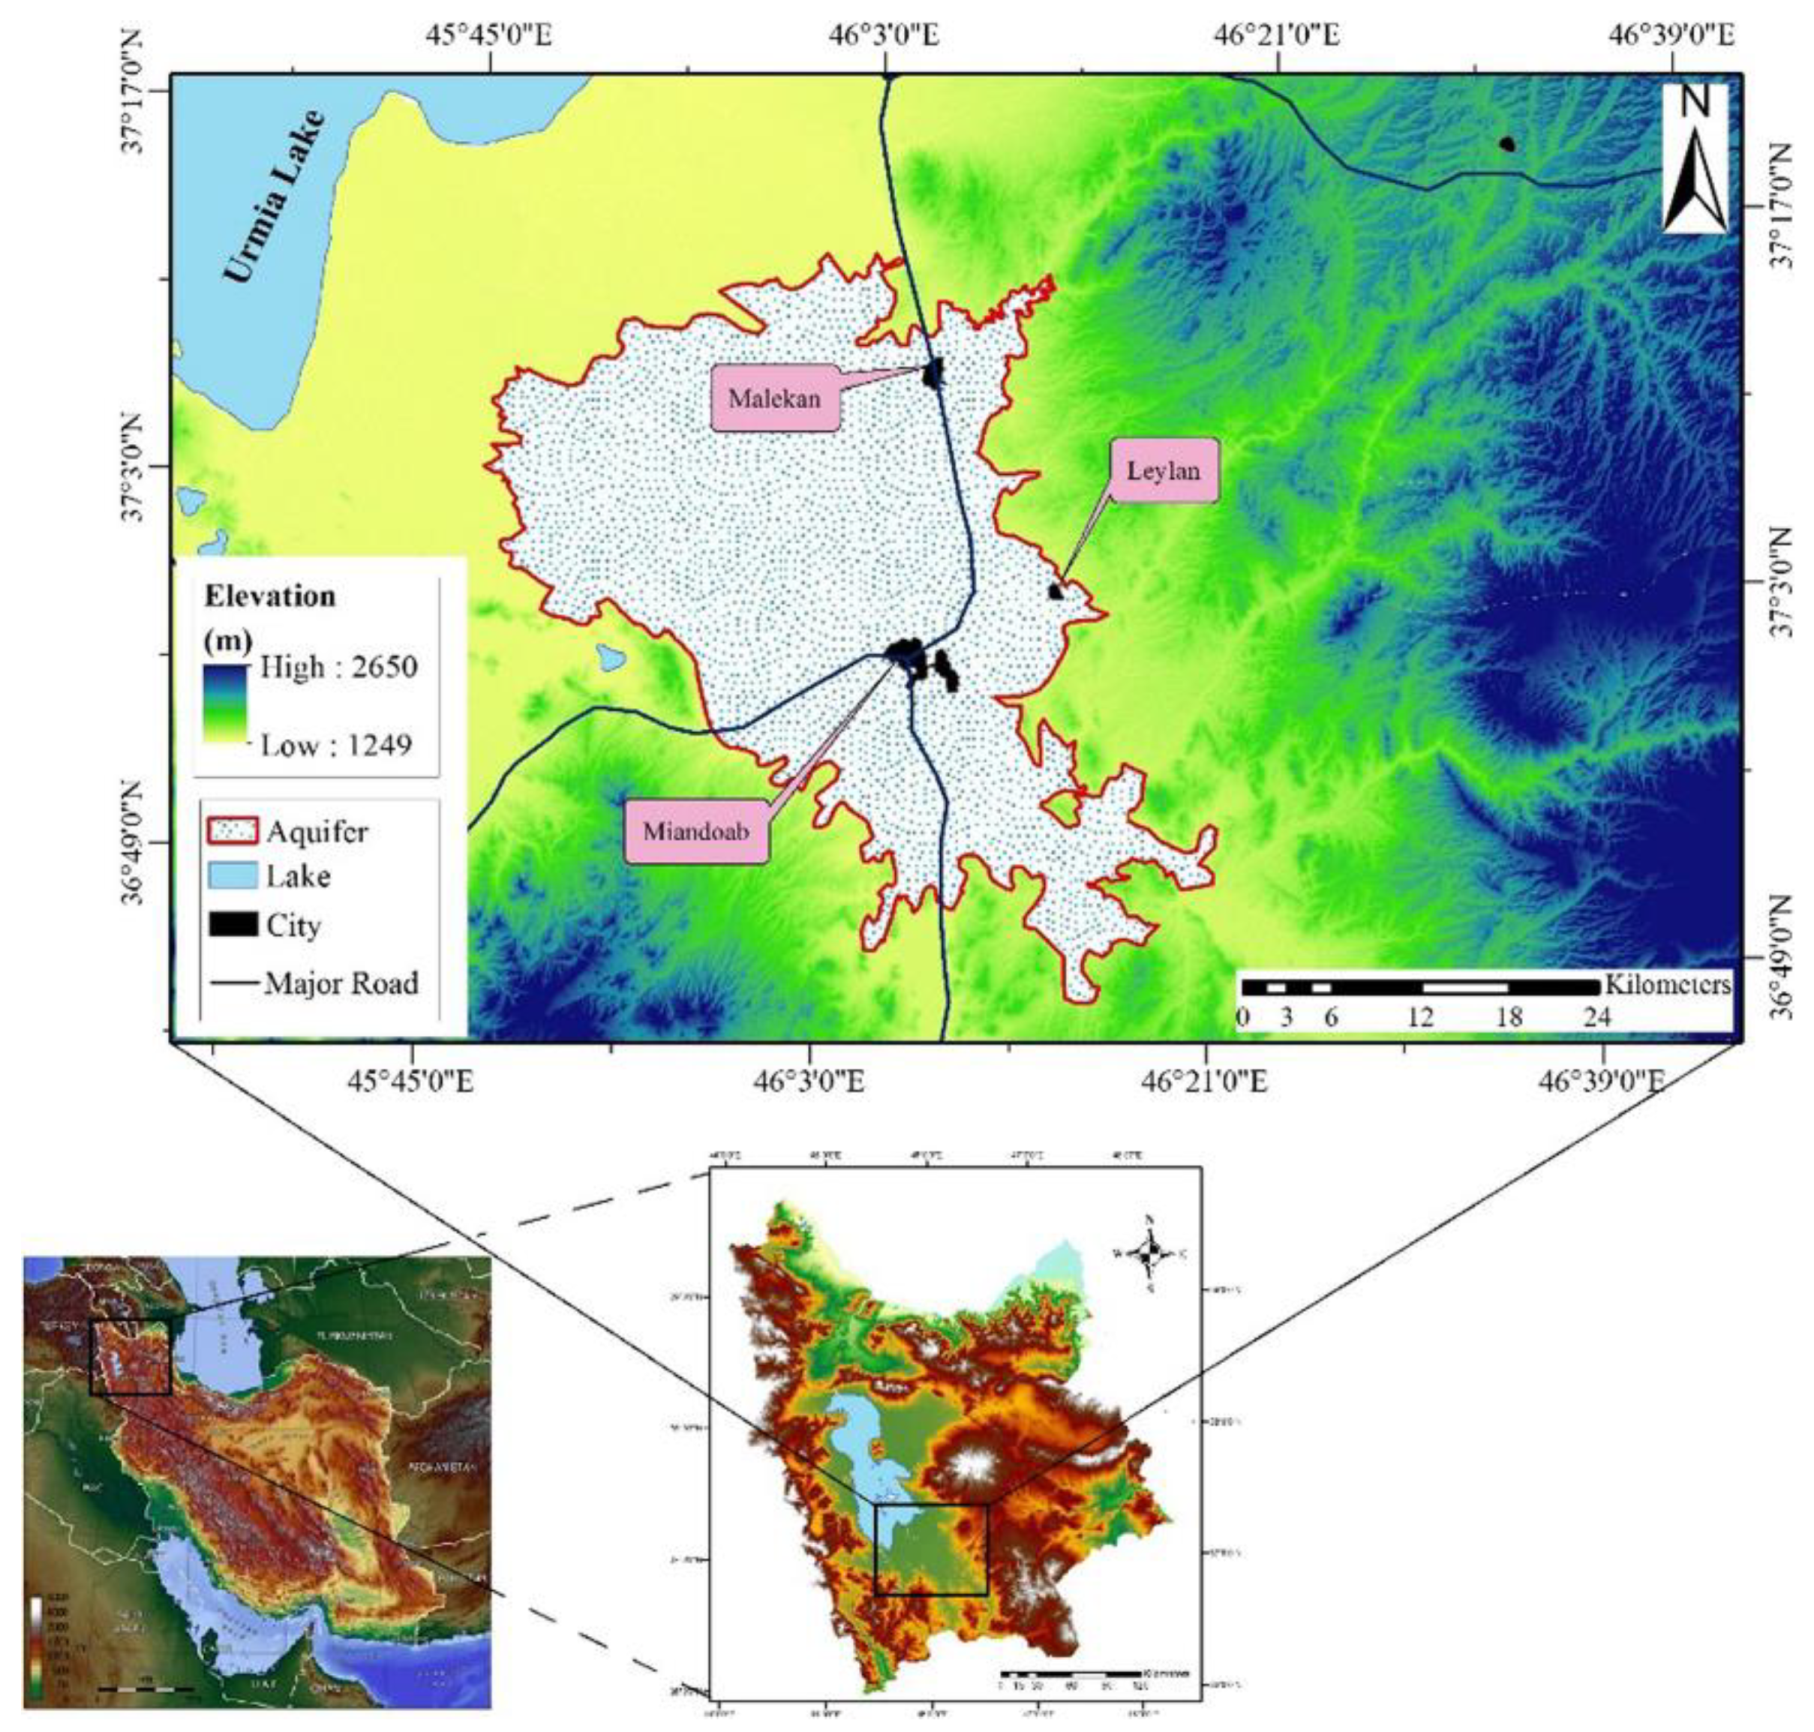
2.1. Field Studies
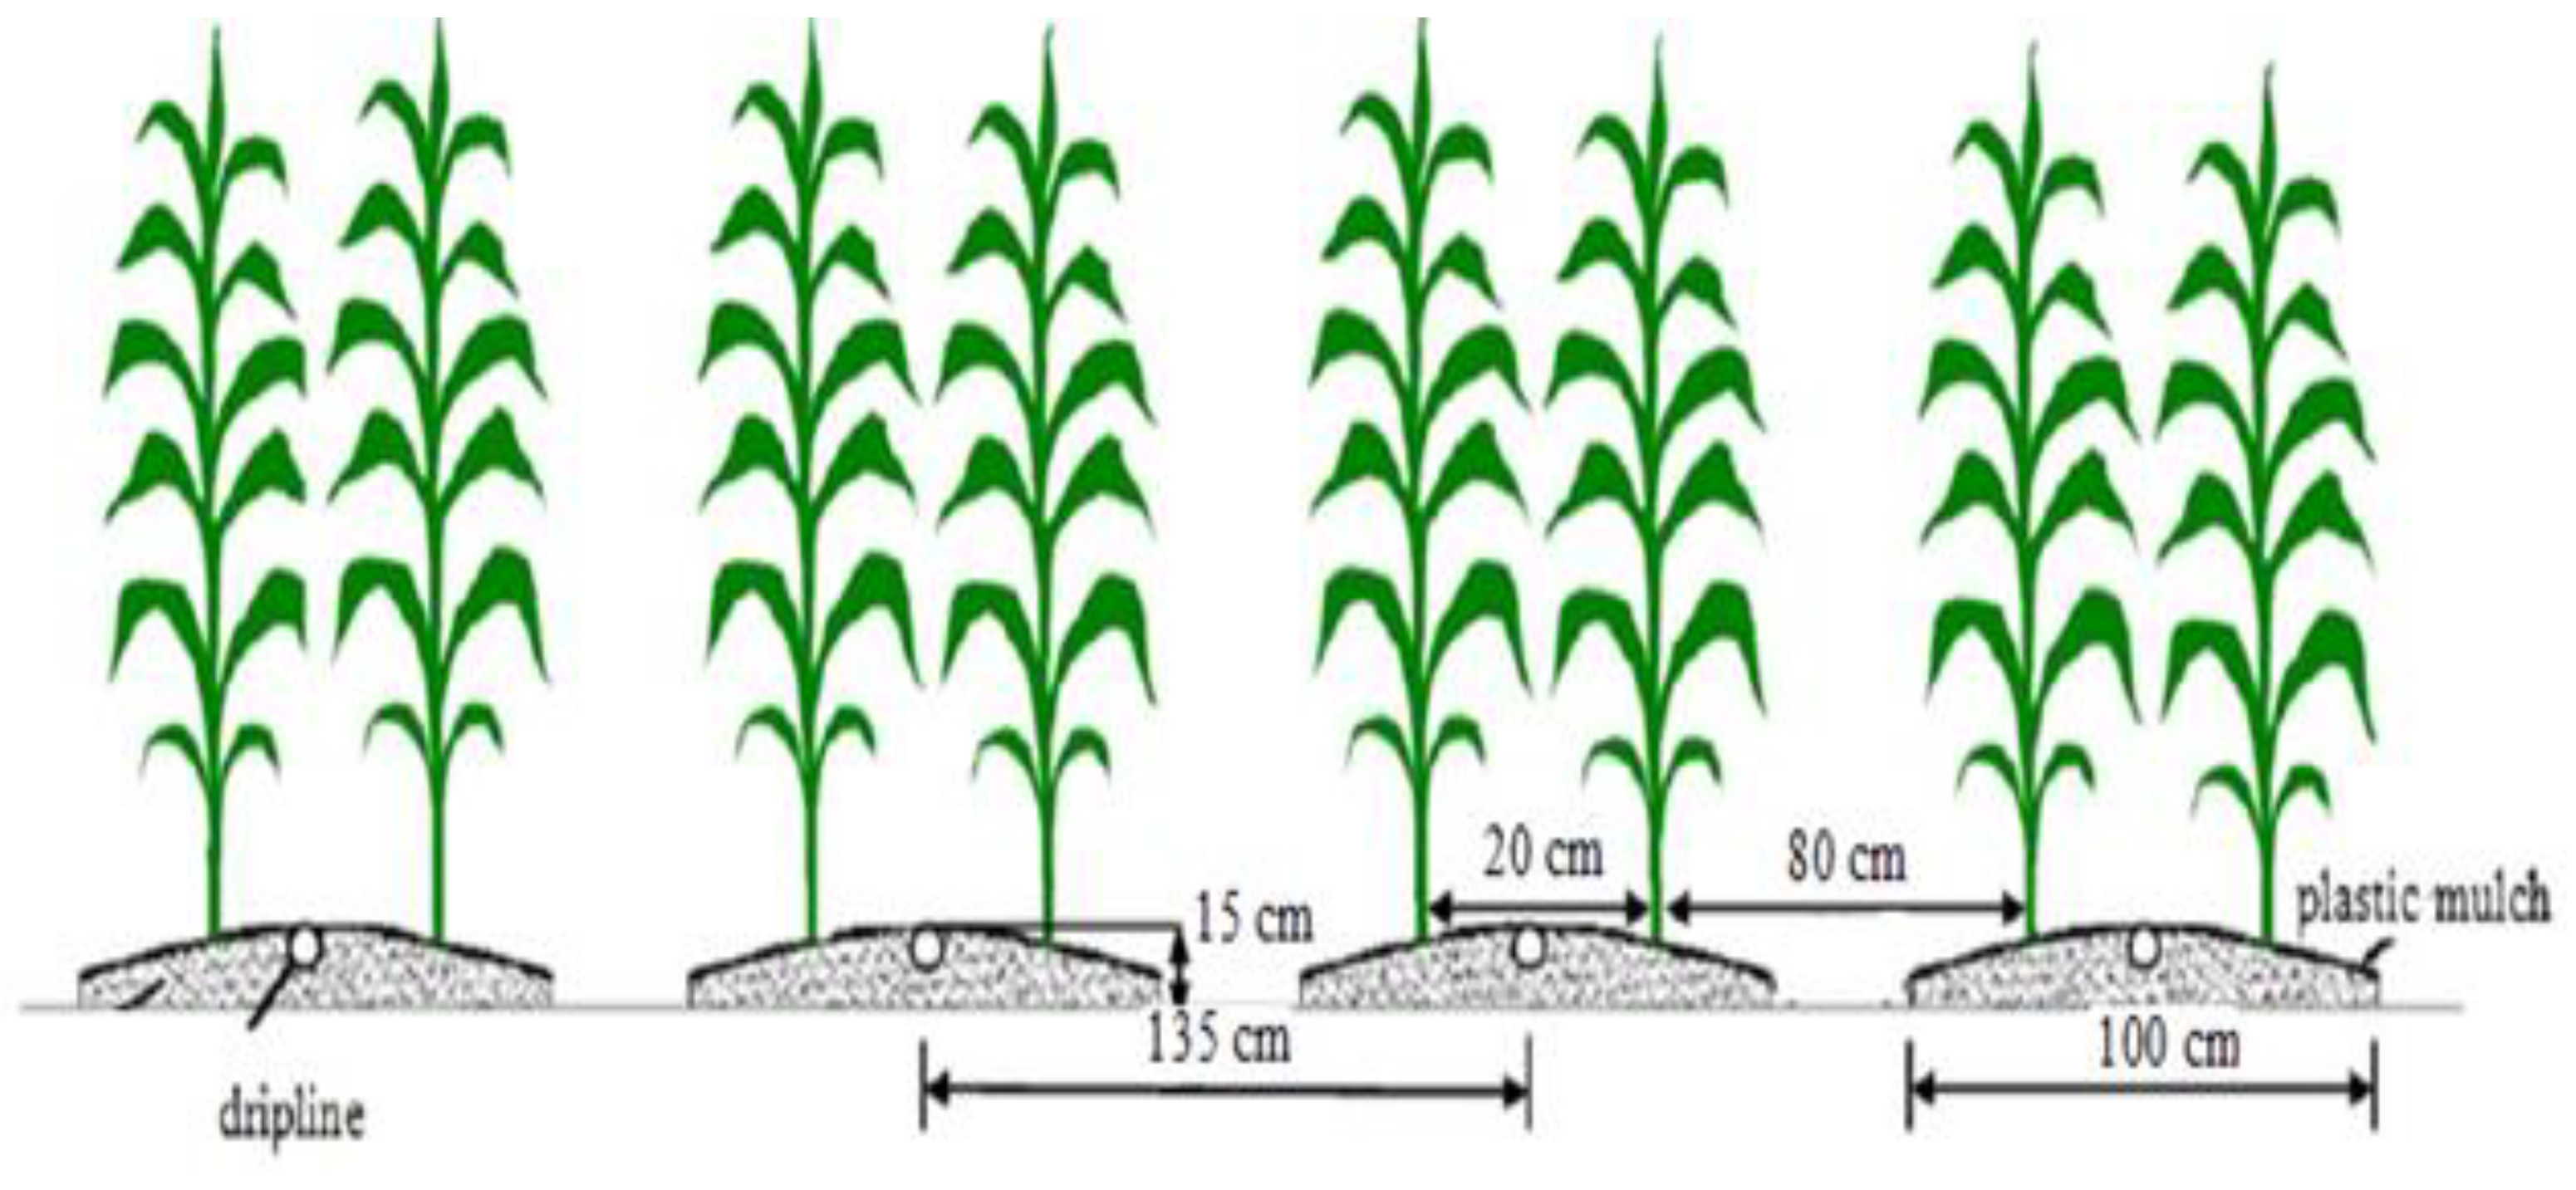
2.2. Site Designation and Experimental Treatments
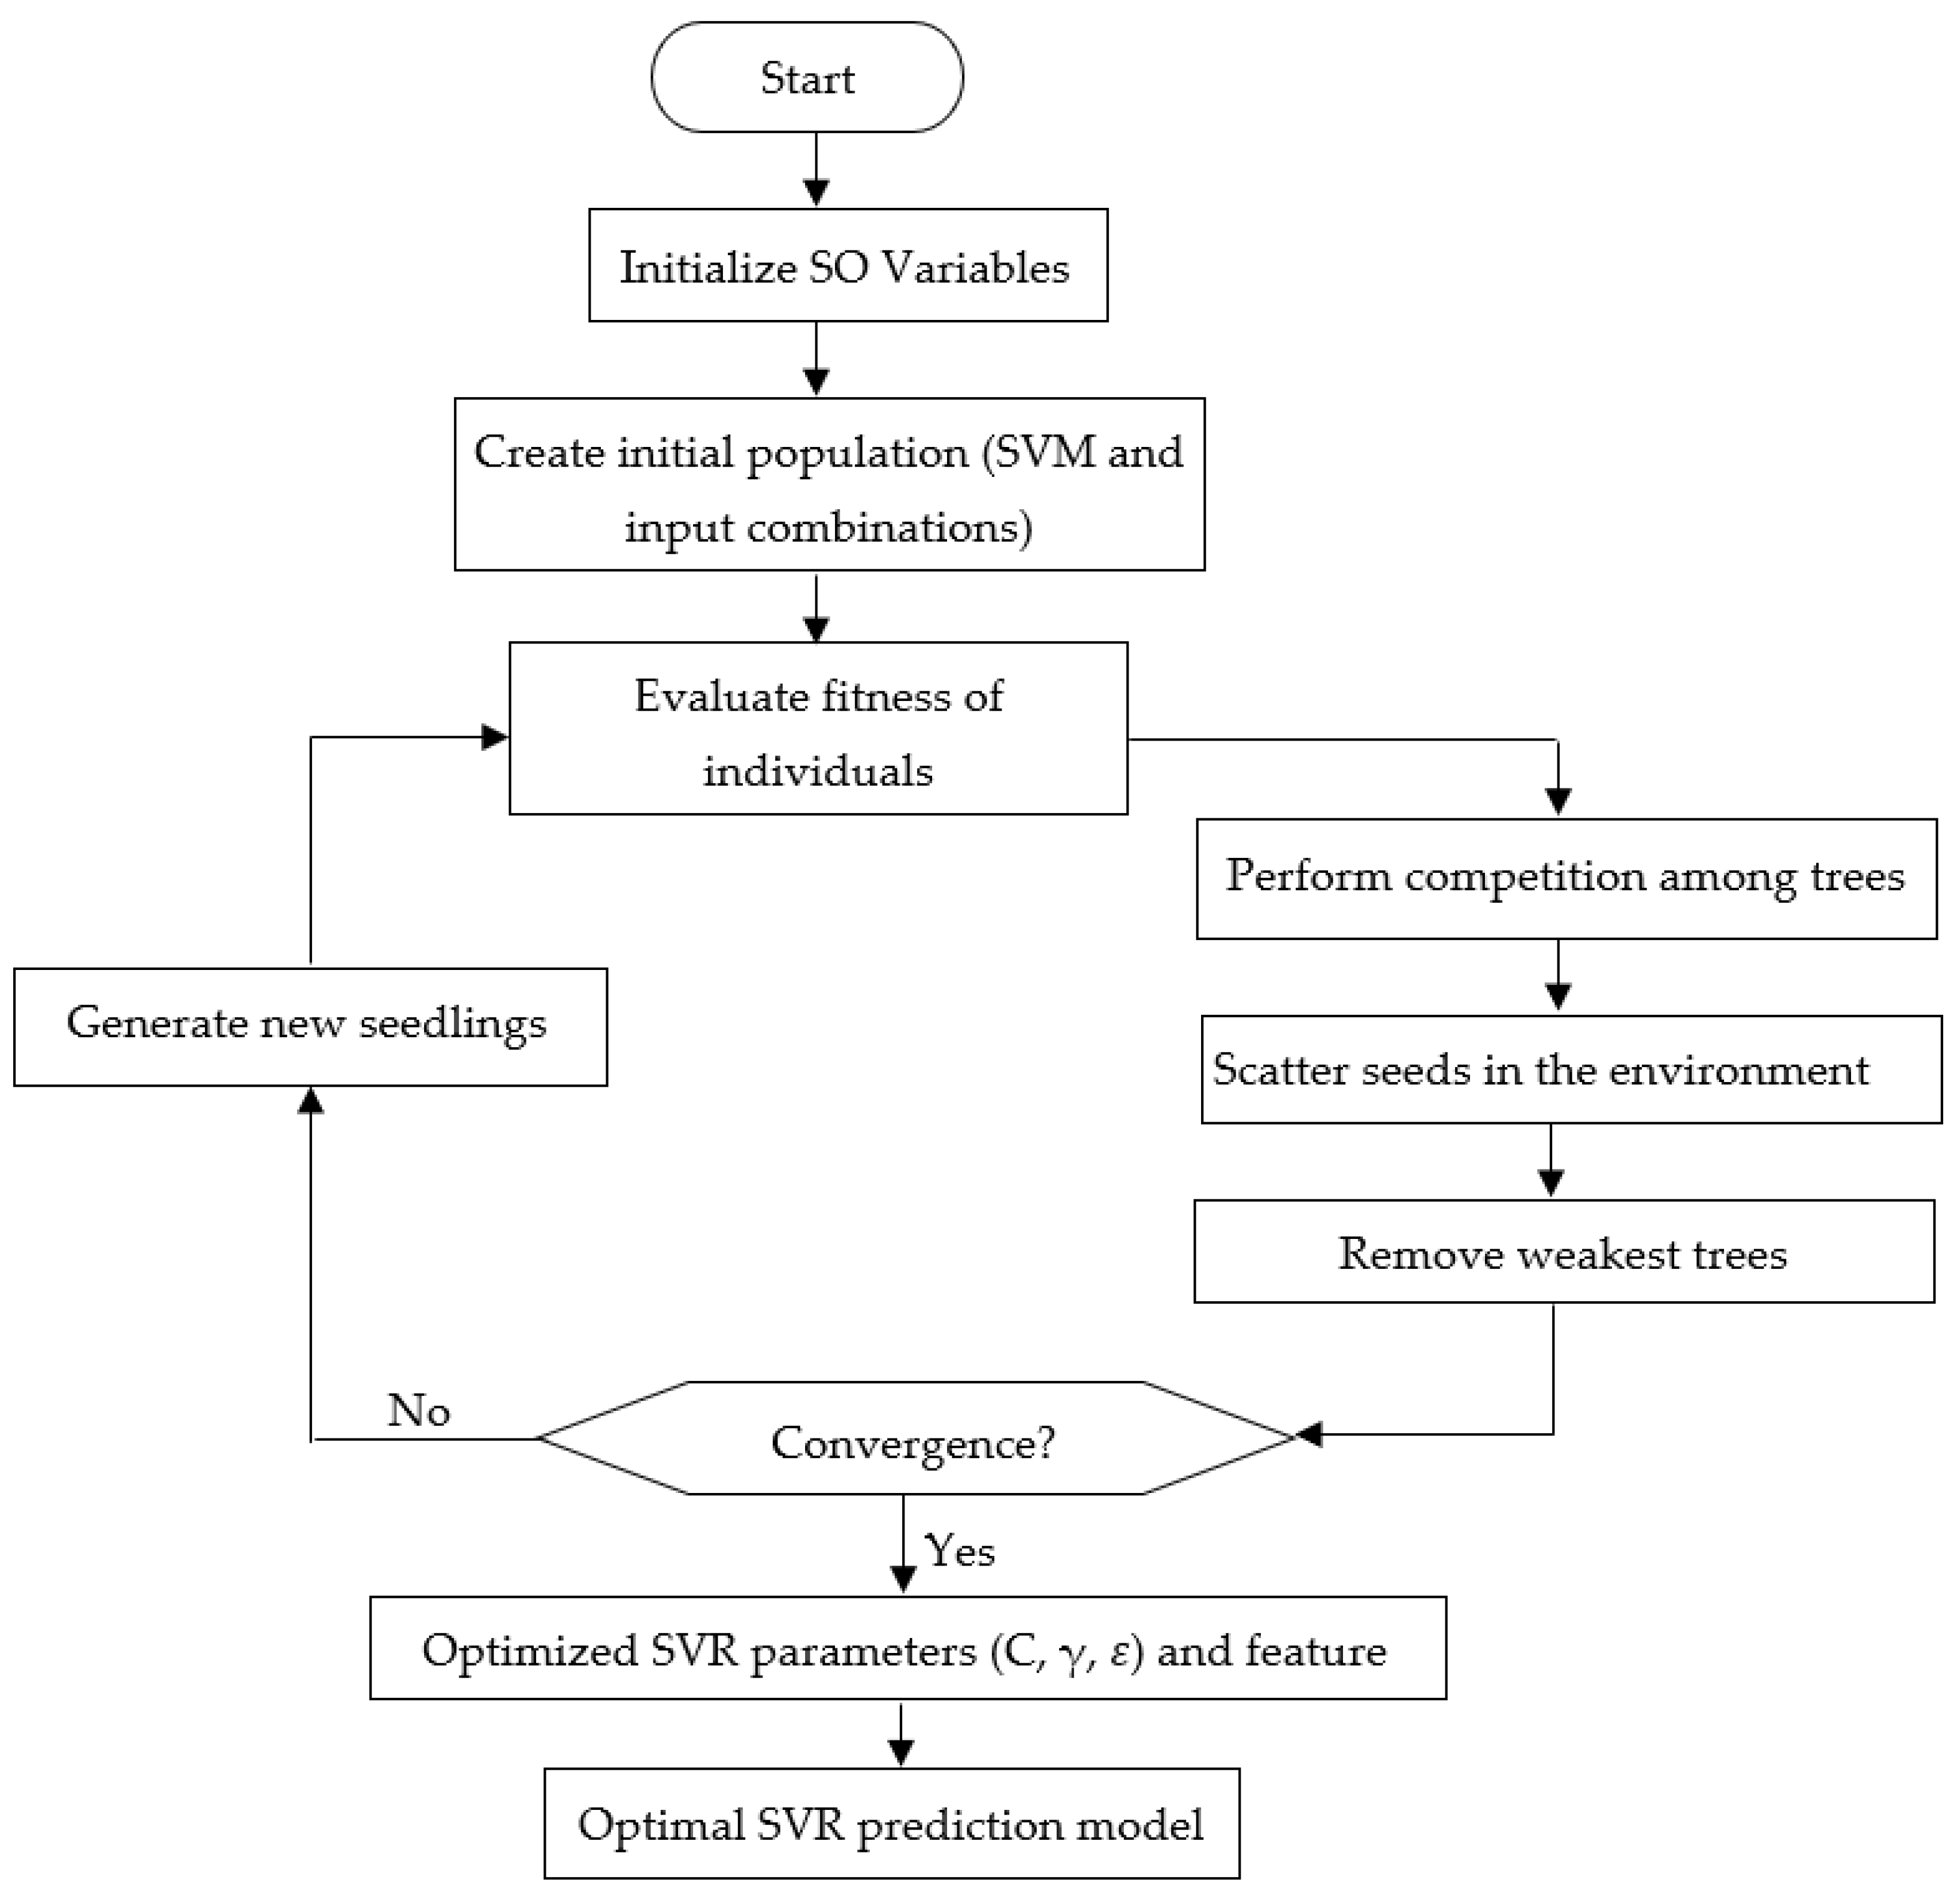
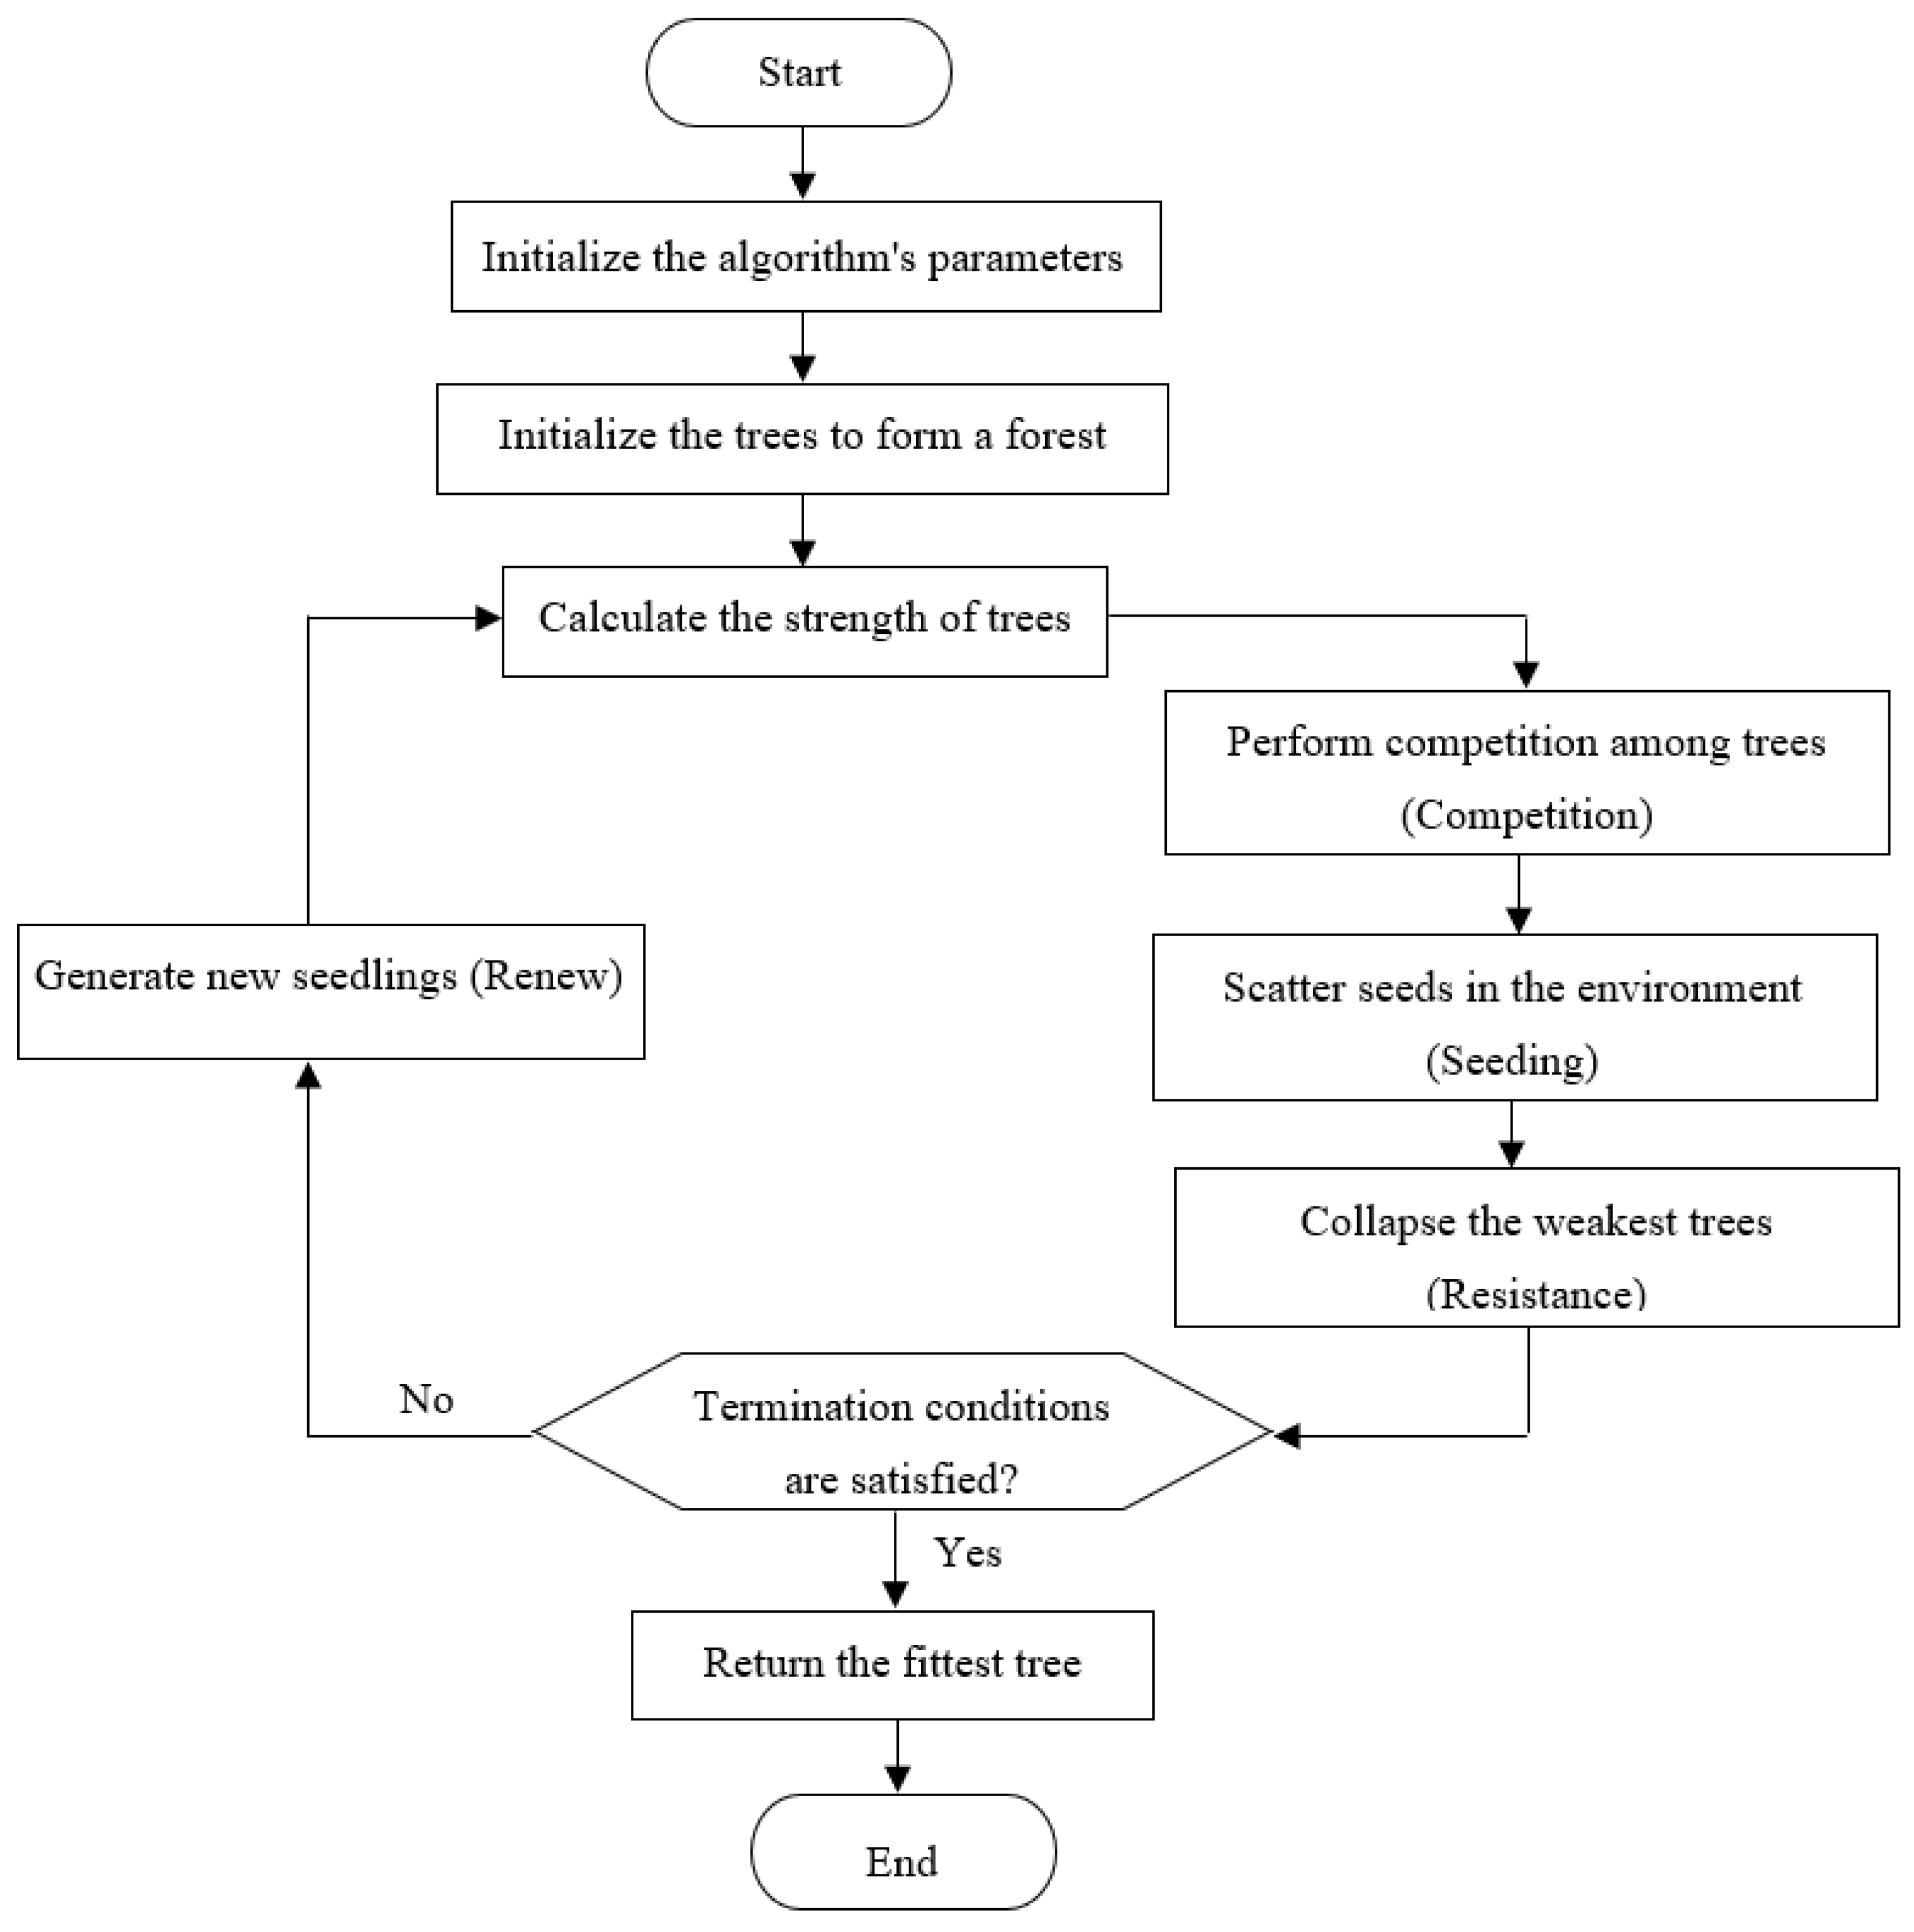
2.3. Seasons Optimization Algorithm
2.4. Support Vector Regression (SVR)
2.5. Benchmark
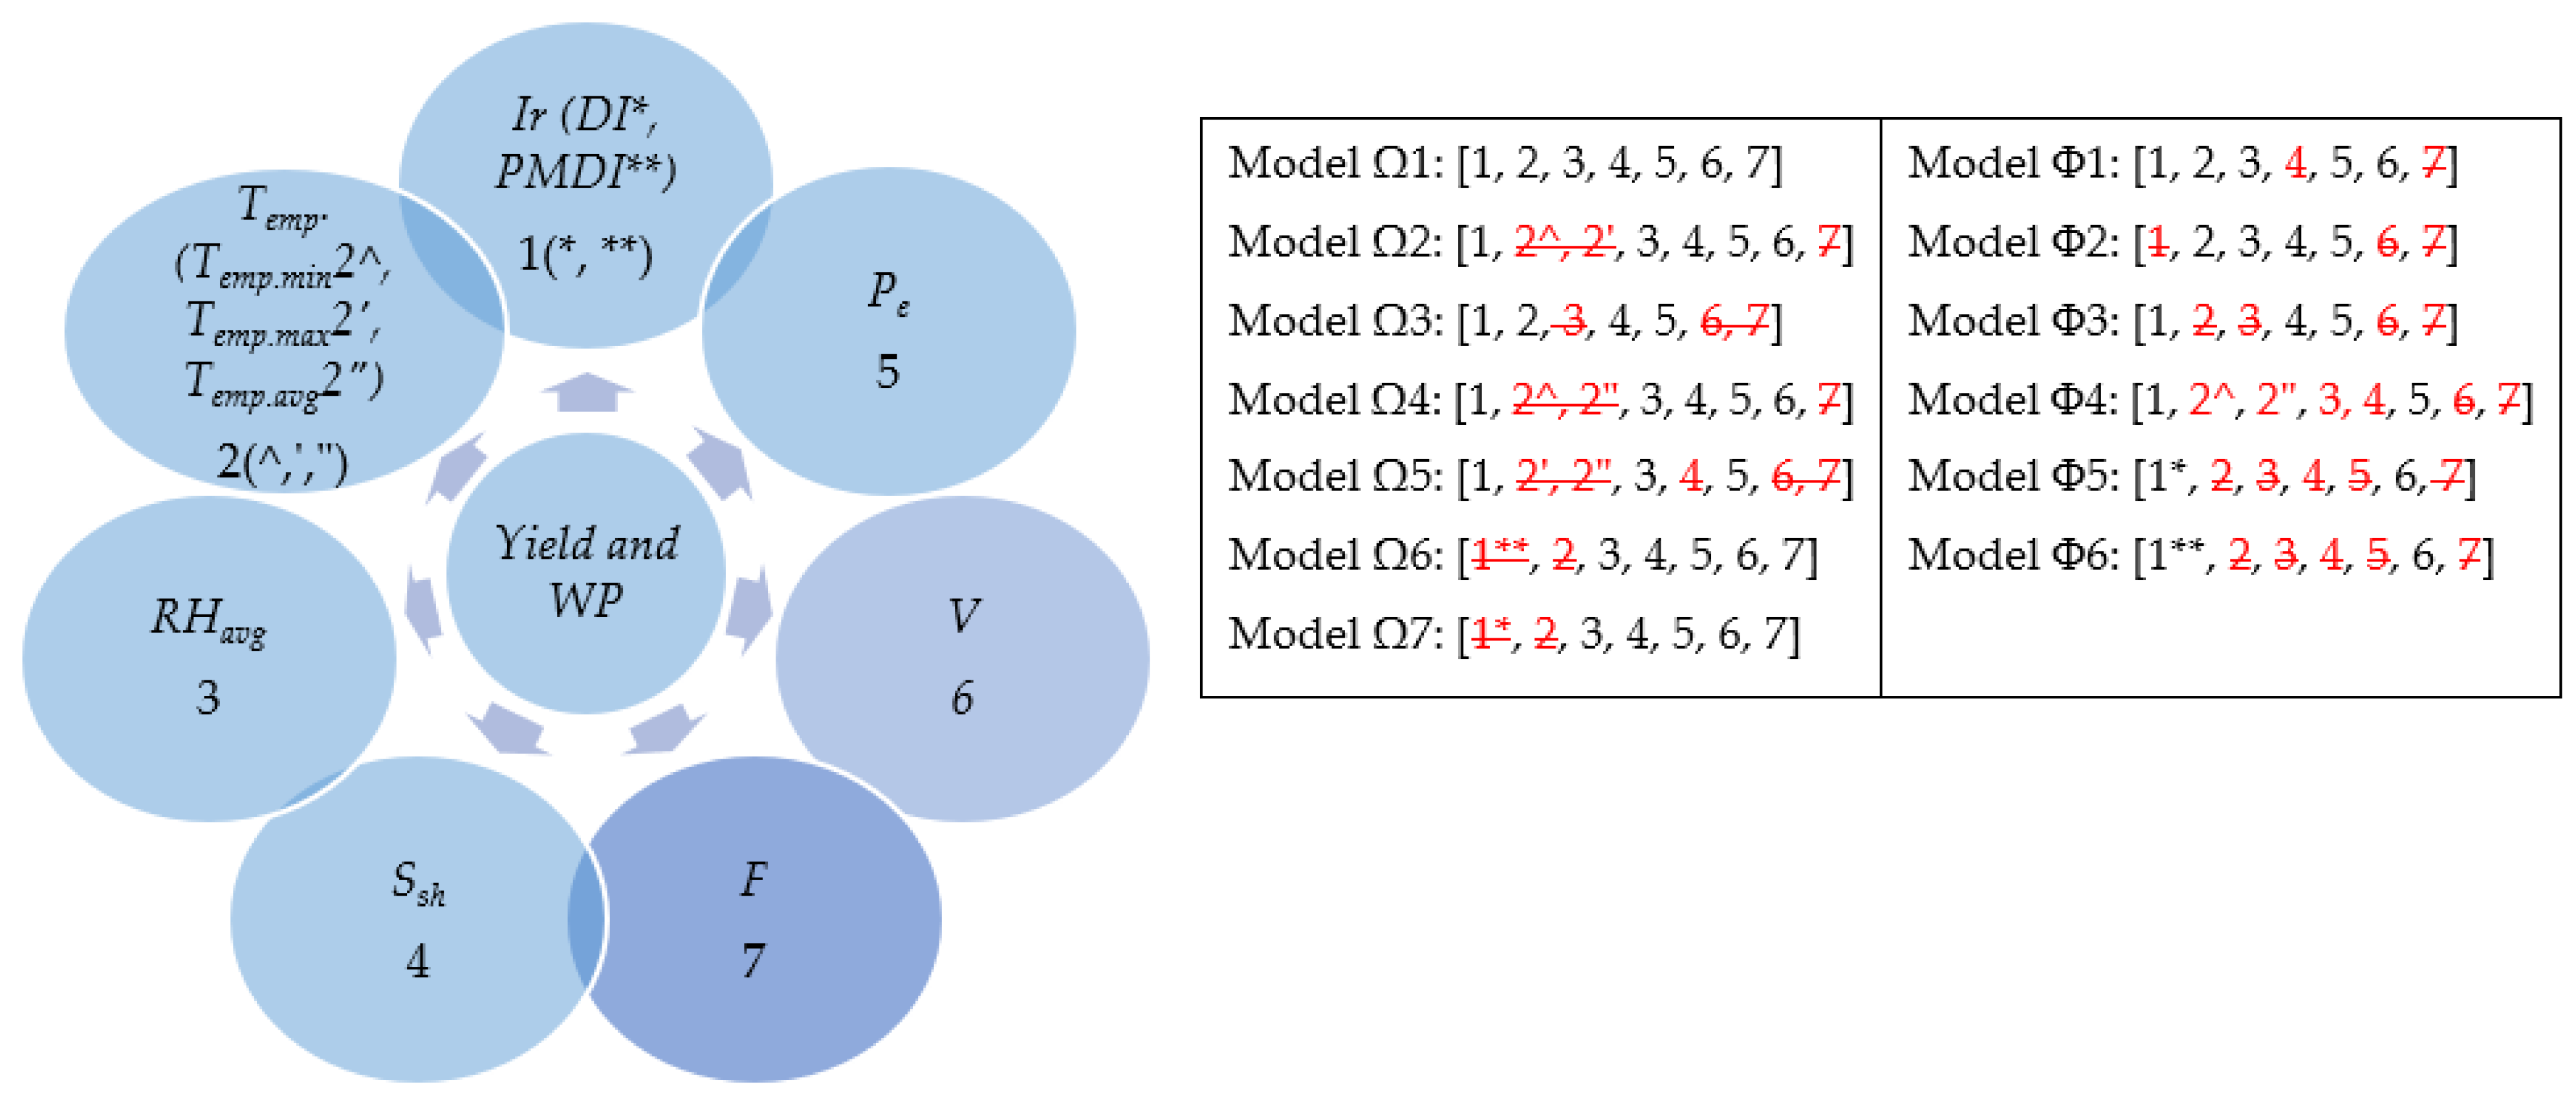
2.6. Input Parameters
2.7. Evaluation Criteria

3. Results
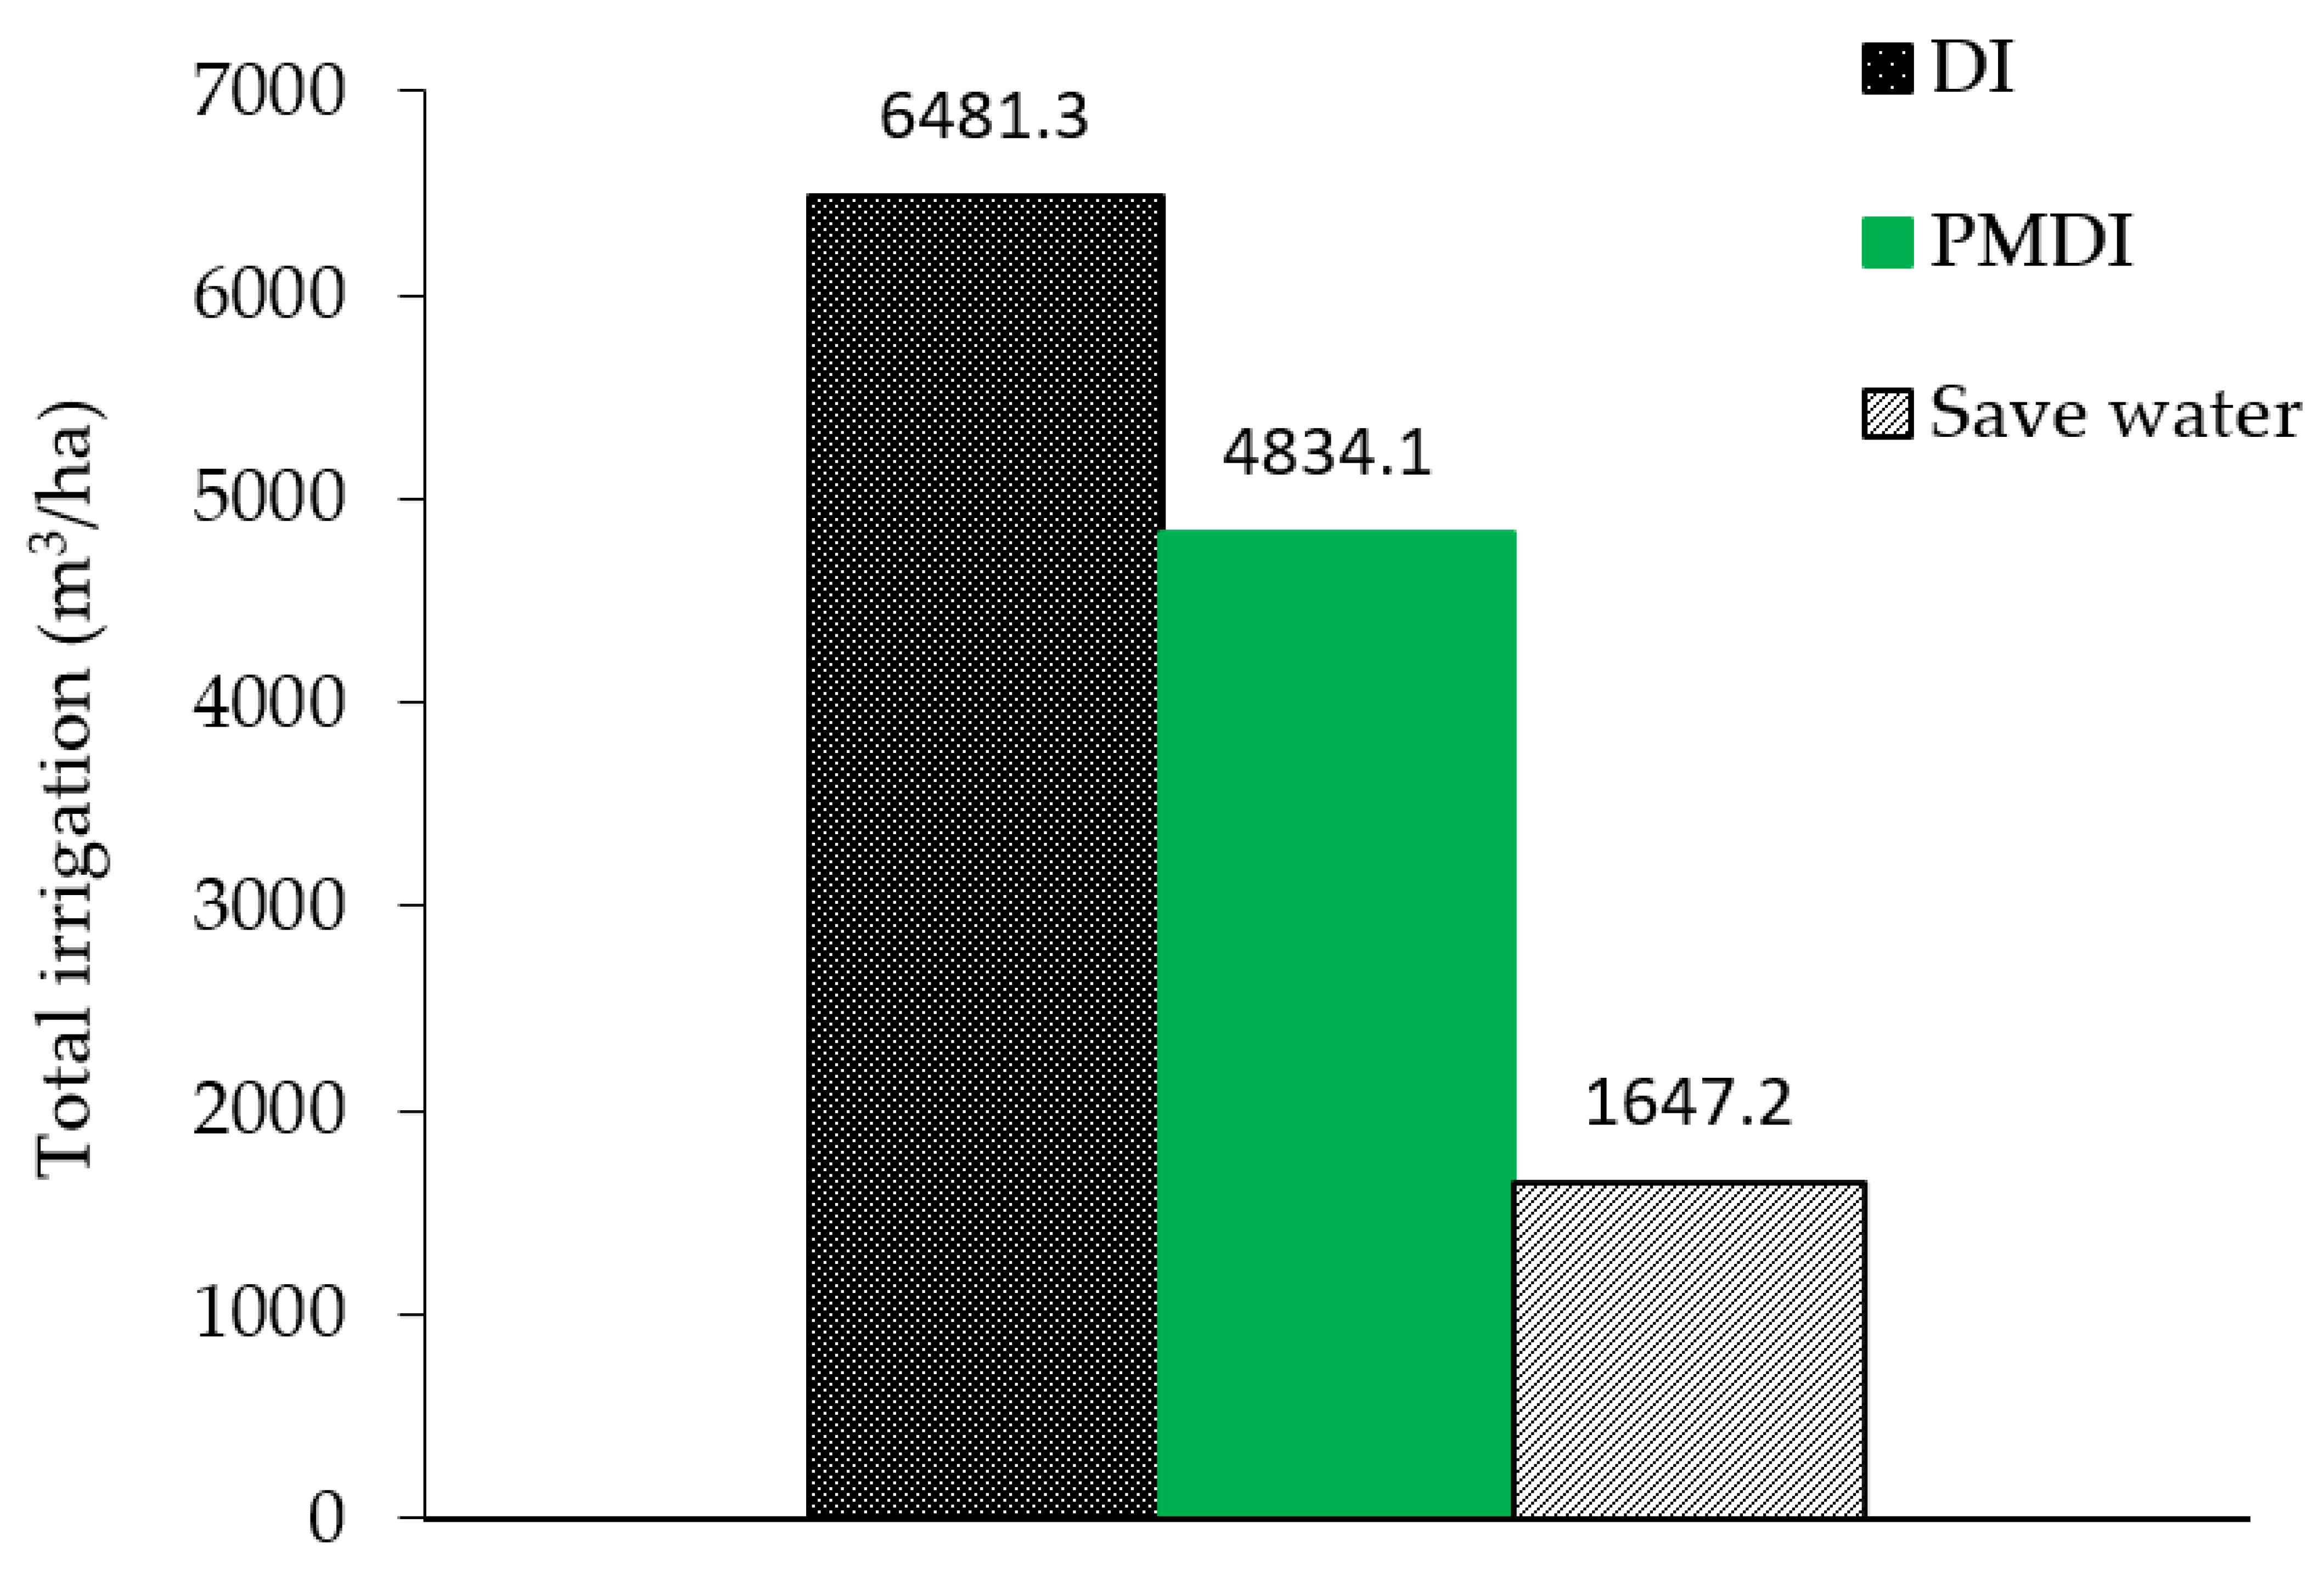
3.1. Field Monitoring
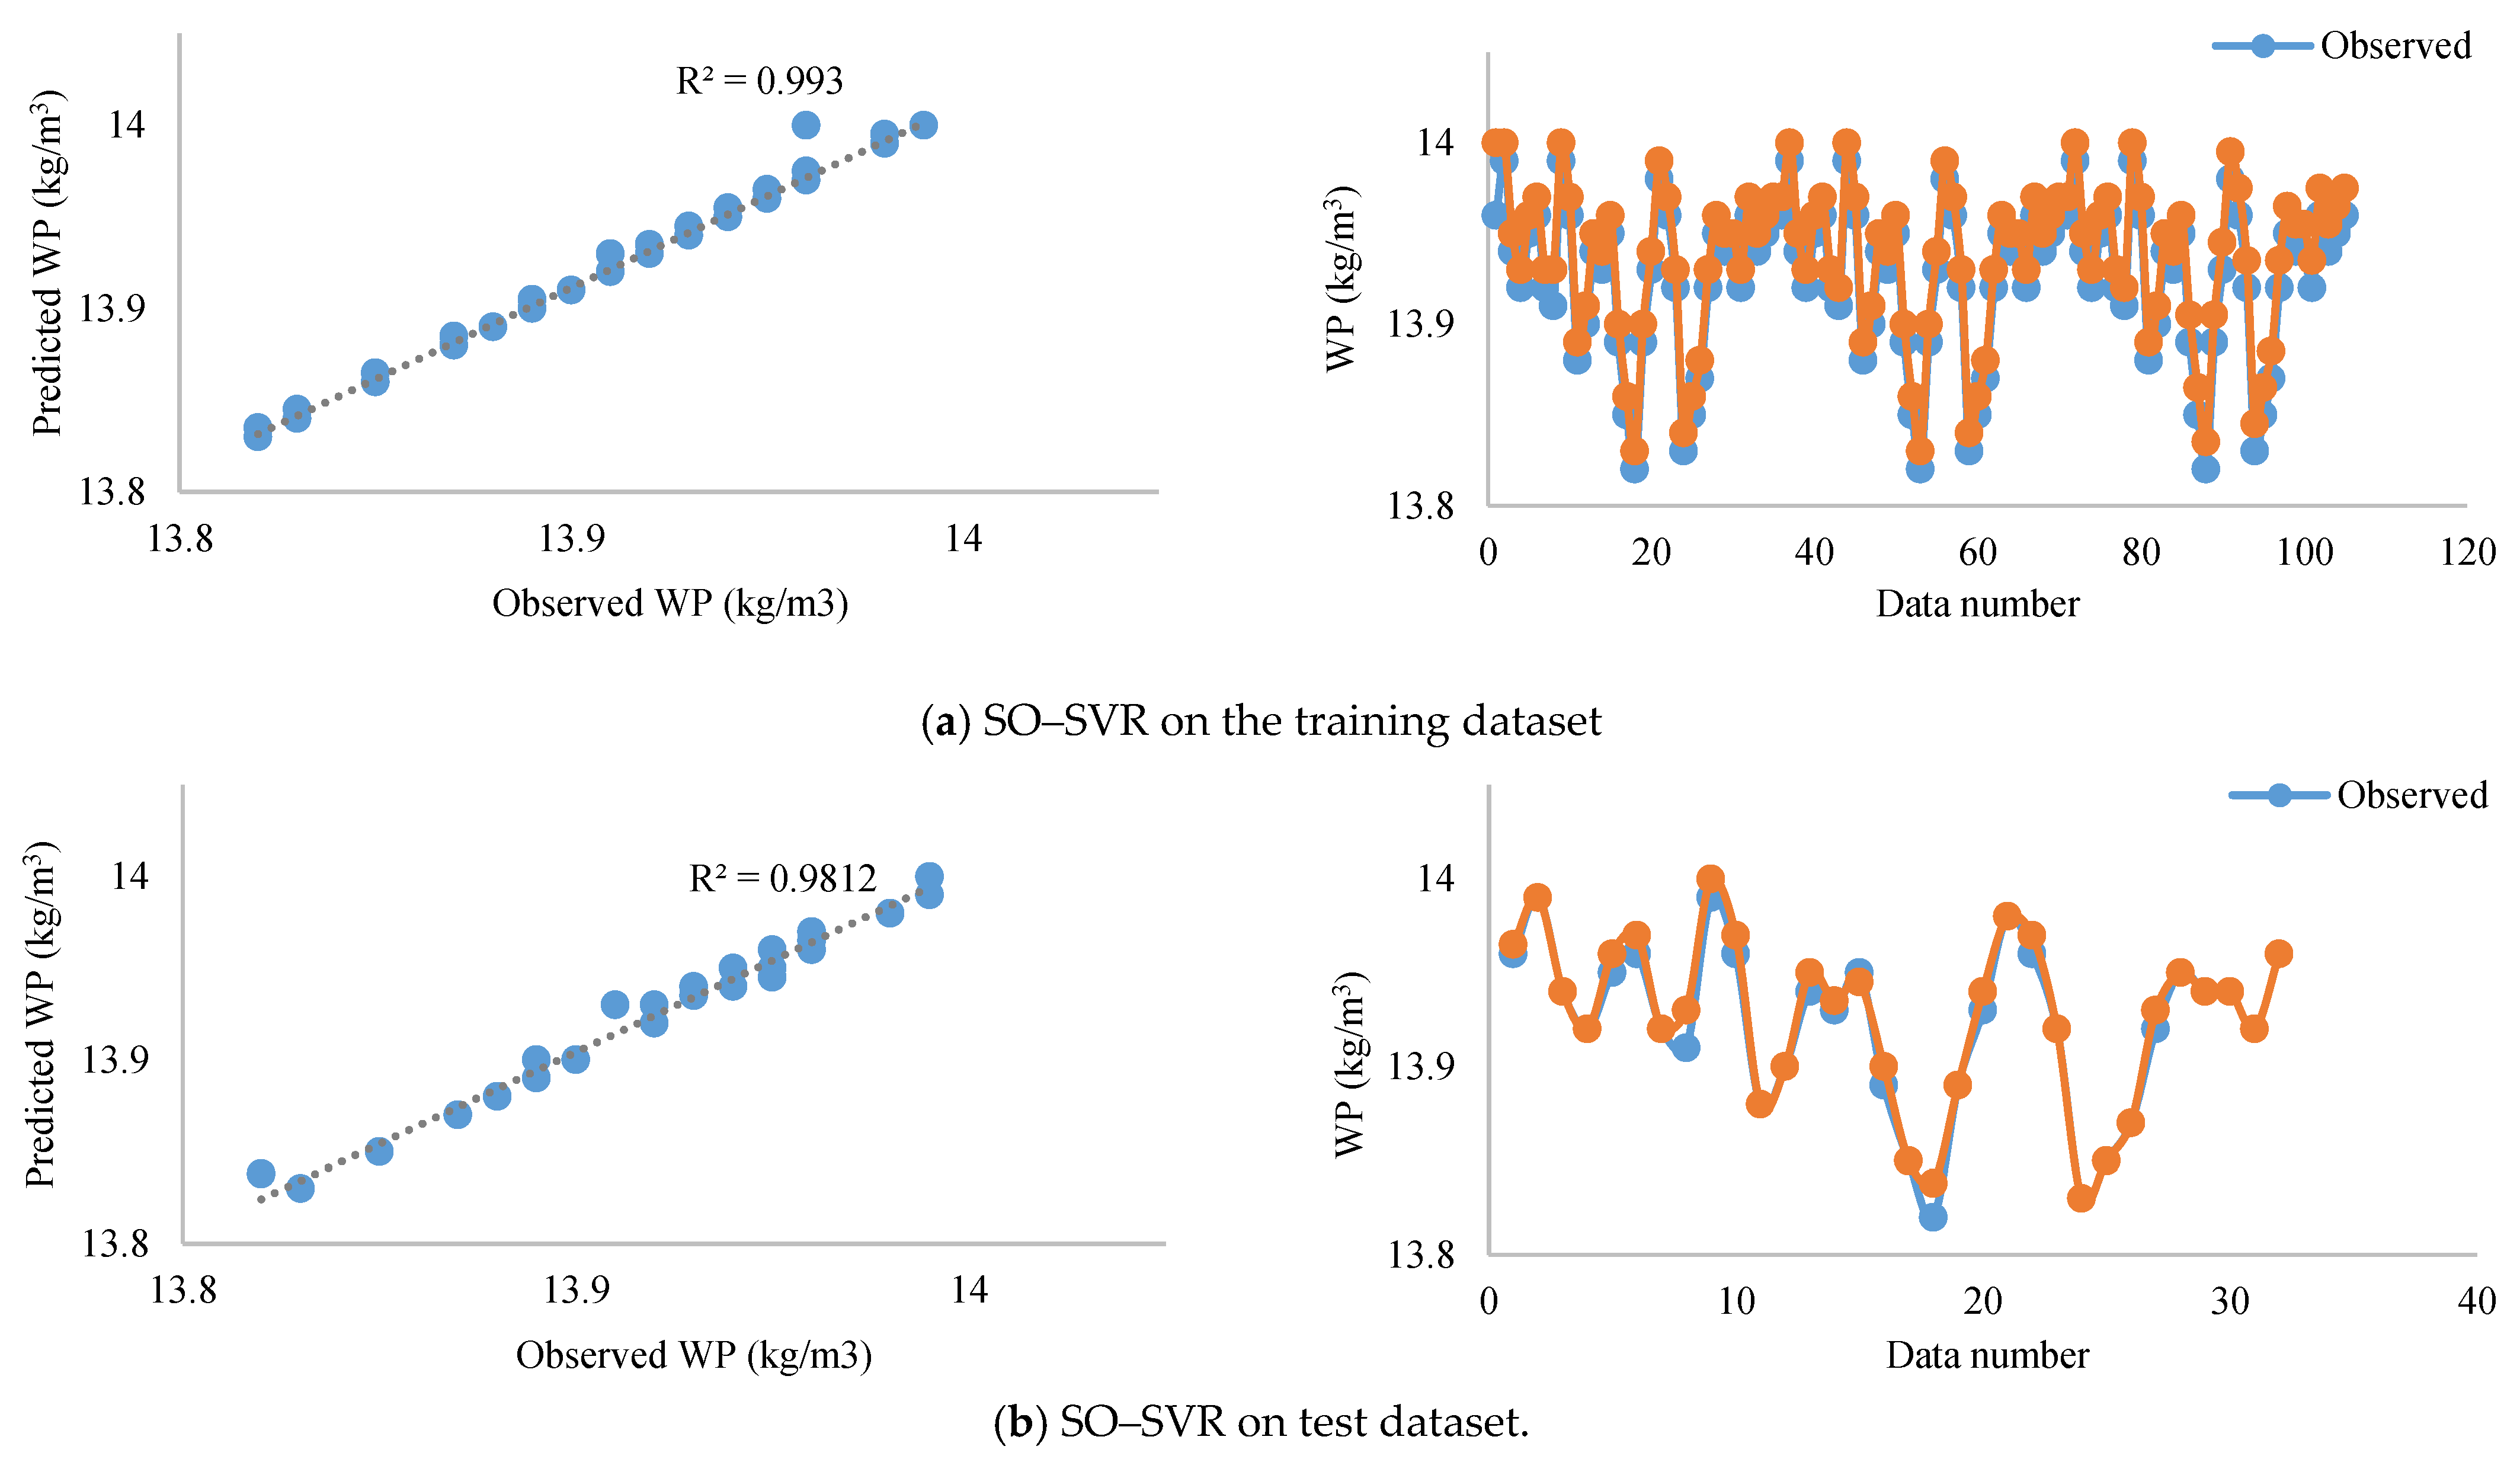
3.2. Modeling Results
3.2.1. Impact of Input Combinations
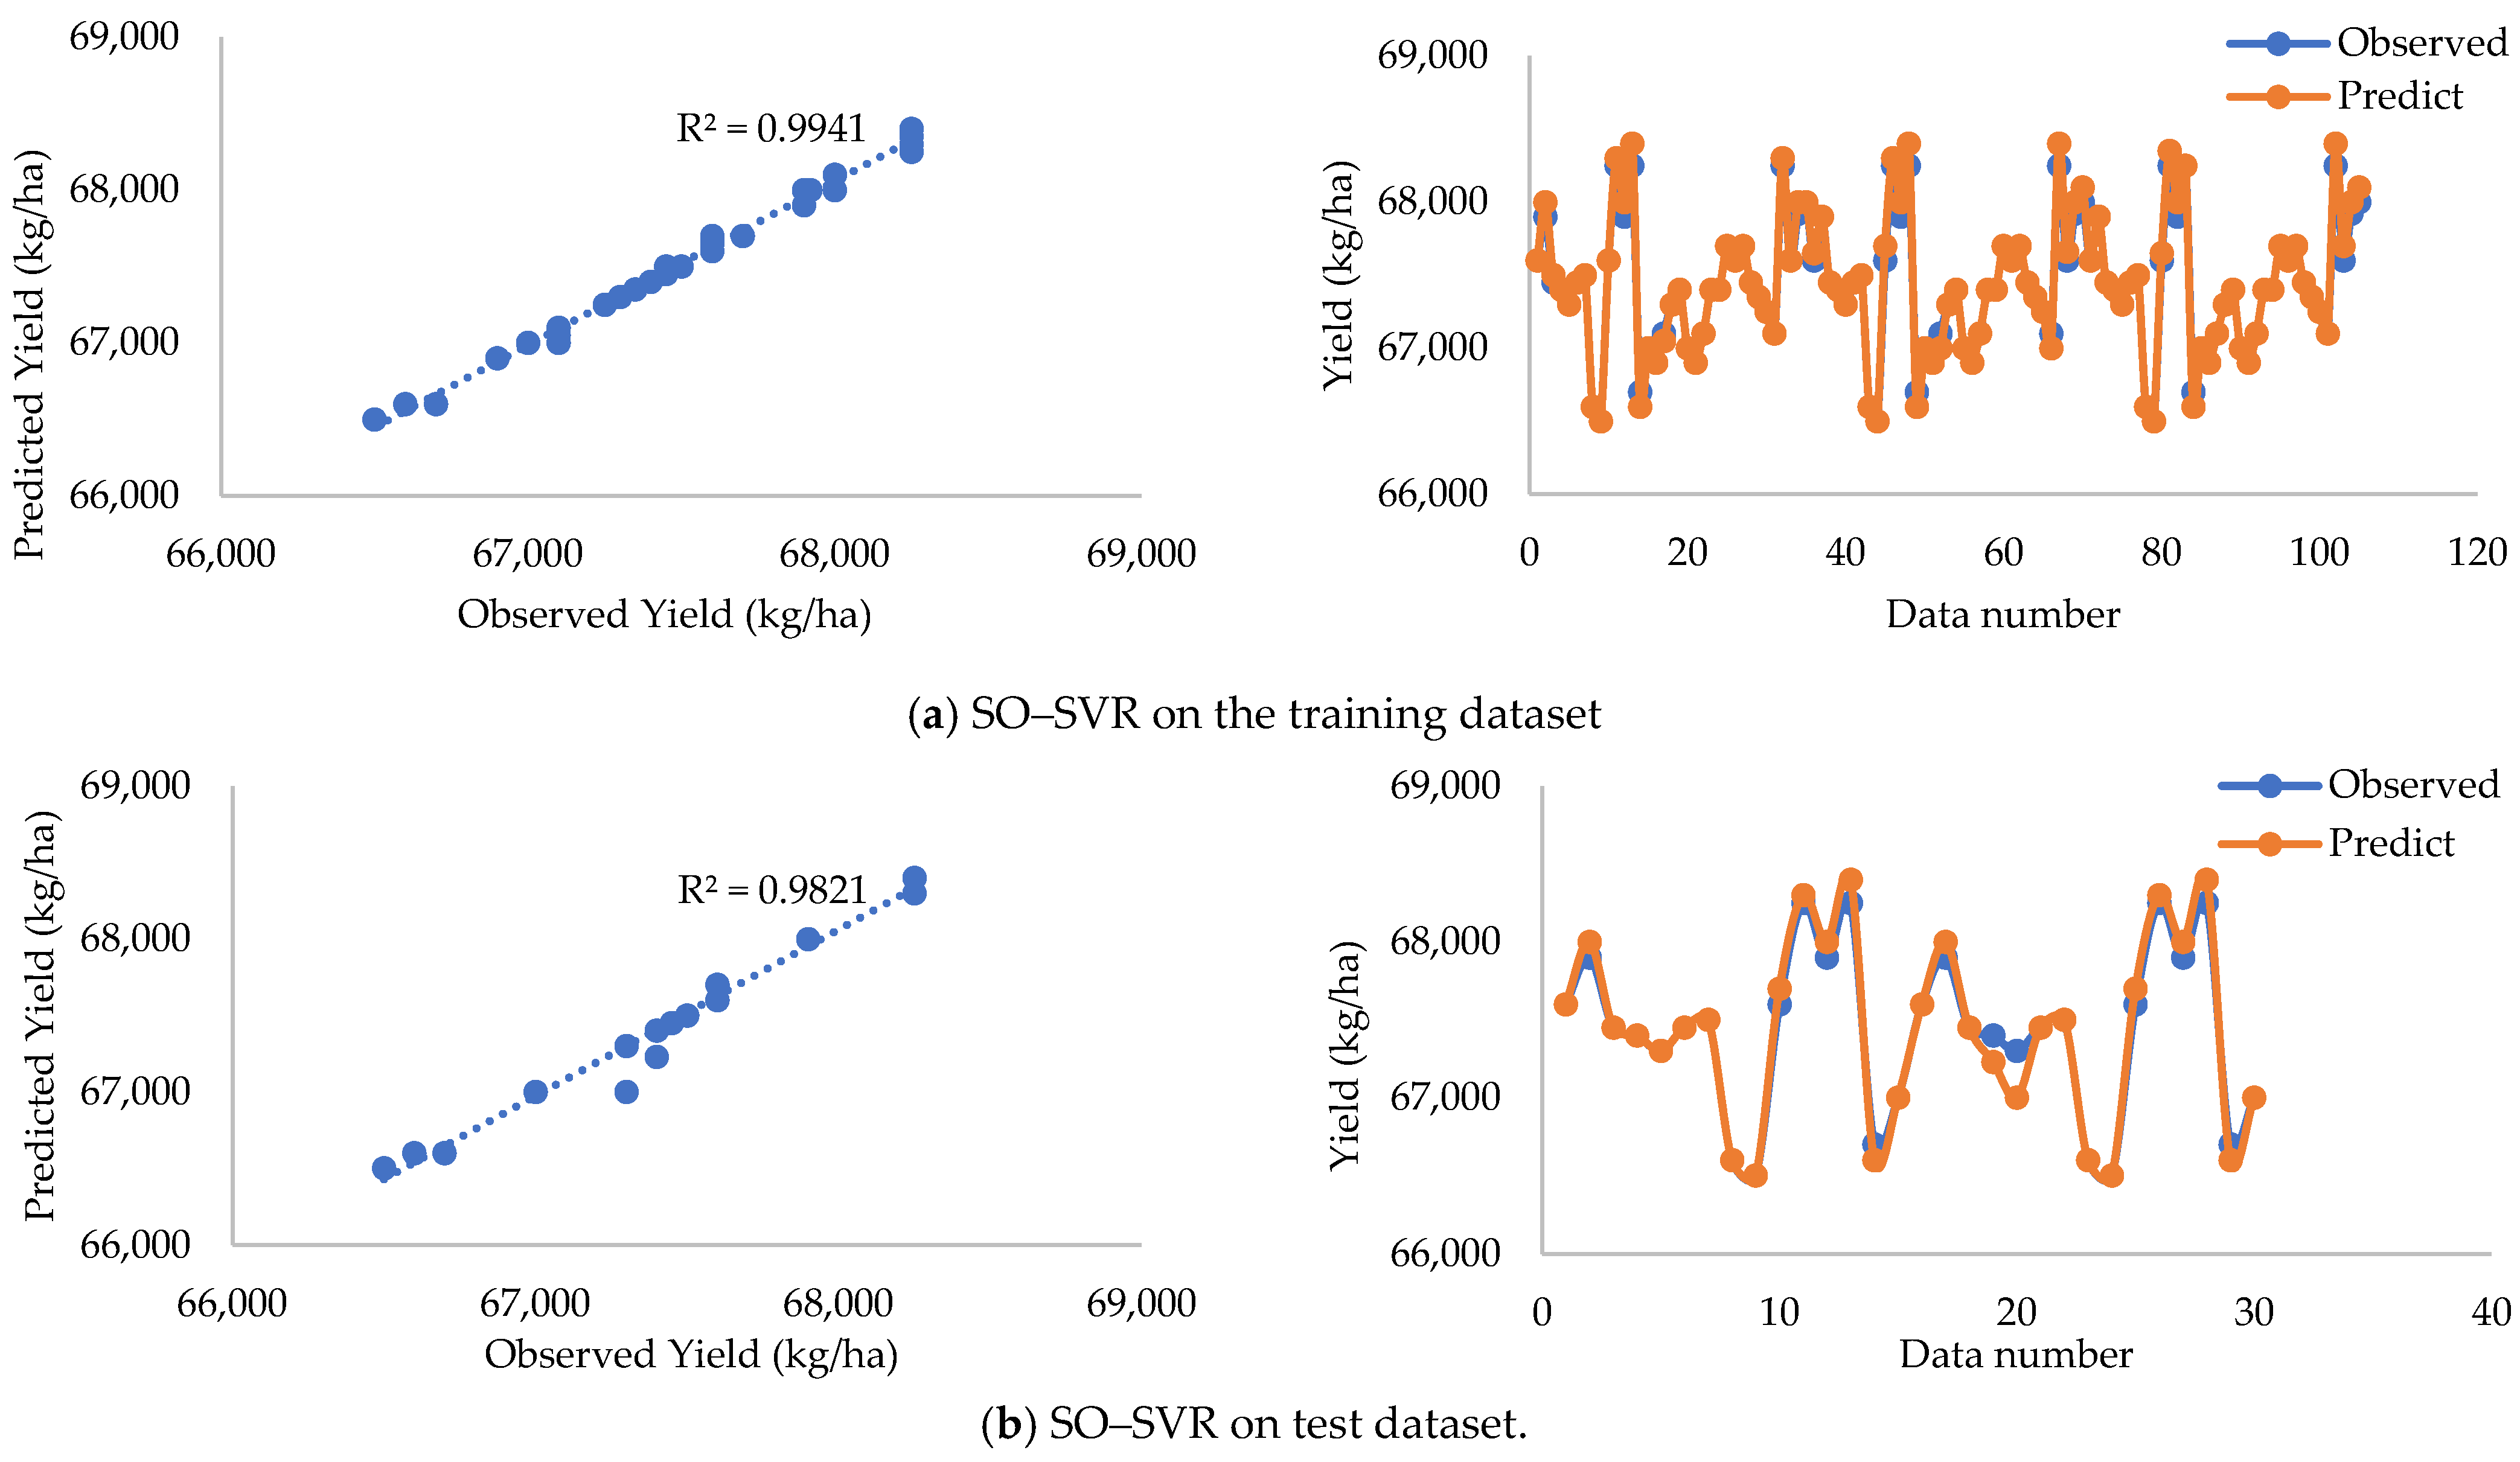
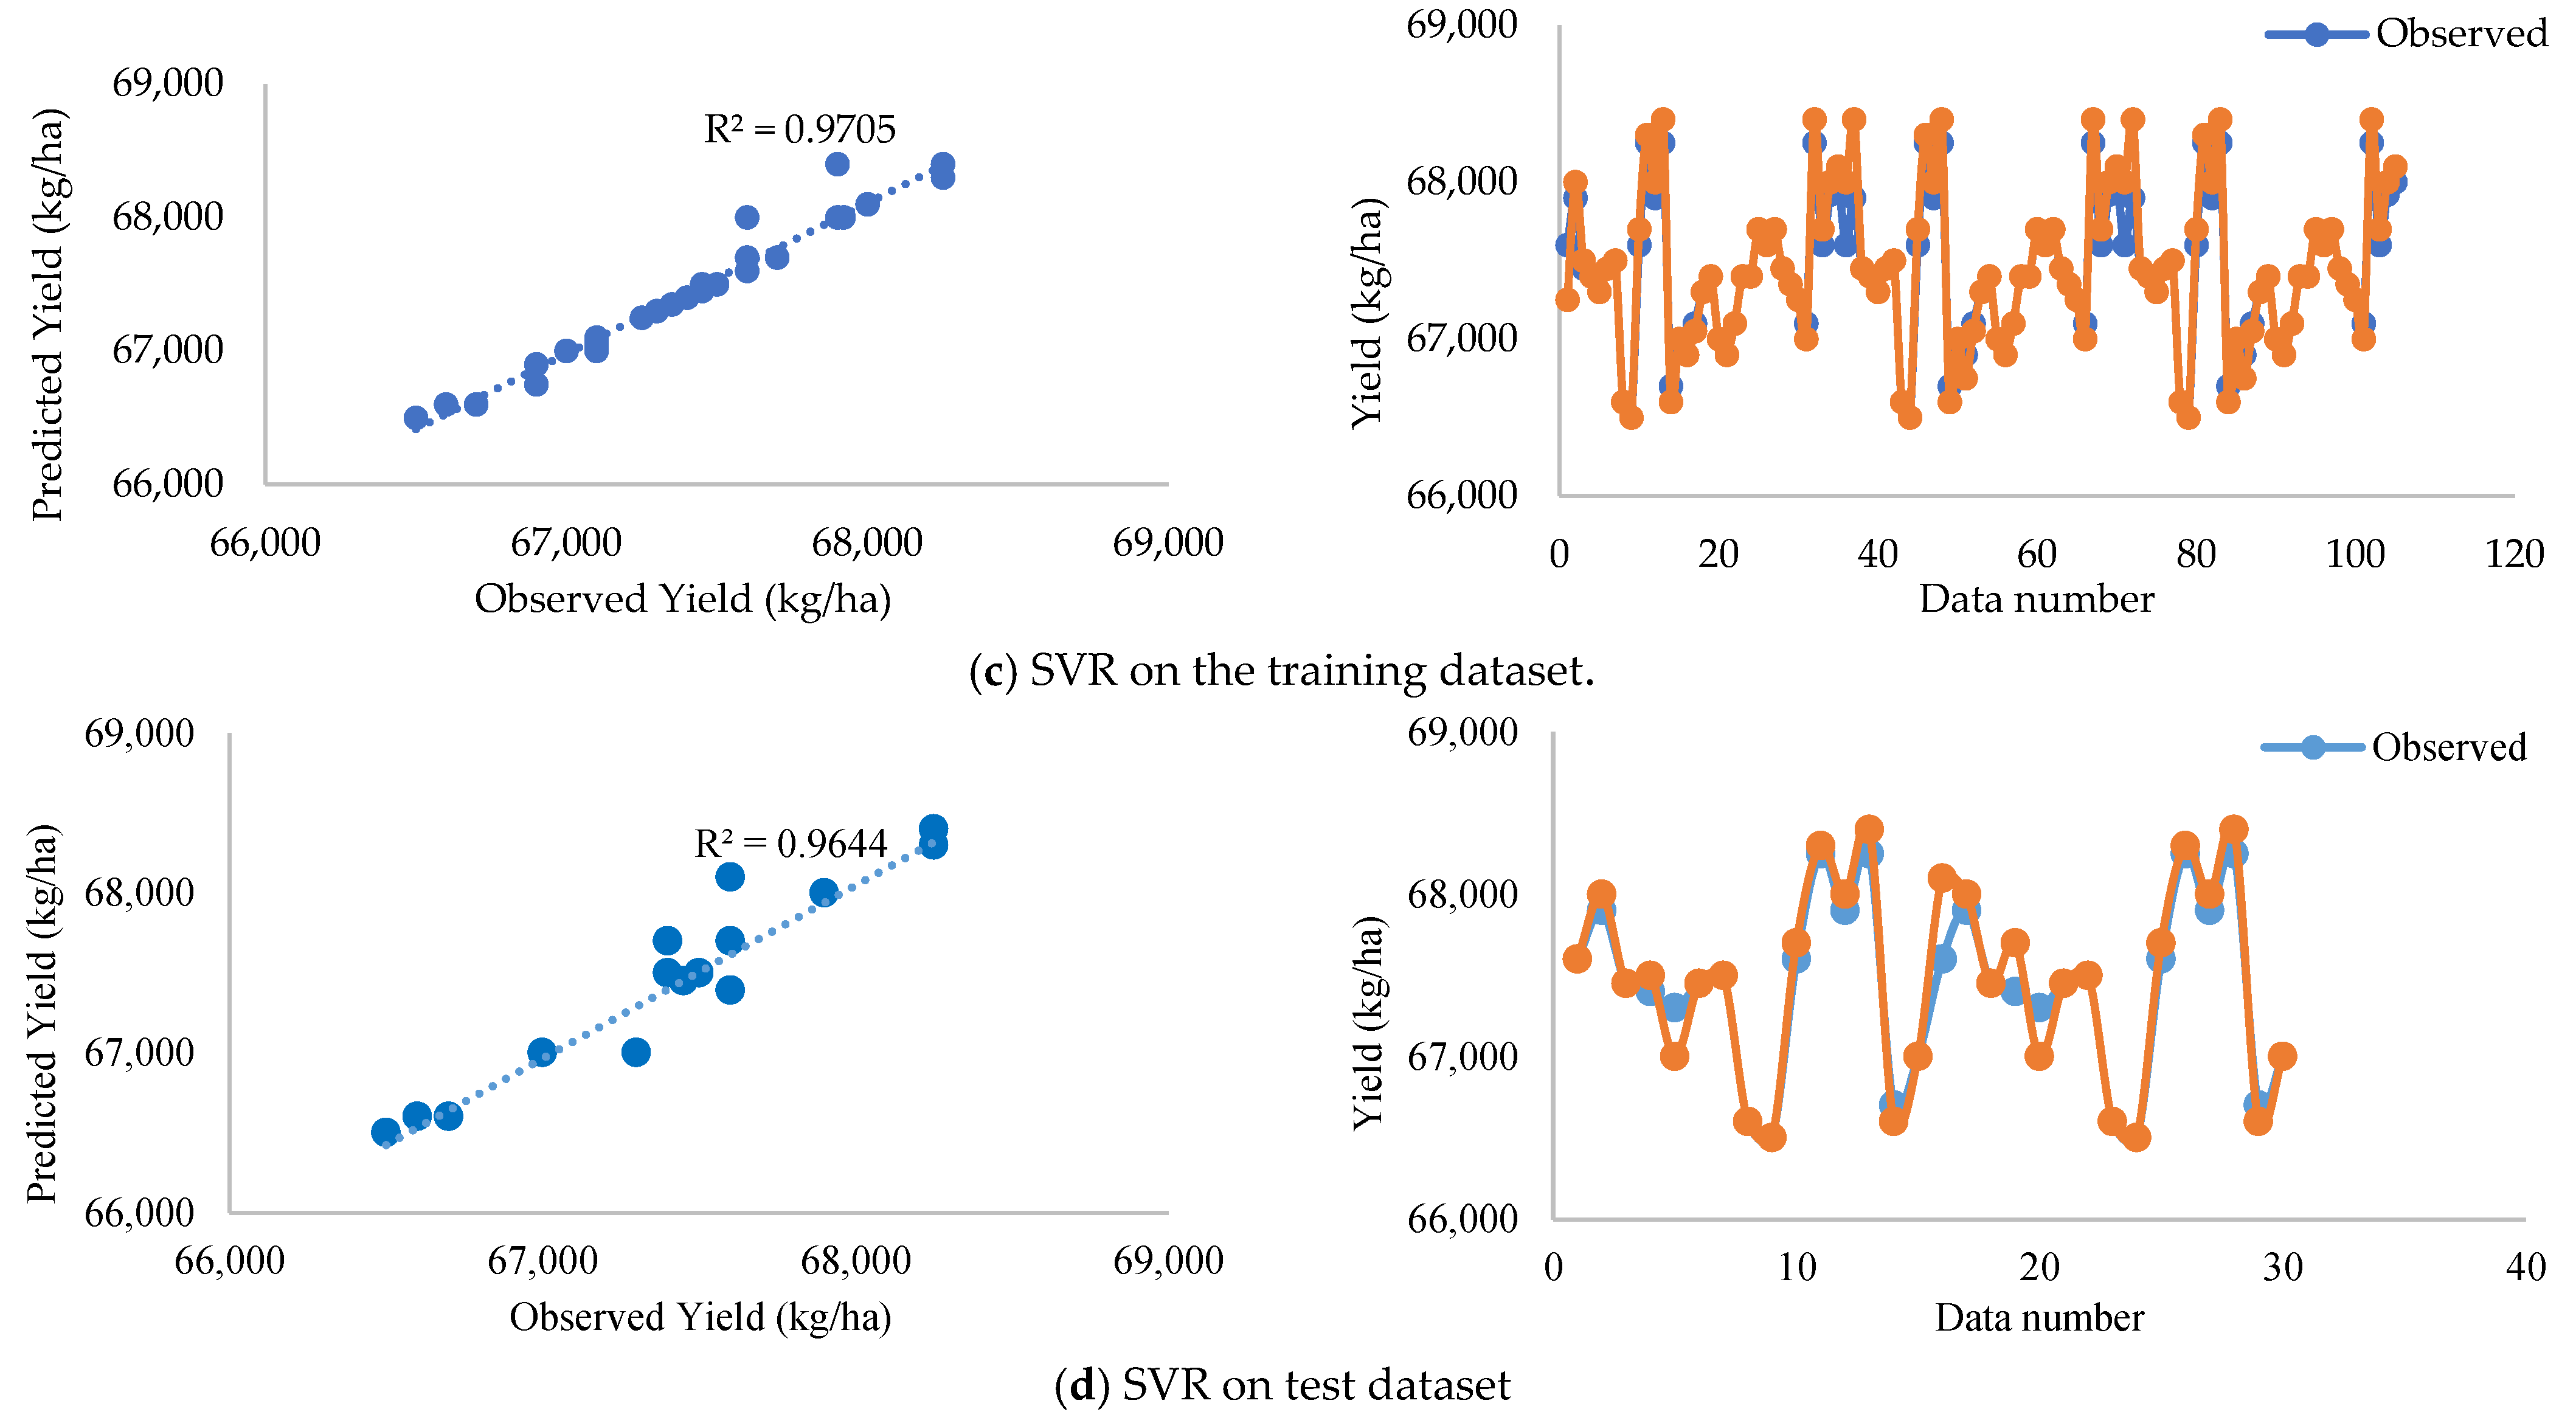
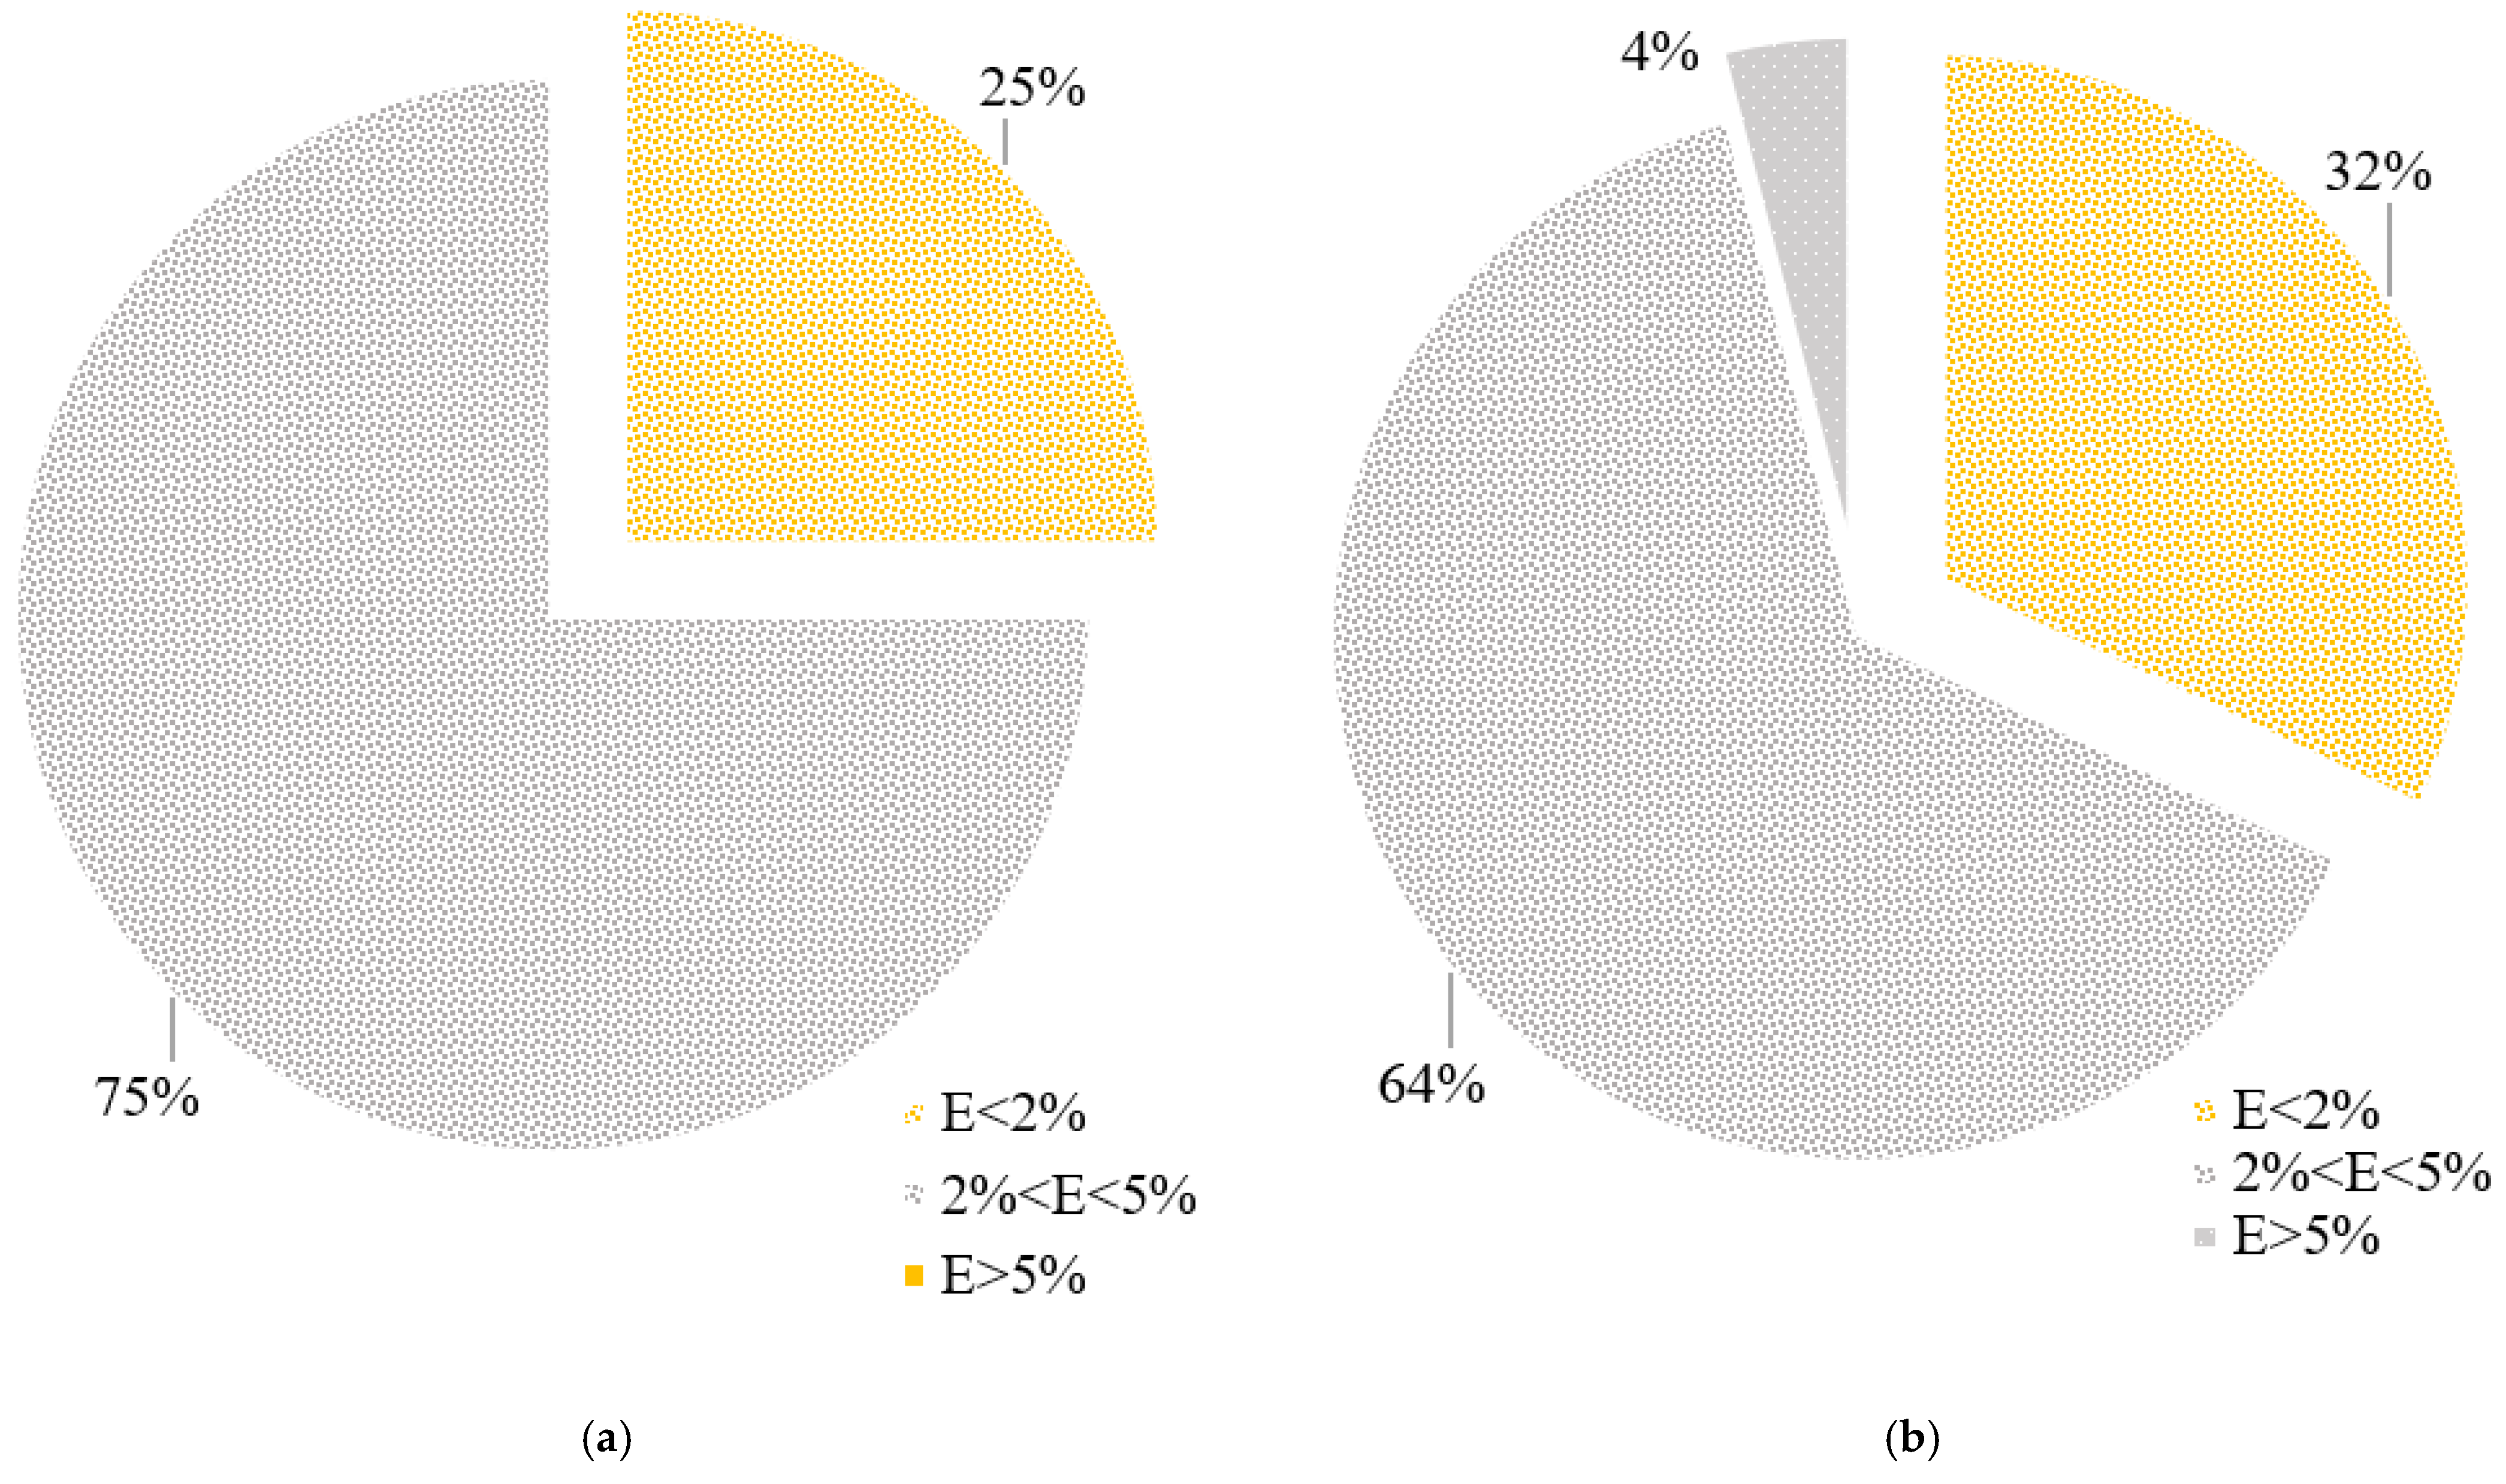
3.2.2. Comparison with Other Methods
4. Conclusions
Author Contributions
Funding
Institutional Review Board Statement
Informed Consent Statement
Data Availability Statement
Acknowledgments
Conflicts of Interest
References
- Emami, S.; Parsa, J.; Emami, H.; Abbaspour, A. An ISaDE Algorithm Combined with Support Vector Regression for Estimating Discharge Coefficient of W-Planform Weirs. Water Supply 2021, 21, 3459–3476. [Google Scholar] [CrossRef]
- Safa, M.; Samarasinghe, S. Determination and Modelling of Energy Consumption in Wheat Production Using Neural networks: “A Case Study in Canterbury Province, New Zealand”. Energy 2011, 36, 5140–5147. [Google Scholar] [CrossRef] [Green Version]
- Trigui, M.; Gabsi, K.; Amri, I.E.; Noureddine, A. International Journal of Food Properties Modular Feed Forward Networks to Predict Sugar Diffusivity from Date Pulp Part I. Model Validation. Int. J. Food Prop. 2011, 14, 37–41. [Google Scholar] [CrossRef]
- Fortin, J.G.; Anctil, F.; Parent, L.É.; Bolinder, M.A. Site-Specific Early Season Potato Yield Forecast by Neural Network in Eastern Canada. Precis. Agric. 2011, 12, 905–923. [Google Scholar] [CrossRef]
- Basso, B.; Cammarano, D.; Carfagna, E. Review of Crop Yield Forecasting Methods and Early Warning Systems. First Meet. Sci. Advis. Comm. Glob. Strateg. Improv. Agric. Rural Stat. 2013, 241, 1–56. [Google Scholar]
- Gonzalez-Sanchez, A.; Frausto-Solis, J.; Ojeda-Bustamante, W. Attribute Selection Impact on Linear and Nonlinear Regression Models for Crop Yield Prediction. Sci. World J. 2014, 2014, 509429. [Google Scholar] [CrossRef] [PubMed]
- Gupta, D.K.; Kumar, P.; Mishra, V.N.; Prasad, R.; Dikshit, P.K.S.; Dwivedi, S.B.; Ohri, A.; Singh, R.S.; Srivastava, V. Bistatic Measurements for the Estimation of Rice Crop Variables Using Artificial Neural Network. Adv. Space Res. 2015, 55, 1613–1623. [Google Scholar] [CrossRef]
- Bocca, F.F.; Rodrigues, L.H.A. The Effect of Tuning, Feature Engineering, and Feature Selection in Data Mining Applied to Rainfed Sugarcane Yield Modelling. Comput. Electron. Agric. 2016, 128, 67–76. [Google Scholar] [CrossRef]
- Ravichandran, G.; Koteeshwari, R.S. Agricultural Crop Predictor and Advisor Using ANN for Smartphones. In Proceedings of the 2016 International Conference on Emerging Trends in Engineering, Technology and Science (ICETETS), Pudukkottai, India, 24–26 February 2016; pp. 2–7. [Google Scholar] [CrossRef]
- Gandhi, N.; Petkar, O.; Armstrong, L.J. Rice Crop Yield Prediction Using Artificial Neural Networks. In Proceedings of the 2016 IEEE Technological Innovations in ICT for Agriculture and Rural Development (TIAR), Chennai, India, 15–16 July 2016; pp. 105–110. [Google Scholar] [CrossRef]
- Merdun, H.; Çinar, Ö.; Meral, R.; Apan, M. Comparison of Artificial Neural Network and Regression Pedotransfer Functions for Prediction of Soil Water Retention and Saturated Hydraulic Conductivity. Soil Tillage Res. 2006, 90, 108–116. [Google Scholar] [CrossRef]
- Mubiru, J. Predicting Total Solar Irradiation Values Using Artificial Neural Networks. Renew. Energy 2008, 33, 2329–2332. [Google Scholar] [CrossRef]
- Piri, J.; Amin, S.; Moghaddamnia, A.; Keshavarz, A.; Han, D.; Remesan, R. Daily Pan Evaporation Modeling in a Hot and Dry Climate. J. Hydrol. Eng. 2009, 14, 803–811. [Google Scholar] [CrossRef]
- Xing, L.; Li, L.; Gong, J.; Ren, C.; Liu, J.; Chen, H. Daily Soil Temperatures Predictions for Various Climates in United States Using Data-Driven Model. Energy 2018, 160, 430–440. [Google Scholar] [CrossRef]
- Maya Gopal, P.S.; Bhargavi, R. A Novel Approach for Efficient Crop Yield Prediction. Comput. Electron. Agric. 2019, 165, 104968. [Google Scholar] [CrossRef]
- Yari, R.; Darzi-Naftchali, A.; Dehghanisanij, H.; Qi, Z. Effect of Meteorological Data Quality Control and Data Adjustment on the Reference Evapotranspiration: A Case Study in Jafariye, Iran. Theor. Appl. Climatol. 2020, 141, 331–342. [Google Scholar] [CrossRef]
- Liu, S.; Wang, X.; Liu, M.; Zhu, J. Towards Better Analysis of Machine Learning Models: A Visual Analytics Perspective. Vis. Inform. 2017, 1, 48–56. [Google Scholar] [CrossRef]
- Haghverdi, A.; Washington-Allen, R.A.; Leib, B.G. Prediction of Cotton Lint Yield from Phenology of Crop Indices Using Artificial Neural Networks. Comput. Electron. Agric. 2018, 152, 186–197. [Google Scholar] [CrossRef]
- Hund, L.; Schroeder, B.; Rumsey, K.; Huerta, G. Distinguishing between Model- and Data-Driven Inferences for High Reliability Statistical Predictions. Reliab. Eng. Syst. Saf. 2018, 180, 201–210. [Google Scholar] [CrossRef]
- Akbar, A.; Kuanar, A.; Patnaik, J.; Mishra, A.; Nayak, S. Application of Artificial Neural Network Modeling for Optimization and Prediction of Essential Oil Yield in Turmeric (Curcuma Longa L.). Comput. Electron. Agric. 2018, 148, 160–178. [Google Scholar] [CrossRef]
- Matsumura, K.; Gaitan, C.F.; Sugimoto, K.; Cannon, A.J.; Hsieh, W.W. Maize Yield Forecasting by Linear Regression and Artificial Neural Networks in Jilin, China. J. Agric. Sci. 2015, 153, 399–410. [Google Scholar] [CrossRef]
- Dehghanisanij, H.; Naseri, A.; Anyoji, H.; Eneji, A.E. Effects of Deficit Irrigation and Fertilizer Use on Vegetative Growth of Drip Irrigated Cherry Trees. J. Plant Nutr. 2007, 30, 411–425. [Google Scholar] [CrossRef]
- Ji, B.; Sun, Y.; Yang, S.; Wan, J. Artificial Neural Network Model for Rice Yield Prediction in Mountainous Regions. J. Agric. Sci. 2007, 145, 249–261. [Google Scholar] [CrossRef]
- Higashide, T. Prediction of Tomato Yield on the Basis of Solar Radiation before Anthesis under Warm Greenhouse Conditions. HortScience 2009, 44, 1874–1878. [Google Scholar] [CrossRef] [Green Version]
- Alvarez, R. Predicting Average Regional Yield and Production of Wheat in the Argentine Pampas by an Artificial Neural Network Approach. Eur. J. Agron. 2009, 30, 70–77. [Google Scholar] [CrossRef]
- Norouzi, M.; Ayoubi, S.; Jalalian, A.; Khademi, H.; Dehghani, A.A. Predicting Rainfed Wheat Quality and Quantity by Artificial Neural Network Using Terrain and Soil Characteristics. Acta Agric. Scand. Sect. B Soil Plant Sci. 2010, 60, 341–352. [Google Scholar] [CrossRef]
- Anitha, P.; Chakravarthy, T. Agricultural Crop Yield Prediction Using Artificial Neural Network with Feed Forward Algorithm. Int. J. Comput. Sci. Eng. 2018, 6, 178–181. [Google Scholar] [CrossRef]
- Lin, D.; Wei, R.; Xu, L. An Integrated Yield Prediction Model for Greenhouse Tomato. Agronomy 2019, 9, 873. [Google Scholar] [CrossRef] [Green Version]
- Abrougui, K.; Gabsi, K.; Mercatoris, B.; Khemis, C.; Amami, R.; Chehaibi, S. Prediction of Organic Potato Yield Using Tillage Systems and Soil Properties by Artificial Neural Network (ANN) and Multiple Linear Regressions (MLR). Soil Tillage Res. 2019, 190, 202–208. [Google Scholar] [CrossRef]
- Dehghanisanij, H.; Kouhi, N. Interactive Effects of Nitrogen and Drip Irrigation Rates on Root Development of Corn (Zea Mays L.) and Residual Soil Moisture. Gesunde Pflanz. 2020, 72, 335–349. [Google Scholar] [CrossRef]
- Jeevan Nagendra Kumar, Y.; Spandana, V.; Vaishnavi, V.S.; Neha, K.; Devi, V.G.R.R. Supervised Machine Learning Approach for Crop Yield Prediction in Agriculture Sector. In Proceedings of the 2020 5th International Conference on Communication and Electronics Systems (ICCES), Coimbatore, India, 10–12 June 2020; pp. 736–741. [Google Scholar] [CrossRef]
- Rodrigues, M.Â.; Torres, L.d.N.D.; Damo, L.; Raimundo, S.; Sartor, L.; Cassol, L.C.; Arrobas, M. Nitrogen Use Efficiency and Crop Yield in Four Successive Crops Following Application of Biochar and Zeolites. J. Soil Sci. Plant Nutr. 2021, 21, 1053–1065. [Google Scholar] [CrossRef]
- Emami, H. Seasons Optimization Algorithm. Eng. Comput. 2020. [Google Scholar] [CrossRef]
- Drucker, H.; Surges, C.J.C.; Kaufman, L.; Smola, A.; Vapnik, V. Support Vector Regression Machines. Adv. Neural Inf. Process. Syst. 1997, 9, 155–161. [Google Scholar]
- Hamzeh, A.; Parsaie, A.; Ememgholizadeh, S. Prediction of Discharge Coefficient of Triangular Labyrinth Weirs Using Adaptive Neuro Fuzzy Inference System. Alex. Eng. J. 2017, 57, 1773–1782. [Google Scholar] [CrossRef]
- Akhavan, S.; Moosavi, S.F.; Mostafazadehfard, B.; Ghadamifiroozabadi, A. Investigation of Yield and Water Use Efficiency of Potato with Tape and Furrow Irrigation. J. Water Soil Sci. 2007, 11, 15–27. [Google Scholar]
- Yuan, B.Z.; Nishiyama, S.; Kang, Y. Effects of Different Irrigation Regimes on the Growth and Yield of Drip-Irrigated Potato. Agric. Water Manag. 2003, 63, 153–167. [Google Scholar] [CrossRef]
- Wang, F.X.; Feng, S.Y.; Hou, X.Y.; Kang, S.Z.; Han, J.J. Potato Growth with and without Plastic Mulch in Two Typical Regions of Northern China. Field Crop. Res. 2009, 110, 123–129. [Google Scholar] [CrossRef]
- Qin, S.; Zhang, J.; Dai, H.; Wang, D.; Li, D. Effect of Ridge-Furrow and Plastic-Mulching Planting Patterns on Yield Formation and Water Movement of Potato in a Semi-Arid Area. Agric. Water Manag. 2014, 31, 87–94. [Google Scholar] [CrossRef]
- Hou, X.Y.; Wang, F.X.; Han, J.J.; Kang, S.Z.; Feng, S.Y. Duration of Plastic Mulch for Potato Growth under Drip Irrigation in an Arid Region of Northwest China. Agric. For. Meteorol. 2010, 150, 115–121. [Google Scholar] [CrossRef]
- Sadras, V.O.; Calviño, P.A. Quantification of Grain Yield Response to Soil Depth in Soybean, Maize, Sunflower, and Wheat. Agron. J. 2001, 93, 577–583. [Google Scholar] [CrossRef]
- Kaul, M.; Hill, R.L.; Walthall, C. Artificial Neural Networks for Corn and Soybean Yield Prediction. Agric. Syst. 2005, 85, 1–18. [Google Scholar] [CrossRef]
- Montazer, A.; Azadeghan, B.; Shahraki, M. Assessing the Efficiency of Artificial Neural Network Models to Predict Wheat Yield and Water Productivity Based on Climatic Data and Seasonal Water-Nitrogen Variables. Iran. Water Res. J. 2010, 3, 17–29. [Google Scholar]
- Hosseini, S.M.T.; Siosemardeh, A.; Fathi, P.; Siosemardeh, M. Application of Artificial Neural Networks and Multivariate Regression in Estimating Dryland Wheat Yield in Qorveh Region of Kurdistan Province. Agric. Res. 2007, 7, 41–54. [Google Scholar]
- Sharifi, A. Yield Prediction with Machine Learning Algorithms and Satellite Images. J. Sci. Food Agric. 2021, 101, 891–896. [Google Scholar] [CrossRef] [PubMed]
- Prasad, N.R.; Patel, N.R.; Danodia, A. Crop Yield Prediction in Cotton for Regional Level Using Random Forest Approach. Spat. Inf. Res. 2021, 29, 195–206. [Google Scholar] [CrossRef]


| ρb (gr/cm3) | PWP (cm3/cm3) | FC (cm3/cm3) | OC (%) | TNV (%) | θs | pH | Texture | EC (dS/m) | Silt | Sand | Clay | Depth (cm) |
|---|---|---|---|---|---|---|---|---|---|---|---|---|
| 1.3 | 0.098 | 0.303 | 1.24 | 11.7 | 33 | 8.02 | Loam | 1.212 | 47 | 33 | 20 | 0–30 |
| Area (ha) | Cultivation Pattern | Variety | Date of Planting | N (%) | P (ppm) | K (ppm) | N (Kg/ha) | P (Kg/ha) | K (Kg/ha) |
|---|---|---|---|---|---|---|---|---|---|
| 1 | tomato | Monaco | 2021/05/05 | 0.1 | 24.2 | 287 | 50 | 125 | 150 |
| Fertilizer | Amount | Date |
|---|---|---|
| Triple superphosphate | 100 kg | 12 May 2021 |
| Ammonium sulfate | 100 kg | 12 May 2021 |
| Potassium sulfate | 175 kg | 12 May 2021 |
| Urea | 50 kg | 12 May 2021 |
| Agricultural sulfur | 125 kg | 12 May 2021 |
| Parameter | Definition | Minimum | Maximum | Average | STDEV |
|---|---|---|---|---|---|
| Ir (DI, PMDI) | Water consumption (mm) | 483.41 | 648.13 | 540.25 | 13.19 |
| Temp.min | Minimum temperature (°C) | 8.20 | 23.6 | 15.79 | 0.76 |
| Temp.max | Maximum temperature (°C) | 40.40 | 20.40 | 32.68 | 0.77 |
| Temp.avg | Average temperature (°C) | 15.79 | 32.68 | 26.23 | 1.02 |
| RHavg | Average relative humidity (%) | 19.80 | 61.00 | 32.28 | 1.26 |
| Ssh | Sunshine hours (J/m2) | 0.00 | 8.60 | 4.61 | 0.46 |
| Pe | Rainfall (mm) | 0.00 | 2.00 | 1.10 | 0.11 |
| F (N, P, K) | Fertilizers used (Kg) | 50 | 100 | 80 | 5.16 |
| PM | Plastic mulch (−) | - | - | - | - |
| V | Variety (−) | - | - | - | - |
| Irrigation | Qe * (L/s) | Tco ** (h) | Ig′ (mm) | AE′′ (%) | ||||
|---|---|---|---|---|---|---|---|---|
| - | DI | PMDI | DI | PMDI | DI | PMDI | DI | PMDI |
| 1 | 1.80 | 1.80 | 1.11 | 0.89 | 9.84 | 7.94 | 93.8 | 100 |
| 2 | 1.80 | 1.80 | 1.88 | 1.03 | 15.97 | 9.16 | 100 | 100 |
| 3 | 1.80 | 1.80 | 0.94 | 0.77 | 8.33 | 6.87 | 100 | 100 |
| 4 | 1.80 | 1.80 | 1.14 | 0.91 | 10.13 | 8.10 | 83.70 | 100 |
| 5 | 1.74 | 1.74 | 1.39 | 1.11 | 12.37 | 9.89 | 100 | 100 |
| 6 | 1.74 | 1.74 | 2.17 | 2.09 | 18.62 | 17.92 | 100 | 100 |
| 7 | 1.74 | 1.74 | 2.77 | 2.67 | 23.84 | 22.90 | 99.20 | 100 |
| 8 | 1.74 | 1.74 | 2.98 | 2.68 | 25.60 | 23.02 | 83.70 | 100 |
| 9 | 1.74 | 1.74 | 3.22 | 3.18 | 27.28 | 27.64 | 89.50 | 100 |
| 10 | 1.74 | 1.74 | 3.08 | 2.93 | 26.64 | 25.20 | 91.00 | 100 |
| 11 | 1.74 | 1.74 | 2.98 | 2.63 | 25.64 | 22.58 | 97.500 | 100 |
| 12 | 1.74 | 1.74 | 2.83 | 2.79 | 24.32 | 24.01 | 86.96 | 100 |
| 13 | 1.74 | 1.74 | 2.83 | 2.77 | 24.14 | 23.80 | 87.00 | 100 |
| RWC * (%) | Yield (kg/ha) | WP (kg/m3) | WP (ER **) (Kg/m3) | Improved WP (%) | |||||
|---|---|---|---|---|---|---|---|---|---|
| DI | PMDI | DI | PMDI | DI | PMDI | DI | PMDI | DI | PMDI |
| - | 25.90 | 65,000 | 67,500 | 9.96 | 13.96 | 7.87 | 10.28 | - | 30.62 |
| Model | Train | Test | SVM Parameters | ||||||||||
|---|---|---|---|---|---|---|---|---|---|---|---|---|---|
| R2 | RMSE | SI | σ | NSE | R2 | RMSE | SI | σ | NSE | C | ε | γ | |
| Ω1 | 0.980 | 0.009 | 0.012 | 0.888 | 0.960 | 0.961 | 0.010 | 0.015 | 1.125 | 0.914 | 100 | 0.5 | 1 |
| Ω2 | 0.975 | 0.010 | 0.014 | 1.125 | 0.918 | 0.972 | 0.012 | 0.018 | 1.415 | 0.906 | 10 | 1 | 1 |
| Ω3 | 0.890 | 0.012 | 0.016 | 1.142 | 0.846 | 0.851 | 0.020 | 0.033 | 1.650 | 0.705 | 10 | 0.5 | 1 |
| Ω4 | 0.905 | 0.013 | 0.018 | 1.325 | 0.823 | 0.890 | 0.017 | 0.025 | 1.480 | 0.740 | 10 | 1 | 1 |
| Ω5 | 0.880 | 0.015 | 0.026 | 1.589 | 0.725 | 0.868 | 0.019 | 0.031 | 1.620 | 0.710 | 100 | 0.5 | 1 |
| Ω6 | 0.992 | 0.006 | 0.007 | 0.836 | 0.987 | 0.980 | 0.007 | 0.008 | 0.860 | 0.979 | 10 | 1 | 1 |
| Ω7 | 0.994 | 0.005 | 0.006 | 0.794 | 0.989 | 0.982 | 0.006 | 0.007 | 0.614 | 0.982 | 10 | 1 | 1 |
| Model | Train | Test | SVM Parameters | ||||||||||
|---|---|---|---|---|---|---|---|---|---|---|---|---|---|
| R2 | RMSE | SI | σ | NSE | R2 | RMSE | SI | σ | NSE | C | ε | γ | |
| Φ1 | 0.908 | 0.012 | 0.017 | 1.302 | 0.830 | 0.882 | 0.016 | 0.022 | 1.476 | 0.745 | 100 | 0.5 | 1 |
| Φ2 | 0.882 | 0.014 | 0.023 | 1.574 | 0.732 | 0.870 | 0.018 | 0.029 | 1.615 | 0.725 | 10 | 1 | 1 |
| Φ3 | 0.978 | 0.010 | 0.013 | 1.115 | 0.921 | 0.973 | 0.012 | 0.017 | 1.394 | 0.910 | 10 | 0.5 | 1 |
| Φ4 | 0.981 | 0.009 | 0.011 | 0.875 | 0.961 | 0.962 | 0.010 | 0.013 | 1.158 | 0.916 | 10 | 1 | 1 |
| Φ5 | 0.992 | 0.007 | 0.009 | 0.840 | 0.981 | 0.979 | 0.009 | 0.010 | 0.864 | 0.962 | 10 | 1 | 1 |
| Φ6 | 0.993 | 0.006 | 0.008 | 0.838 | 0.987 | 0.981 | 0.005 | 0.008 | 0.710 | 0.981 | 10 | 1 | 1 |
| Method | R2 | RMSE | SI | σ | NSE |
|---|---|---|---|---|---|
| SO–SVR | 0.994 | 0.005 | 0.006 | 0.794 | 0.989 |
| SVR | 0.970 | 0.015 | 0.019 | 1.412 | 0.920 |
| Method | R2 | RMSE | SI | σ | NSE |
|---|---|---|---|---|---|
| SO–SVR | 0.982 | 0.006 | 0.007 | 0.812 | 0.982 |
| SVR | 0.964 | 0.018 | 0.022 | 1.161 | 0.912 |
| Model | R2 | RMSE | SI | σ | NSE |
|---|---|---|---|---|---|
| GPR | 0.840 | 0.055 | - | - | 0.835 |
| RF | 0.690 | 0.045 | - | - | 0.687 |
| SVR | 0.964 | 0.018 | 0.022 | 1.161 | 0.912 |
| SO–SVR | 0.982 | 0.006 | 0.007 | 0.614 | 0.982 |
Publisher’s Note: MDPI stays neutral with regard to jurisdictional claims in published maps and institutional affiliations. |
© 2021 by the authors. Licensee MDPI, Basel, Switzerland. This article is an open access article distributed under the terms and conditions of the Creative Commons Attribution (CC BY) license (https://creativecommons.org/licenses/by/4.0/).
Share and Cite
Dehghanisanij, H.; Emami, S.; Achite, M.; Linh, N.T.T.; Pham, Q.B. Estimating Yield and Water Productivity of Tomato Using a Novel Hybrid Approach. Water 2021, 13, 3615. https://doi.org/10.3390/w13243615
Dehghanisanij H, Emami S, Achite M, Linh NTT, Pham QB. Estimating Yield and Water Productivity of Tomato Using a Novel Hybrid Approach. Water. 2021; 13(24):3615. https://doi.org/10.3390/w13243615
Chicago/Turabian StyleDehghanisanij, Hossein, Somayeh Emami, Mohammed Achite, Nguyen Thi Thuy Linh, and Quoc Bao Pham. 2021. "Estimating Yield and Water Productivity of Tomato Using a Novel Hybrid Approach" Water 13, no. 24: 3615. https://doi.org/10.3390/w13243615
APA StyleDehghanisanij, H., Emami, S., Achite, M., Linh, N. T. T., & Pham, Q. B. (2021). Estimating Yield and Water Productivity of Tomato Using a Novel Hybrid Approach. Water, 13(24), 3615. https://doi.org/10.3390/w13243615