Article

Analysis of Regional Water and Energy Consumption Considering Economic Development

1
State Key Laboratory of Hydrology-Water Resources and Hydraulic Engineering, Hohai University, Nanjing 210098, China
2
College of Hydrology and Water Resources, Hohai University, Nanjing 210098, China
*
Author to whom correspondence should be addressed.
Water 2021, 13(24), 3582; https://doi.org/10.3390/w13243582
Submission received: 29 September 2021 / Revised: 9 December 2021 / Accepted: 10 December 2021 / Published: 14 December 2021
(This article belongs to the Section Water Resources Management, Policy and Governance)

Abstract

:
The evaluation of regional water and energy consumption is of great significance to improving regional resource utilization. This paper analyzed the water and energy footprints in different provinces of China, considering regional economic levels. The results indicate: (1) both the largest water footprint and water footprint per capita were in Xinjiang and agriculture had the largest value; (2) Shandong was the largest energy consumer, Ningxia had the largest energy footprint per capita, and coal occupied the largest proportion for the top five energy footprint provinces; and (3) the resource input–output efficiencies in Beijing and Fujian were high, while water and energy consumption were low and gross regional product was high, compared with the average value of China. The situations in Xinjiang and Inner Mongolia were opposite. The change of consumption pattern for each inhabitant, the adoption of water-saving technology, and an increase to water-saving awareness would be helpful to decrease regional water consumption. An increase of regional energy use efficiency and a change to reduced energy consumption would contribute to the decreasing of regional energy consumption. More attention should be paid to renewable and clean Energies. In addition to solution from the local perspective, the virtual water trade and the energy product trade may relieve regional resource pressure in some extent, and the possible influencing should be considered at the same time. This paper could provide suggestions for regional resource utilization and sustainable development.

1. Introduction

In 2015, the United Nations promoted 17 sustainable development goals, including protecting water and energy resources, achieving reasonable production and consumption pattern and others, for a more sustainable development process by 2030 [1]. The evaluation of regional water and energy resource consumption is of great significance to improving regional resource management. In 2002, Hoekstra proposed the concept of the water footprint, which refers to the amount of water resources consumed to produce products or services [2]. Scholars have analyzed global water stress by virtue of the concept of water footprint for sustainable water management [3,4,5]. Studies using this method have been performed in different areas of the world. The influences of different dietary patterns on water footprints in the United Kingdom and the United States have been measured by Hess et al. [6], Rehkamp and Canning [7] and Rushforth and Ruddell [8]. The water footprints related to different types of crops were explored by Bazrafshan et al. [9] and Zoumides et al. [10], in case studies of Iran and Cyprus respectively, mentioning both changes to cultivated area and water use efficiency. In addition, the water footprint of China has been studied by many researchers [11,12,13].
The energy footprint indicator measures the energy resources used to produce goods and services across the whole supply chain [14,15]. Oswald et al. [15] indicated the significant variation in global energy footprint due to income and consumption patterns. Regional studies have been conducted, such as the impacts of different types of energy on climate change in Brazil [16], the contributions of the energy footprint of China for domestic and external production [14], energy intensity and possible improvements in Vietnam [17] and the energy footprint due to family consumption in Latin American and Caribbean countries [18]. Measures such as adopting renewable energy, decreasing the total consumption volume, etc., have been promoted [16,17,18]. However, few studies have analyzed regional water footprints, energy footprints and economic development under a comprehensive framework.
Based on the water footprint and energy footprint theory, this paper analyzed the water consumption and energy consumption of different provinces in China, both total volume and value per capita were included. Then, the provinces were divided into different groups according to regional water consumption, energy consumption and economic development levels. This paper can provide suggestions for regional resource utilization and sustainable development.

2. Materials and Methods

2.1. Study Area

As the largest developing country, the population of China is 1.40 × 10⁹ and the gross domestic product was 98.53 × 10¹² CNY (China Yuan) in 2019 [19]. While, China is still facing challenges, such as water scarcity, energy shortages [20,21,22]. The total water withdrawals are as much as 602.12 × 10⁹ m3 and total energy consumption is 6.54 × 10⁹ tons of standard coal equivalent [23,24]. The challenges within China vary significantly among regions [20,25,26], thus the water and energy situations in different provinces of China are studied in this paper.

2.2. Methods

2.2.1. Water Footprint

In this study, water footprints for different provinces were calculated as follows:
W F = W F a g r + W F i n d + W F d o m + W F e c o
where W F is the total water footprint of study area (m3) and W F a g r , W F i n d , W F d o m and W F e c o mean the water footprints of the agricultural, industrial, domestic and ecological sectors respectively (m3).
The water footprint for the agricultural, industrial or domestic sectors refer to the water consumed for this sector due to the production of products or services [2]. Environmental flow requirements are defined as the quantity, timing and quality of water flows required to sustain freshwater and estuarine ecosystems and the human livelihood and well-being that depend on these ecosystems [2]. There are more than 200 methods for deriving environmental flows [27,28]. Summaries for these methods have been performed [29,30]. In many cases there is usually not enough water for environmental needs due to the increasing water demand for economic development. Thus, the water footprint of the ecological sector in our study refers to the water consumed due to artificial recharge to some rivers, lakes and wetlands for environmental and ecological use [24], considering data availability at the same time.
W F a g r = i = 1 m ( V W C i × P i ) + j = 1 n ( V W C j × P j )
where V W C i is the virtual water content for crop i in the study region (m3/kg), P i is the production volume (kg), m refers to the kinds of crops, V W C j is the virtual water content for animal product j in the study region (m3/kg), P j is its production volume (kg), and n refers to the kinds of animal products, according to our previous study [31,32]. In this paper, nine kinds of crops (wheat, corn, rice, bean, tuber, oil-bearing crop, sugar crop, vegetable, and fruit) and six types of animal products (pork, beef, mutton, poultry, milk, and egg) were included. The values of V W C i and V W C j were based on the studies of [33,34].
W F i n d = W W i n d × α i n d
W F d o m = W W d o m × α d o m
W F e c o = W W e c o × α e c o
where W W i n d , W W d o m and W W e c o are the water withdrawals for the industrial sector, the domestic sector and the ecological sector, respectively, and α i n d , α d o m and α e c o are the related water consumption coefficients.

2.2.2. Energy Footprint

In this paper, the energy footprint ( E F , J) was calculated based on the following equation [35]:
E F = C × e
where C is the total consumption volume of energy (kg SCE), measured in standard coal equivalents, and e is the heat value coefficient, whose value was 29.27 MJ/kg SCE [19,35].
We calculated C as follows:
C = k = 1 p ( c k × d k )
where c k is the consumption volume for energy k (kg or m3 or kW·h), d k is the conversion coefficient for energy k into SCE (kg SCE/kg or kg SCE/m3 or kg SCE/kW·h), and p is the type of energy. In this study, coal, coke, crude oil, gasoline, kerosene, diesel oil, fuel oil, natural gas and electricity were included.

2.3. Data Sources

The production of crops and animal products, were taken as published in the Statistical Yearbook of China [19] and the Agricultural Statistical Data of China [36]. The consumption volume for different kinds of energy and the conversion coefficient into SCE were taken as published in the China Energy Statistical Yearbook [23]. Water use and ratios related to consumption for different sectors were taken as published in the China Water Resources Bulletin [24].

3. Results

3.1. Water Footprint and Water Footprint per Capita

The largest water consumer was Xinjiang with a value of 37.06 × 10⁹ m3. Shandong took the second place (26.71 × 10⁹ m3) and the third largest water footprint was in Henan (23.13 × 10⁹ m3) (Figure 1). About 2/3 provinces of China presented a water consumption of less than 10 × 109 m3, and the value for Tibet was the smallest, at about 1% of that in Xinjiang. Considering the population of different regions, we could find that the water consumption per capita in Xinjiang (1468.93 m3/cap) was much larger than other regions, and the value was 2.55 times of that of Inner Mongolia (575.83 m3/cap), the region with the second-largest water footprint per capita. More than half of the provinces presented a water footprint per capita ranging from 100 m3/cap to 200 m3/cap. Only four regions showed a water footprint per capita less than 100 m3/cap: Zhejiang (73.95 m3/cap), Guangdong (79.16 m3/cap), Guizhou (82.94 m3/cap) and Shaanxi (96.98 m3/cap).
Table 1 shows the top ten water consumers and compares the ranking for water footprint and water footprint per capita. The rank for water footprint was determined by the value of water the footprint in different provinces, and the rank of province with the largest water footprint was 1. The ranking method for water footprint per capita was as same as that for water footprint. For Heilongjiang and Inner Mongolia, the difference of the ranks was positive, which means that the adjustment of production and consumption patterns for each inhabitant should be the focus in the future for relieving regional water pressure. For Shandong, Henan, Hebei, Jiangsu, Anhui, Hubei and Sichuan, the situation is opposite, and population was one of the major factors influencing regional total water consumption. Xinjiang ranked first both the rank for water footprint and water footprint per capita, thus all the contents mentioned above could be considered. Table 2 shows the contribution of different sectors to regional water consumption. Agriculture had the largest value, and the proportions of its water footprint in total water footprint were between 56.31% and 92.44%. For the industrial sector, the proportions were less than 10% in most provinces, except in Jiangsu, Hubei and Anhui. For the domestic sector, the proportions were between 1.70% and 22.42%. For the ecological sector, the largest and smallest proportions were 12.22% and 0.56%, respectively.

3.2. Energy Footprint and Energy Footprint per Capita

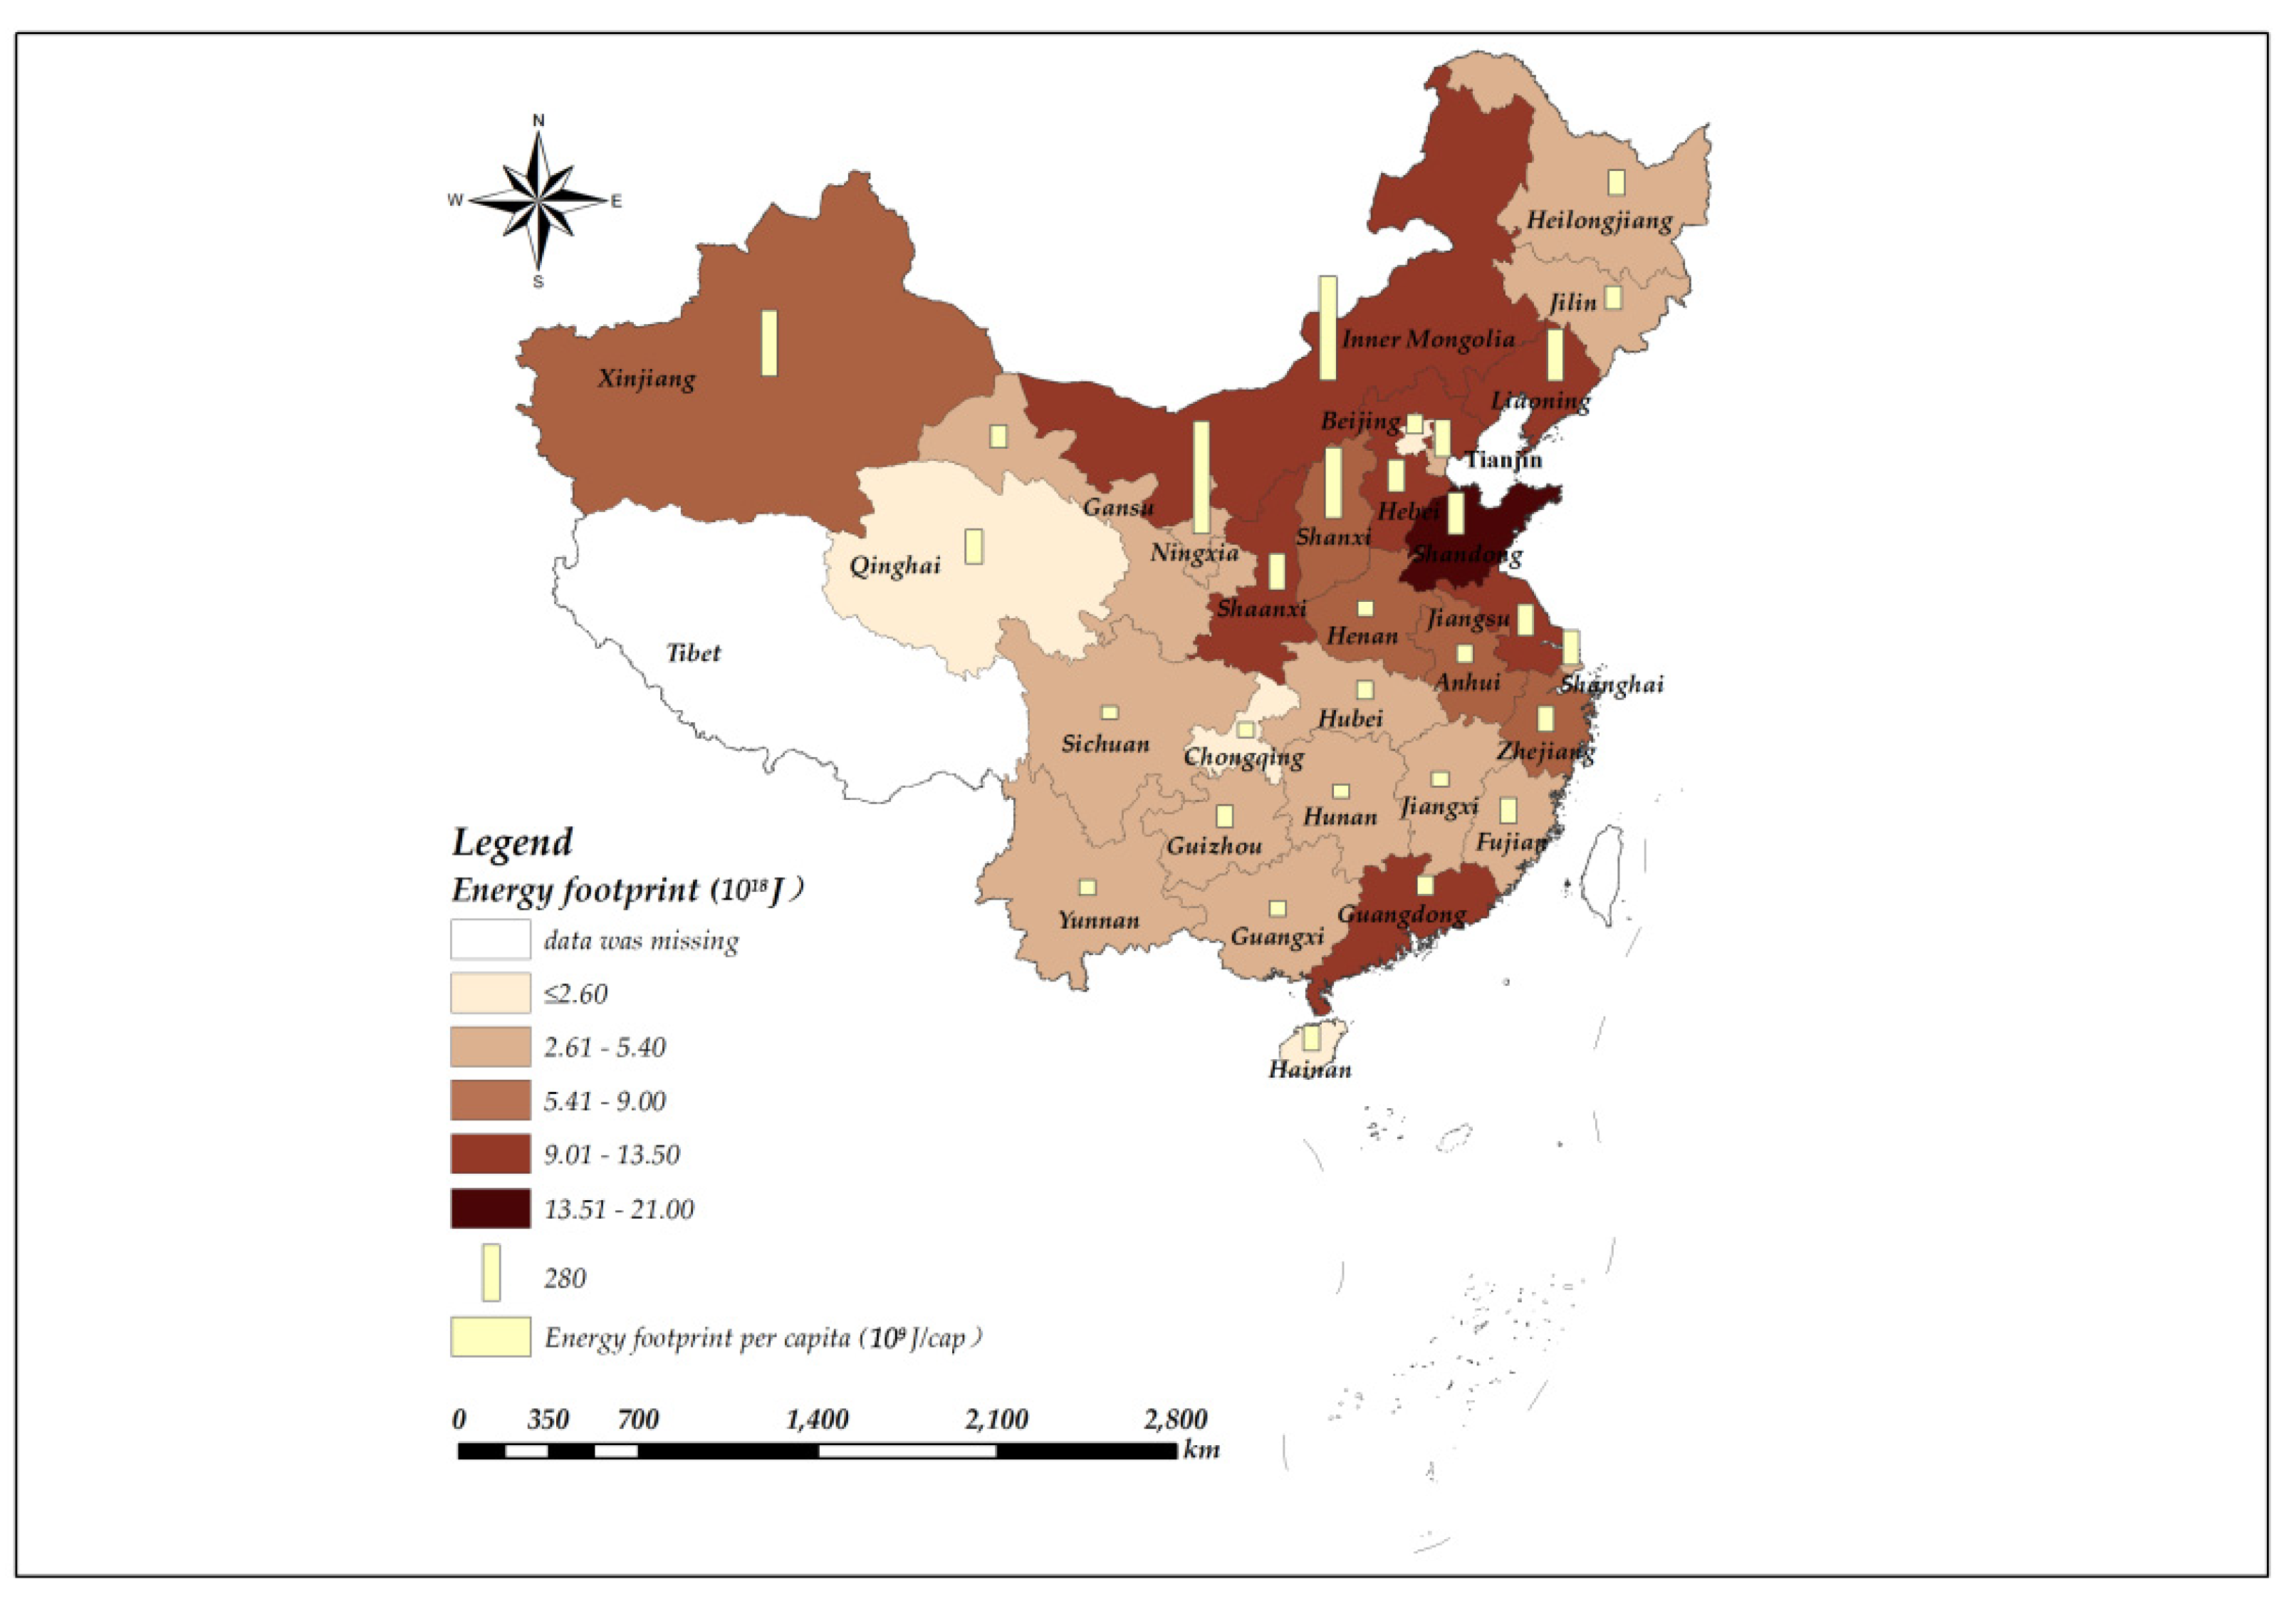
Figure 2 demonstrates the spatial variation in the energy footprint. Shandong was the largest energy consumer with a value of 20.69 × 10¹⁸ J. Besides Shandong, the top five energy footprints were in Inner Mongolia (13.02 × 10¹⁸ J), Shanxi (12.96 × 10¹⁸ J), Jiangsu (12.59 × 10¹⁸ J), and Hebei (12.07 × 10¹⁸ J). The total energy footprint of these five provinces accounted for about 1/3 of the value in China. Qinghai was the province with the smallest energy footprint (1.00 × 10¹⁸ J) and the value was only 4.83% of that in Shandong. Taking the population factor into account, the spatial distribution of energy footprint per capita in China was different from that of the energy footprint. There were 19 provinces whose energy footprint per capita was more than 100 × 109 J/cap, and the top five regions were Ningxia (552.32 × 10⁹ J/cap), Inner Mongolia (512.72 × 10⁹ J/cap), Shanxi (347.50 × 10⁹ J/cap), Xinjiang (324.86 × 10⁹ J/cap) and Liaoning (255.08 × 10⁹ J/cap), respectively. Sichuan had the smallest energy footprint per capita (61.56 × 10⁹ J/cap).
In Table 3, we compared the ranks for energy footprint and energy footprint per capita, for the top ten energy consumers, and the ranking method was based on that for water footprint. Among the top ten provinces, the rank for energy footprint per capita was higher than that for the energy footprint in Liaoning and Xinjiang, thus decreasing the energy consumption volume for each inhabitant by different measures is needed. For Shandong, Jiangsu, Hebei, Guangdong, Zhejiang and Henan, the differences of the ranks were negative, thus the control of the population was one of the keys for regional energy footprint management. The components of the energy footprint for the top five energy footprint provinces are shown in Figure 3. Coal had the largest proportion in the energy footprint, and the proportion ranged from 41.37% (Jiangsu) to 82.82% (Shanxi). Electricity was the energy type that occupied the second place for Inner Mongolia (10.09%), Shanxi (6.50%) and Jiangsu (17.91%). In Shandong, the percentage of the energy footprint related to crude oil in the total energy footprint was less than that of coal, whose value was 27.56%. While for Hebei, it was coke that took the second place (22.07%).

3.3. Analysis of Provincial Characteristics Based on Water Footprint, Energy Footprint and Gross Regional Product

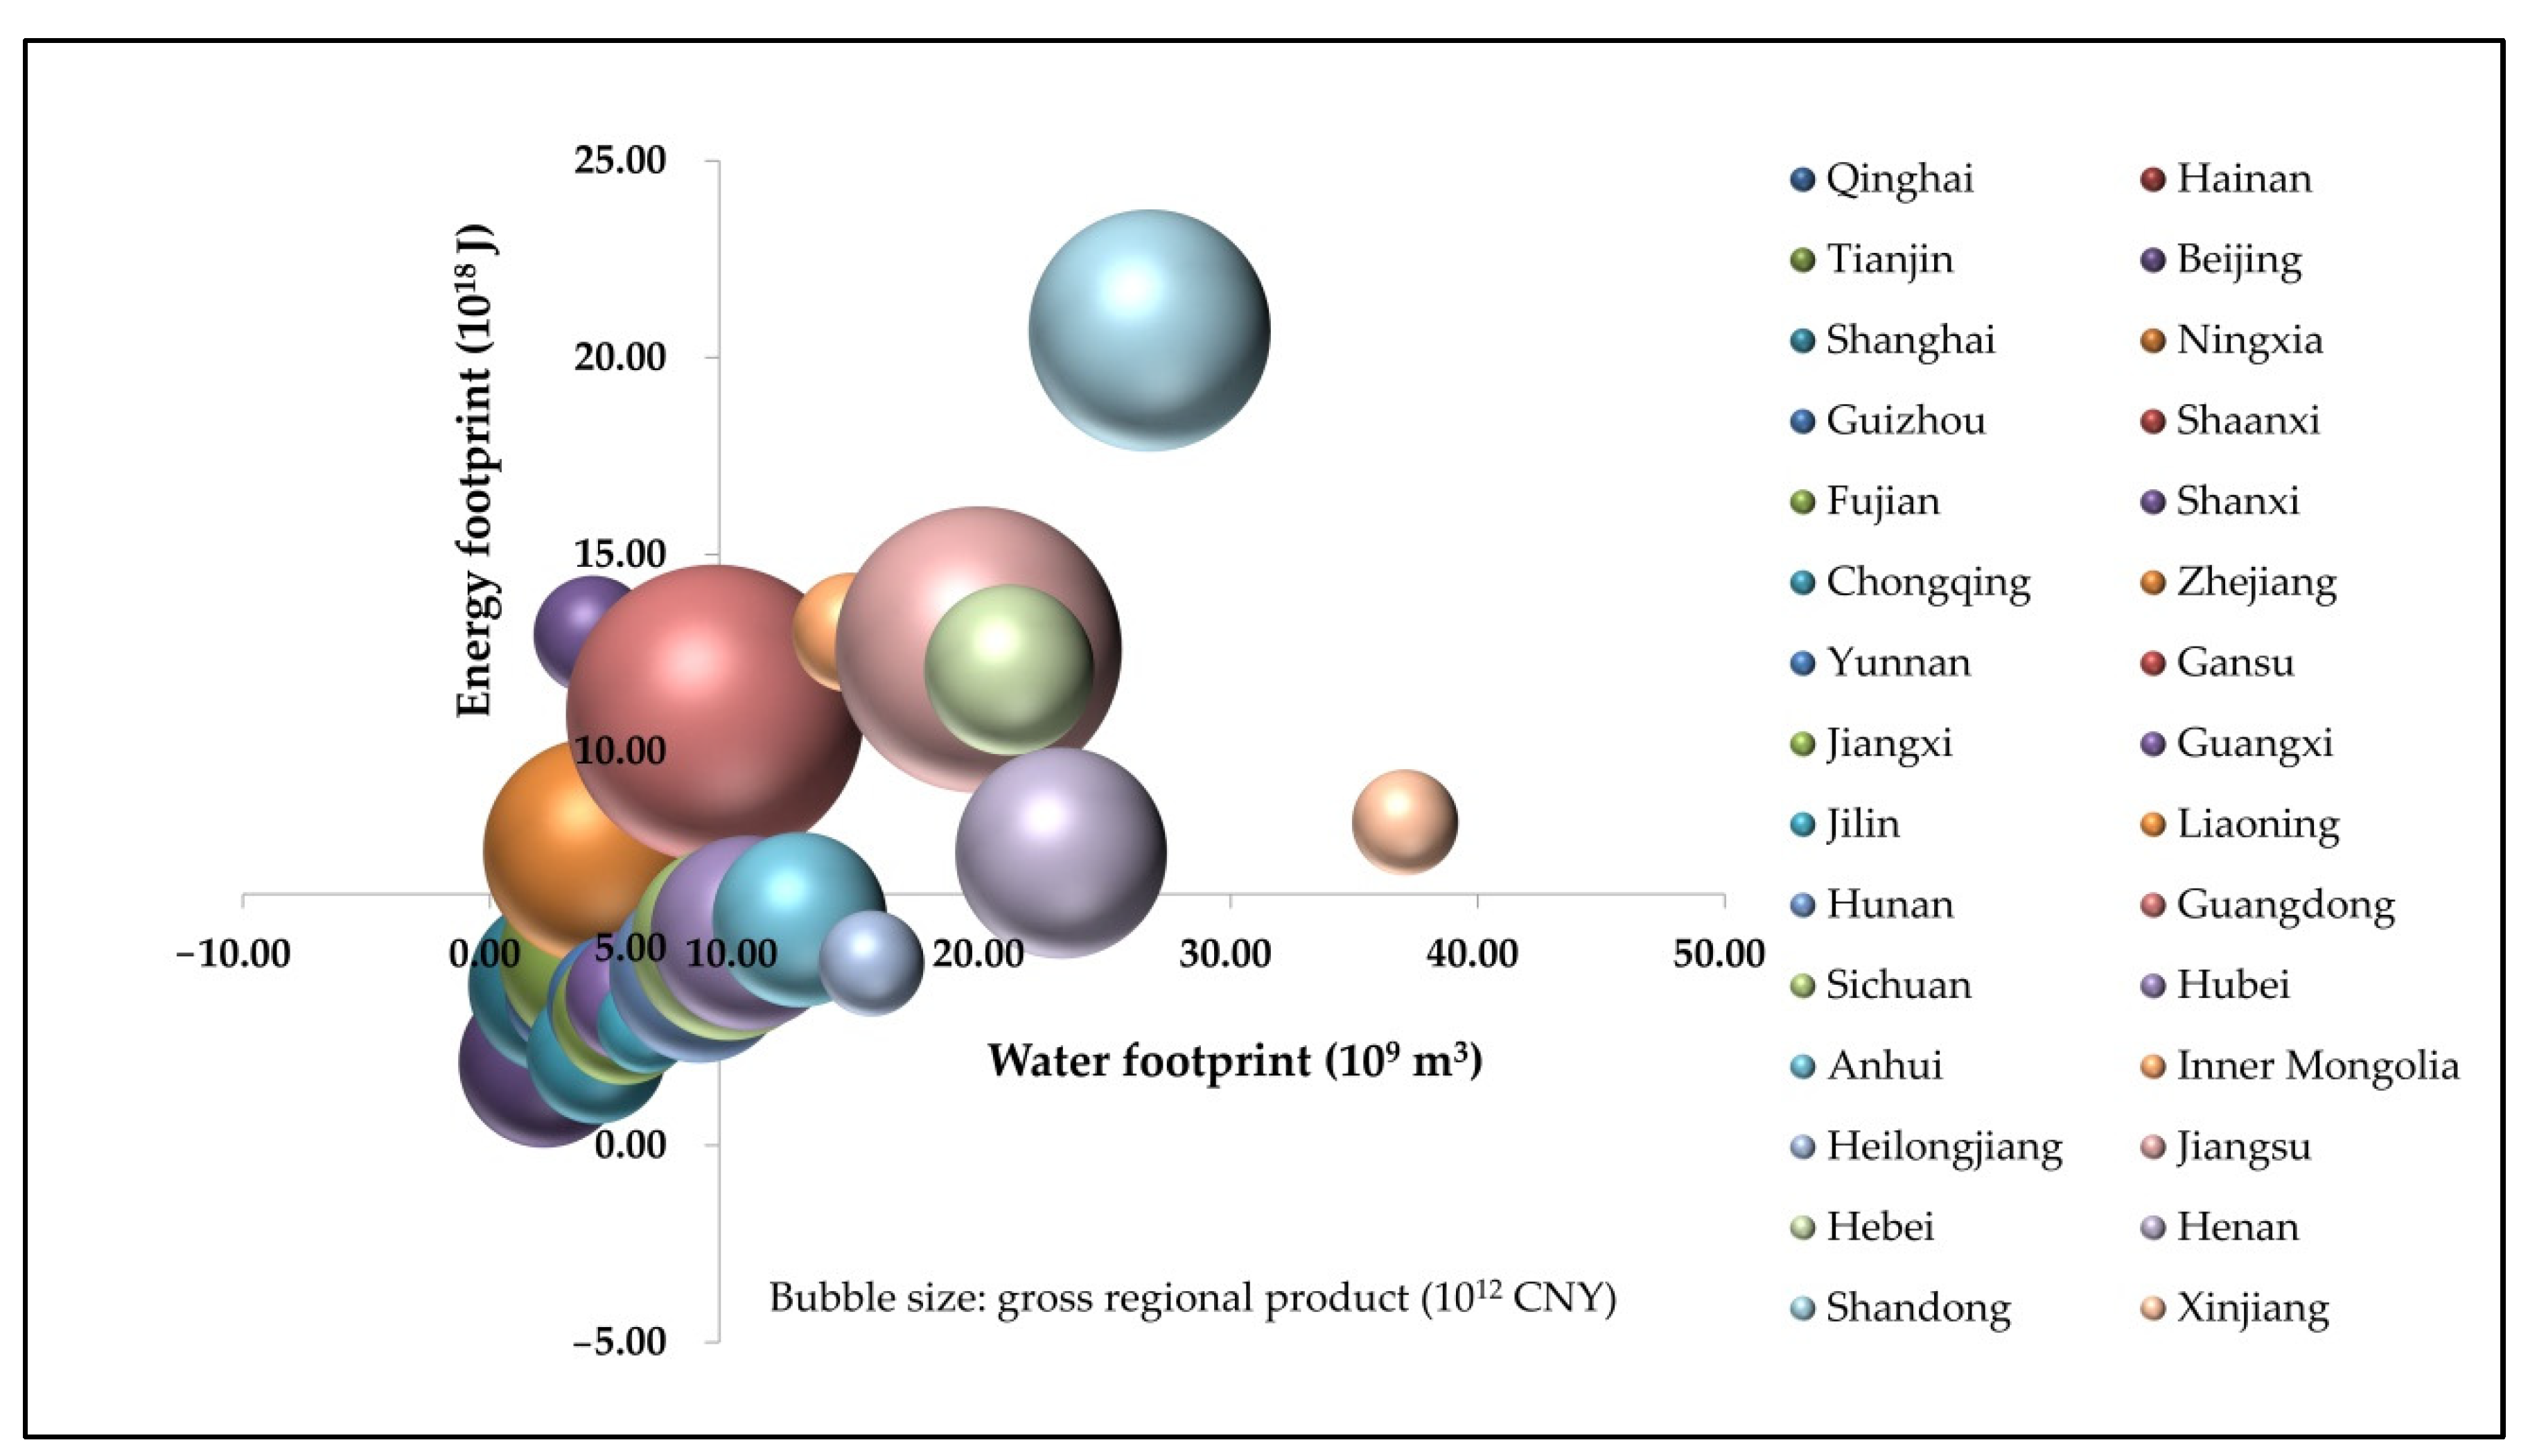
Due to the lack of energy consumption data for Tibet, 30 provinces are analyzed in this section. In Figure 4, the intersections of the coordinate axes were decided by the mean value of the water footprint (9.29 × 10⁹ m3) and the energy footprint (6.38 × 10¹⁸ J). There were six high water-high energy consumption provinces (Inner Mongolia, Jiangsu, Hebei, Henan, Shandong and Xinjiang), where both the water footprint and energy footprint were greater than the average values. For these six regions, only the gross regional products in Xinjiang (1.36 × 10¹² CNY) and Inner Mongolia (1.72 ×10¹² CNY) were smaller than the average value of the provinces of China (3.28 × 10¹² CNY). Shaanxi, Shanxi, Zhejiang, Liaoning and Guangdong were located in the low water-high energy quadrant, and Shanxi, Liaoning and Shaanxi presented a smaller gross regional product (1.70 × 10¹² CNY, 2.49 ×10¹² CNY and 2.58 × 10¹² CNY), compared with the average value of the provinces of China. Half of the provinces were in the low water-low energy consumption quadrant, among them Beijing, Shanghai, Fujian and Hunan presented relatively larger gross regional products compared with the average value of the provinces of China. Sichuan, Hubei, Anhui and Heilongjiang were in the high water-low energy consumption quadrant, and the gross regional products in Heilongjiang were less than the mean value of the provinces in China.
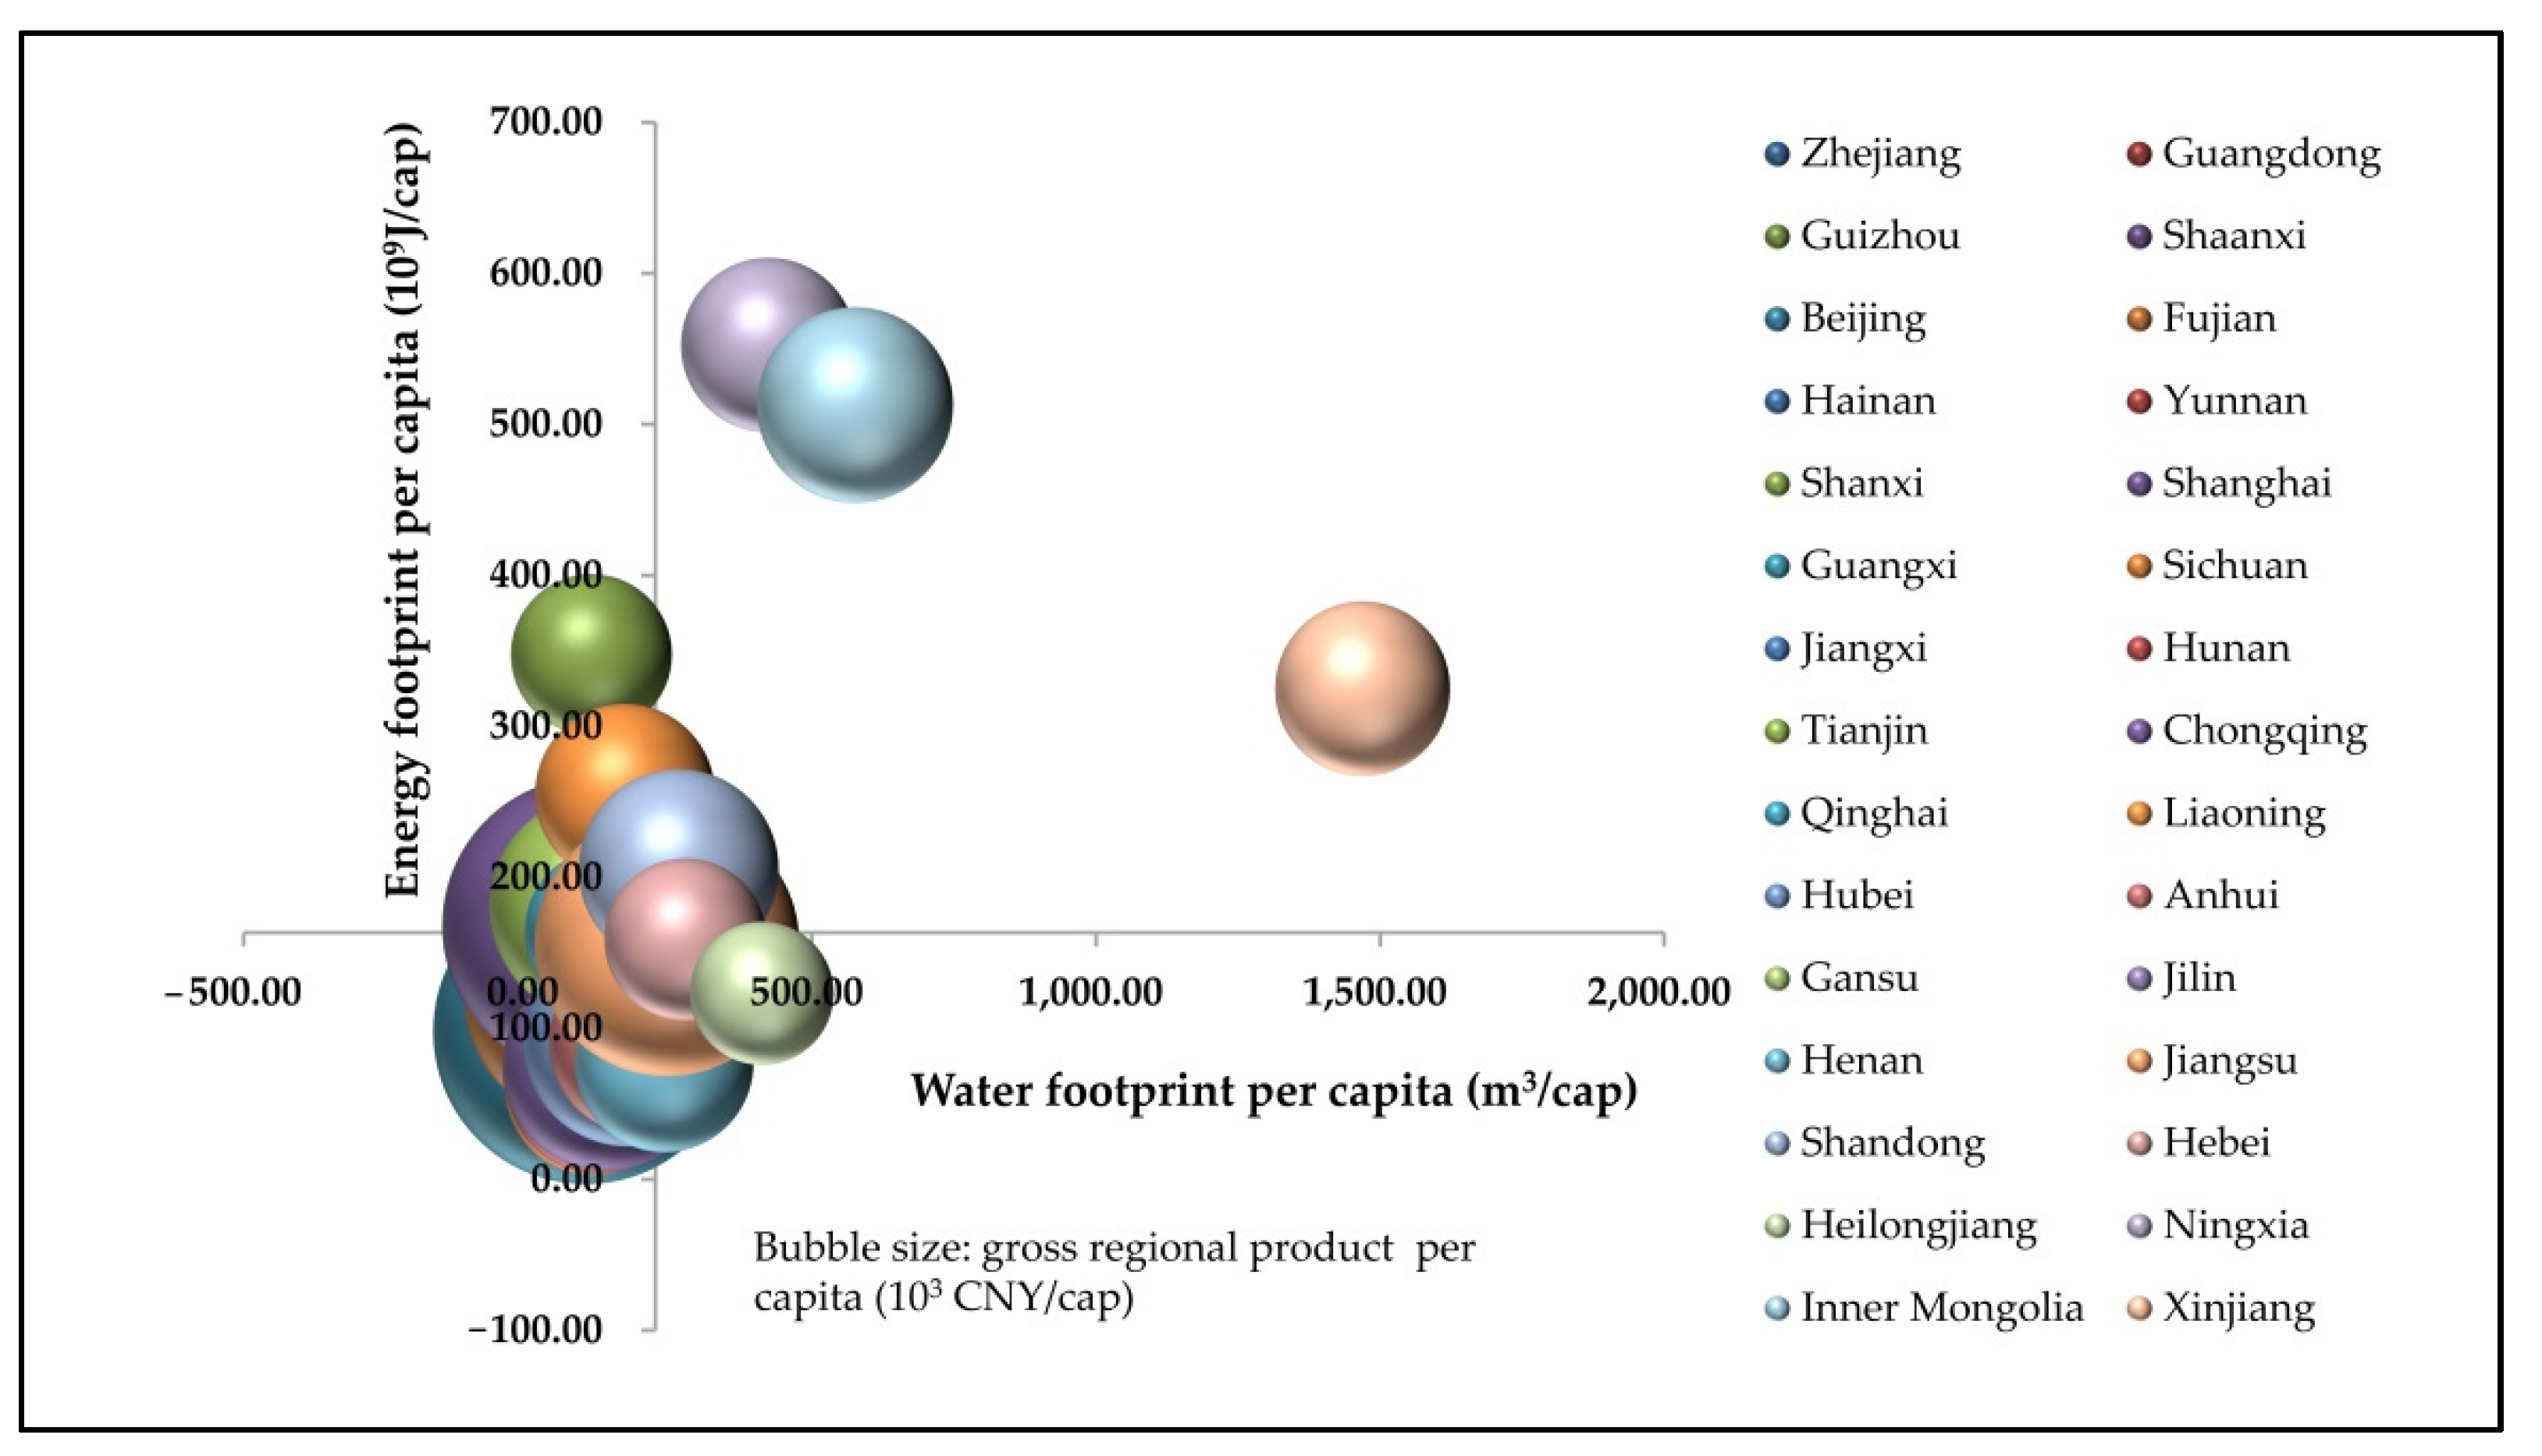
In Figure 5, the intersections of the coordinate axes were decided by the mean value of water footprint per capita (224.65 m3/cap) and energy footprint per capita (163.41 × 10⁹ J/cap). There were 15 provinces which were low water-low energy consumption per capita, and among them the gross regional product per capita in six regions: Beijing (164.21 × 10³ CNY/cap), Fujian (106.71 × 10³ CNY/cap), Zhejiang (106.58 × 10³ CNY/cap), Guangdong (93.46 × 10³ CNY/cap), Hubei (77.32 × 10³ CNY/cap) and Chongqing (75.56 × 10³ CNY/cap) was larger than the average value for China (69.73 × 10³ CNY/cap). There were four provinces located the in high water-high energy consumption per capita quadrant, only Shandong presented a relatively greater gross regional product per capita than the average value for China. Other provinces (Ningxia, Inner Mongolia and Xinjiang) did not. Shaanxi, Shanxi, Shanghai, Tianjin, Chongqing and Liaoning belonged to the low water-high energy consumption per capita quadrant, and their gross regional product per capita ranged from 45.66 × 10³ CNY/cap to 157.15 × 10³ CNY/cap. The number of provinces in the high water-low energy consumption per capita quadrant was five (Jilin, Henan, Jiangsu, Hebei and Heilongjiang), and only the value of gross regional product per capita for Jiangsu was larger than the mean value for China.

4. Discussion

The water footprint values indicated the volume of water consumed, which was of significance in regional water management. Hoekstra and Chapagain [37] found that consumption volume and construction were the main drivers of water footprint. Mekonnen and Gerbens-Leenes [38] proposed solutions, including a water footprint benchmark and changing the consumption of construction. We found that population played an important role in releveling regional water stress, which has been confirmed by Zuo et al. [39], Zhang et al. [40] and Mekonnen and Gerbens-Leenes [38]. Many researchers have studied water consumption in different sectors. Yu et al. [41] and Chouchane et al. [42] assessed the key place of agriculture in the cases of UK and Tunisia, respectively. In our results, agriculture was the largest contributor. Consequently, a decrease in agricultural water consumption should not be ignored for the sustainable water utilization in China. Measures like cultivating water-saving crop varieties, increasing water use efficiency, and adopting water-saving irrigation technology could be taken, while the control of agricultural production area should be taken at the same time, considering Jevons’ Paradox [43,44,45,46,47,48,49,50,51]. Moreover, we should also pay attention to water footprints in other sectors [52,53,54,55]. Both the application of advanced industrial production technologies and the improvement of people’s water-saving awareness would be helpful in reducing the total water consumption of China [56,57], especially in regions such as Jiangsu and Hubei where more than 40% of water consumption was occupied by the industrial and domestic sectors.
The increasing of regional energy use efficiency and the changing to lower energy consumption patterns would contribute to a decreasing to regional energy consumption [58,59,60] and related strategies and policies should be put on the agenda [61]. In our study, the control of the population was mentioned for Shandong, Jiangsu, Hebei, Guangdong, Zhejiang and Henan. This refers to a decrease of the population which could be achieved by decreasing the birth rate, and the role of population growth on regional energy consumption has also been examined by Lan et al. [59]. Considering the problems faced by countries like China, such as the increasing age of the population, control of the birth rate may be not among the feasible measures we could take for sustainable energy consumption at present. Lu [62] proposed investments in renewable and clean energy. According to the report of United Nations Development Programme [1], about 73% of human-caused greenhouse gases are due to energy consumption in 2017, and only 17.5% of power was generated by renewable energy. The study of Isman et al. [63] shows that the carbon footprint of Canadian metropolitan areas could substantially decrease if more renewable energy was used instead of fossil fuel energy. A similar conclusion could be found with respect to the USA [64]. The use of clean energy and renewable energy could be helpful in relieving the environmental impacts [32,65,66].
The resource input–output efficiency was high in provinces belonging to the group with low water and energy consumption and high gross regional product, such as Beijing and Fujian. On the contrary, the resource input–output efficiency was low in provinces belonging to the group with high water and energy consumption and low gross regional product, such as Xinjiang and Inner Mongolia. Measures, including changing regional production and consumption patterns, increasing water and energy resource use efficiency and improving resource-saving awareness, should be taken [32,67]. Moreover, the focus of different regions may be different. For the provinces whose economic level was higher than the average value of China, if it was located in the high water-low energy consumption quadrant, then the water consumption should be its focus in the future; if it was located in the low water-high energy consumption quadrant, then energy consumption should be on the focus. In addition to solutions from a local perspective, the virtual water and energy product trades may relieve regional resource pressure to some extent by using the resources in other areas to produce the products we need, while the possible influences to the environment, economy and other aspects should be considered simultaneously [68,69,70,71,72].
In this paper, the calculations of water footprint and energy footprint were mainly based on secondary data coming from the government’s published statistical material. Other resources, except water and energy were mentioned in this study, and the impacts of climate changes should be included in future studies of sustainable development.

5. Conclusions

The water and energy footprints of different provinces of China were analyzed, considering regional economic levels. The following conclusions were obtained:
Xinjiang had the largest water footprint and the largest water footprint per capita, and about 1/3 provinces of China had water consumption more than 10×109 m3. Compared with other sectors, the water footprint of agriculture was much larger. Change of the consumption pattern for each inhabitant, adoption of water-saving and technology, and an increase to water-saving awareness would be helpful to decrease regional water consumption.
About 1/3 of the energy footprint in China occurs in Shandong, Inner Mongolia, Shanxi, Jiangsu and Hebei, and Sichuan had the smallest energy footprint per capita. Coal occupied the largest proportion in the energy footprint of the top five energy footprint provinces. It would be helpful for sustainable development to increase energy use efficiency and to invest in renewable and clean energy.
The resource input–output efficiencies in Beijing and Fujian were high, while those of Xinjiang and Inner Mongolia were low, considering water consumption, energy consumption and gross regional product. From a local perspective, increasing resource use efficiency and resource-saving awareness should be taken. From an external perspective, the virtual water and energy product trades may relieve regional resource pressure to some extent, while possible ways to influence them should be considered.

Author Contributions

Conceptualization, J.L.; methodology, J.L.; formal analysis, J.L.; writing—original draft preparation, J.L. and N.X.; writing—review and editing, Z.Y. All authors have read and agreed to the published version of the manuscript.

Funding

This work was jointly supported by the National Natural Science Foundation of China (No. 51609063), the Fundamental Research Funds for the Central Universities (No. B200202027), the National Key R&D Program of China (No. 2018YFF0215702), the Special Fund of State Key Laboratory of Hydrology-Water Resources and Hydraulic Engineering (No. 20145027312).

Institutional Review Board Statement

Not applicable.

Informed Consent Statement

Not applicable.

Data Availability Statement

The data used in this study are available in 2.2 Data Sources of this Article.

Conflicts of Interest

The authors declare no conflict of interest.

References

  1. United Nations Development Programme. Sustainable Development Goals. Available online: https://www.undp.org/sustainable-development-goals (accessed on 1 December 2021).
  2. Hoekstra, A.Y.; Chapagain, A.K.; Aldaya, M.M.; Mekonnen, M.M. The Water Footprint Assessment Manual: Setting the Global Standard; Earthscan: London, UK, 2011. [Google Scholar]
  3. Gerbens-Leenes, W.; Hoekstra, A.Y.; van der Meer, T.H. The water footprint of energy from biomass: A quantitative assessment and consequences of an increasing share of bio-energy in energy supply. Ecol. Econ. 2009, 68, 1052–1060. [Google Scholar] [CrossRef]
  4. Gerbens-Leenes, W.; Hoekstra, A.Y.; van der Meer, T.H. The water footprint of bioenergy. Proc. Natl. Acad. Sci. USA 2009, 106, 10219–10223. [Google Scholar] [CrossRef] [Green Version]
  5. Ridoutt, B.G.; Pfister, S. A revised approach to water footprinting to make transparent the impacts of consumption and production on global freshwater scarcity. Glob. Environ. Change Hum. Policy Dimens. 2010, 20, 113–120. [Google Scholar] [CrossRef]
  6. Hess, T.; Chatterton, J.; Daccache, A.; Williams, A. The impact of changing food choices on the blue water scarcity footprint and greenhouse gas emissions of the British diet: The example of potato, pasta and rice. J. Clean. Prod. 2016, 112, 4558–4568. [Google Scholar] [CrossRef] [Green Version]
  7. Rehkamp, S.; Canning, P. Measuring Embodied Blue Water in American Diets: An EIO Supply Chain Approach. Ecol. Econ. 2018, 147, 179–188. [Google Scholar] [CrossRef]
  8. Rushforth, R.R.; Ruddell, B.L. A spatially detailed blue water footprint of the United States economy. Hydrol. Earth Syst. Sci. 2018, 22, 3007–3032. [Google Scholar] [CrossRef] [Green Version]
  9. Bazrafshan, O.; Etedali, H.R.; Moshizi, Z.G.N.; Shamili, M. Virtual water trade and water footprint accounting of saffron production in Iran. Agric. Water Manag. 2019, 213, 368–374. [Google Scholar] [CrossRef]
  10. Zoumides, C.; Bruggeman, A.; Hadjikakou, M.; Zachariadis, T. Policy-relevant indicators for semi-arid nations: The water footprint of crop production and supply utilization of Cyprus. Ecol. Indic. 2014, 43, 205–214. [Google Scholar] [CrossRef]
  11. Zhang, W.; Zha, X.; Li, J.; Liang, W.; Ma, Y.; Fan, D.; Li, S. Spatiotemporal change of blue water and green water resources in the headwater of Yellow River Basin, China. Water Resour. Manag. 2014, 28, 4715–4732. [Google Scholar] [CrossRef]
  12. Ma, W.J.; Meng, L.H.; Yang, D.W. Spatiotemporal variations of agricultural water footprint and socioeconomic matching evaluation from the perspective of ecological function zone. Agric. Water Manag. 2021, 249, 106803. [Google Scholar] [CrossRef]
  13. Yu, D.; Ding, T. Assessment on the flow and vulnerability of water footprint network of Beijing city, China. J. Clean. Prod. 2021, 293, 126126. [Google Scholar] [CrossRef]
  14. Tian, X.; Chen, B.; Geng, Y.; Zhong, S.; Gao, C.; Wilson, J. Energy footprint pathways of China. Energy 2019, 180, 330–340. [Google Scholar] [CrossRef]
  15. Oswald, Y.; Owen, A.; Steinberger, J.K. Large inequality in international and intranational energy footprints between income groups and across consumption categories. Nat. Energy 2020, 5, 231–239. [Google Scholar] [CrossRef]
  16. Montoya, M.A.; Allegretti, G.; Bertussi, L.A.S.; Talamini, E. Renewable and non-renewable in the energy-emissions-climate nexus: Brazilian contributions to climate change via international trade. J. Clean. Prod. 2021, 312, 127700. [Google Scholar] [CrossRef]
  17. Springer, C. Assessing energy intensity and retrofit opportunities for the aluminum industry: Lessons from Vietnam. Resour. Conserv. Recycl. 2018, 131, 235–246. [Google Scholar] [CrossRef]
  18. Chen, X.; Li, C.; Tang, Y.; Li, L.; Du, Y.; Li, L. Integrated optimization of cutting tool and cutting parameters in face milling for minimizing energy footprint and production time. Energy 2019, 175, 1021–1037. [Google Scholar] [CrossRef]
  19. National Bureau of Statistics of the People’s Republic of China. Statistical Yearbook of China; China Statistical Press: Beijing, China, 2020. [Google Scholar]
  20. Xu, Z.; Chau, S.N.; Chen, X.; Zhang, J.; Li, Y.; Dietz, T.; Wang, J.; Winkler, J.A.; Fan, F.; Huang, B.; et al. Assessing progress towards sustainable development over space and time. Nature 2020, 577, 74–78. [Google Scholar] [CrossRef]
  21. Xie, Y.; Zhou, X. Income inequality in today’s China. Proc. Natl. Acad. Sci. USA 2014, 111, 6928–6933. [Google Scholar] [CrossRef] [Green Version]
  22. Liu, J.G.; Vina, A.; Yang, W.; Li, S.X.; Xu, W.H.; Zheng, H. China’s environment on a Meta coupled planet. Annu. Rev. Environ. Res. 2018, 43, 1–34. [Google Scholar] [CrossRef]
  23. National Bureau of Statistics of the People’s Republic of China. China Energy Statistical Yearbook; China Statistical Press: Beijing, China, 2020. [Google Scholar]
  24. Ministry of Water Resources of the People’s Republic of China. China Water Resources Bulletin; Water Resources and Electricity Press: Beijing, China, 2019. [Google Scholar]
  25. Liu, J.; Diamond, J. China’s environment in a globalizing world. Nature 2005, 435, 1179–1186. [Google Scholar] [CrossRef]
  26. Ouyang, Z.; Ouyang, Z.; Zheng, H.; Xiao, Y.; Polasky, S.; Liu, J.; Xu, W.; Wang, Q.; Zhang, L.; Xiao, Y.; et al. Improvements in ecosystem services from investments in natural capital. Science 2016, 352, 1455–1459. [Google Scholar] [CrossRef]
  27. Tharme, R. A global perspective on environmental flow assessment: Emerging trends in the development and application of environmental flow methodologies for rivers. River Res. Appl. 2013, 19, 397–441. [Google Scholar] [CrossRef]
  28. Arthington, A.H.; Bunn, S.E.; Poff, N.L.; Naiman, R.J. The challenge of providing environmental flow rules to sustain river ecosystems. Ecol. Appli. 2006, 16, 1311–1318. [Google Scholar] [CrossRef]
  29. Arthington, A.H. Comparative Evaluation of Environmental Low Assessment Techniques: Review of Holistic Methodologies; LWRRDC Occasional Paper 26/98; Canberra: Land and Water Resources Research and Development Corporatio: Canberra, Australia, 1998; ISBN 0642267456. [Google Scholar]
  30. King, J.M.; Tharme, R.E.; de Villiers, M.S. (Eds.) Environmental Flow Assessments for Rivers: Manual for the Building Block Methodology; WRC Report No TT 354/08, Updated Edition; Water Research Commission: Pretoria, South Africa, 2008. [Google Scholar]
  31. Liu, J.; Wu, P.T.; Wang, Y.B.; Zhao, X.; Sun, S.K.; Cao, X.C. Impacts of changing cropping pattern on virtual water flows related to crops transfer: A case study for the Hetao irrigation district, China. J. Sci. Food Agric. 2014, 94, 2992–3000. [Google Scholar] [CrossRef]
  32. Liu, J.; Sun, S.K.; Wu, P.T.; Wang, Y.B.; Zhao, X.N. Evaluation of crop production, trade, and consumption from the perspective of water resources: A case study of the Hetao irrigation district, China, for 1960–2010. Sci. Total Environ. 2015, 505, 1174–1181. [Google Scholar] [CrossRef] [PubMed]
  33. Mekonnen, M.M.; Hoekstra, A.Y. The Green, Blue and Grey Water Footprint of Crops and Derived Crop Products; Value of Water Research Report Series No. 47; UNESCO-IHE: Delft, The Netherlands, 2010. [Google Scholar]
  34. Mekonnen, M.M.; Hoekstra, A.Y. The Green, Blue and Grey Water Footprint of Farm Animals and Animal Products; Value of Water Research Report Series No. 48; UNESCO-IHE: Delft, The Netherlands, 2010. [Google Scholar]
  35. Zhang, W.; Hao, J. Measurement of China’s energy footprint and analysis of regional differences. Stat. Decis. 2020, 8, 93–97. [Google Scholar]
  36. Ministry of Agriculture of the People’s Republic of China. Agricultural Statistical Data of China; Chinese Agricultural Press: Beijing, China, 2020. [Google Scholar]
  37. Hoekstra, A.Y.; Chapagain, A.K. Water footprints of nations: Water use by people as a function of their consumption pattern. Water Resour. Manag. 2007, 21, 35–48. [Google Scholar] [CrossRef]
  38. Mekonnen, M.M.; Gerbens-Leenes, W. The water footprint of global food production. Water 2020, 12, 2696. [Google Scholar] [CrossRef]
  39. Zuo, Q.; Jiang, L.; Feng, Y.; Diao, Y. Spatiotemporal variation of ecological footprint of water resources in the provinces in the Yellow River Basin. J. Irrig. Drain. 2020, 39, 1–8. [Google Scholar]
  40. Zhang, Y.; Tian, Q.; Hu, H.; Yu, M. Water footprint of food consumption by Chinese residents. Int. J. Environ. Res. Public Health 2019, 16, 3979. [Google Scholar] [CrossRef] [Green Version]
  41. Yu, Y.; Hubacek, K.; Feng, K.; Guan, D. Assessing regional and global water footprints for the UK. Ecol. Econ. 2010, 69, 1140–1147. [Google Scholar] [CrossRef]
  42. Chouchane, H.; Hoekstra, A.Y.; Krol, M.S.; Mekonnen, M.M. The water footprint of Tunisia from an economic perspective. Ecol. Indic. 2015, 52, 311–319. [Google Scholar] [CrossRef] [Green Version]
  43. Alcott, B. Jevons’ paradox. Ecol. Econ. 2005, 54, 9–21. [Google Scholar] [CrossRef]
  44. Liu, J.; Wang, Y.; Yu, Z.; Cao, X.; Tian, L.; Sun, S.; Wu, P. A comprehensive analysis of blue water scarcity from the production, consumption, and water transfer perspectives. Ecol. Indic. 2017, 72, 870–880. [Google Scholar] [CrossRef]
  45. Vanham, D.; Mak, T.N.; Gawlik, B.M. Urban food consumption and associated water resources: The example of Dutch cities. Sci. Total Environ. 2016, 565, 232–239. [Google Scholar] [CrossRef] [PubMed]
  46. Ward, F.A.; Pulido-Velazquez, M. Water conservation in irrigation can increase water use. Proc. Natl. Acad. Sci. USA 2008, 105, 18215–18220. [Google Scholar] [CrossRef] [PubMed] [Green Version]
  47. Yang, Z.; Liu, H.; Xu, X.; Yang, T. Applying the water footprint and dynamic structural decomposition analysis on the growing water use in China during 1997–2007. Ecol. Indic. 2016, 60, 634–643. [Google Scholar] [CrossRef]
  48. Gleeson, T.; Wada, Y.; Bierkens, M.F.P.; Van Beek, L.P.H. Water balance of global aquifers revealed by groundwater footprint. Nature 2012, 488, 197–200. [Google Scholar] [CrossRef]
  49. Cao, X.C.; Zeng, W.; Wu, M.Y.; Guo, X.P.; Wang, W.G. Hybrid analytical framework for regional agricultural water resource utilization and efficiency evaluation. Agric. Water Manag. 2020, 231, 106027. [Google Scholar] [CrossRef]
  50. Zhao, X.; Tillotson, M.R.; Liu, Y.W.; Guo, W.; Yang, A.H.; Li, Y.F. Index decomposition analysis of urban crop water footprint. Ecol. Model. 2017, 348, 25–32. [Google Scholar] [CrossRef] [Green Version]
  51. Cao, X.C.; Xiao, J.F.; Wu, M.Y.; Zeng, W.; Huang, X. Agricultural water use efficiency and driving force assessment to improve regional productivity and effectiveness. Water Resour. Manag. 2021, 35, 2519–2535. [Google Scholar] [CrossRef]
  52. Bai, X.; Ren, X.; Khanna, N.Z.; Zhou, N.; Hu, M. Comprehensive water footprint assessment of the dairy industry chain based on ISO 14046: A case study in China. Resour. Conserv. Recycl. 2017, 132, 369–375. [Google Scholar] [CrossRef]
  53. Kan, D.; Huang, W. An empirical study of the impact of urbanization on industry water footprint in China. Sustainability 2020, 12, 2263. [Google Scholar] [CrossRef] [Green Version]
  54. Caldeira, C.; Quinteiro, P.; Castanheira, E.; Boulay, A.M.; Dias, A.C.; Arroja, L.; Freire, F. Water footprint profile of crop-based vegetable oils and waste cooking oil: Comparing two water scarcity footprint methods. J. Clean. Prod. 2018, 195, 1190–1202. [Google Scholar] [CrossRef]
  55. Shahmohammadi, S.; Steinmann, Z.; King, H.; Hendrickx, H.; Huijbregts, M.A.J.; Lifset, R. The influence of consumer behavior on energy, greenhouse gas, and water footprints of showering. J. Ind. Ecol. 2019, 23, 1186–1195. [Google Scholar] [CrossRef] [Green Version]
  56. Lutter, S.; Pfister, S.; Giljum, S.; Wieland, H.; Mutel, C. Spatially explicit assessment of water embodied in European trade: A product-level multi-regional input-output analysis. Glob. Environ. Chang. 2016, 38, 171–182. [Google Scholar] [CrossRef] [Green Version]
  57. Vanham, D.; Gawlik, B.M.; Bidoglio, G. Cities as hotspots of indirect water consumption: The case study of Hong Kong. J. Hydrol. 2019, 573, 1075–1086. [Google Scholar] [CrossRef]
  58. Arto, I.; Capellan-Perez, I.; Lago, R.; Bueno, G.; Bermejo, R. The energy requirements of a developed world. Energy Sustain. Dev. 2016, 33, 1–13. [Google Scholar] [CrossRef] [Green Version]
  59. Lan, J.; Malik, A.; Lenzen, M.; Mcbain, D.; Kanemoto, K. A structural decomposition analysis of global energy footprints. Appl. Energy 2016, 163, 436–451. [Google Scholar] [CrossRef]
  60. Ulucak, R.; Danish; Ozcan, B. Relationship between energy consumption and environmental sustainability in OECD countries: The role of natural resources rents. Resour. Policy 2020, 69, 101803. [Google Scholar] [CrossRef]
  61. Medved, S. Present and future ecological footprint of Slovenia-the influence of energy demand scenarios. Ecol. Model. 2006, 192, 25–36. [Google Scholar] [CrossRef]
  62. Lu, W.C. The interplay among ecological footprint, real income, energy consumption, and trade openness in 13 Asian countries. Environ. Sci. Pollut. Res. 2020, 27, 45148–45160. [Google Scholar] [CrossRef] [PubMed]
  63. Isman, M.; Archambault, M.; Konga, C.N.; Lin, D.; Iha, K.; Ouellet-Plamondon, C. Ecological footprint assessment for targeting climate change mitigation in cities: A case study of 15 Canadian cities according to census metropolitan areas. J. Clean. Prod. 2018, 174, 1032–1043. [Google Scholar] [CrossRef]
  64. Usman, O.; Akadiri, S.S.; Adeshola, I. Role of renewable energy and globalization on ecological footprint in the USA: Implications for environmental sustainability. Environ. Sci. Pollut. Res. 2020, 27, 30681–30693. [Google Scholar] [CrossRef]
  65. Elshimy, M.; El-Aasar, K.M. Carbon footprint, renewable energy, non-renewable energy, and livestock: Testing the environmental Kuznets curve hypothesis for the Arab world. Environ. Dev. Sustain. 2020, 22, 6985–7012. [Google Scholar] [CrossRef]
  66. Zhang, P.; Xu, Z.; Fan, W.; Ren, J.; Liu, R.; Dong, X. Structure dynamics and risk assessment of water-energy-food nexus: A water footprint approach. Sustainability 2019, 11, 1187. [Google Scholar] [CrossRef] [Green Version]
  67. Liu, J.; Cao, X.C.; Li, B.Q.; Yu, Z.B. Analysis of blue and green water consumption at the irrigation district scale. Sustainability 2018, 10, 305. [Google Scholar] [CrossRef] [Green Version]
  68. Bulsink, F.; Hoekstra, A.Y.; Booij, M.J. The water footprint of Indonesian provinces related to the consumption of crop products. Hydrol. Earth Syst. Sci. 2010, 14, 119–128. [Google Scholar] [CrossRef] [Green Version]
  69. Chapagain, A.K.; Hoekstra, A.Y.; Savenije, H.H.G. Water saving through international trade of agricultural products. Hydrol. Earth Syst. Sci. 2006, 10, 455–468. [Google Scholar] [CrossRef] [Green Version]
  70. Liu, J.; Savenije, H.H. Food consumption patterns and their effect on water requirement in China. Hydrol. Earth Syst. Sci. 2008, 12, 887–898. [Google Scholar] [CrossRef] [Green Version]
  71. Chen, S.; Tan, Y.; Liu, Z. Direct and embodied energy-water-carbon nexus at an inter-regional scale. Appl. Energy 2019, 251, 113401. [Google Scholar] [CrossRef]
  72. Zhang, X.X.; Zhao, X.; Li, R.S.; Mao, G.Q.; Tillotson, M.R.; Liao, X.W.; Zhang, C.; Yi, Y.J. Evaluating the vulnerability of physical and virtual water resource networks in China’s megacities. Resour. Conserv. Recycl. 2020, 161, 104972. [Google Scholar] [CrossRef]
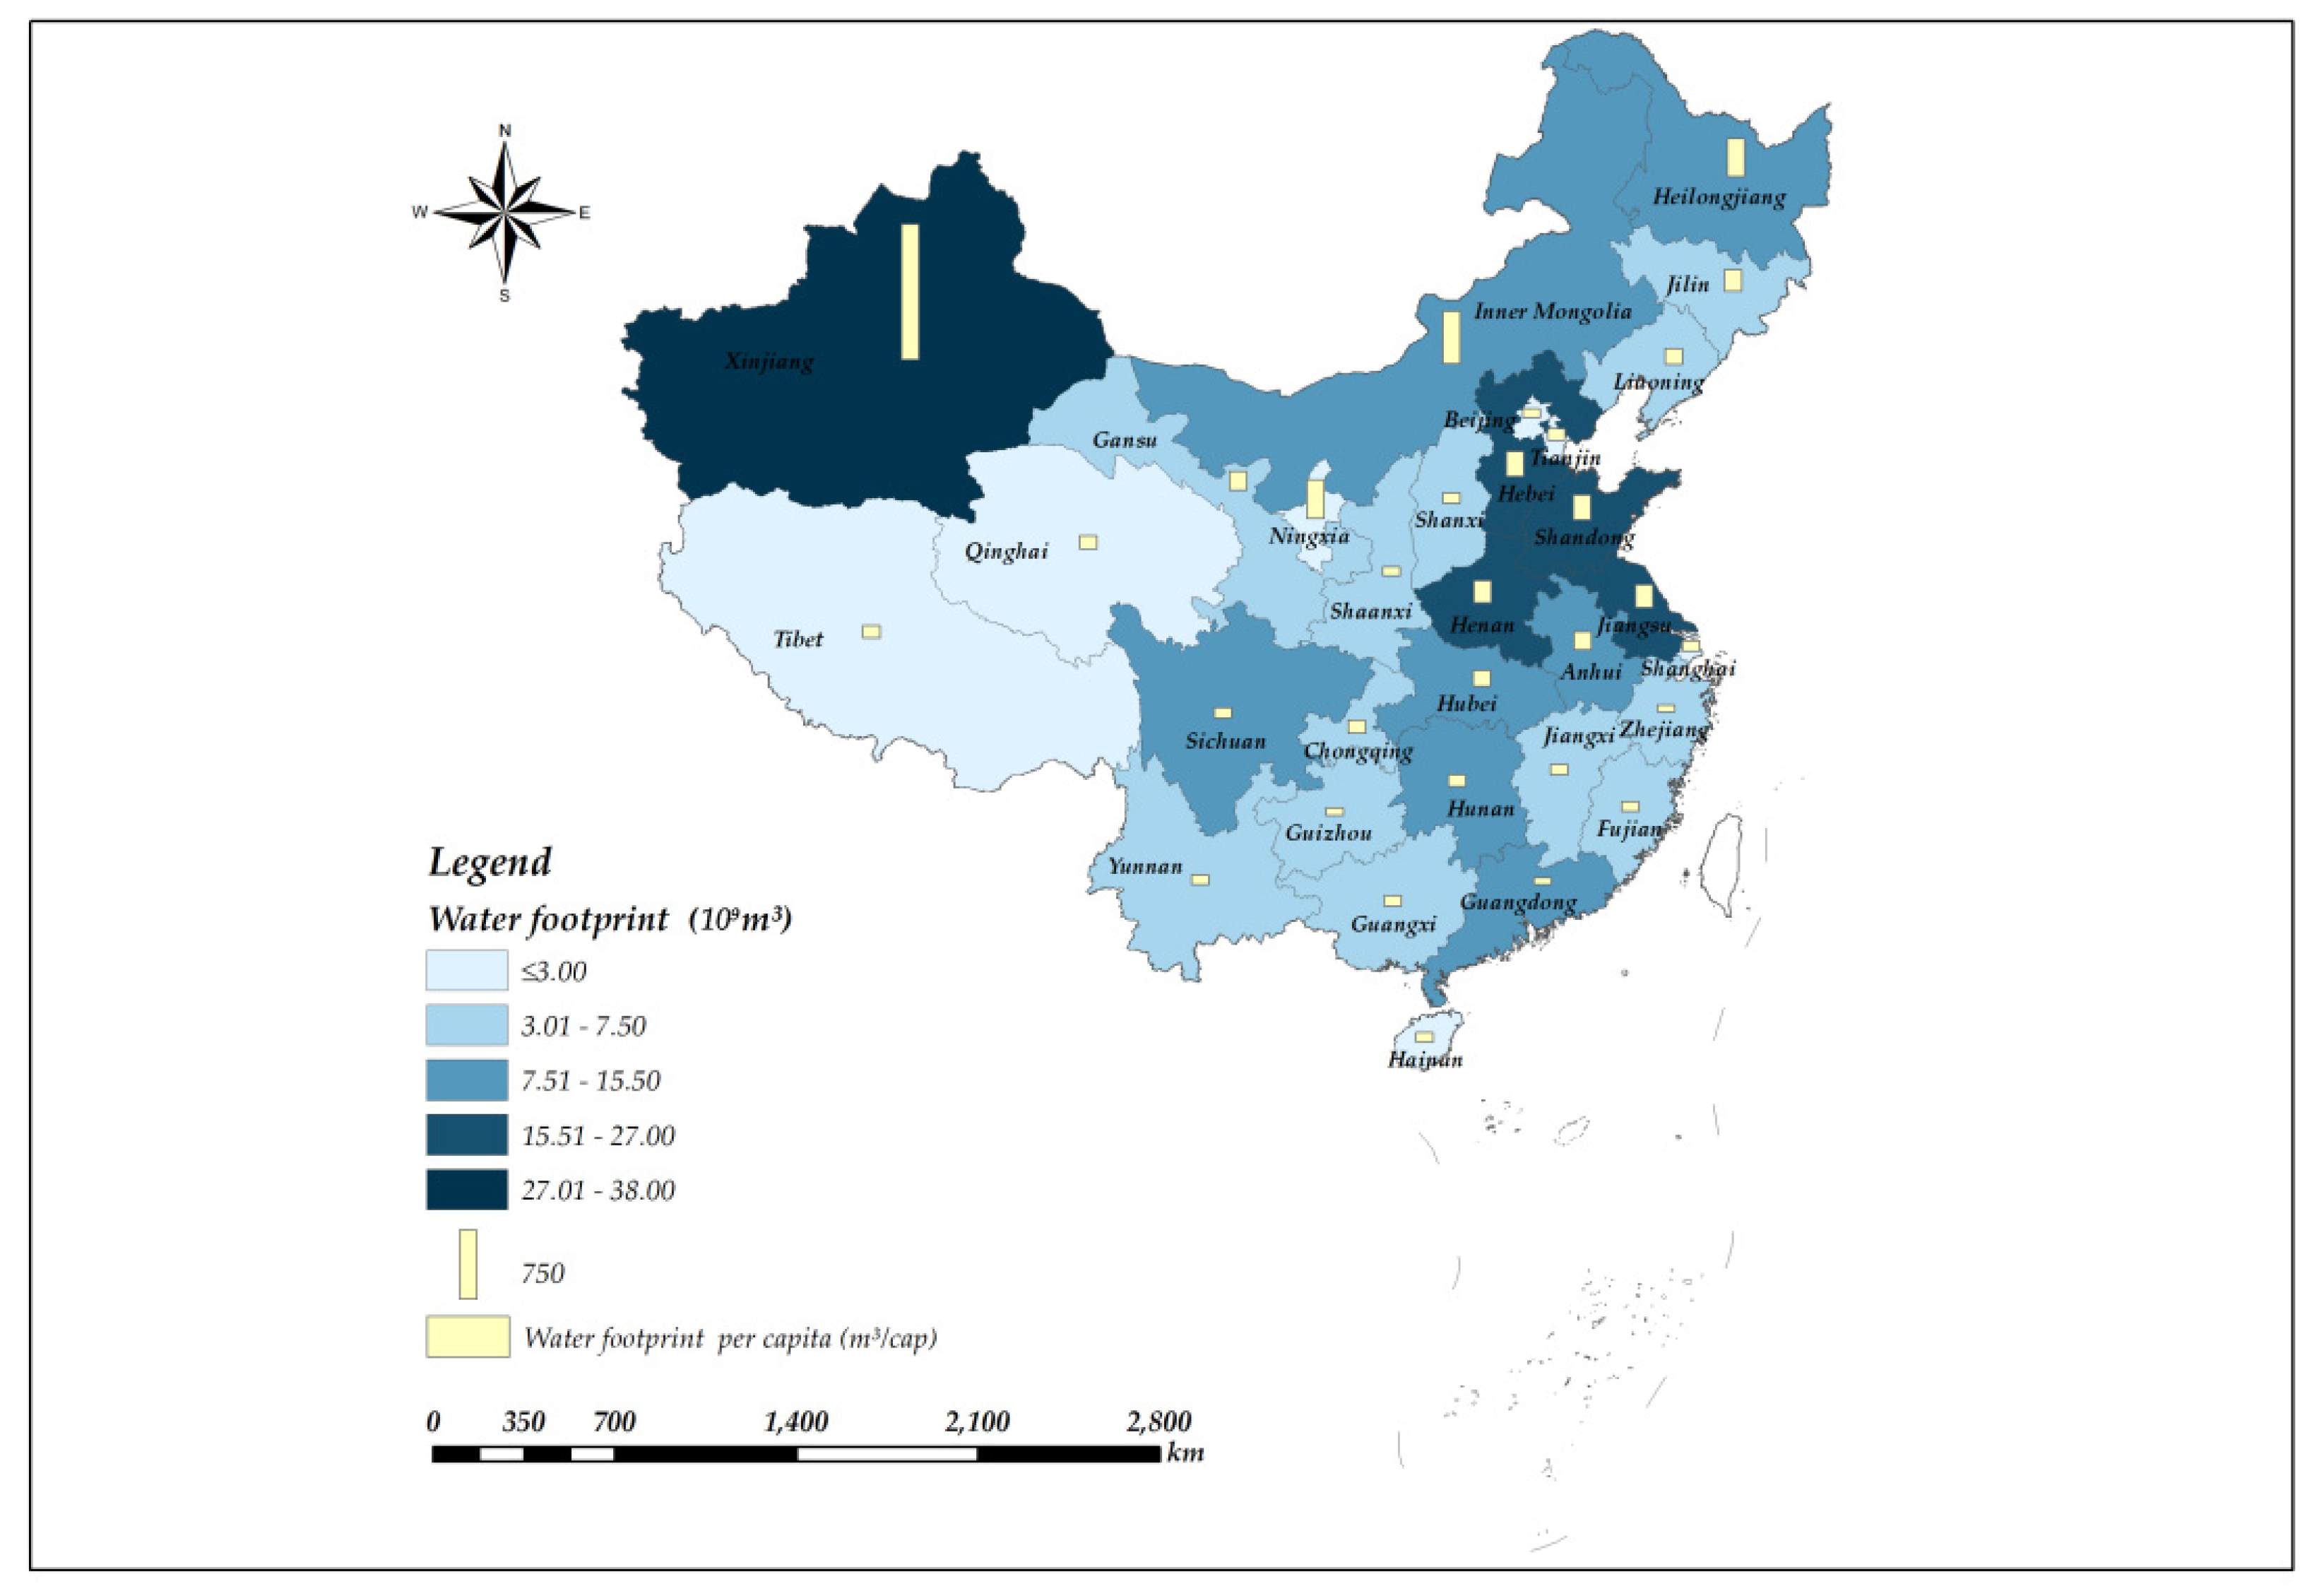
Figure 1. Spatial distribution of water footprint and water footprint per capita.
Water 13 03582 g001
Figure 2. The spatial distribution of total energy footprint and energy footprint per capita.
Water 13 03582 g002
Figure 3. The proportion of the energy footprint related to certain energy types in the total energy footprint.
Water 13 03582 g003
Figure 4. Classification of regions by water footprint, energy footprint and gross regional product. Note: the energy footprint data for Tibet was lacking.
Water 13 03582 g004
Figure 5. Classification by regions based on water footprint per capita, energy footprint per capita and gross regional product per capita.
Water 13 03582 g005
Table 1. Rankings for water footprint and water footprint per capita.
ProvincesRank for Water FootprintRank for Water Footprint per CapitaDifference of the Ranks
Xinjiang110
Shandong26−4
Henan38−5
Hebei45−1
Jiangsu57−2
Heilongjiang642
Inner Mongolia725
Anhui811−3
Hubei912−3
Sichuan1020−10
Table 2. Proportions of water footprint by sectors for the top ten water consumers.
ProvincesAgricultural Sector (%)Industrial Sector (%)Domestic Sector (%)Ecological Sector (%)
Xinjiang88.120.731.709.45
Shandong86.822.795.604.79
Henan79.194.577.219.03
Hebei85.242.095.157.52
Jiangsu56.3129.3812.981.34
Heilongjiang92.442.954.050.56
Inner Mongolia82.232.343.2112.22
Anhui68.6415.8911.094.39
Hubei57.3920.4720.981.16
Sichuan64.059.1722.424.36
Table 3. The ranks for energy footprint and energy footprint per capita.
ProvincesRank for Energy FootprintRank for Energy Footprint per CapitaDifference of the Ranks
Shandong16−5
Inner Mongolia220
Shanxi330
Jiangsu412−8
Hebei511−6
Liaoning651
Guangdong721−14
Xinjiang844
Zhejiang913−4
Henan1024−14
Publisher’s Note: MDPI stays neutral with regard to jurisdictional claims in published maps and institutional affiliations.