
Analysis of Regional Water and Energy Consumption Considering Economic Development


Abstract
:1. Introduction
2. Materials and Methods
2.1. Study Area
2.2. Methods
2.2.1. Water Footprint
2.2.2. Energy Footprint
2.3. Data Sources
3. Results
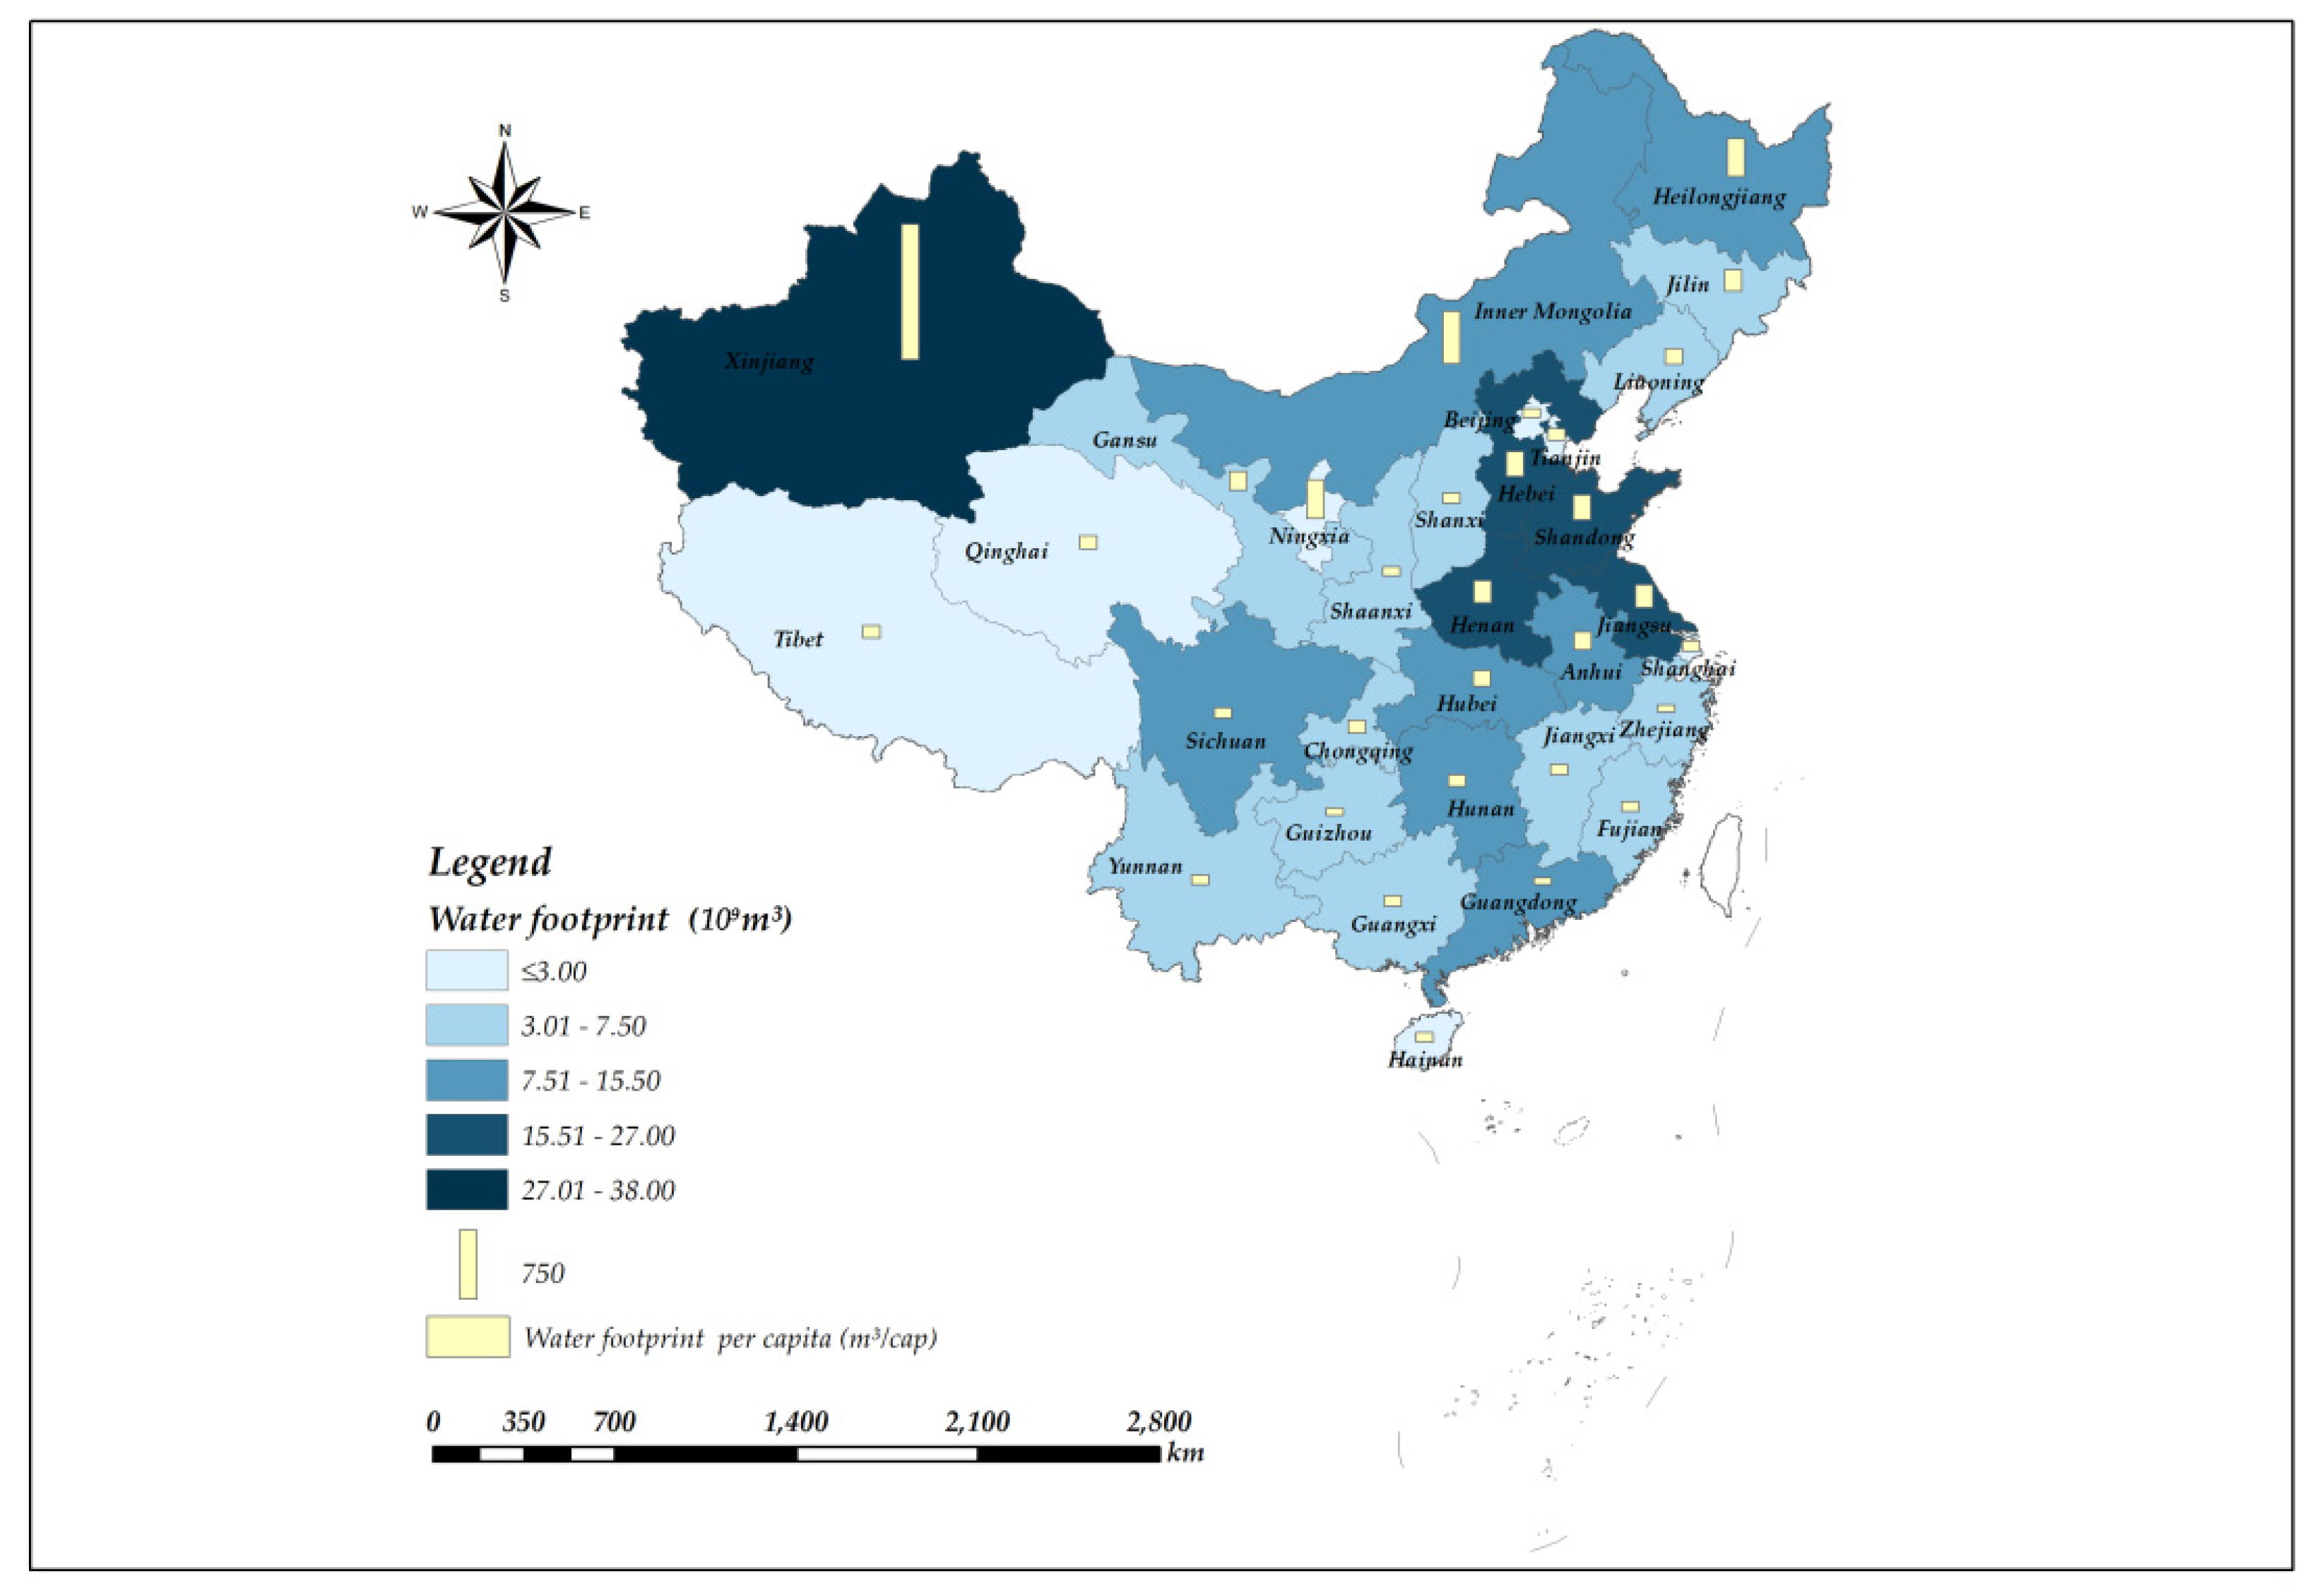
3.1. Water Footprint and Water Footprint per Capita
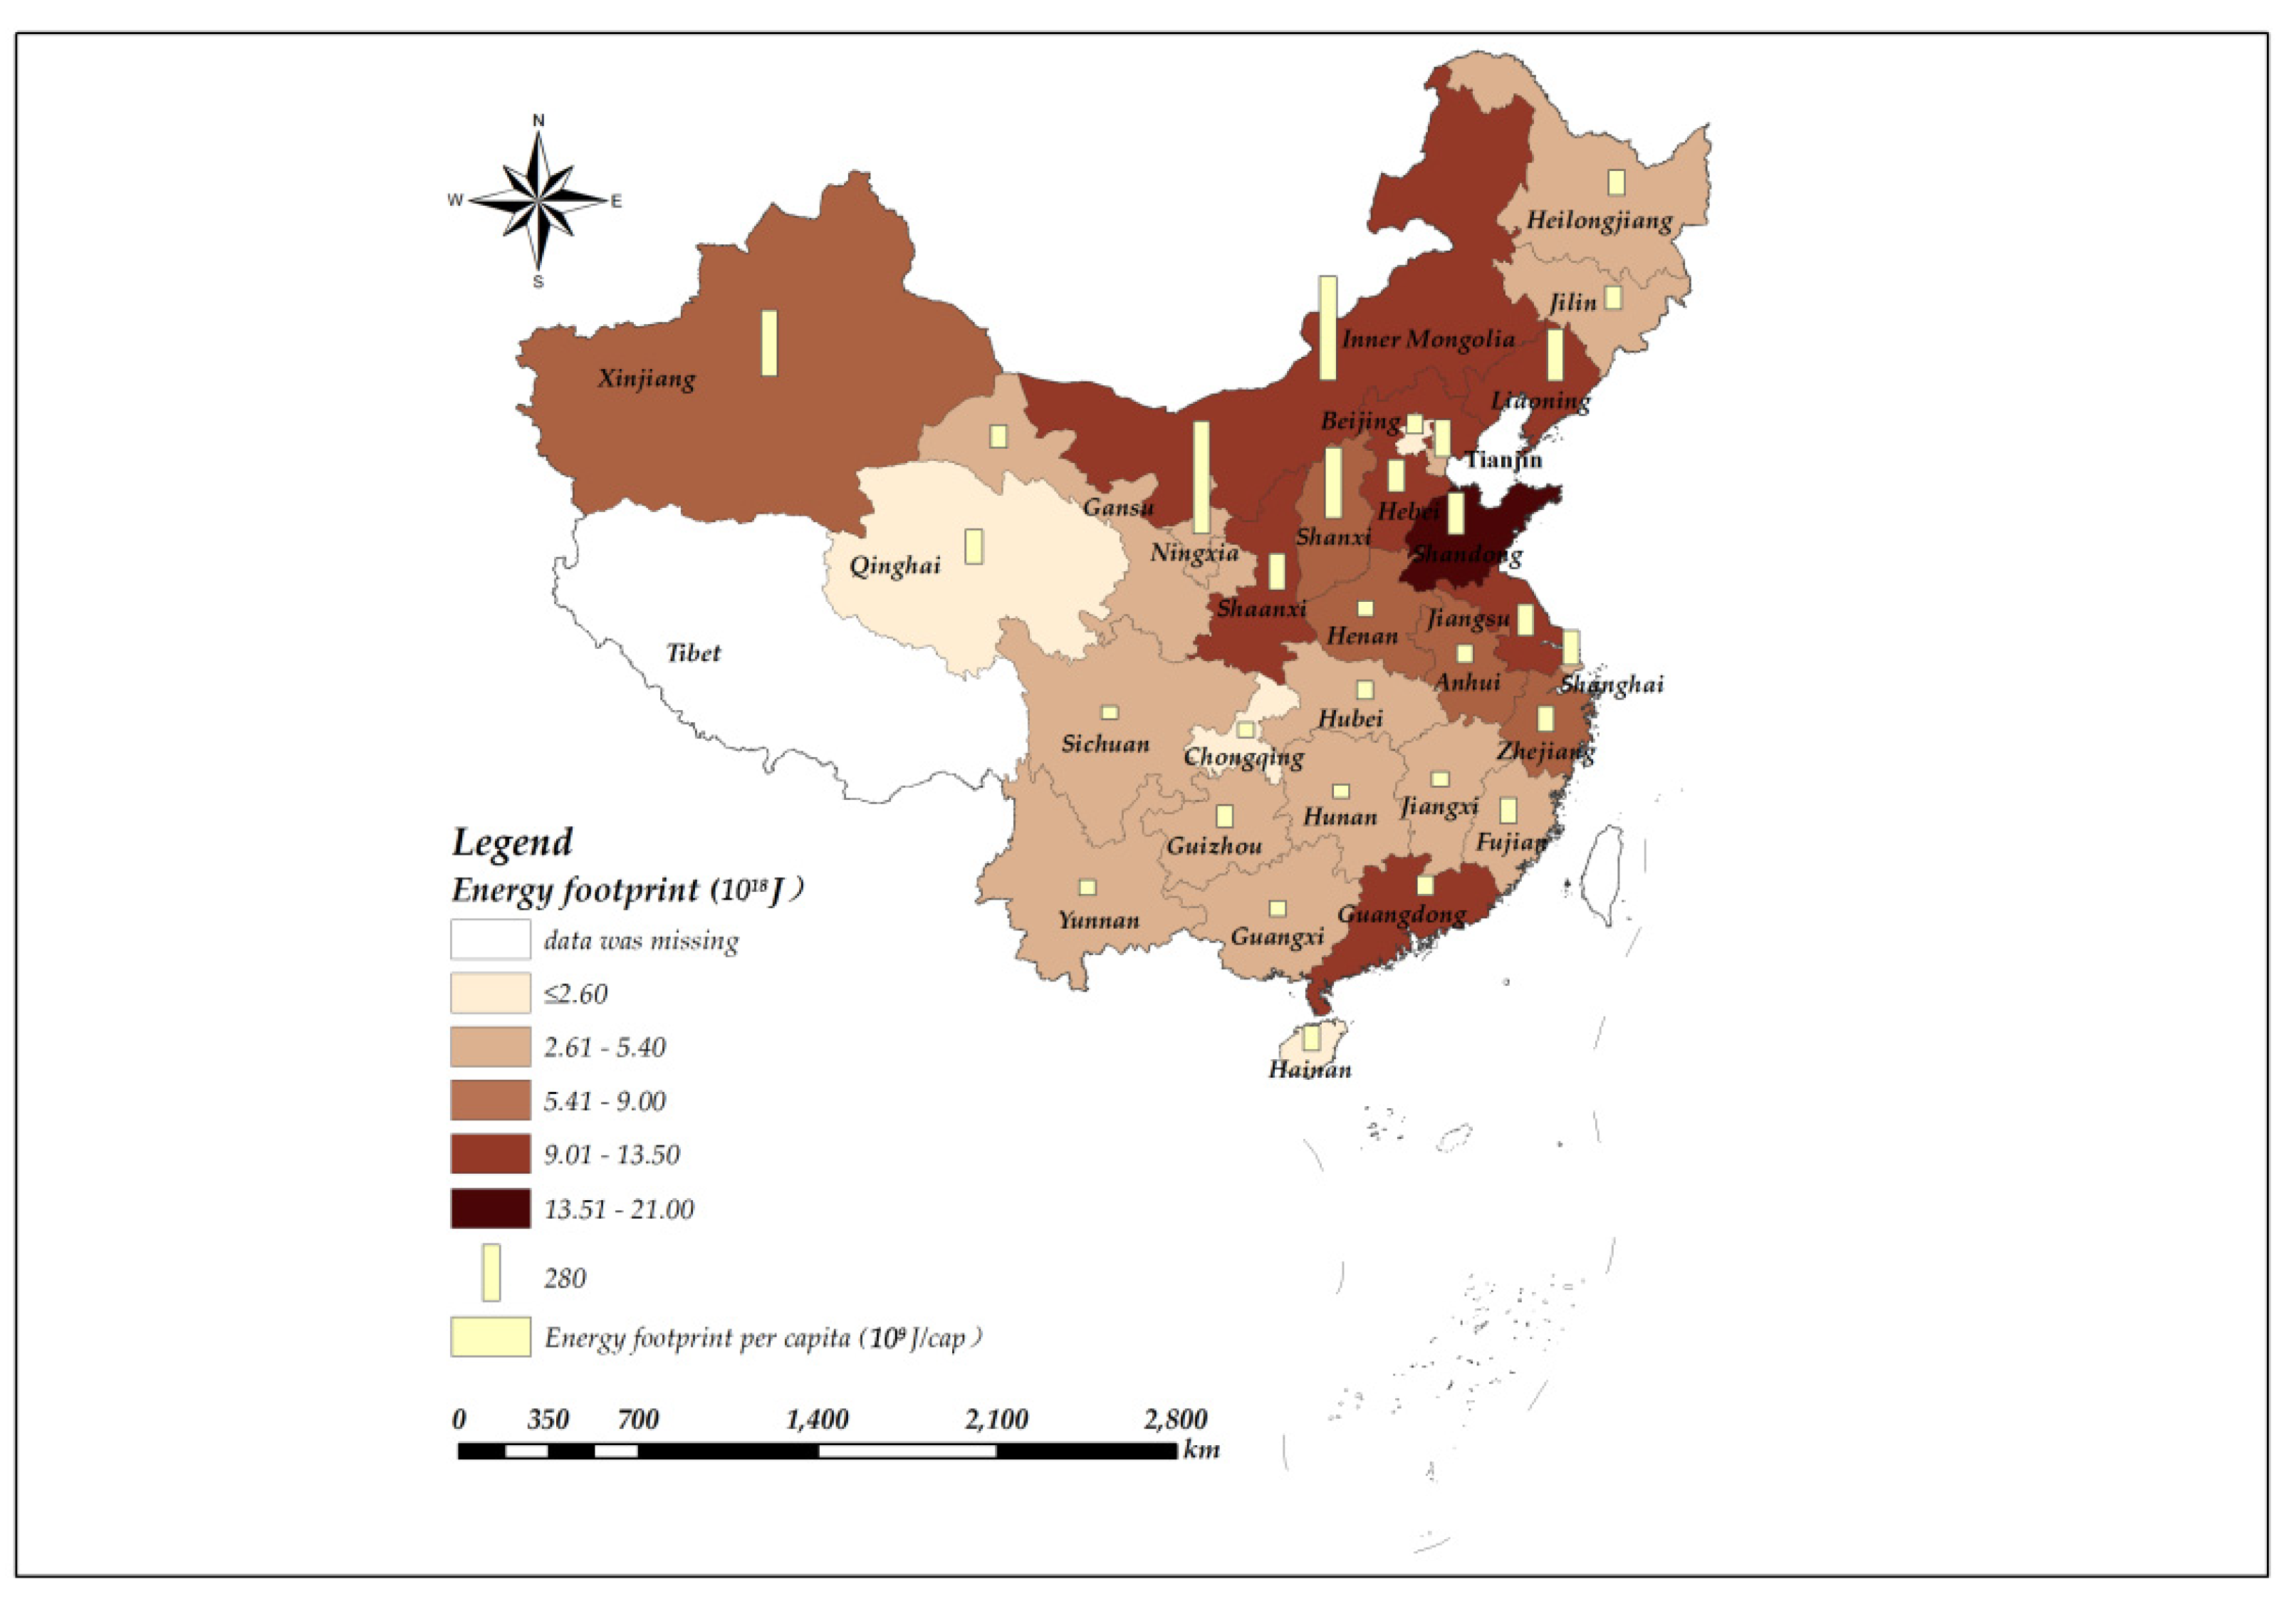
3.2. Energy Footprint and Energy Footprint per Capita
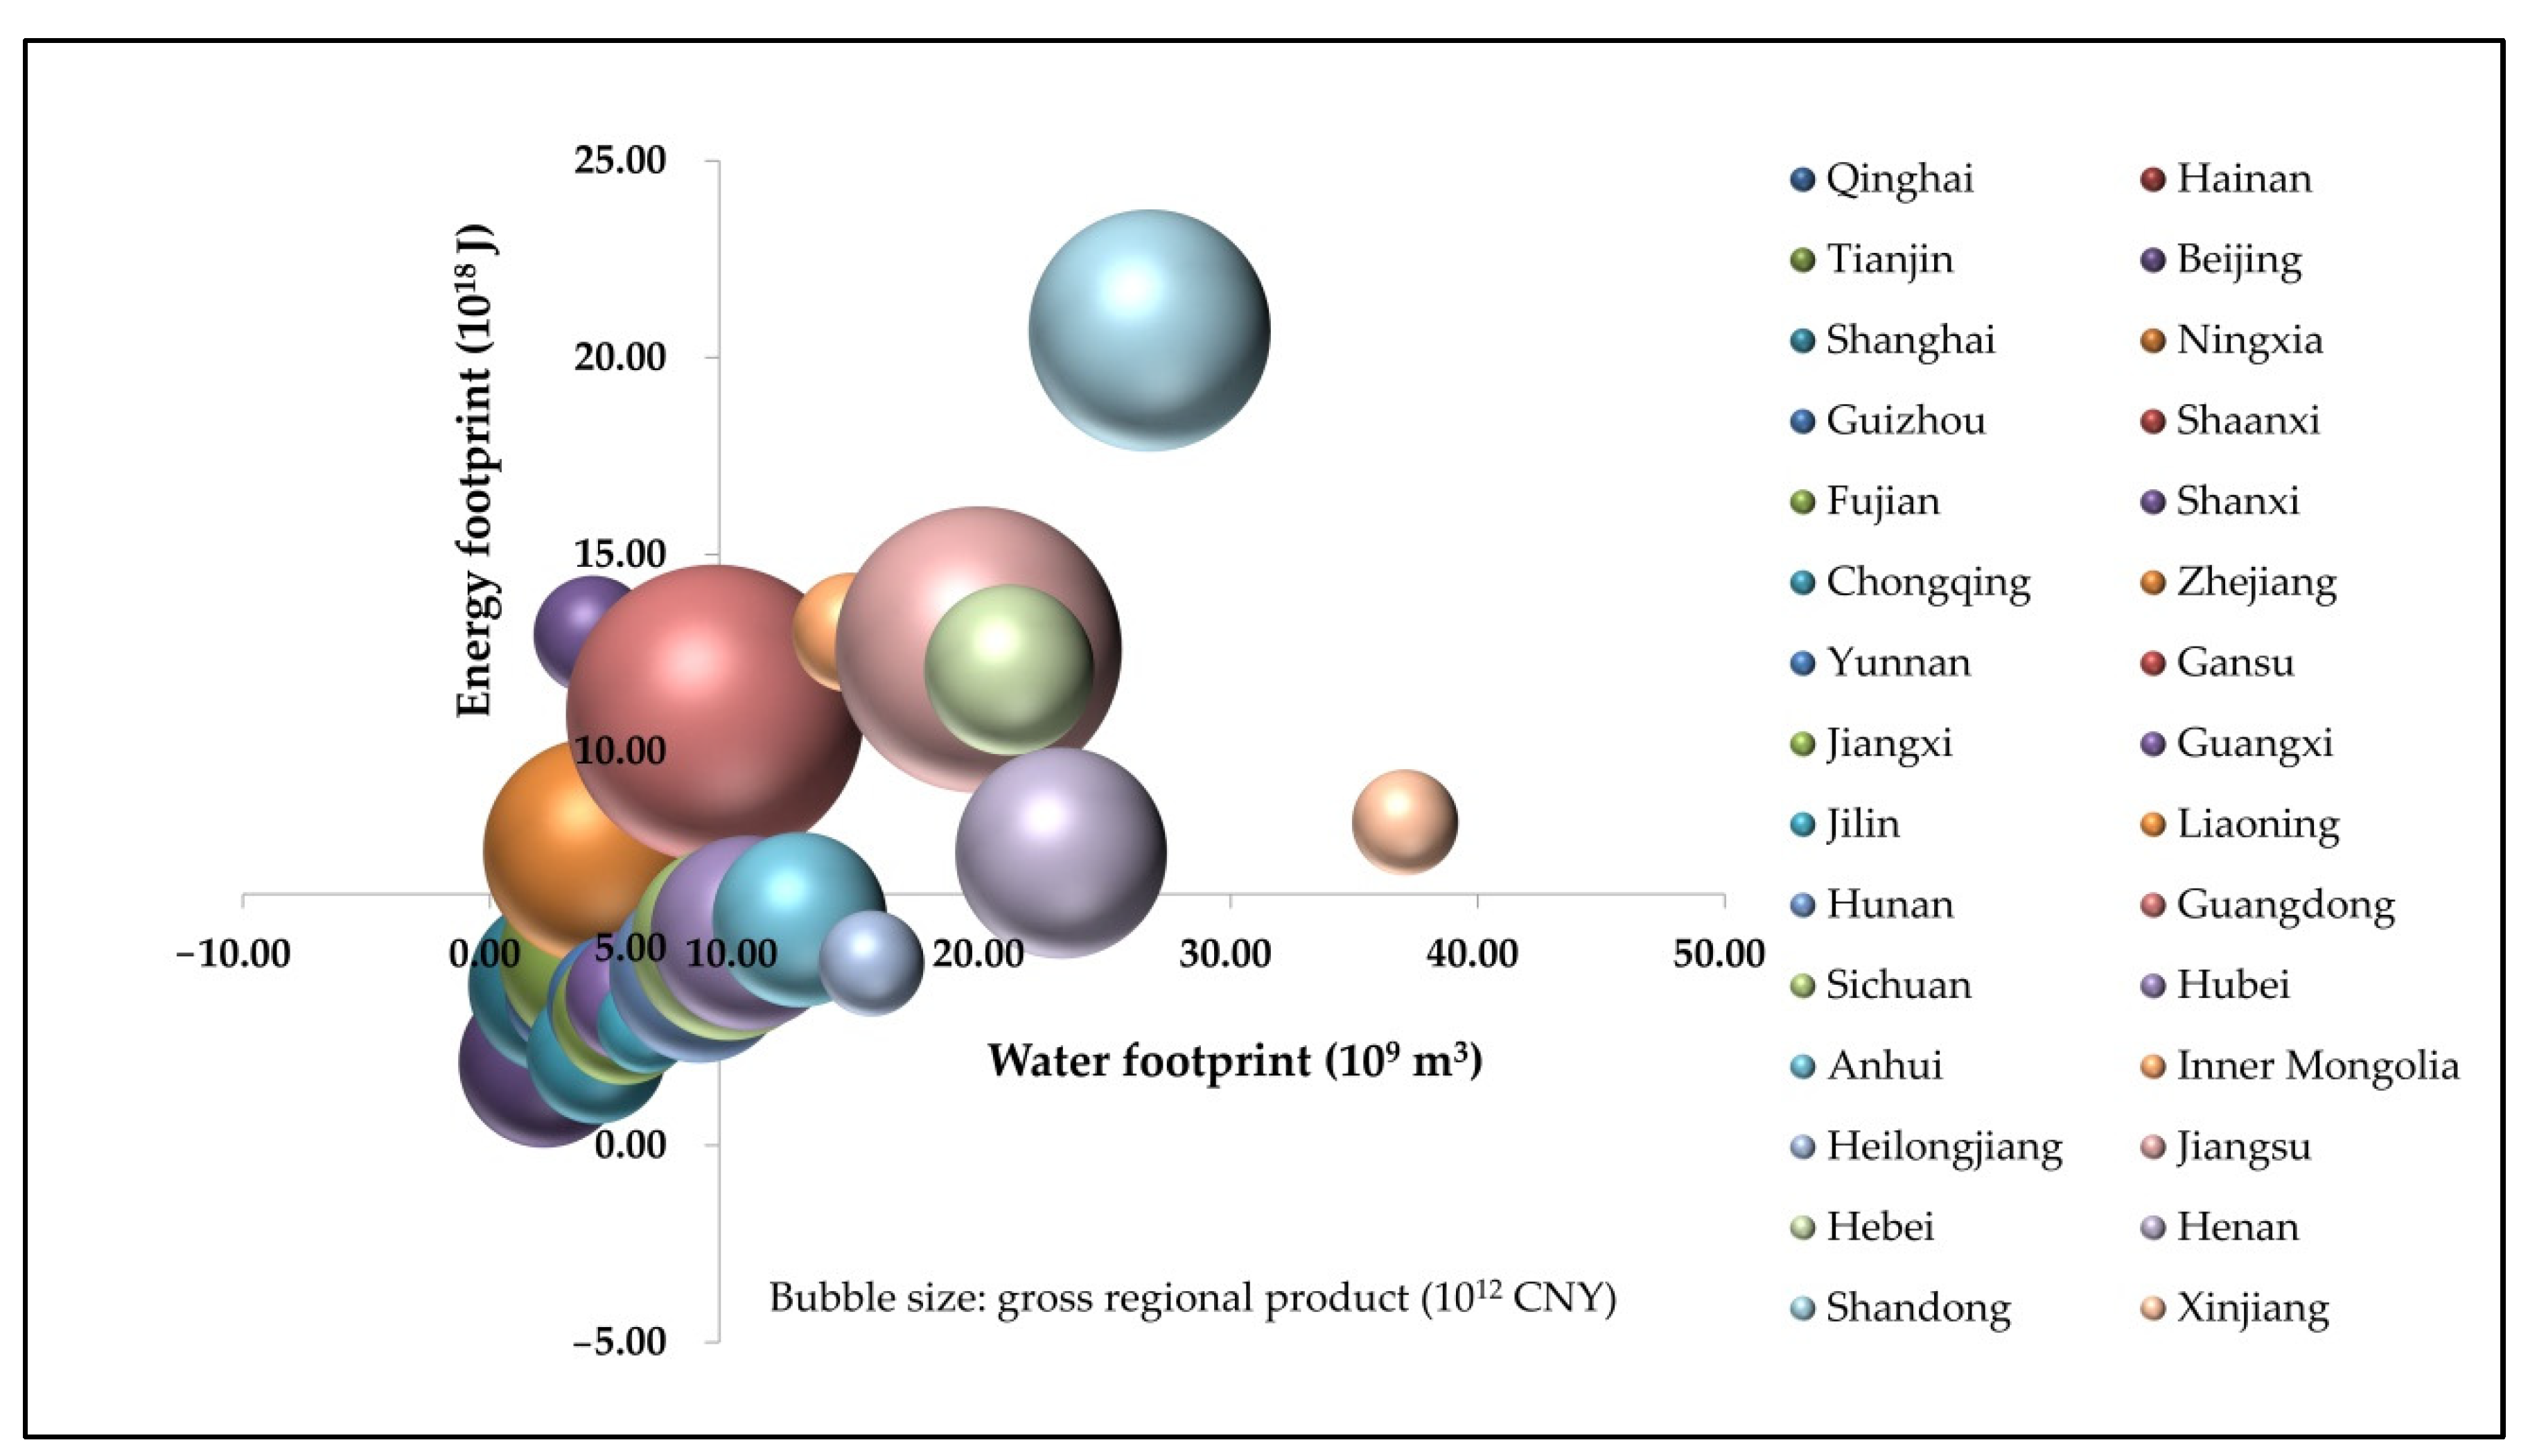
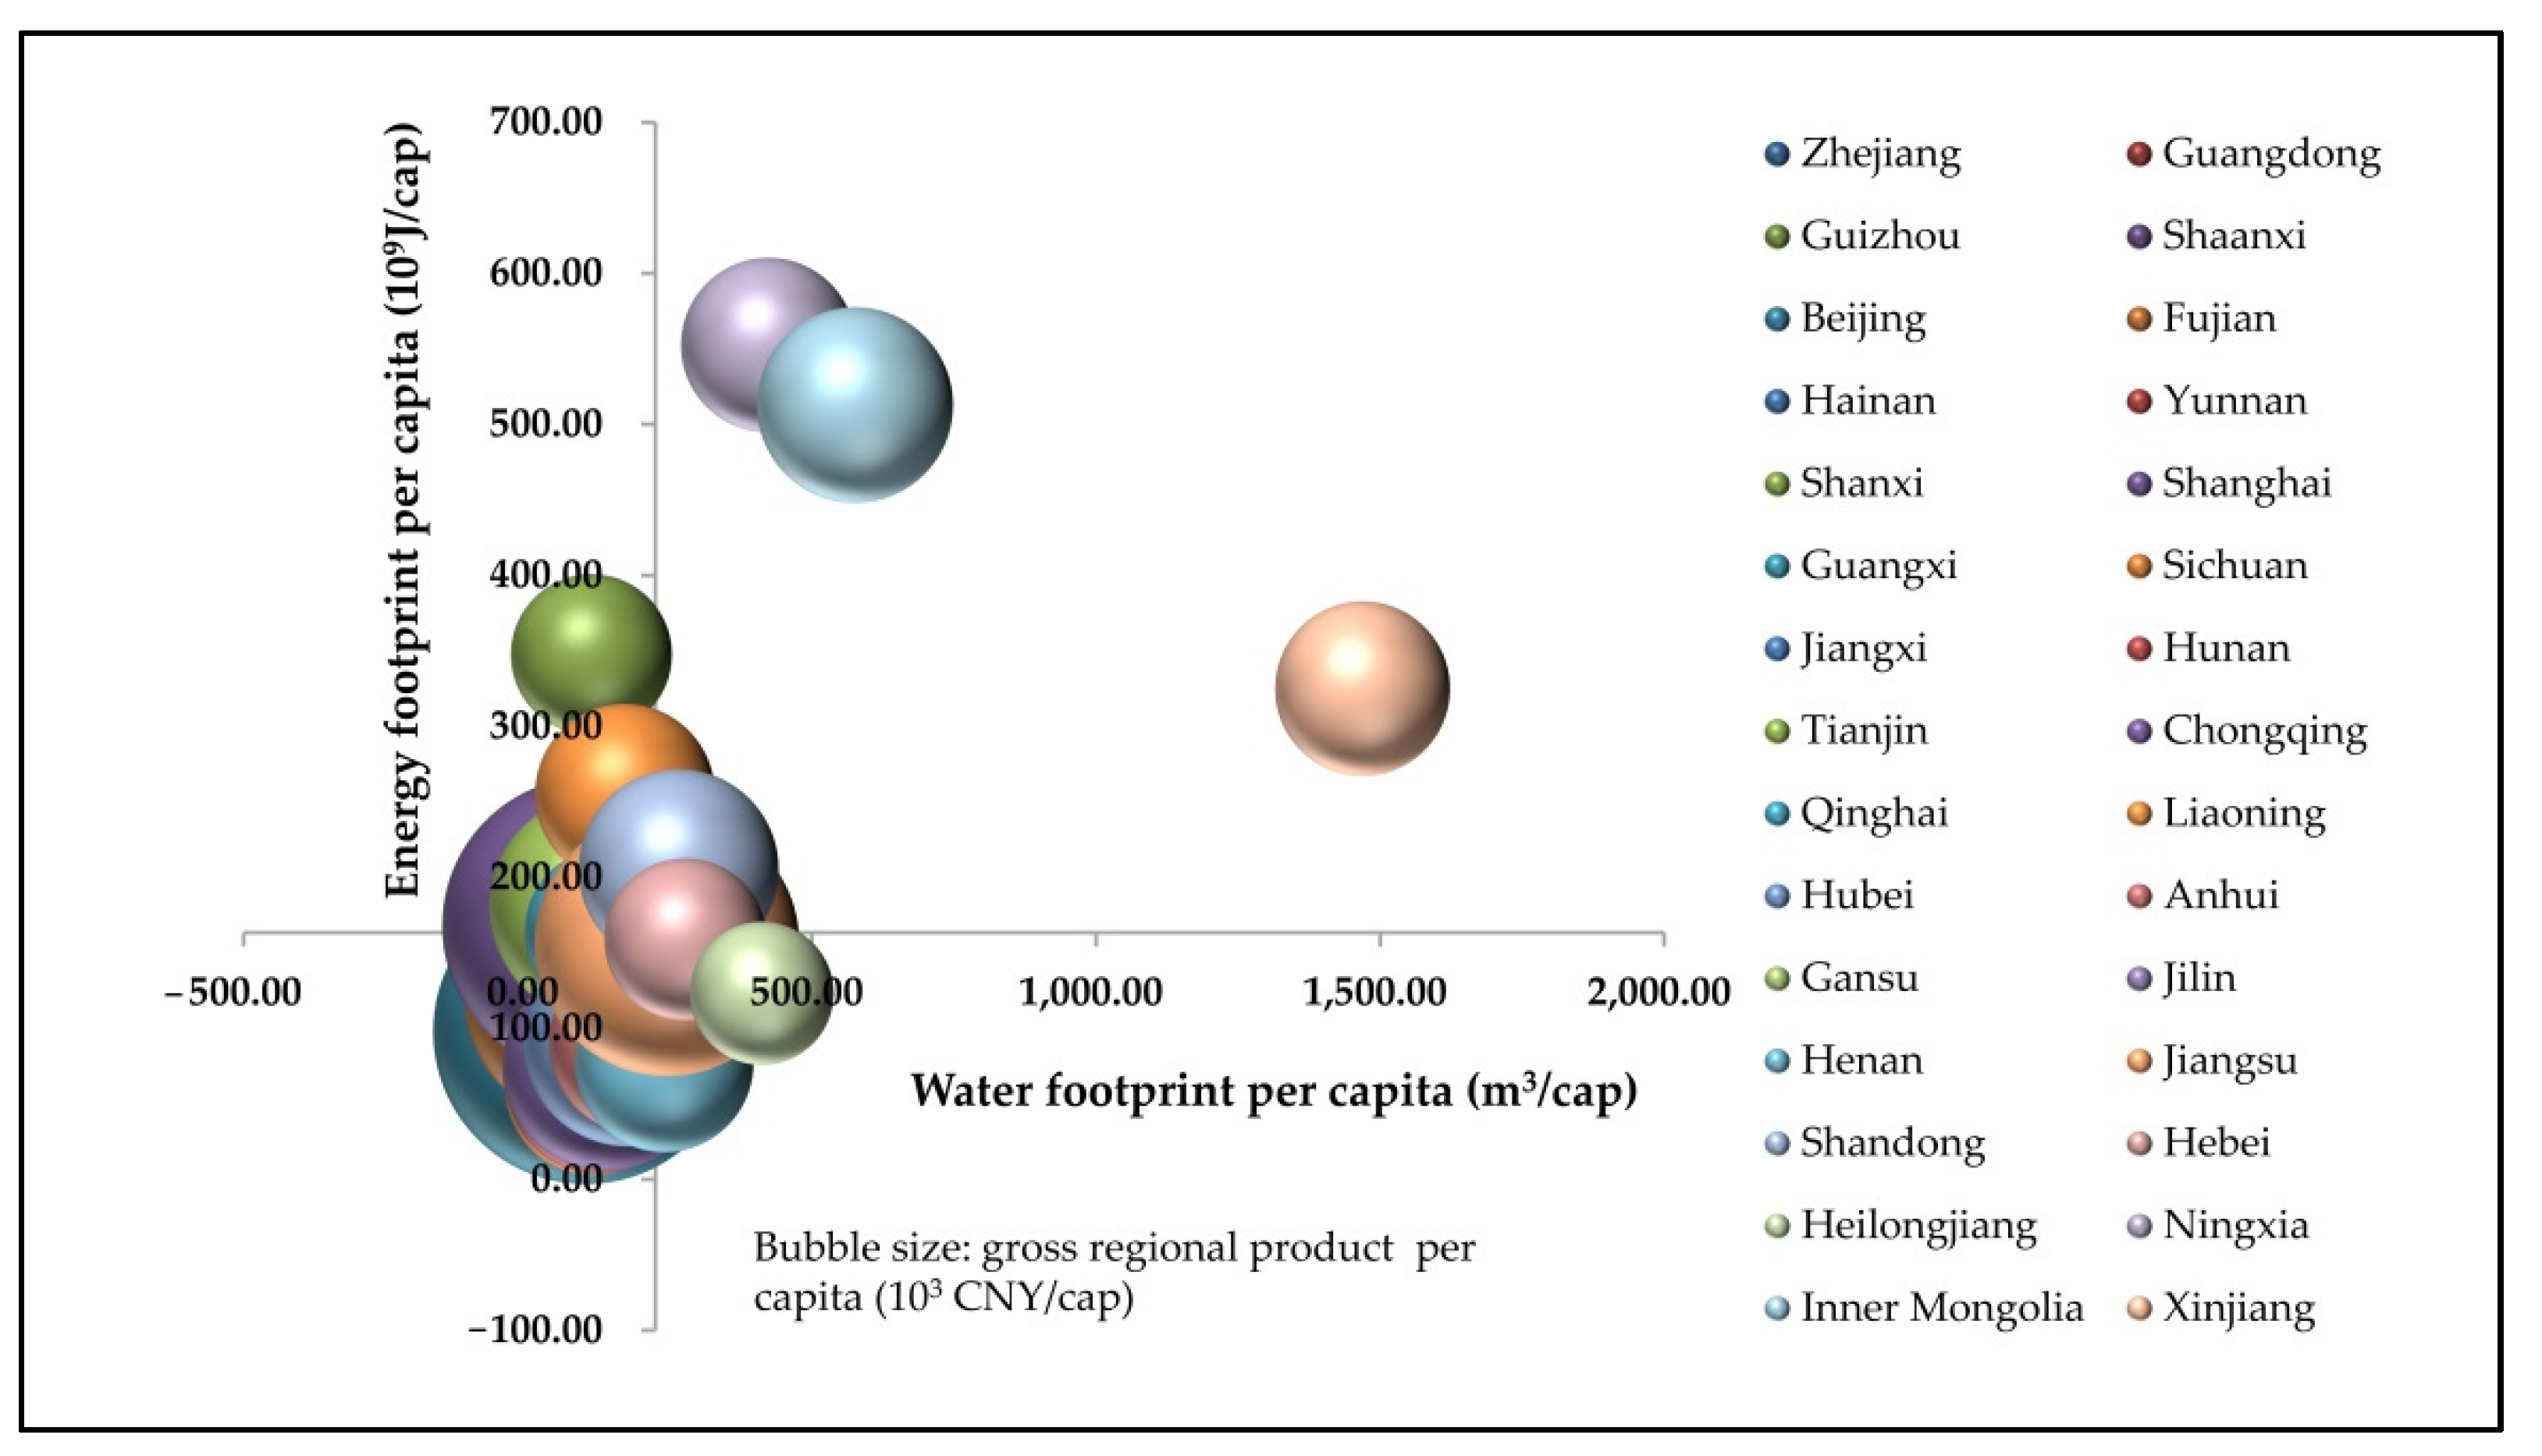
3.3. Analysis of Provincial Characteristics Based on Water Footprint, Energy Footprint and Gross Regional Product
4. Discussion
5. Conclusions
Author Contributions
Funding
Institutional Review Board Statement
Informed Consent Statement
Data Availability Statement
Conflicts of Interest
References
- United Nations Development Programme. Sustainable Development Goals. Available online: https://www.undp.org/sustainable-development-goals (accessed on 1 December 2021).
- Hoekstra, A.Y.; Chapagain, A.K.; Aldaya, M.M.; Mekonnen, M.M. The Water Footprint Assessment Manual: Setting the Global Standard; Earthscan: London, UK, 2011. [Google Scholar]
- Gerbens-Leenes, W.; Hoekstra, A.Y.; van der Meer, T.H. The water footprint of energy from biomass: A quantitative assessment and consequences of an increasing share of bio-energy in energy supply. Ecol. Econ. 2009, 68, 1052–1060. [Google Scholar] [CrossRef]
- Gerbens-Leenes, W.; Hoekstra, A.Y.; van der Meer, T.H. The water footprint of bioenergy. Proc. Natl. Acad. Sci. USA 2009, 106, 10219–10223. [Google Scholar] [CrossRef] [Green Version]
- Ridoutt, B.G.; Pfister, S. A revised approach to water footprinting to make transparent the impacts of consumption and production on global freshwater scarcity. Glob. Environ. Change Hum. Policy Dimens. 2010, 20, 113–120. [Google Scholar] [CrossRef]
- Hess, T.; Chatterton, J.; Daccache, A.; Williams, A. The impact of changing food choices on the blue water scarcity footprint and greenhouse gas emissions of the British diet: The example of potato, pasta and rice. J. Clean. Prod. 2016, 112, 4558–4568. [Google Scholar] [CrossRef] [Green Version]
- Rehkamp, S.; Canning, P. Measuring Embodied Blue Water in American Diets: An EIO Supply Chain Approach. Ecol. Econ. 2018, 147, 179–188. [Google Scholar] [CrossRef]
- Rushforth, R.R.; Ruddell, B.L. A spatially detailed blue water footprint of the United States economy. Hydrol. Earth Syst. Sci. 2018, 22, 3007–3032. [Google Scholar] [CrossRef] [Green Version]
- Bazrafshan, O.; Etedali, H.R.; Moshizi, Z.G.N.; Shamili, M. Virtual water trade and water footprint accounting of saffron production in Iran. Agric. Water Manag. 2019, 213, 368–374. [Google Scholar] [CrossRef]
- Zoumides, C.; Bruggeman, A.; Hadjikakou, M.; Zachariadis, T. Policy-relevant indicators for semi-arid nations: The water footprint of crop production and supply utilization of Cyprus. Ecol. Indic. 2014, 43, 205–214. [Google Scholar] [CrossRef]
- Zhang, W.; Zha, X.; Li, J.; Liang, W.; Ma, Y.; Fan, D.; Li, S. Spatiotemporal change of blue water and green water resources in the headwater of Yellow River Basin, China. Water Resour. Manag. 2014, 28, 4715–4732. [Google Scholar] [CrossRef]
- Ma, W.J.; Meng, L.H.; Yang, D.W. Spatiotemporal variations of agricultural water footprint and socioeconomic matching evaluation from the perspective of ecological function zone. Agric. Water Manag. 2021, 249, 106803. [Google Scholar] [CrossRef]
- Yu, D.; Ding, T. Assessment on the flow and vulnerability of water footprint network of Beijing city, China. J. Clean. Prod. 2021, 293, 126126. [Google Scholar] [CrossRef]
- Tian, X.; Chen, B.; Geng, Y.; Zhong, S.; Gao, C.; Wilson, J. Energy footprint pathways of China. Energy 2019, 180, 330–340. [Google Scholar] [CrossRef]
- Oswald, Y.; Owen, A.; Steinberger, J.K. Large inequality in international and intranational energy footprints between income groups and across consumption categories. Nat. Energy 2020, 5, 231–239. [Google Scholar] [CrossRef]
- Montoya, M.A.; Allegretti, G.; Bertussi, L.A.S.; Talamini, E. Renewable and non-renewable in the energy-emissions-climate nexus: Brazilian contributions to climate change via international trade. J. Clean. Prod. 2021, 312, 127700. [Google Scholar] [CrossRef]
- Springer, C. Assessing energy intensity and retrofit opportunities for the aluminum industry: Lessons from Vietnam. Resour. Conserv. Recycl. 2018, 131, 235–246. [Google Scholar] [CrossRef]
- Chen, X.; Li, C.; Tang, Y.; Li, L.; Du, Y.; Li, L. Integrated optimization of cutting tool and cutting parameters in face milling for minimizing energy footprint and production time. Energy 2019, 175, 1021–1037. [Google Scholar] [CrossRef]
- National Bureau of Statistics of the People’s Republic of China. Statistical Yearbook of China; China Statistical Press: Beijing, China, 2020. [Google Scholar]
- Xu, Z.; Chau, S.N.; Chen, X.; Zhang, J.; Li, Y.; Dietz, T.; Wang, J.; Winkler, J.A.; Fan, F.; Huang, B.; et al. Assessing progress towards sustainable development over space and time. Nature 2020, 577, 74–78. [Google Scholar] [CrossRef]
- Xie, Y.; Zhou, X. Income inequality in today’s China. Proc. Natl. Acad. Sci. USA 2014, 111, 6928–6933. [Google Scholar] [CrossRef] [Green Version]
- Liu, J.G.; Vina, A.; Yang, W.; Li, S.X.; Xu, W.H.; Zheng, H. China’s environment on a Meta coupled planet. Annu. Rev. Environ. Res. 2018, 43, 1–34. [Google Scholar] [CrossRef]
- National Bureau of Statistics of the People’s Republic of China. China Energy Statistical Yearbook; China Statistical Press: Beijing, China, 2020. [Google Scholar]
- Ministry of Water Resources of the People’s Republic of China. China Water Resources Bulletin; Water Resources and Electricity Press: Beijing, China, 2019. [Google Scholar]
- Liu, J.; Diamond, J. China’s environment in a globalizing world. Nature 2005, 435, 1179–1186. [Google Scholar] [CrossRef]
- Ouyang, Z.; Ouyang, Z.; Zheng, H.; Xiao, Y.; Polasky, S.; Liu, J.; Xu, W.; Wang, Q.; Zhang, L.; Xiao, Y.; et al. Improvements in ecosystem services from investments in natural capital. Science 2016, 352, 1455–1459. [Google Scholar] [CrossRef]
- Tharme, R. A global perspective on environmental flow assessment: Emerging trends in the development and application of environmental flow methodologies for rivers. River Res. Appl. 2013, 19, 397–441. [Google Scholar] [CrossRef]
- Arthington, A.H.; Bunn, S.E.; Poff, N.L.; Naiman, R.J. The challenge of providing environmental flow rules to sustain river ecosystems. Ecol. Appli. 2006, 16, 1311–1318. [Google Scholar] [CrossRef]
- Arthington, A.H. Comparative Evaluation of Environmental Low Assessment Techniques: Review of Holistic Methodologies; LWRRDC Occasional Paper 26/98; Canberra: Land and Water Resources Research and Development Corporatio: Canberra, Australia, 1998; ISBN 0642267456. [Google Scholar]
- King, J.M.; Tharme, R.E.; de Villiers, M.S. (Eds.) Environmental Flow Assessments for Rivers: Manual for the Building Block Methodology; WRC Report No TT 354/08, Updated Edition; Water Research Commission: Pretoria, South Africa, 2008. [Google Scholar]
- Liu, J.; Wu, P.T.; Wang, Y.B.; Zhao, X.; Sun, S.K.; Cao, X.C. Impacts of changing cropping pattern on virtual water flows related to crops transfer: A case study for the Hetao irrigation district, China. J. Sci. Food Agric. 2014, 94, 2992–3000. [Google Scholar] [CrossRef]
- Liu, J.; Sun, S.K.; Wu, P.T.; Wang, Y.B.; Zhao, X.N. Evaluation of crop production, trade, and consumption from the perspective of water resources: A case study of the Hetao irrigation district, China, for 1960–2010. Sci. Total Environ. 2015, 505, 1174–1181. [Google Scholar] [CrossRef] [PubMed]
- Mekonnen, M.M.; Hoekstra, A.Y. The Green, Blue and Grey Water Footprint of Crops and Derived Crop Products; Value of Water Research Report Series No. 47; UNESCO-IHE: Delft, The Netherlands, 2010. [Google Scholar]
- Mekonnen, M.M.; Hoekstra, A.Y. The Green, Blue and Grey Water Footprint of Farm Animals and Animal Products; Value of Water Research Report Series No. 48; UNESCO-IHE: Delft, The Netherlands, 2010. [Google Scholar]
- Zhang, W.; Hao, J. Measurement of China’s energy footprint and analysis of regional differences. Stat. Decis. 2020, 8, 93–97. [Google Scholar]
- Ministry of Agriculture of the People’s Republic of China. Agricultural Statistical Data of China; Chinese Agricultural Press: Beijing, China, 2020. [Google Scholar]
- Hoekstra, A.Y.; Chapagain, A.K. Water footprints of nations: Water use by people as a function of their consumption pattern. Water Resour. Manag. 2007, 21, 35–48. [Google Scholar] [CrossRef]
- Mekonnen, M.M.; Gerbens-Leenes, W. The water footprint of global food production. Water 2020, 12, 2696. [Google Scholar] [CrossRef]
- Zuo, Q.; Jiang, L.; Feng, Y.; Diao, Y. Spatiotemporal variation of ecological footprint of water resources in the provinces in the Yellow River Basin. J. Irrig. Drain. 2020, 39, 1–8. [Google Scholar]
- Zhang, Y.; Tian, Q.; Hu, H.; Yu, M. Water footprint of food consumption by Chinese residents. Int. J. Environ. Res. Public Health 2019, 16, 3979. [Google Scholar] [CrossRef] [Green Version]
- Yu, Y.; Hubacek, K.; Feng, K.; Guan, D. Assessing regional and global water footprints for the UK. Ecol. Econ. 2010, 69, 1140–1147. [Google Scholar] [CrossRef]
- Chouchane, H.; Hoekstra, A.Y.; Krol, M.S.; Mekonnen, M.M. The water footprint of Tunisia from an economic perspective. Ecol. Indic. 2015, 52, 311–319. [Google Scholar] [CrossRef] [Green Version]
- Alcott, B. Jevons’ paradox. Ecol. Econ. 2005, 54, 9–21. [Google Scholar] [CrossRef]
- Liu, J.; Wang, Y.; Yu, Z.; Cao, X.; Tian, L.; Sun, S.; Wu, P. A comprehensive analysis of blue water scarcity from the production, consumption, and water transfer perspectives. Ecol. Indic. 2017, 72, 870–880. [Google Scholar] [CrossRef]
- Vanham, D.; Mak, T.N.; Gawlik, B.M. Urban food consumption and associated water resources: The example of Dutch cities. Sci. Total Environ. 2016, 565, 232–239. [Google Scholar] [CrossRef] [PubMed]
- Ward, F.A.; Pulido-Velazquez, M. Water conservation in irrigation can increase water use. Proc. Natl. Acad. Sci. USA 2008, 105, 18215–18220. [Google Scholar] [CrossRef] [PubMed] [Green Version]
- Yang, Z.; Liu, H.; Xu, X.; Yang, T. Applying the water footprint and dynamic structural decomposition analysis on the growing water use in China during 1997–2007. Ecol. Indic. 2016, 60, 634–643. [Google Scholar] [CrossRef]
- Gleeson, T.; Wada, Y.; Bierkens, M.F.P.; Van Beek, L.P.H. Water balance of global aquifers revealed by groundwater footprint. Nature 2012, 488, 197–200. [Google Scholar] [CrossRef]
- Cao, X.C.; Zeng, W.; Wu, M.Y.; Guo, X.P.; Wang, W.G. Hybrid analytical framework for regional agricultural water resource utilization and efficiency evaluation. Agric. Water Manag. 2020, 231, 106027. [Google Scholar] [CrossRef]
- Zhao, X.; Tillotson, M.R.; Liu, Y.W.; Guo, W.; Yang, A.H.; Li, Y.F. Index decomposition analysis of urban crop water footprint. Ecol. Model. 2017, 348, 25–32. [Google Scholar] [CrossRef] [Green Version]
- Cao, X.C.; Xiao, J.F.; Wu, M.Y.; Zeng, W.; Huang, X. Agricultural water use efficiency and driving force assessment to improve regional productivity and effectiveness. Water Resour. Manag. 2021, 35, 2519–2535. [Google Scholar] [CrossRef]
- Bai, X.; Ren, X.; Khanna, N.Z.; Zhou, N.; Hu, M. Comprehensive water footprint assessment of the dairy industry chain based on ISO 14046: A case study in China. Resour. Conserv. Recycl. 2017, 132, 369–375. [Google Scholar] [CrossRef]
- Kan, D.; Huang, W. An empirical study of the impact of urbanization on industry water footprint in China. Sustainability 2020, 12, 2263. [Google Scholar] [CrossRef] [Green Version]
- Caldeira, C.; Quinteiro, P.; Castanheira, E.; Boulay, A.M.; Dias, A.C.; Arroja, L.; Freire, F. Water footprint profile of crop-based vegetable oils and waste cooking oil: Comparing two water scarcity footprint methods. J. Clean. Prod. 2018, 195, 1190–1202. [Google Scholar] [CrossRef]
- Shahmohammadi, S.; Steinmann, Z.; King, H.; Hendrickx, H.; Huijbregts, M.A.J.; Lifset, R. The influence of consumer behavior on energy, greenhouse gas, and water footprints of showering. J. Ind. Ecol. 2019, 23, 1186–1195. [Google Scholar] [CrossRef] [Green Version]
- Lutter, S.; Pfister, S.; Giljum, S.; Wieland, H.; Mutel, C. Spatially explicit assessment of water embodied in European trade: A product-level multi-regional input-output analysis. Glob. Environ. Chang. 2016, 38, 171–182. [Google Scholar] [CrossRef] [Green Version]
- Vanham, D.; Gawlik, B.M.; Bidoglio, G. Cities as hotspots of indirect water consumption: The case study of Hong Kong. J. Hydrol. 2019, 573, 1075–1086. [Google Scholar] [CrossRef]
- Arto, I.; Capellan-Perez, I.; Lago, R.; Bueno, G.; Bermejo, R. The energy requirements of a developed world. Energy Sustain. Dev. 2016, 33, 1–13. [Google Scholar] [CrossRef] [Green Version]
- Lan, J.; Malik, A.; Lenzen, M.; Mcbain, D.; Kanemoto, K. A structural decomposition analysis of global energy footprints. Appl. Energy 2016, 163, 436–451. [Google Scholar] [CrossRef]
- Ulucak, R.; Danish; Ozcan, B. Relationship between energy consumption and environmental sustainability in OECD countries: The role of natural resources rents. Resour. Policy 2020, 69, 101803. [Google Scholar] [CrossRef]
- Medved, S. Present and future ecological footprint of Slovenia-the influence of energy demand scenarios. Ecol. Model. 2006, 192, 25–36. [Google Scholar] [CrossRef]
- Lu, W.C. The interplay among ecological footprint, real income, energy consumption, and trade openness in 13 Asian countries. Environ. Sci. Pollut. Res. 2020, 27, 45148–45160. [Google Scholar] [CrossRef] [PubMed]
- Isman, M.; Archambault, M.; Konga, C.N.; Lin, D.; Iha, K.; Ouellet-Plamondon, C. Ecological footprint assessment for targeting climate change mitigation in cities: A case study of 15 Canadian cities according to census metropolitan areas. J. Clean. Prod. 2018, 174, 1032–1043. [Google Scholar] [CrossRef]
- Usman, O.; Akadiri, S.S.; Adeshola, I. Role of renewable energy and globalization on ecological footprint in the USA: Implications for environmental sustainability. Environ. Sci. Pollut. Res. 2020, 27, 30681–30693. [Google Scholar] [CrossRef]
- Elshimy, M.; El-Aasar, K.M. Carbon footprint, renewable energy, non-renewable energy, and livestock: Testing the environmental Kuznets curve hypothesis for the Arab world. Environ. Dev. Sustain. 2020, 22, 6985–7012. [Google Scholar] [CrossRef]
- Zhang, P.; Xu, Z.; Fan, W.; Ren, J.; Liu, R.; Dong, X. Structure dynamics and risk assessment of water-energy-food nexus: A water footprint approach. Sustainability 2019, 11, 1187. [Google Scholar] [CrossRef] [Green Version]
- Liu, J.; Cao, X.C.; Li, B.Q.; Yu, Z.B. Analysis of blue and green water consumption at the irrigation district scale. Sustainability 2018, 10, 305. [Google Scholar] [CrossRef] [Green Version]
- Bulsink, F.; Hoekstra, A.Y.; Booij, M.J. The water footprint of Indonesian provinces related to the consumption of crop products. Hydrol. Earth Syst. Sci. 2010, 14, 119–128. [Google Scholar] [CrossRef] [Green Version]
- Chapagain, A.K.; Hoekstra, A.Y.; Savenije, H.H.G. Water saving through international trade of agricultural products. Hydrol. Earth Syst. Sci. 2006, 10, 455–468. [Google Scholar] [CrossRef] [Green Version]
- Liu, J.; Savenije, H.H. Food consumption patterns and their effect on water requirement in China. Hydrol. Earth Syst. Sci. 2008, 12, 887–898. [Google Scholar] [CrossRef] [Green Version]
- Chen, S.; Tan, Y.; Liu, Z. Direct and embodied energy-water-carbon nexus at an inter-regional scale. Appl. Energy 2019, 251, 113401. [Google Scholar] [CrossRef]
- Zhang, X.X.; Zhao, X.; Li, R.S.; Mao, G.Q.; Tillotson, M.R.; Liao, X.W.; Zhang, C.; Yi, Y.J. Evaluating the vulnerability of physical and virtual water resource networks in China’s megacities. Resour. Conserv. Recycl. 2020, 161, 104972. [Google Scholar] [CrossRef]


| Provinces | Rank for Water Footprint | Rank for Water Footprint per Capita | Difference of the Ranks |
|---|---|---|---|
| Xinjiang | 1 | 1 | 0 |
| Shandong | 2 | 6 | −4 |
| Henan | 3 | 8 | −5 |
| Hebei | 4 | 5 | −1 |
| Jiangsu | 5 | 7 | −2 |
| Heilongjiang | 6 | 4 | 2 |
| Inner Mongolia | 7 | 2 | 5 |
| Anhui | 8 | 11 | −3 |
| Hubei | 9 | 12 | −3 |
| Sichuan | 10 | 20 | −10 |
| Provinces | Agricultural Sector (%) | Industrial Sector (%) | Domestic Sector (%) | Ecological Sector (%) |
|---|---|---|---|---|
| Xinjiang | 88.12 | 0.73 | 1.70 | 9.45 |
| Shandong | 86.82 | 2.79 | 5.60 | 4.79 |
| Henan | 79.19 | 4.57 | 7.21 | 9.03 |
| Hebei | 85.24 | 2.09 | 5.15 | 7.52 |
| Jiangsu | 56.31 | 29.38 | 12.98 | 1.34 |
| Heilongjiang | 92.44 | 2.95 | 4.05 | 0.56 |
| Inner Mongolia | 82.23 | 2.34 | 3.21 | 12.22 |
| Anhui | 68.64 | 15.89 | 11.09 | 4.39 |
| Hubei | 57.39 | 20.47 | 20.98 | 1.16 |
| Sichuan | 64.05 | 9.17 | 22.42 | 4.36 |
| Provinces | Rank for Energy Footprint | Rank for Energy Footprint per Capita | Difference of the Ranks |
|---|---|---|---|
| Shandong | 1 | 6 | −5 |
| Inner Mongolia | 2 | 2 | 0 |
| Shanxi | 3 | 3 | 0 |
| Jiangsu | 4 | 12 | −8 |
| Hebei | 5 | 11 | −6 |
| Liaoning | 6 | 5 | 1 |
| Guangdong | 7 | 21 | −14 |
| Xinjiang | 8 | 4 | 4 |
| Zhejiang | 9 | 13 | −4 |
| Henan | 10 | 24 | −14 |
Publisher’s Note: MDPI stays neutral with regard to jurisdictional claims in published maps and institutional affiliations. |
© 2021 by the authors. Licensee MDPI, Basel, Switzerland. This article is an open access article distributed under the terms and conditions of the Creative Commons Attribution (CC BY) license (https://creativecommons.org/licenses/by/4.0/).
Share and Cite
Liu, J.; Xie, N.; Yu, Z. Analysis of Regional Water and Energy Consumption Considering Economic Development. Water 2021, 13, 3582. https://doi.org/10.3390/w13243582
Liu J, Xie N, Yu Z. Analysis of Regional Water and Energy Consumption Considering Economic Development. Water. 2021; 13(24):3582. https://doi.org/10.3390/w13243582
Chicago/Turabian StyleLiu, Jing, Nimin Xie, and Zhongbo Yu. 2021. "Analysis of Regional Water and Energy Consumption Considering Economic Development" Water 13, no. 24: 3582. https://doi.org/10.3390/w13243582
APA StyleLiu, J., Xie, N., & Yu, Z. (2021). Analysis of Regional Water and Energy Consumption Considering Economic Development. Water, 13(24), 3582. https://doi.org/10.3390/w13243582