Article

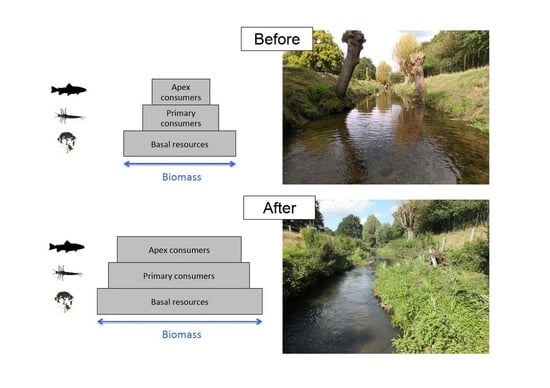
Putting the “Beaver” Back in Beverley Brook: Rapid Shifts in Community Composition following the Restoration of a Degraded Urban River

1
Integrated Research in Life and Health Sciences, Whitelands College, University of Roehampton, London SW15 4JD, UK
2
South East Rivers Trust, Carshalton SM5 2JG, UK
*
Author to whom correspondence should be addressed.
Water 2021, 13(24), 3530; https://doi.org/10.3390/w13243530
Submission received: 28 October 2021 / Revised: 2 December 2021 / Accepted: 5 December 2021 / Published: 9 December 2021
(This article belongs to the Special Issue River Restoration: Monitoring, Appraisal and Management)

Abstract

:
Widespread habitat degradation has caused dramatic declines in aquatic biodiversity. Reconfiguring channels and adding physical structures to rivers has become common practice in order to reinstate natural processes and restore biodiversity. However, the effectiveness of such measures is often questioned, especially in urban settings where overriding factors (e.g., water quality) might constrain biotic responses to increased habitat heterogeneity. We monitored invertebrate and fish communities before and up to five years after extensive restoration of Beverley Brook, a small, urban river flowing through a Royal Park in London, UK. Total invertebrate density was 5–148% higher with restoration across the monitoring period, and there was an increase in evenness but not invertebrate richness. Riverflies (Ephmemeroptera and Trichoptera) and crustaceans (Amphipoda, Asellidae) showed marked increases in density with restoration, suggesting improved flow, enhanced water quality, and greater quantity of basal resources. Fish biomass increased by 282% with restoration as did fish richness and the average body mass of three common fish species. Our results provide evidence for the effectiveness of common restoration methods in increasing standing stocks across trophic levels, from basal resources to apex predators. However, we primarily observed changes in the density of existing taxa rather than the development of novel assemblages, suggesting that large-scale factors, such as water quality and the lack of adequate source populations, might be important for understanding changes in biodiversity following river restoration.

Graphical Abstract

1. Introduction

Riverine habitats have a long history of degradation, especially in western Europe [1,2,3]. Industrialisation, urbanisation, and agricultural intensification have resulted in the widespread alteration of rivers and their floodplains, with associated stressors, such as pollution, habitat degradation, and overexploitation, recognized as driving declines in riverine biodiversity at local-to-global scales [4,5]. Whilst in many parts of the world, rivers have become increasingly managed, and water quality has improved, ecological recovery has been limited [6,7,8]. This points to habitat quality as a potentially constraining factor through the legacy of historical practices, such as river straightening, dredging, and clearance of large woody material, which have homogenized the physical features of river channels [1,3].
In recent years, there has been a growing awareness that the restoration of riverine habitats is essential to promote the key ecosystem services they provide, including drinking water, food production, and nutrient cycling [9]. The reconnection of rivers to their floodplains and the retention of natural features, such as in-stream debris, is now commonly employed for reinstating ecosystem processes (e.g., organic matter decomposition), restoring diversity (e.g., macroinvertebrates and fish), and improving the resilience of these important ecosystems to environmental change [10,11]. For instance, in Europe, river restoration is often used as a tool to improve the environmental status of rivers to meet legislative targets, such as the Water Framework Directive (2000/60/EC), and stakeholder demand (e.g., anglers). Installing large woody material, reconfiguring channels (e.g., through reestablishing meanders), or promoting the development of riparian vegetation are amongst the most common methods [12]. This reflects a dominant paradigm in ecological restoration that increasing habitat heterogeneity, i.e., the diversity of biotopes and meso-habitats [13], promotes greater biodiversity [14,15,16], with the guiding principle being “build it and they will come”.
However, evidence for the success of river restoration in improving species diversity through increases in habitat heterogeneity is contested [11,12,17]. Several factors are suggested to explain this. These include the lack of replication and suitable monitoring designs, whereby many studies lack appropriate before-after-control-impact (BACI) monitoring required to disentangle restoration signals from natural variation in space and time [18]. In addition, monitoring resources are typically limited, and extended temporal sampling (>2 years) is rarely feasible [11], so many monitoring programmes are short in duration and might encompass a time frame insufficient to observe ecological recovery [12,19]. Large-scale drivers, such as siltation and water quality, may also constrain ecological response to habitat restoration [20]. For instance, the majority of European rivers suffer from the combined impacts of both poor water quality (organic pollution, eutrophication, toxic compounds) and habitat degradation [21,22,23,24], including simplified habitat structure. Consequently, these impacts are unlikely to be independent, and biotic responses to increased habitat heterogeneity are likely to be constrained, to some extent, by poor water quality (i.e., high pollutant loads) or lack of a colonist pool in the region.
Here, we assess changes in community composition and diversity following extensive restoration of a degraded, urban river—Beverley Brook. Beverley is old English for “beavers’ meadow” and although beavers are no longer present, the name is a reminder that an abundance of large woody material is a natural state for many running waters in Europe. The man-made addition of large woody material was a key element in the restoration of this stream.
We used a BACI design, monitoring macroinvertebrate and fish assemblages, prior and up to 5 years post restoration. Our dataset spanning more than five years with continuous monitoring allows a robust assessment of the efficacy of typical river restoration techniques (e.g., additional of physical structures and re-configuring channels) on improving river biodiversity in a site impacted by poor water quality, conditions typical of rivers in semi-urban settings across the globe. We tested the following overarching hypotheses:
i.
Increased habitat heterogeneity through restoration increases the density of flow and pollution sensitive taxa, resulting in marked changes in the composition of invertebrate and fish assemblages.
ii.
Additional factors prevalent in urban settings constrain biotic responses to increased habitat heterogeneity resulting primarily in changes in the density of existing taxa rather than an increase in species richness.

2. Methods

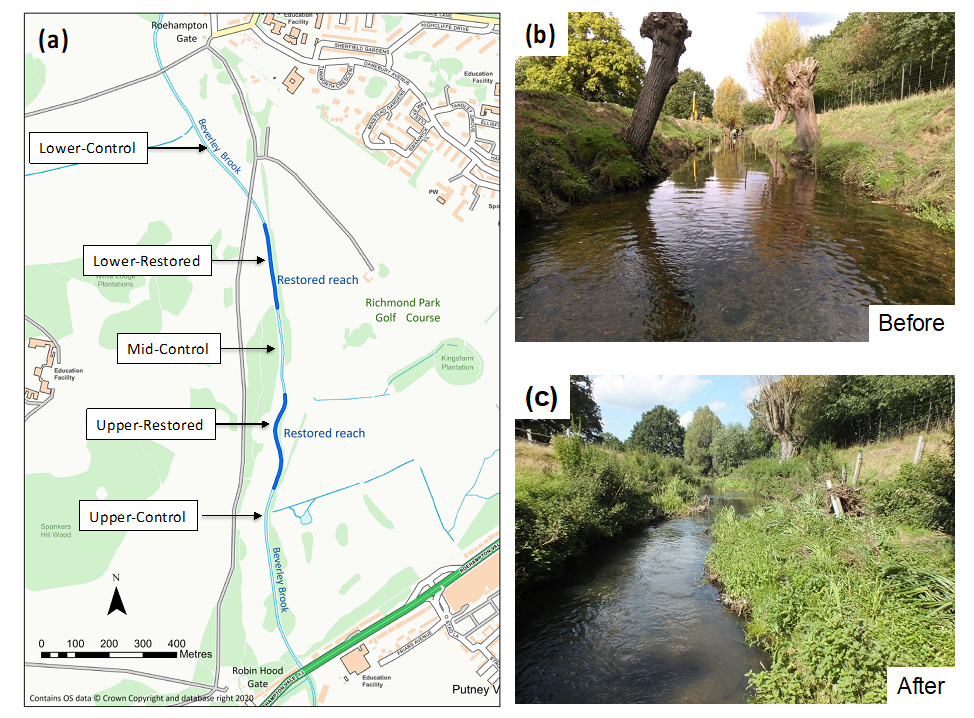
2.1. Description of Site and Restoration Works

Beverley Brook is a 14.3 km long river that meanders through multiple boroughs of South London, UK. It has been subject to continued urbanization, straightening and over-widening and impacts on water quality from upstream water treatment works [25]. As a Site of Special Scientific Interest (SSSI), the study site in Richmond Park (Figure 1), prior to the restoration, was failing to meet its target of “Good Ecological Potential” set by the Water Framework Directive, with the quality of macroinvertebrates and fish being recorded as “moderate” and “poor”, respectively.
Restoration work began mid-October 2015 as part of a partnership project carried out between The Royal Parks, Friends of Richmond Park, and the Environment Agency and led and delivered by the South East Rivers Trust. Two reaches within the Park were restored/enhanced, equating to a combined length of 600 m (350 m upstream with a break of 210 m then a further 250 m of enhancements; Figure 1a). The heavily modified, dredged, and incised channelized sections (Figure 1b) were addressed with a suite of restoration techniques, primarily aimed to restore energy back to the channel in order to enable natural river processes to reestablish. The methods implemented included channel narrowing and in-channel meandering using a combination of brash berms and back-filled faggots (Supporting Figure S1). A large number of complex Large Woody Material (LWM) features were installed, including root wads, to promote flow heterogeneity and scour and to provide habitat diversity (Figure S1). In order to exclude the high numbers of deer, which are synonymous with Richmond Park, both reaches were fenced and river gates erected. Finally, the constructed berms (Figure S1) were planted with a diverse mix of native, locally found macrophyte species. Restoration work to the channel was completed by December 2015. Post works, with the restored stream power resulting from the installed interventions, features developed rapidly, including pools, riffles, and in-channel bars (Figure 1c). Notably, the gravel bed, which had largely been smothered by sand and silt, was exposed and sorted into functioning riffles.

2.2. Monitoring Reaches

Five reaches were designated for biological monitoring, based upon the physical characteristics of the channel and other structures (bridges; Figure 1a). These included the upstream (Upper-Restored) and downstream (Lower-Restored) restored sections, which received improvement work (as described above). In order to assess baseline variation in biological indices in space and time, three control reaches were also monitored, where no improvement works were conducted. These included the reach immediately upstream of the Upper-Restored section (Upper-Control: 540 m), the reach between the two restored sections (Mid-Control: 210 m), and a downstream reach (Lower-Control: 570 m) below the restored sections (Figure 1a). All three control reaches are heavily modified, straight, and shallow, typical of most of the length of Beverley Brook. The data presented here come from separate monitoring programs, which did not monitor all of the five reaches continuously or conduct sampling at the same time (as outlined below).

2.3. Invertebrate Surveys

Macroinvertebrate diversity was assessed following the Environment Agency standard sampling protocol [26] in four (of the five) reaches: Upper-Control, Upper-Restored, Lower-Restored, and Lower-Control. Sampling was conducted in July 2015 (before restoration) and again in July 2018 (3 years post restoration). Each reach was sampled representatively along its whole length, ensuring that all habitats present were sampled with a standard size D-frame net (500-μm mesh aperture). A total sampling time of three minutes was used, with a further one minute spent inspecting submerged habitats, such as logs and larger stones, for attached animals. For areas of sand, gravel, or cobbles, kick sampling was employed whereby the substrate was disturbed with the foot and the invertebrates washed into the net held downstream. The emergent vegetation and submerged tree roots were sampled using vigorous repeated passes of the net through the habitat. Samples were preserved using 70% IMS (industrial methylated spirits) and later sorted in the laboratory, where all the invertebrates were extracted and counted. All invertebrates were identified to species were life history stage allowed, with the exception of the Dipteran families, which were typically identified to subfamily or genus level, as is standard for this group. Where counts for a particular taxon exceeded one hundred, subsampling was used to carry out the identification. A subsample of fifty individuals was extracted and identified and the total count then pro-rata’d if it was found that more than one species were present [27]. Condition assessment of assemblages from each reach was based on the BMWP (Biological Monitoring Working Party) score [28]. These BMWP scores are industry standard and reflect the sensitivity of the families to pollution. The higher the family score, the more sensitive to oxygen depletion the family is, and therefore, their presence indicates a cleaner or less impacted site. The effects of pollution generally are to impose a Biological Oxygen Demand upon the receiving waters, and so sensitive families are progressively excluded as the BOD increases. The score for each family present is totalled to give a site score. Because these site BMWP scores are influenced by sample size (a high score can be achieved through a large number of low scoring families as well as a small number of high scoring families), an Average Score Per Taxa (ASPT) is also calculated from the resulting BMWP scores and allows further interpretation of the results [28]. The higher the ASPT, the greater the proportion of more sensitive families in the sample and therefore the better the site condition.
Macroinvertebrate density and composition was quantified from 10 replicate Surber samples (0.25 cm × 0.25 cm, 500-μm mesh aperture) randomly taken in four (of the five) reaches: Upper-Control, Upper-Restored, Mid-Control, and Lower-Restored. Sampling was conducted yearly in early October from 2015 (immediately prior to restoration) to 2020 (five years post-restoration work). Samples were preserved in 70% IMS and later sorted in the laboratory, where all the invertebrates were extracted, and the number of individuals in each of the following groups was recorded: Amphipoda, Asellidae, Bivalvia, Chironomidae, Ephemeroptera, Gastropoda, Hirudinea, Oligochaeta, Plecoptera, Simuliidae, Trichoptera (cased), Trichoptera (caseless), Zygoptera, and Miscellaneous (i.e., remaining taxa, including Acari and Platyhelminthes).

2.4. Fish Surveys

Fish surveys were undertaken in four (of the five) reaches before restoration work in July 2015: Upper-Control, Upper-Restored, Lower-Restored, and Lower-Control. All five reaches were surveyed in the follow-up survey in August 2020 (5 years after restoration work). Quantitative depletion electrofishing was undertaken in representative 50–100-m sections within each reach, enclosed with stop nets (mesh size: 10 mm2), using dual anodes and a generator-powered set-up. Each survey consisted of a standard two- to three-pass depletion procedure [29]. All fish captured were identified to species and measured (fork length) to the nearest millimetre. Individual body mass (wet mass) was estimated from length-mass relationships (Supporting Information Table S1). Fish density (individuals m−2) was estimated using iterative maximum weighted likelihood statistics [30].

2.5. Habitat Surveys

To investigate physical changes in the river following restoration, habitat surveys were undertaken in four (of the five) reaches in October 2018 (3 years after restoration work): Upper-Control, Upper-Restored, Mid-Control, and Lower-Restored. Using a bathyscope, proportions of silt, sand, and gravel substrate were estimated visually to the nearest 5% as well as “percentage volume infested” of woody material (>1-cm diameter) and plant occupancy [31]. Water velocity (m s−1) was measured at 50% depth using a flow meter at each survey point. Coarse particulate organic matter (CPOM) was collected from within the bathyscope area using a handnet (1-mm mesh). Back at the laboratory, this material was dried at 60 °C until constant mass and weighed on precision balance. All habitat measurements were repeated fifteen times in each reach to account for spatial variability within reaches.

2.6. Data Analysis

Due to the lower number of statistical samples for some sampling techniques (invertebrate kick sampling and electrofishing), it was not possible to perform BACI statistical analyses in a single pass for all datasets [32]. Instead, density, diversity, and biomass data were split into three subsets for analysis [31]: (1) spatial (baseline) variation, unrelated to the restoration, was assessed using control-before and impact (restored)-before data; and (2) control-after and impact-after data were used to test for restoration effects; and (3) temporal variation, potentially unrelated to the restoration, was assessed using control-before and control-after data. As habitat surveys were only conducted once, after restoration, it was only possible to compare control-after and impact-after differences.

2.7. Density Analysis

We tested variation in total invertebrate density as well as the density of each taxonomic group (Table 1) using the invertebrate Surber data. We also calculated two indices that are widely employed to monitor river invertebrate communities and response to environmental change: the total density of Ephemeroptera, Plecoptera, and Trichoptera [11] (EPT density, henceforth), and the total density of taxa included the Anglers’ Riverfly Monitoring Initiative, which includes EPT taxa as well as Gammaridae (Amphipoda) [33] (ARMI density, henceforth). Each response variable was modelled using linear mixed-effects (LMM) models implemented within the lme4 package in R [34]. We included “section” (levels: Upstream and Downstream) as a random term to account for hierarchical structure and non-independence of data points within treatments. That is, the levels for the variable Treatment (Control and Restored) contain both an upstream (Upper-Control, Upper-Restored) and downstream (Mid-Control, Lower-Restored) reach. In an initial set of models, we assessed baseline variation in total, ARMI, and EPT density by assessing the significance of the variable Treatment (levels: Control and Restored) for the before (2015) data. In a second set of models run on post-restoration (2016–2020) data, we assessed restoration effects and, their temporal variability, for all responses by fitting Period (levels: year 1 to year 5), Treatment (levels: Control and Restored), and their interaction as fixed terms. Finally, we assessed temporal variation in total, ARMI, and EPT density, potentially unrelated to restoration, by assessing variation in the control before (2015) and after (2016–2020) restoration. All models were fitted using restricted maximum likelihood (REML) and validated by visually checking the distribution of residuals for normality and homoscedasticity [35]. The p-values of the fixed effects were estimated using the Kenward–Roger correction from the R LmerTest package. We estimated the variances explained by fixed terms (r2marginal) and by the combination of fixed plus random terms (r2conditional), using the method provided by [36].

2.8. Diversity Analysis

Sample-size based diversity curves were constructed for both invertebrate (kick sampling) and fish survey data using the iNext package in R [37]. This approach models the cumulative number of taxa as a function of increasing number of individuals in a sample and therefore provides a robust way of comparing diversity where sample sizes differ [38].
We constructed α-diversity (i.e., Hill number qD, where q = 0) and Shannon-diversity (q = 1) sample-size based diversity curves in three separate analyses: (1) baseline variation between Treatment (levels: Control and Restored) prior to restoration, (2) variation between Treatment (levels: Control and Restored) post restoration, and (3) temporal variation in control data pre and post restoration. Sample-size independent estimates of diversity can be achieved by extrapolating the diversity curve to a larger sample size, guided by an estimated asymptotic diversity [38]. As recommended, we extrapolated the diversity curves (and 95% confidence intervals around the estimated values) up to double the smallest sample size or the largest observed sample size between contrasts (e.g., Control and Restored), whichever was larger [37,38]. We then compared the estimates of diversity (richness and Shannon) and their confidence intervals at these fixed sample sizes (Table 1). If the 95% confidence intervals do not overlap for any given sample size in the comparison range (whether interpolated or extrapolated), then significant differences among the estimates are guaranteed at a level of 5% [37].

2.9. Fish Body Mass and Biomass Analysis

Fish assemblage biomass was estimated for each treatment based upon the sum of all individual body masses. We expressed fish biomass per unit area (m−2) and per unit length (m−1) to account for the differences in stream width resulting from restoration (Figure 1 and Figure S1). We analysed differences in individual body mass between treatments for five focal fish species, where sample sizes were sufficiently large (>30 individuals in each treatment). Body masses for each species were modelled using a LMM approach (as described above), fitting Treatment (levels: Control and Restored) as a fixed factor and “section” (levels: Upstream and Downstream) as a random term.

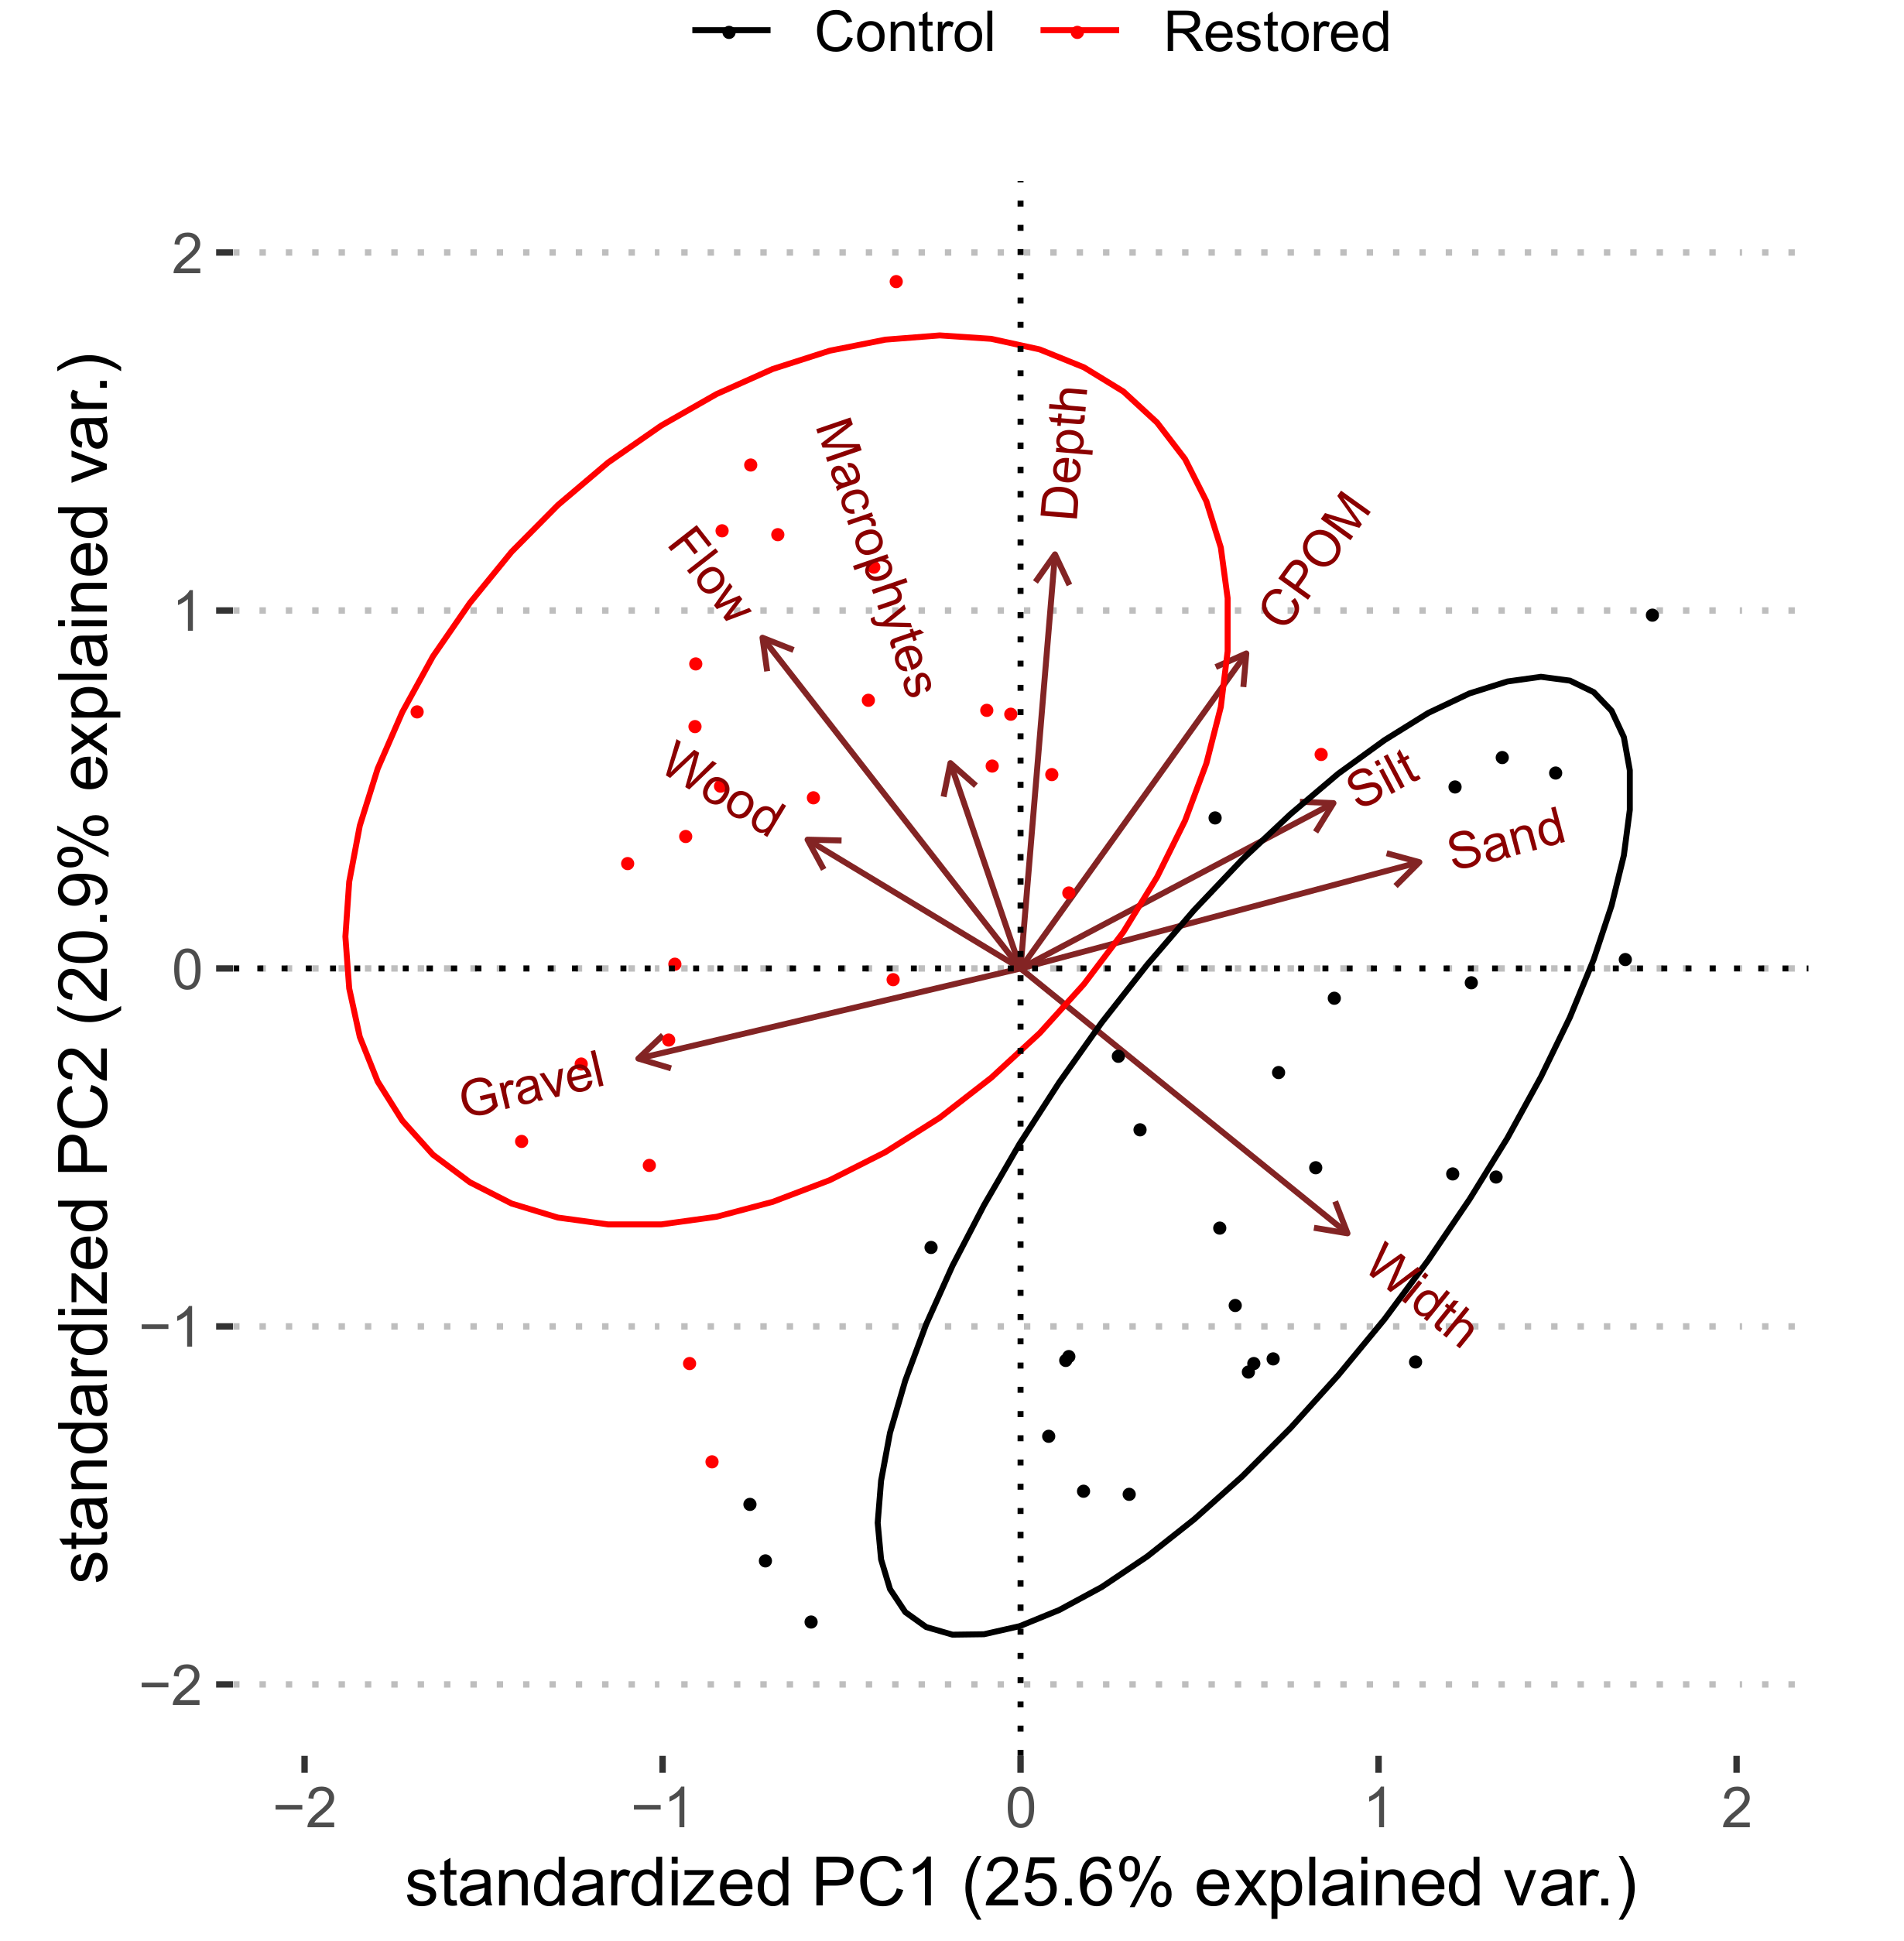
2.10. Environmental Analysis

Principal component analysis was used to ordinate the environmental and habitat data. Permutation tests (n = 999) were used to evaluate the significance of observed differences between Treatment (levels: Control and Restored, n = 60 for both levels). All multivariate analyses were performed in R using the vegan package [39].

3. Results

3.1. Baseline Conditions (Pre-Restoration)
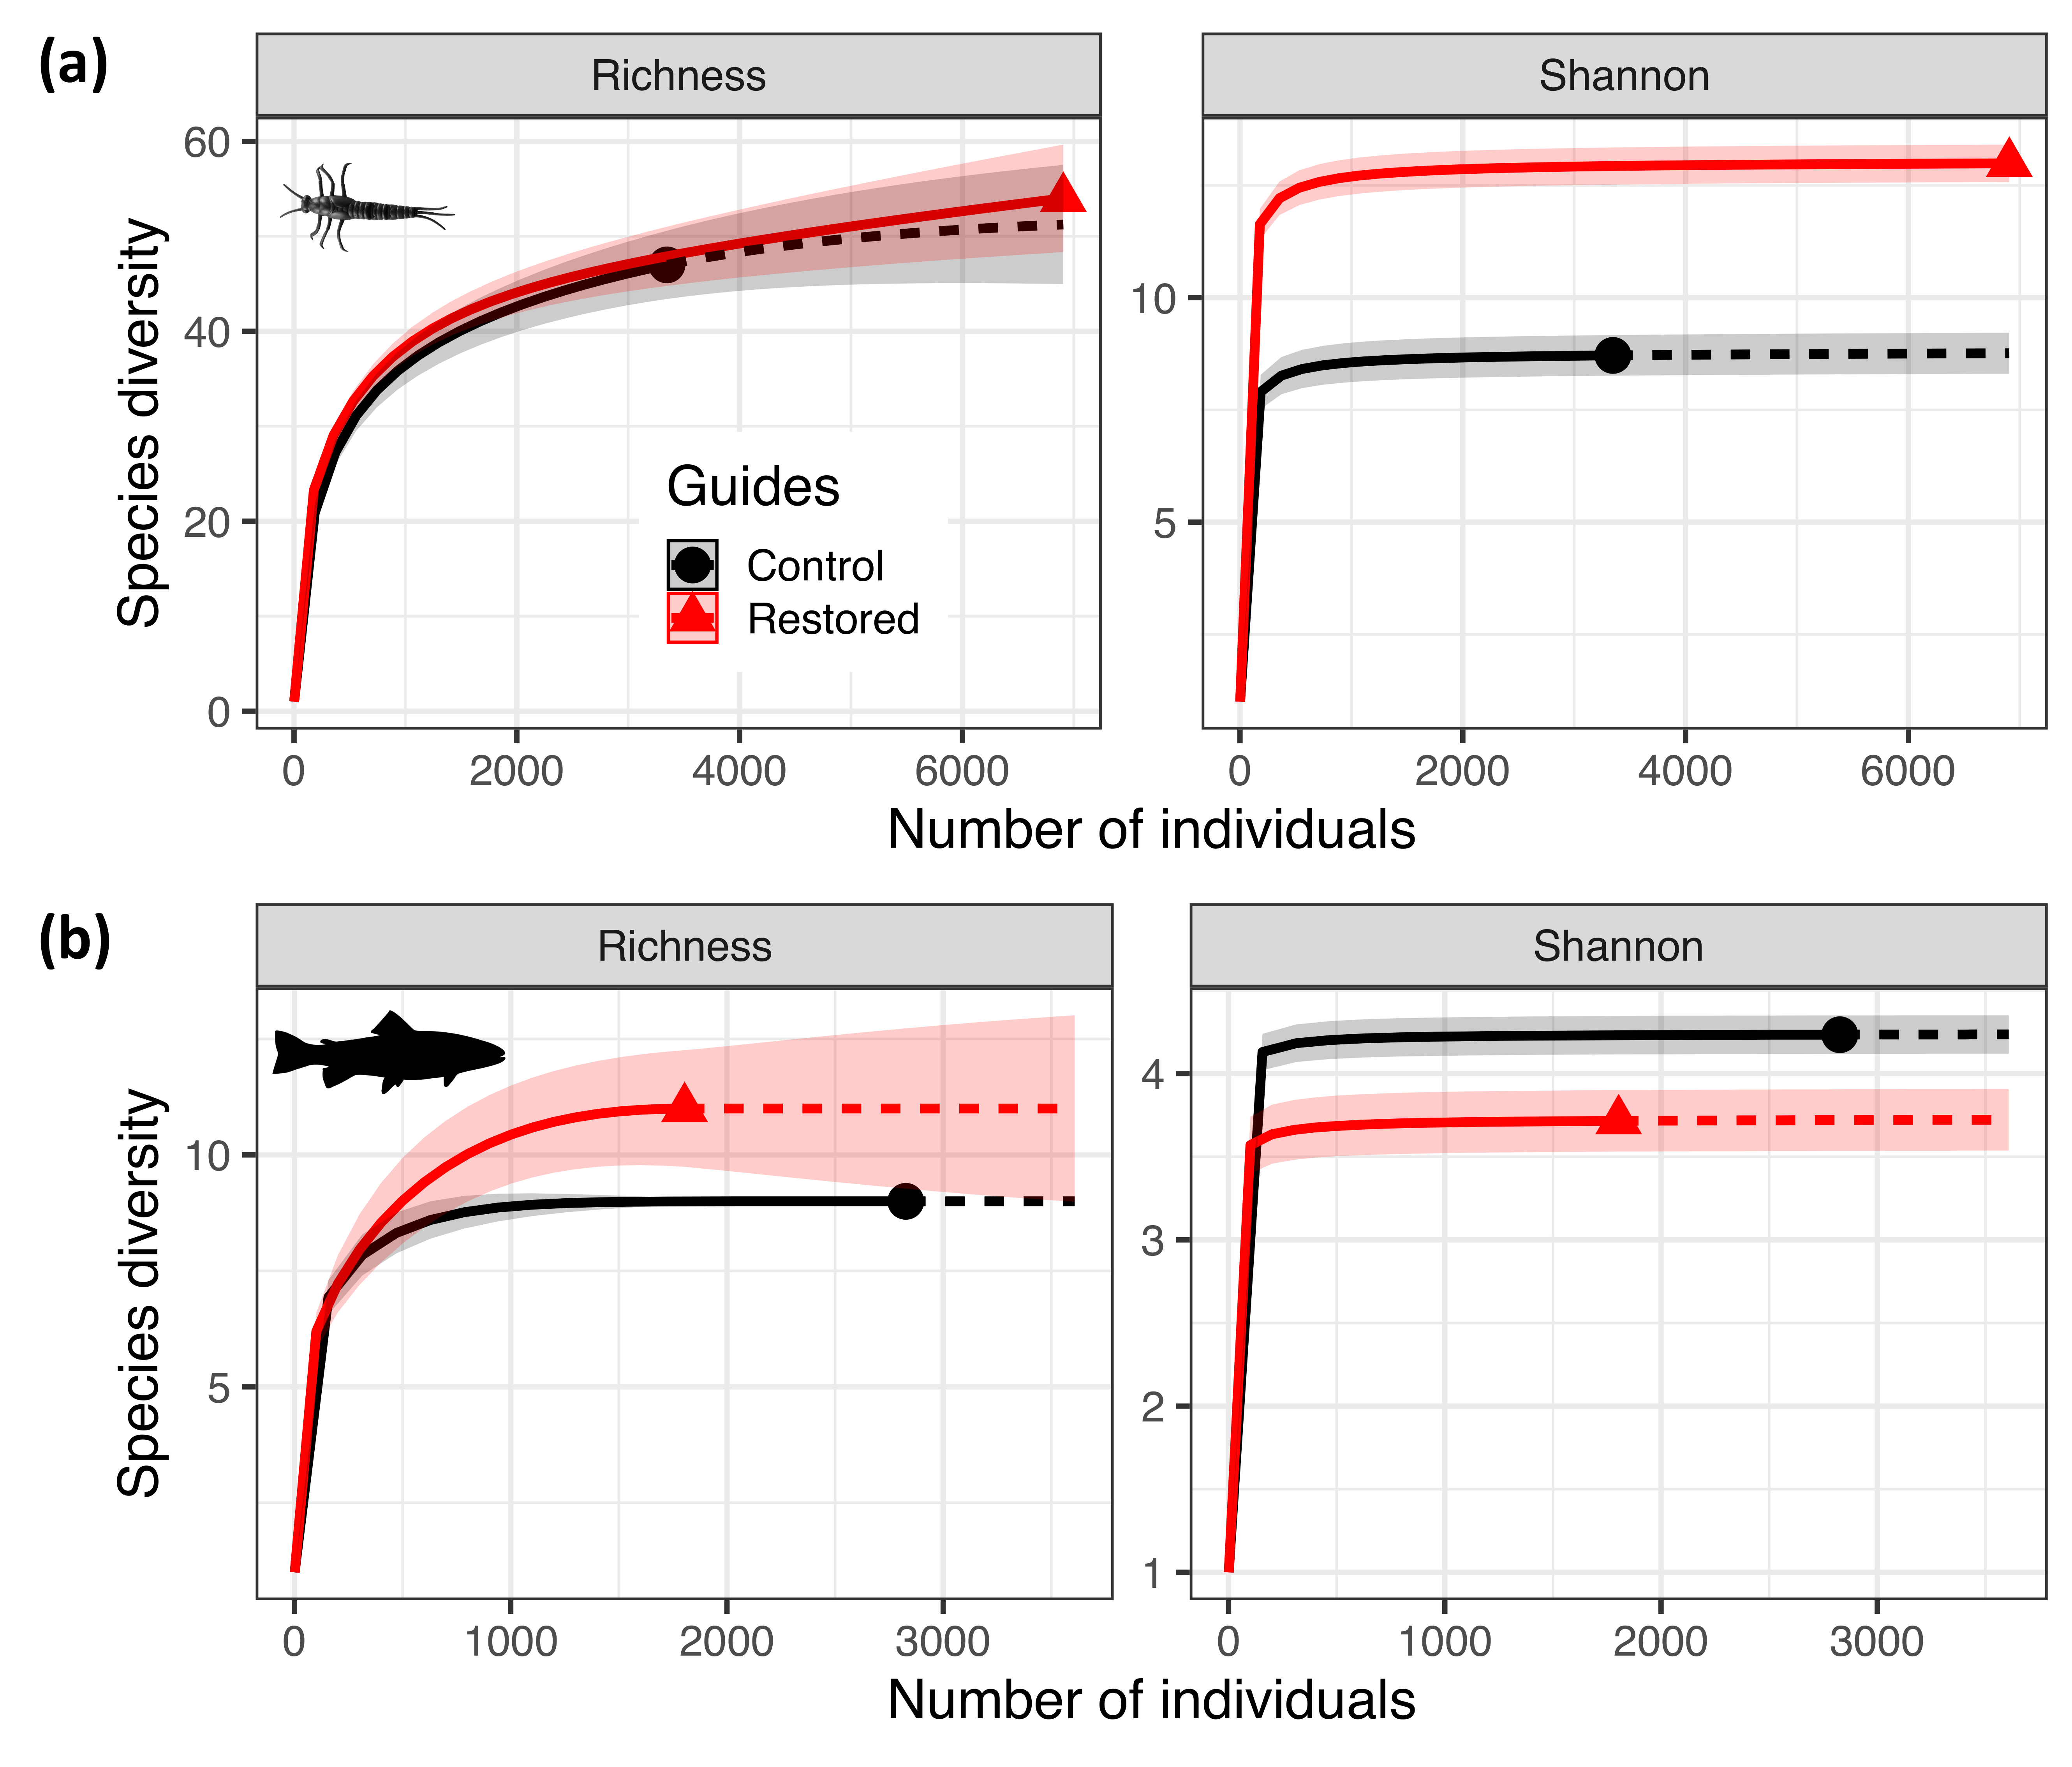
There was no evidence that total macroinvertebrate, ARMI, and EPT density differed between the reaches that would later be divided into control and restored treatments through the restoration work (Table S2). Macroinvertebrate diversity was similar in all samples prior to restoration with richness estimated to range between 39 and 45 species (Table 1; Figure S2) although reaches designated for restoration had a higher Shannon diversity score, i.e., a higher number of effective common species (Table 1; Figure S2).
Pre-restoration fish biomass ranged between 2.8 to 23.3 g m−2 (density range: 0.08 to 0.52 ind. m−2) across reaches (Figure S3) and was approximately 50% higher in the reaches not designated for restoration (Figure S4), perhaps driven by the fact that there are two bridges in the reaches that did not receive restoration (Figure 1). Fish diversity was similar between treatments prior to restoration with seven estimated species (Table 1; Figure S2), and approximately four effective common species (Table 1; Figure S2).
Table 1. Summary statistics for sample-size based diversity analysis for macroinvertebrates and fish. Estimates are derived by extrapolating accumulation curves to the given reference sample size, providing a robust assessment of diversity that is independent of the number of individuals sampled.
RichnessShannon
PeriodTreatmentNo. IndividualsRef. Sample Size ObservedEstimate95% CIObservedEstimate95% CI
Invert.BeforeControl276555303845.136.6–53.577.16.7–7.5
Restored49523939.436.7–42.11010.29.9–10.6
AfterControl334869064751.244.7–57.898.88.3–9.3
Restored69065454.050.4–57.61313.012.6–13.4
FishBeforeControl39246877.06.5–7.444.03.7–4.3
Restored23477.06.7–7.444.54.0–4.9
AfterControl2827360899.08.7–9.344.24.1–4.4
Restored18041111.09.4–12.643.73.6–3.9
Invert.Before vs. AfterControl276555303845.133.2–577.17.16.8–7.4
Control33484750.345.2–55.48.78.78.3–9.2
FishBefore vs. AfterControl392282777.06.6–7.44.04.03.7–4.4
Control282799.08.7–9.34.24.24.1–4.3

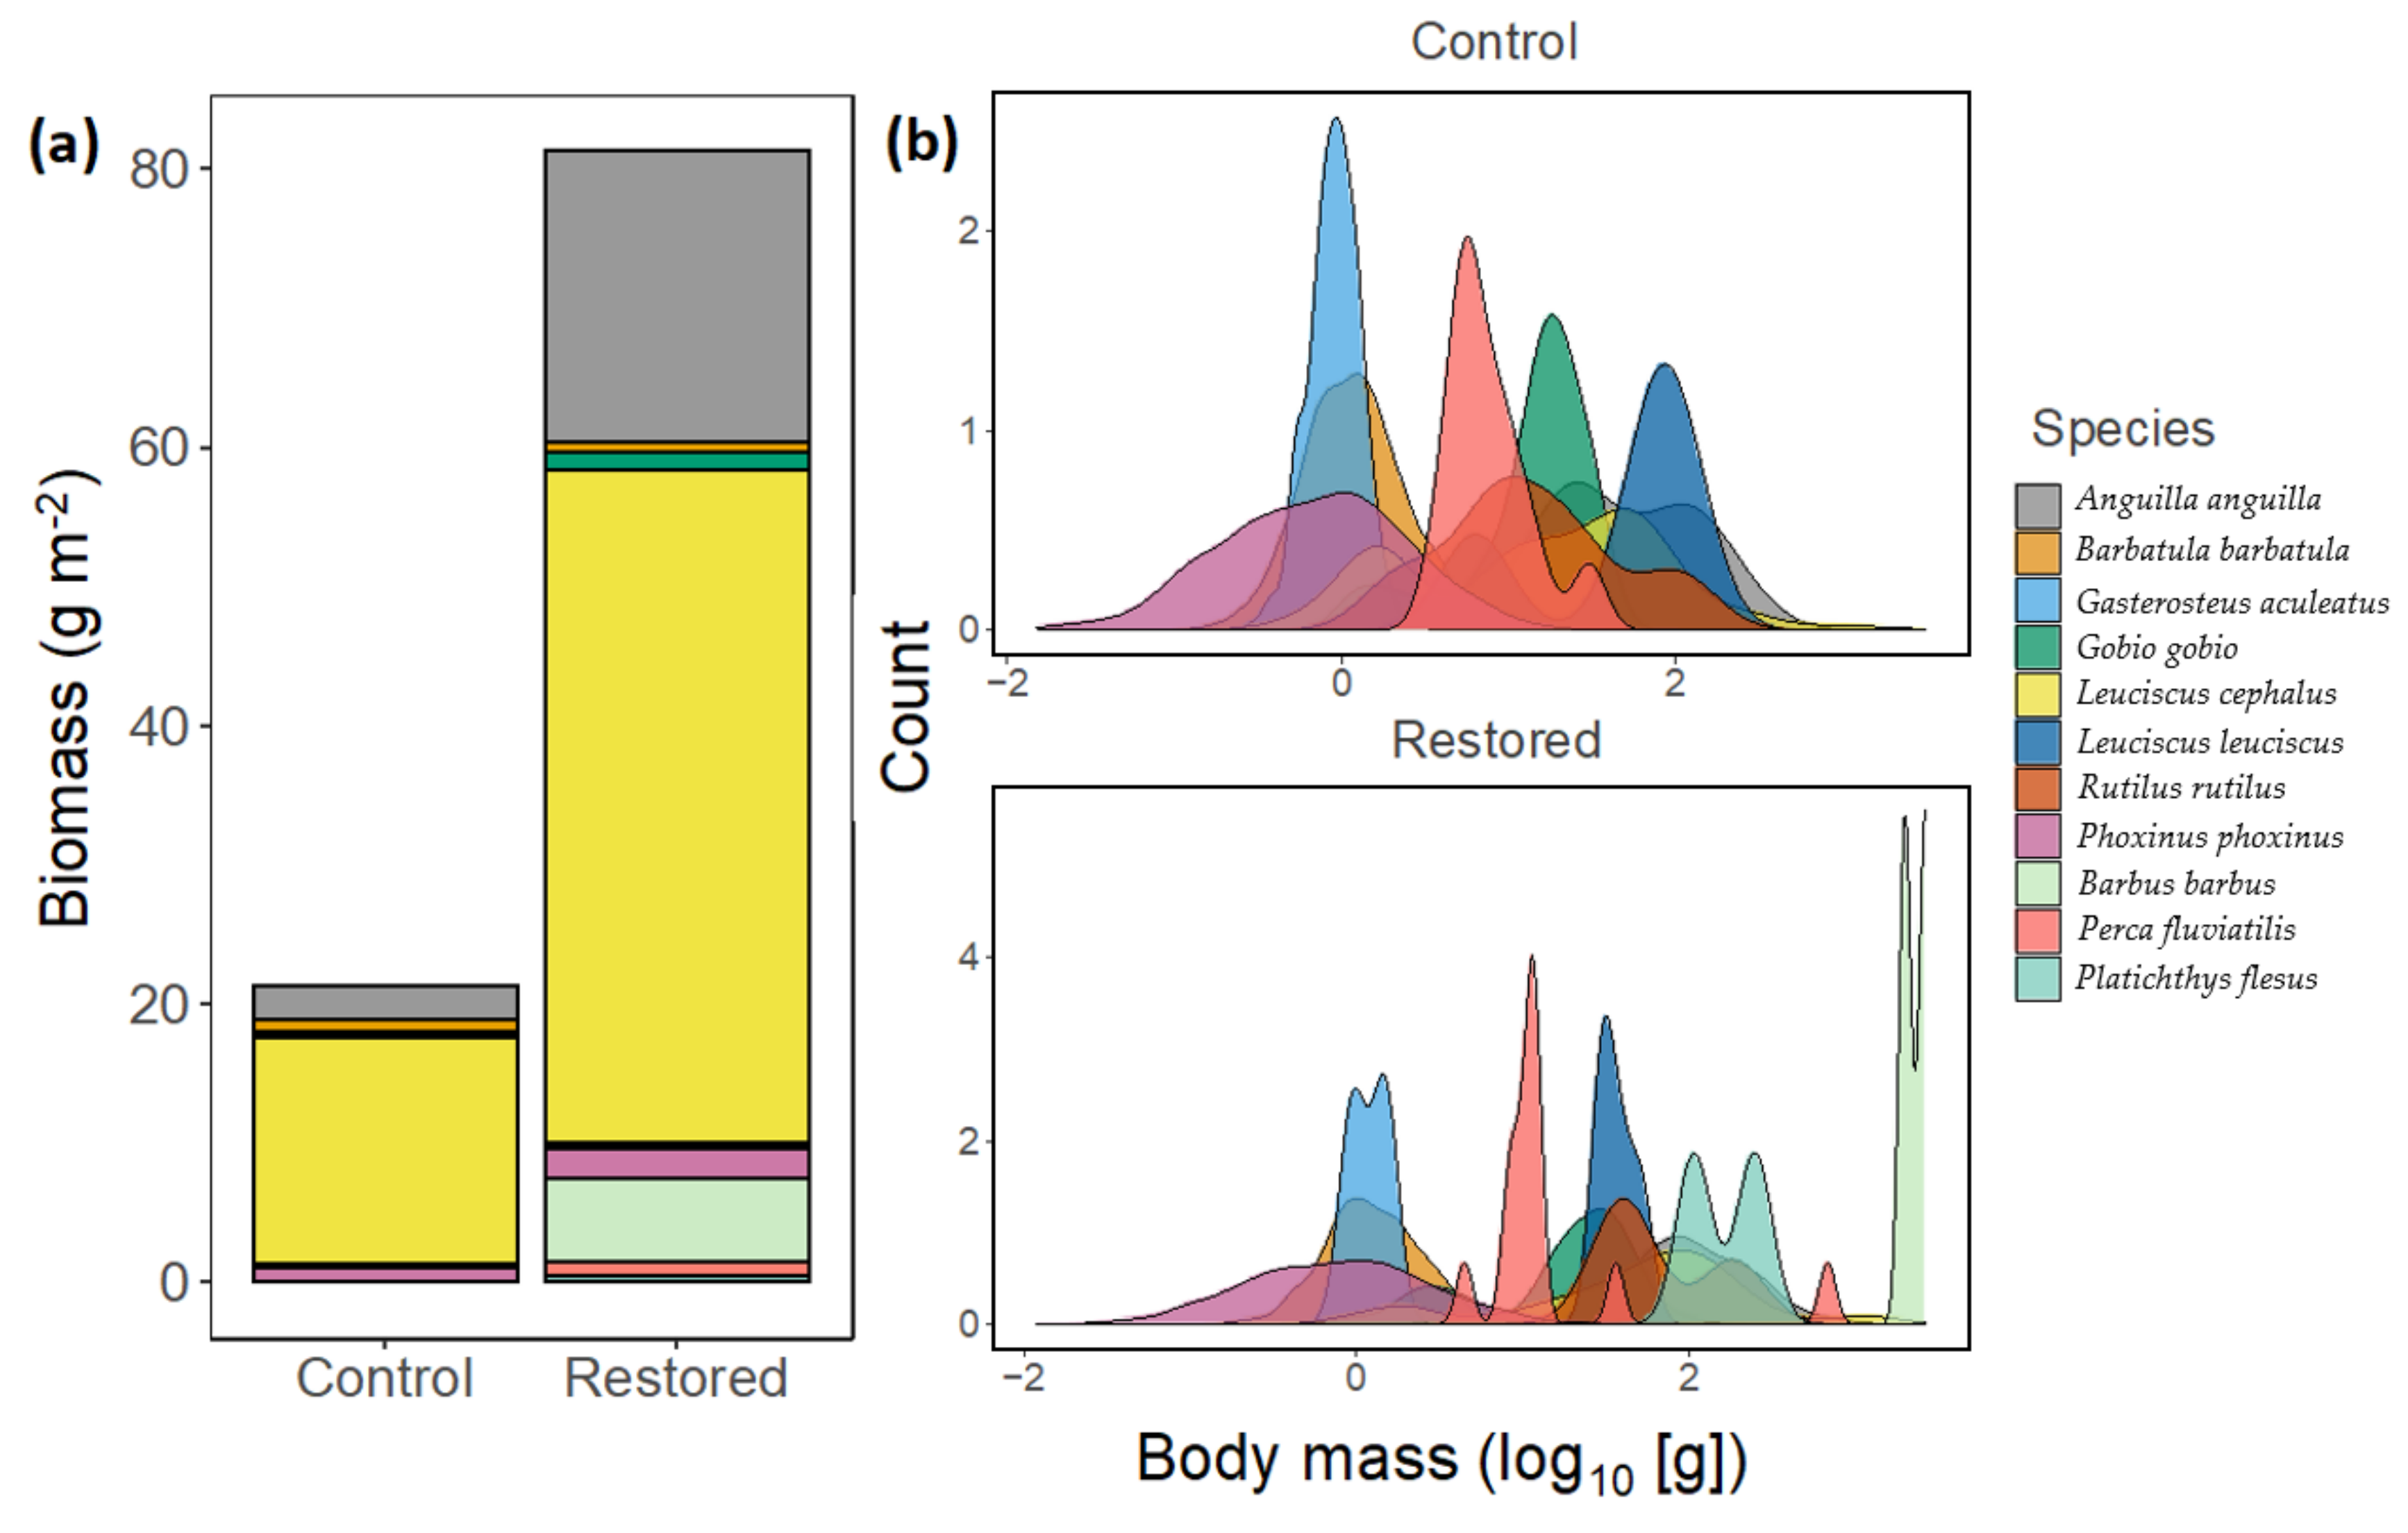
3.2. Restoration Effects

The restoration changed the sediment and flow conditions drastically in the restored reaches compared to control reaches. Principal component analysis of environmental data revealed the primary axis of variation with restoration was driven by sediment and detrital deposition and flow; i.e., PC1 represents an integrated measure of water velocity (Figure 2). There was very strong evidence for differences between treatments (Control vs. Restored; PCA, r2 = 0.36, p = 0.001), with restoration resulting in a higher proportion of exposed gravel, woody debris, and macrophytes; faster flow; and narrower river width compared to control reaches (Figure 2).
There was strong evidence that total macroinvertebrate, ARMI, and EPT density was higher with restoration (Table 2; Figure 3). For total macroinvertebrate density, there was moderate evidence for a Treatment × Period interaction (Table 2), with the increase in density with restoration ranging between 5% (one year after restoration) to 148% (four years post restoration) (Supplementary Table S3). There was no evidence for such higher order interactions when considering ARMI and EPT density (Table 1), signifying that restoration had a relatively constant effect throughout the post-restoration monitoring period (141–250% and 116–288% higher than control, respectively; Figure 3; Table 2).
There was evidence that density increased with restoration in seven out of the 13 taxonomic groups (Table 2). Amphipoda, Asellidae, and Hirudinea were the only groups where there was evidence that density was greater with restoration across the entire post-restoration monitoring period (Table 2; Figure 3; Table S3). Transient restoration effects (where densities differed with restoration but not on all occasions) were evident for Ephemeroptera, Simuliidae, Oligochaeta, and cased and caseless Trichoptera (Table 2; Figure 3; Table S3). For example, caseless trichopterans (especially Hydropsyche sp.) had increased greatly in numbers in the last two monitoring years (Figure 3). Bivalvia, Chironomidae, Gastropoda, Plecoptera, and Zygoptera were the only groups where there was no evidence that densities increased with restoration (i.e., non-significant Treatment, or Treatment × Period, term; Table 2).
Three years following restoration, estimated species richness was higher with restoration (54) than the control (51); however, confidence intervals overlapped signifying limited evidence for statistical differences (Table 1; Figure 4a). The effective number of common species was higher in restored (13) than in the control (9) (Figure 4a), and these differences were chiefly attributed to an increase in species of Simuliidae (blackflies). Biological Monitoring Working Party (BMWP) and Average Score Per Taxon (ASPT) scores improved in restored reaches following restoration (Table S4) and consistent with the density analyses documenting an increase in pollution and flow sensitive taxa with restoration through time.
Five years post restoration, total fish biomass ranged between 13.2 to 92.2 g m−2 between reaches (density range: 0.55 to 3.18 ind. m−2) (Figure S3) and was approximately 282% higher with restoration (Figure 5). This figure was reduced to an approximately 142% increase when biomass was expressed per unit length (Figure S5). There was evidence that fish richness was higher with restoration (11 species) compared to the control (nine species), as indicated by the non-overlapping confidence intervals in Figure 4b. European Barbel (Barbus barbus) and flounder (Platichthys flesus) were only caught in restored reaches. The average body mass for three of the most common fish species were significantly higher for individuals caught in restored reaches (Table S5); the average body mass of chub (Leuciscus cephalus), eel (Anguilla anguilla), and minnow (Phoxinus phoxinus) was 4, 124, and 167% higher, respectively (Figure S6; Table S5). Together, these results signify a shift in the size structure of fish assemblages associated with restoration, with a greater proportion of both larger individuals (Figure S6) and larger species (Figure 5b).

3.3. Temporal Variation

Total macroinvertebrate density was statistically indistinguishable between the two control reaches before and one to two years post restoration but was significantly lower three to five years after restoration (Table S6). Similarly, ARMI and EPT density were statistically similar between control reaches before and one year post restoration but were lower in year 2 and, in the case of EPT, five years after restoration (Table S6). Thus, the positive restoration effects reported (above) are set against a backdrop of a general decline in invertebrate densities over the full monitoring period.
Sample-sized based diversity analysis revealed that invertebrate diversity in control remained largely unchanged before and three years post restoration (Figure S7a), whilst fish richness increased significantly in control reaches (five years) post restoration (Figure S7b). Perch (Perca fluviatilis) and minnow (Phoxinus phoxinus) were additional fish taxa present in control reaches post restoration. Associated with these changes was a 57% increase in fish biomass in control reaches after restoration (Figure S4).

4. Discussion

Through a Before-After-Control-Impact approach and more than five years of monitoring, we demonstrate marked changes in the composition of invertebrate and fish assemblages following extensive habitat restoration. We show that restoration had a strong effect on sediment sorting and invertebrate densities that in tandem support a substantial amount of fish, which in-turn control the densities of their prey (stream invertebrates). The latter would mask restoration success measured by macro-invertebrate monitoring alone, highlighting the importance of considering the response of biota to restoration across trophic levels [31,40].
The primary aim of the current restoration project was to restore energy back to the channel in order to enable the river to “self-heal”. Flow has long been considered a master variable in riverine ecosystems because it, along with sediment dynamics, directly affects channel form and consequently the biota and ecological processes within the channel [41]. We show through the analysis of habitat and environmental data that restoration increased flow velocity and changed the makeup of substrate in the riverbed, with a higher proportion of exposed gravel and a lower proportion of sand and sediment. As hypothesized, restoration also enhanced the density of riverfly taxa, particularly Ephemeroptera and Trichoptera that require fast flowing, well oxygenated water conditions, and rocky substrates [42]. This was also evident when considering BMWP and ASPT scores, which were higher post restoration, especially in the restored sections. However, it is important to note that whilst total EPT density was consistently higher with restoration, these specific groups showed transient effects whereby densities differed with restoration but not across the entire monitoring period. Total invertebrate density was also higher with restoration but only >2 years after restoration, suggesting a lag between restoration and impacts on the numbers of non-riverfly groups. The observed fluctuation in total invertebrate density underlines the importance of undertaking long-term post-restoration monitoring (see also [43] in this special issue), which is rarely conducted over a time scale such as that performed in this study [11,44].
Amphipoda (predominately Gammarus pulex), Asellidae (predominately Asellus aquaticus), and Hirudinea were the only groups with strong evidence that density was greater with restoration across the monitoring period. Unlike aquatic insects, these taxa are present in the system for their entire life cycle, perhaps explaining their pronounced and consistent response to restoration. Furthermore, G. pulex and A. aquaticus are detritivores [45], and their higher abundances likely reflects the higher levels of detrital resources retained in the restored sections, as indicated by the higher stocks of CPOM in our habitat surveys. The greater abundance of detritivores with restoration should translate into higher rates organic matter decomposition [46] although future work quantifying changes in this and other key ecosystem functions would be informative.
Positive restoration effects were not only restricted to invertebrates. We found two additional fish species in the restored sections, with the most notable being the establishment of large (55–60 cm in length) barbel (B. barbus). Adults (1+) of this rheophilic species require deep, fast flowing, mid-channel habitats [47]. This suggests that restoration not only provided the physical habitats for this species to establish (Figure 1 and Figure 2) but there was also sufficient benthic invertebrate prey [47] to support such large consumers. The greater average body mass for three of the most common fish species (chub, eel, and minnow) was also higher in the restored sections. The establishment of new, large species within the system and the increase in the average size of individuals within species populations resulted in fish biomass being 282% higher with restoration after five years. It is important to note that above average temperatures followed by significant rainfall in summer 2018 resulted in a large-scale fish die-off event in the monitoring stretch. Mortality was particularly high among large fish (predominately chub, personal observation), which have higher oxygen demands. It is likely that the observed positive effects of restoration on fish biomass could have been larger than that observed in the absence of such an event during the monitoring period. It is also possible that the greater flow velocity in the restored sections maintained sufficient oxygen concentrations for larger fish during this event, and future work addressing the role of local-scale restoration in providing “refugia” during extreme events would be a promising area for future research.
Within food webs, large individuals at high trophic levels (such as fish) are disproportionately impacted by environmental drivers [48], including acidification, warming, and habitat loss, resulting in a characteristic change in community size structure [49]. The greater numbers of large fish we observed (such as barbel and chub) suggests that habitat restoration can not only increase the standing biomass within the system (as evident for detrital stocks, invertebrates, and fish in this study) but also lead to a greater proportion of both larger individuals and larger species at the top of stream food webs. This pattern is indicative of enhanced energy transfer across trophic levels and could provide a basis for understanding ecosystem-level responses to habitat restoration. Whether these increases in community density and biomass enhance the numbers of other organism groups feeding within the river food webs, such piscivorous (e.g., kingfishers) or insectivorous (e.g., wagtails) river birds, is yet to be explored, but there are signs that this is the case (personal observation).
Whilst we observed large changes in density and biomass of invertebrate and fish assemblages, increases in species richness were modest. A couple of non-mutually exclusive factors might explain this. First, there might be a lack of suitable local donor sites for species to disperse/recolonization from [12,19]. Being an urban site with all neighbouring rivers facing similar reasons for species decline, recolonization of novel species may either face a longer lag period or is dependent on additional restoration schemes on adjacent rivers and waterbodies to provide stepping stones from more favourable sites. Second, water quality is undoubtedly a limiting factor for enhanced invertebrate communities [20,21]. The base flow originates from a sewage treatment works, and therefore, phosphate and ammonia levels exceed the maximum effect levels for many species ([25]; https://environment.data.gov.uk/catchment-planning/OperationalCatchment/3032/classifications (accessed on 25 November 2021)), and like most rivers in urbans settings, stormwater runoff is a major source of river degradation [50]. In a recent study, Beverley Brook had the greatest number of emerging organic contaminants across 30 UK streams studied [51]. Some improvements in water treatment have been carried out in the time since restoration was carried out (personal communication), which may help to account for the improvements in invertebrate richness in the control sites three years after restoration although invertebrate density generally declined over the same time period. Finally, the time scale for recolonization of new taxa might exceed the time-scale (six years) of monitoring in this study [52]. Rapid increases in invertebrate diversity in response to reach-level restoration have, however, been observed over a shorter time scale than that monitored here [31]. Habitat restoration is therefore unlikely to represent a “silver bullet” for restoring stream biodiversity but instead an integrated approach, considering specific restoration projects amongst the backdrop of local stressors and available source pools is likely required to fully restore degraded systems and promote ecosystem resilience.
The restoration performed in this study included common practices, such as channel narrowing, in-channel meandering, the introduction of large woody material, stabilization of riverbank through enclosure fencing, and the planting of riparian vegetation [11,41]. It is therefore not possible to link the relative contribution of these different interventions to the responses we observed. Nonetheless, a multiple BACI experiment assessing the effects of large woody material in lowland rivers [31] revealed similar results to ours, with an increase in the biomass of both invertebrate and fish. An additional caveat in our study was that we did not have any reference reaches in our monitoring design for the effectiveness of restoration to be evaluated. In practice, the reference (or target) typically has attributes of an undegraded ecosystem, which can either be the presumed historic state or an extant natural or semi-natural ecosystem [19]. It was not possible to assign a reference in our study since the study river has a long history of modifications [53], and no valid reference reach with high habitat heterogeneity could be identified. Future work would benefit from identifying suitable reference or target conditions so the effectiveness of specific restoration projects can be adequately assessed.
Through long-term monitoring and a rigorous experimental design, we demonstrate marked biotic responses to restoration, from changes in the stocks of basal resources through to the biomass of apex predators. This supports the notion that adopting a food web approach provides a holistic approach for linking habitat restoration with changes in the abundance and biomass of different aquatic organisms groups [31,40]. Whilst it is clear that habitat restoration can deliver notable local benefits over relatively short time-scales, even in a impacted urban river setting, further improvements in biodiversity likely requires interventions conducted over a much larger (i.e., catchment level) scale than what is typically the case.

Supplementary Materials

The following are available online at https://www.mdpi.com/article/10.3390/w13243530/s1, Figure S1: Beverley Brook restora-tion work; Figure S2: Species richness and Shannon diversity rarefaction (solid line segment) and extrapolation (dotted line segments) sampling curves between treatments for macroinvertebrate (a) and fish (b) assemblages pre-restoration (2015); Figure S3: Fish biomass estimates for each monitoring reach before (a) and 5-years after (b) restoration; Figure S4: Fish biomass estimates (per unit stream area) between treatments before (a) and 5-years after (b) restoration; Figure S5: Fish biomass estimates (per unit stream length) between treatments before (a) and 5-years after (b) restoration; Figure S6: Fish body mass distributions between treatments 5-years after resto-ration; Figure S7: Species richness and Shannon diversity rarefaction (solid line segment) and extrapolation (dotted line segments) sampling curves for macroinvertebrate (a) and fish (b) as-semblages for control reaches pre- and post-restoration; Table S1: Fish length-mass equations from the National Fish Populations Database (Environment Agency, UK); Table S2: Comparison of maciroinvertbrate density between treatment reaches (Restored and Control) prior to restora-tion; Table S3: Contrasts from linear-mixed effects models testing differences in macroinverte-brate density with restoration over the 5 year post-restoration monitoring period; Table S4: Condition assessment of invertebrate assemblages based on the BMWP (Biological Monitoring Working Party) scores; Table S5: Summary output from linear-mixed effects modeling testing for differences in species body mass with restoration; Table S6: Summary output from LME models testing for the effects of restoration on macroinvertebrate density across the 6 year monotring period.

Author Contributions

Conceptualization, D.M.P., T.H. and B.D.; formal analysis, D.M.P.; data curation, N.B., A.C., R.G., T.G. and S.S.; writing—original draft preparation, D.M.P. All authors have read and agreed to the published version of the manuscript.

Funding

This research received no external funding.

Data Availability Statement

Data used in the analysis will be archived in a Figshare public repository (https://figshare.com/s/5d915fd099a9ae321689 (accessed on 7 December 2021)) upon acceptance. Data included in the deposit are specifically designed for the replication of the analysis procedure. Therefore, researchers interested in using the data for purposes other than replicating our analyses are advised to email the corresponding author to request the raw data.

Acknowledgments

We would like to thank the Royal Parks and Friends of Richmond Park for initiating the restoration project and for supporting the monitoring program, Peter Gray (from the Environment Agency) and Martin Moore (from Moore and Moore Carp) for performing electrofishing surveys and providing data, and Julia Reiss for insightful comments that helped greatly improve the paper.

Conflicts of Interest

The authors declare no conflict of interest.

References

  1. Downs, P.; Gregory, K. River Channel Management: Towards Sustainable Catchment Hydrosystems; Routledge: London, UK, 2014; ISBN 1444119079. [Google Scholar]
  2. Newson, M. Land, Water and Development. River Basin Systems and Their Sustainable Management; Routledge: London, UK, 1992; ISBN 0415080312. [Google Scholar]
  3. Brookes, A. Channelized Rivers: Perspectives for Environmental Management; Wiley: Chichester, UK, 1988; ISBN 0471919799. [Google Scholar]
  4. Strayer, D.L.; Dudgeon, D. Freshwater biodiversity conservation: Recent progress and future challenges. J. N. Am. Benthol. Soc. 2010, 29, 344–358. [Google Scholar] [CrossRef] [Green Version]
  5. Vörösmarty, C.J.; McIntyre, P.B.; Gessner, M.O.; Dudgeon, D.; Prusevich, A.; Green, P.; Glidden, S.; Bunn, S.E.; Sullivan, C.A.; Liermann, C.R. Global threats to human water security and river biodiversity. Nature 2010, 467, 555–561. [Google Scholar] [CrossRef] [PubMed]
  6. Ormerod, S.J.; Durance, I. Restoration and recovery from acidification in upland Welsh streams over 25 years. J. Appl. Ecol. 2009, 46, 164–174. [Google Scholar] [CrossRef]
  7. Murphy, J.F.; Winterbottom, J.H.; Orton, S.; Simpson, G.L.; Shilland, E.M.; Hildrew, A.G. Evidence of recovery from acidification in the macroinvertebrate assemblages of UK fresh waters: A 20-year time series. Ecol. Indic. 2014, 37, 330–340. [Google Scholar] [CrossRef] [Green Version]
  8. Layer, K.; Hildrew, A.G.; Jenkins, G.B.; Riede, J.O.; Rossiter, S.J.; Townsend, C.R.; Woodward, G. Long-term dynamics of a well-characterised food web: Four decades of acidification and recovery in the Broadstone Stream model system. Adv. Ecol. Res. 2011, 44, 69–117. [Google Scholar]
  9. MEA—Millenium Ecosystem Assessment. Ecosystems and Human Well-Being: Biodiveristy Synthesis; Island Press: Washington, DC, USA, 2005. [Google Scholar]
  10. Palmer, M.A.; Lettenmaier, D.P.; Poff, N.L.; Postel, S.L.; Richter, B.; Warner, R. Climate change and river ecosystems: Protection and adaptation options. Environ. Manag. 2009, 44, 1053–1068. [Google Scholar] [CrossRef]
  11. Feld, C.K.; Birk, S.; Bradley, D.C.; Hering, D.; Kail, J.; Marzin, A.; Melcher, A.; Nemitz, D.; Pedersen, M.L.; Pletterbauer, F.; et al. From Natural to Degraded Rivers and Back Again. A Test of Restoration Ecology Theory and Practice, 1st ed.; Elsevier Ltd.: Amsterdam, The Netherlands, 2011; Volume 44, ISBN 9780123747945. [Google Scholar]
  12. Palmer, M.A.; Menninger, H.L.; Bernhardt, E. River restoration, habitat heterogeneity and biodiversity: A failure of theory or practice? Freshw. Biol. 2010, 55, 205–222. [Google Scholar] [CrossRef]
  13. Newson, M.D.; Newson, C.L. Progress in Physical Geography Geomorphology, ecology and river channel habitat: Mesoscale approaches to basin-scale. Prog. Phys. Geogr. 2000, 2, 195–217. [Google Scholar] [CrossRef]
  14. McCoy, E.D.; Bell, S.S. Habitat structure: The evolution and diversification of a complex topic. In Habitat Structure; Springer: Berlin/Heidelberg, Germany, 1991; pp. 3–27. [Google Scholar]
  15. Hynes, H.B.N.; Hynes, H.B.N. The Ecology of Running Waters; Liverpool University Press: Liverpool, UK, 1970; Volume 555. [Google Scholar]
  16. Allan, J.D.; Castillo, M.M. Stream Ecology: Structure and Function of Running Waters; Springer Science & Business Media: Berlin/Heidelberg, Germany, 2007; ISBN 1402055838. [Google Scholar]
  17. Lepori, A.F.; Palm, D.; Brännäs, E.; Malmqvist, B.; Lepori, F.; Brannas, E. Does Restoration of Structural Heterogeneity in Streams Enhance Fish and Macroinvertebrate Diversity? Ecol. Appl. 2011, 15, 2060–2071. [Google Scholar] [CrossRef]
  18. Palmer, M.A.; Bernhardt, E.S.; Allan, J.D.; Lake, P.S.; Alexander, G.; Brooks, S.; Carr, J.; Clayton, S.; Dahm, C.N.; Follstad Shah, J.; et al. Standards for ecologically successful river restoration. J. Appl. Ecol. 2005, 42, 208–217. [Google Scholar] [CrossRef]
  19. Bullock, J.M.; Aronson, J.; Newton, A.C.; Pywell, R.F.; Rey-Benayas, J.M. Restoration of ecosystem services and biodiversity: Conflicts and opportunities. Trends Ecol. Evol. 2011, 26, 541–549. [Google Scholar] [CrossRef]
  20. Kail, J.; Brabec, K.; Poppe, M.; Januschke, K. The effect of river restoration on fish, macroinvertebrates and aquatic macrophytes: A meta-analysis. Ecol. Indic. 2015, 58, 311–321. [Google Scholar] [CrossRef]
  21. Friberg, N. Pressure—response relationships in stream ecology: Introduction and synthesis. Freshw. Biol. 2010, 55, 1367–1381. [Google Scholar] [CrossRef]
  22. Arenas-Sánchez, A.; Dolédec, S.; Vighi, M.; Rico, A. Effects of anthropogenic pollution and hydrological variation on macroinvertebrates in Mediterranean rivers: A case-study in the upper Tagus river basin (Spain). Sci. Total Environ. 2021, 766, 144044. [Google Scholar] [CrossRef]
  23. Pallottini, M.; Goretti, E.; Selvaggi, R.; Cappelletti, D.; Dedieu, N.; Céréghino, R. An efficient semi-quantitative macroinvertebrate multimetric index for the assessment of water and sediment contamination in streams. Inl. Waters 2017, 7, 314–322. [Google Scholar] [CrossRef]
  24. Mondy, C.P.; Villeneuve, B.; Archaimbault, V.; Usseglio-Polatera, P. A new macroinvertebrate-based multimetric index (I2M2) to evaluate ecological quality of French wadeable streams fulfilling the WFD demands: A taxonomical and trait approach. Ecol. Indic. 2012, 18, 452–467. [Google Scholar] [CrossRef]
  25. Environment Agency Beverley Brook Information Pack. Environment Agency. 2013. Available online: https://webarchive.nationalarchives.gov.uk/20140328161524/http://www.environment-agency.gov.uk/static/documents/Research/Beverley_Brook.pdf (accessed on 10 November 2018).
  26. Environment Agency. Procedures for Collecting and Analysing Macroinvertebrate Samples for RIVPACS; Environment Agency: Bristol, UK, 1997.
  27. Environment Agency. Operational Instructions 024_08 Freshwater Macro-Invertebrate Analysis of Riverine Samples; Environment Agency: Bristol, UK, 2012.
  28. Hawkes, H.A. Origin and development of the biological monitoring working party score system. Water Res. 1998, 32, 964–968. [Google Scholar] [CrossRef]
  29. Seber, G.A.F.; Le Cren, E.D. Estimating population parameters from catches large relative to the population. J. Anim. Ecol. 1967, 36, 631–643. [Google Scholar] [CrossRef]
  30. Carle, F.L.; Strub, M.R. A new method for estimating population size from removal data. Biometrics 1978, 621–630. [Google Scholar] [CrossRef]
  31. Thompson, M.S.A.; Brooks, S.J.; Sayer, C.D.; Woodward, G.; Axmacher, J.C.; Perkins, D.; Gray, C. Large woody debris ‘rewilding’rapidly restores biodiversity in riverine food webs. J. Appl. Ecol. 2017, 55, 895–904. [Google Scholar] [CrossRef] [Green Version]
  32. Underwood, A.J. Beyond BACI: The detection of environmental impacts on populations in the real, but variable, world. J. Exp. Mar. Bio. Ecol. 1992, 161, 145–178. [Google Scholar] [CrossRef]
  33. Brooks, S.J.; Fitch, B.; Davy-Bowker, J.; Codesal, S.A. Anglers’ Riverfly Monitoring Initiative (ARMI): A UK-wide citizen science project for water quality assessment. Freshw. Sci. 2019, 38, 270–280. [Google Scholar] [CrossRef]
  34. R Core Team. A Language and Environment for Statistical Computing; R Foundation for Statistical Computing: Vienna, Austria, 2019. [Google Scholar]
  35. Zuur, A.F.; Ieno, E.N.; Walker, N.J.; Saveliev, A.A.; Smith, G.M. Mixed Effects Models and Extensions in Ecology with R; Springer: New York, NY, USA, 2009; p. 574. [Google Scholar]
  36. Nakagawa, S.; Schielzeth, H. A general and simple method for obtaining R 2 from generalized linear mixed-effects models. Methods Ecol. Evol. 2013, 4, 133–142. [Google Scholar] [CrossRef]
  37. Hsieh, T.C.; Ma, K.H.; Chao, A. iNEXT: An R package for rarefaction and extrapolation of species diversity (Hill numbers). Methods Ecol. Evol. 2016, 7, 1451–1456. [Google Scholar] [CrossRef]
  38. Chao, A.; Gotelli, N.J.; Hsieh, T.C.; Sander, E.L.; Ma, K.H.; Colwell, R.K.; Ellison, A.M. Rarefaction and extrapolation with Hill numbers: A framework for sampling and estimation in species diversity studies. Ecol. Monogr. 2014, 84, 45–67. [Google Scholar] [CrossRef] [Green Version]
  39. Oksanen, J.; Blanchet, F.G.; Kindt, R.; Legendre, P.; Minchin, P.R.; O’hara, R.B.; Simpson, G.L.; Solymos, P.; Stevens, M.H.H.; Wagner, H. Package ‘vegan’. Community Ecol. Packag. Version 2013, 2, 1–295. [Google Scholar]
  40. Pander, J.; Geist, J. Ecological indicators for stream restoration success. Ecol. Indic. 2013, 30, 106–118. [Google Scholar] [CrossRef]
  41. Palmer, M.A.; Hondula, K.L.; Koch, B.J. Ecological Restoration of Streams and Rivers: Shifting Strategies and Shifting Goals. Annu. Rev. Ecol. Evol. Syst. 2014, 45, 247–269. [Google Scholar] [CrossRef] [Green Version]
  42. Giller, P.S.; Giller, P.; Malmqvist, B. The Biology of Streams and Rivers; Oxford University Press: Oxford, UK, 1998; ISBN 0198549776. [Google Scholar]
  43. Robertson, A.L.; Perkins, D.M.; England, J.; Johns, T. Invertebrate Responses to Restoration across Benthic and Hyporheic Stream Compartments. Water 2021, 13, 996. [Google Scholar] [CrossRef]
  44. Rubin, Z.; Kondolf, G.M.; Rios-Touma, B. Evaluating stream restoration projects: What do we learn from monitoring? Water 2017, 9, 174. [Google Scholar] [CrossRef] [Green Version]
  45. Graça, M.; Maltby, L.; Calow, P. Importance of fungi in the diet of Gammarus pulex and Asellus aquaticus I: Feeding strategies. Oecologia 1993, 93, 139–144. [Google Scholar] [CrossRef]
  46. Reiss, J.; Bailey, R.A.; Perkins, D.M.; Pluchinotta, A.; Woodward, G. Testing effects of consumer richness, evenness and body size on ecosystem functioning. J. Anim. Ecol. 2011, 80, 1145–1154. [Google Scholar] [CrossRef]
  47. Britton, J.R.; Pegg, J. Ecology of European barbel Barbus barbus: Implications for river, fishery, and conservation management. Rev. Fish. Sci. 2011, 19, 321–330. [Google Scholar] [CrossRef]
  48. Raffaelli, D. How extinction patterns affect ecosystems. Science 2004, 306, 1141–1142. [Google Scholar] [CrossRef] [Green Version]
  49. Petchey, O.L.; Belgrano, A. Body-size distributions and size-spectra: Universal indicators of ecological status? Biol. Lett. 2010, 6, 434–437. [Google Scholar] [CrossRef] [Green Version]
  50. Müller, A.; Österlund, H.; Marsalek, J.; Viklander, M. The pollution conveyed by urban runoff: A review of sources. Sci. Total Environ. 2020, 709, 136125. [Google Scholar] [CrossRef]
  51. Peralta-Maraver, I.; Posselt, M.; Perkins, D.M.; Robertson, A.L. Mapping Micro-Pollutants and Their Impacts on the Size Structure of Streambed Communities. Water 2019, 11, 2610. [Google Scholar] [CrossRef] [Green Version]
  52. Langford, T.E.L.; Shaw, P.J.; Ferguson, A.J.D.; Howard, S.R. Long-term recovery of macroinvertebrate biota in grossly polluted streams: Re-colonisation as a constraint to ecological quality. Ecol. Indic. 2009, 9, 1064–1077. [Google Scholar] [CrossRef]
  53. Hooke. Beverley Brook Catchment Geomorphological Survey and Assessment; Report to the Environment Agency (Thames Region) by the University of Portsmouth; University of Portsmouth: Portsmouth, UK, 2002.
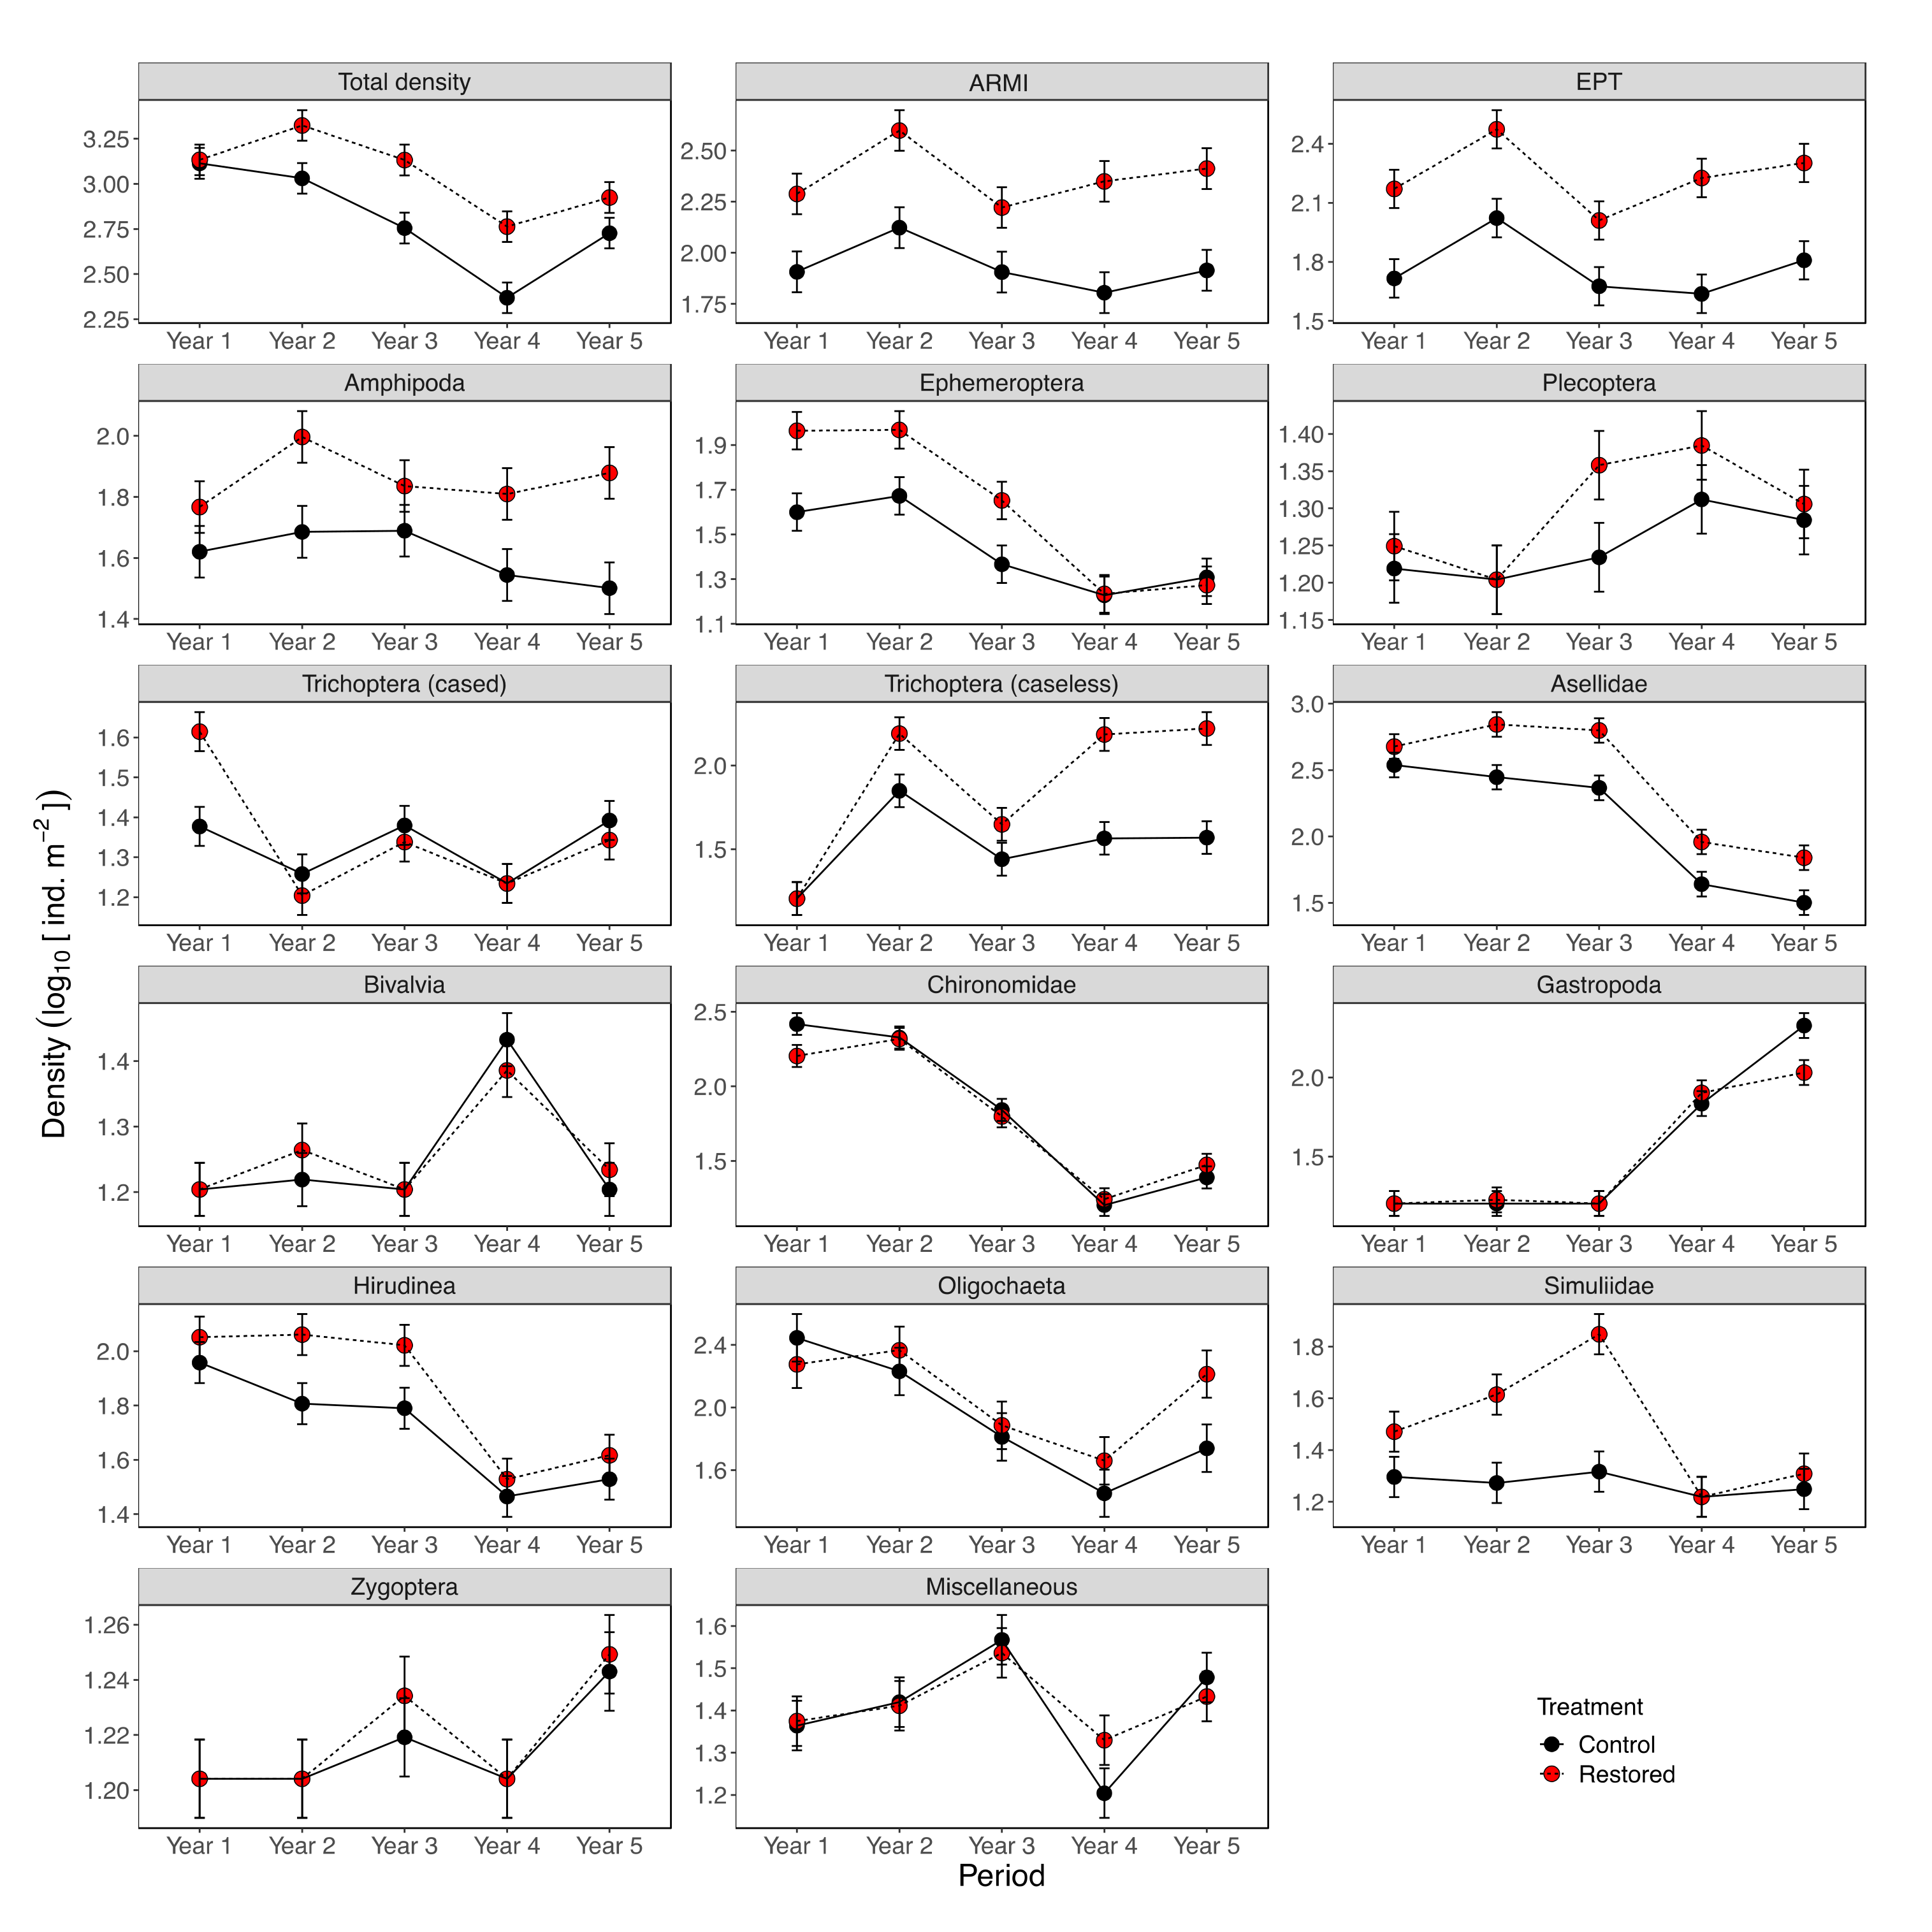
Figure 1. Beverley Brook restoration project. (a) map showing the two restored sections as well as the three control (non-restored) sections selected for macroinvertebrate and fish monitoring. Photographs of the Lower-Restored reach before (b) and three years after (c) restoration.
Water 13 03530 g001
Figure 2. Principal component analysis highlighting habitat differences between treatments represented by standard error ellipses. CPOM, coarse particulate organic matter. Each data point represents a single replicate (n = 60 for both Control and Restored).
Water 13 03530 g002
Figure 3. Variation in macroinvertebrate density as a function of restoration treatment and time period. Values are estimated from LME models. Error bars represent ± 1 SEM. Post-hoc contrasts for differences between levels of Treatment and Period are given in Supplementary Table S3. EPT includes the total density of Ephemeroptera, Plecoptera, and Trichoptera, whilst the ARMI index includes these taxa as well as Amphipoda (predominately Gammarus pulex).
Water 13 03530 g003
Figure 4. Species richness and Shannon diversity rarefaction (solid line segment) and extrapolation (dotted line segments) sampling curves between treatments for macroinvertebrate (a) and fish (b) assemblages post restoration. Shaded areas indicate 95% confidence intervals and dots/triangles represent the reference samples.
Water 13 03530 g004
Figure 5. Differences in fish assemblage biomass (a) and size structure (b) between control (non-restored) and restored river sections in Beverley Brook. Fish biomass was 282% higher with restoration and was comprised of larger individuals within populations and larger species.
Water 13 03530 g005
Table 2. Modelling output for variation in macroinvertebrate density with treatment and time period.
PeriodTreatmentPeriod: TreatmentR2
F-Valuep-ValueF-Valuep-ValueF-Valuep-ValueMarginalConditional
Total invertebrate26.13<0.000135.48<0.00012.550.0410.420.45
ARMI3.030.01949.5<0.00010.430.7840.240.24
EPT5.10.00156.81<0.00010.440.7780.280.28
Amphipoda 11.330.26121.62<0.00010.720.5760.130.13
Ephemeroptera 1,224.61<0.000114.02<0.00012.810.0270.380.39
Plecoptera 13.220.0143.070.0810.60.6610.080.09
Trichoptera (cased) 1,210.15<0.00010.360.5483.240.0130.210.21
Trichoptera (caseless) 1,225.58<0.000138.61<0.00014.440.0020.440.45
Asellidae54.43<0.000130.81<0.00010.750.5560.560.56
Bivalvia14.57<0.00010.080.7820.60.6660.220.27
Chironomidae92.54<0.00010.390.5351.210.3080.650.65
Gastropoda95.38<0.00010.940.3332.390.0530.650.67
Hirudinea23.86<0.000111.960.0010.890.4690.350.37
Oligochaeta21.36<0.00015.050.0262.630.0360.310.39
Simuliidae7.25<0.000121.93<0.00014.20.0030.250.26
Zygoptera3.560.0080.220.6360.110.980.070.07
Miscellaneous6.43<0.00010.080.7820.670.6140.130.13
The proportional variation explained (R2) by the fixed effects in the model and fixed and random terms combined are denoted marginal and conditional values, respectively. Taxa included in ARMI and EPT indices are indicated by 1 and 2, respectively.
Publisher’s Note: MDPI stays neutral with regard to jurisdictional claims in published maps and institutional affiliations.

