Article

The Sustainable Treatment Effect of Constructed Wetland for the Aquaculture Effluents from Blunt Snout Bream (Megalobrama amblycephala) Farm

1
Wuxi Fisheries College, Nanjing Agricultural University, Wuxi 214081, China
2
Key Laboratory of Freshwater Fisheries and Germplasm Resources Utilization, Ministry of Agriculture and Rural Affairs, Freshwater Fisheries Research Center, Chinese Academy of Fishery Sciences, Wuxi 214081, China
*
Authors to whom correspondence should be addressed.
Water 2021, 13(23), 3418; https://doi.org/10.3390/w13233418
Submission received: 3 November 2021 / Revised: 26 November 2021 / Accepted: 1 December 2021 / Published: 3 December 2021
(This article belongs to the Special Issue Effect of Aquatic Environment on Fish Ecology)

Abstract

:
In aquaculture, constructed wetland (CW) has recently attracted attention for use in effluent purification due to its low running costs, high efficiency and convenient operation,. However, less data are available regarding the long-term efficiency of farm-scale CW for cleaning effluents from inland freshwater fish farms. This study investigated the effectiveness of CW for the removal of nutrients, organic matter, phytoplankton, heavy metals and microbial contaminants in effluents from a blunt snout bream (Megalobrama amblycephala) farm during 2013–2018. In the study, we built a farm-scale vertical subsurface flow CW which connected with a fish pond, and its performance was evaluated during the later stage of fish farming. The results show that CW improved the water quality of the fish culture substantially. This system was effective in the removal of nutrients, with a removal rate of 21.43–47.19% for total phosphorus (TP), 17.66–53.54% for total nitrogen (TN), 32.85–53.36% for NH4+-N, 33.01–53.28% NH3-N, 30.32–56.01% for NO3-N and 42.75–63.85% for NO2-N. Meanwhile, the chlorophyll a (Chla) concentration was significantly reduced when the farming water flowed through the CW, with a 49.69–62.01% reduction during 2013–2018. However, the CW system only had a modest effect on the chemical oxygen demand (COD) in the aquaculture effluents. Furthermore, concentrations of copper (Cu) and lead (Pb) were reduced by 39.85% and 55.91%, respectively. A microbial contaminants test showed that the counts of total coliform (TC) and fecal coliform (FC) were reduced by 55.93% and 48.35%, respectively. In addition, the fish in the CW-connected pond showed better growth performance than those in the control pond. These results indicate that CW can effectively reduce the loads of nutrients, phytoplankton, metals, and microbial contaminants in effluents, and improve the water quality of fish ponds. Therefore, the application of CW in intensive fish culture systems may provide an advantageous alternative for achieving environmental sustainability.

1. Introduction

In recent years, rapidly growing aquaculture has provided an important source of animal protein nutrition, and the production of freshwater aquaculture is 30.1374 million tons in 2019 in China [1]. In freshwater farming, inland pond culture is the major aquaculture model in China, having an area of 2,644,730 ha [1]. It is a well-known fact that the fish are fed heavy artificial diets in freshwater pond culture. However, large amounts of un-utilized diet and produced excrement can cause the deterioration of the water quality [2]. Residual nutrients may also result in blue-green algal blooms, which are harmful to farmed organisms [3]. Furthermore, aquaculture effluent has become a serious public concern, because it is rich in solid matter, organics, and dissolved metabolites, which may cause eutrophication, silting, oxygen depletion, ammonia and sulfide toxicity in the aquatic environment [4]. The untreated effluent is likely discharged into rivers or lakes, affecting the quality of water source for drinking [5]. Thus, the remediation of effluent is required in aquaculture farms to ensure environmental responsibility and sustainability.
To maintain the water quality of aquaculture ponds and remediate the aquaculture effluent, multiple methods have been applied, mainly categorized into physical, chemical, biological and ecological techniques [6]. Among these, ecological treatments, such as ecological ponds, plant purification, an ecological floating bed, and constructed wetland (CW), is considered to be the most effective method to remove pollutants from aquaculture water [7,8]. In ecological treatments, CW, integrating physical, chemical and biological techniques in an ecosystem, has become a preferred method in pond recirculating aquaculture systems and aquaculture wastewater treatment [9,10]. The treatment possesses some advantages, including low running costs, high efficiency, a lack of secondary pollution and easy maintenance and management [11].
Several researchers have investigated the purification effect of CW, including vertical flow CW and horizontal flow CW in aquaculture. It has been demonstrated that CW can efficiently and consistently purify major contaminants including suspended solids, organic matters and inorganic nitrogen in water and effluent from aquaculture ponds [12,13]. An early study reported that CW, connected with a shrimp pond, improved the water quality in a recirculating aquaculture system [10]. In intensive trout farms, CW as an effluents purification system had significant treatment effects on the nutrient fractions such as total nitrogen (TN) and total phosphorous (TP) [14]. Omotade et al. [15] suggested that CWs (0.97 m2) have a great potential for the treatment of aquaculture wastewater, which contributed to the recycling of the wastewater. A study in a laboratory-based horizontal subsurface flow CW (125 cm × 20 cm × 50 cm) showed that the nitrate, chemical oxygen demand (COD) and total aerobic bacteria were reduced substantially over 50 days and improved the water quality of the shrimp culture [16]. Meanwhile, CW microcosms (40 cm × 30 cm × 30 cm) with vertical subsurface flow can effectively remove the organic micropollutants in freshwater aquaculture effluents over 4 weeks [17]. It is worth noting that existing studies regarding the purification effect of CW on aquaculture effluent were primarily performed under lab-scale applications during a relatively short monitoring time. However, few data are available regarding long-term efficiency of farm-scale CW for cleaning effluents from inland freshwater fish farm, and thus the stability and efficiency of farm-scale CW urgently need to be evaluated during a long-term operation.
In this study, we built a farm-scale hybrid vertical subsurface flow CW (VSFCW) connected with a fish pond to improve the water quality in intensive aquaculture ponds and prevent the continuous discharge of effluents into adjacent surface water. Meanwhile, we monitored the alteration of water quality such as COD, TN, ammonium-N (NH4+-N) and TP to evaluate the treatment efficiency and stability during 2013–2018. Furthermore, we observed the removal effect of CW on metals and microbial contaminants in the inland freshwater fish farming water. This study can provide necessary data to support the application of the CW in inland freshwater fish farms.

2. Materials and Methods

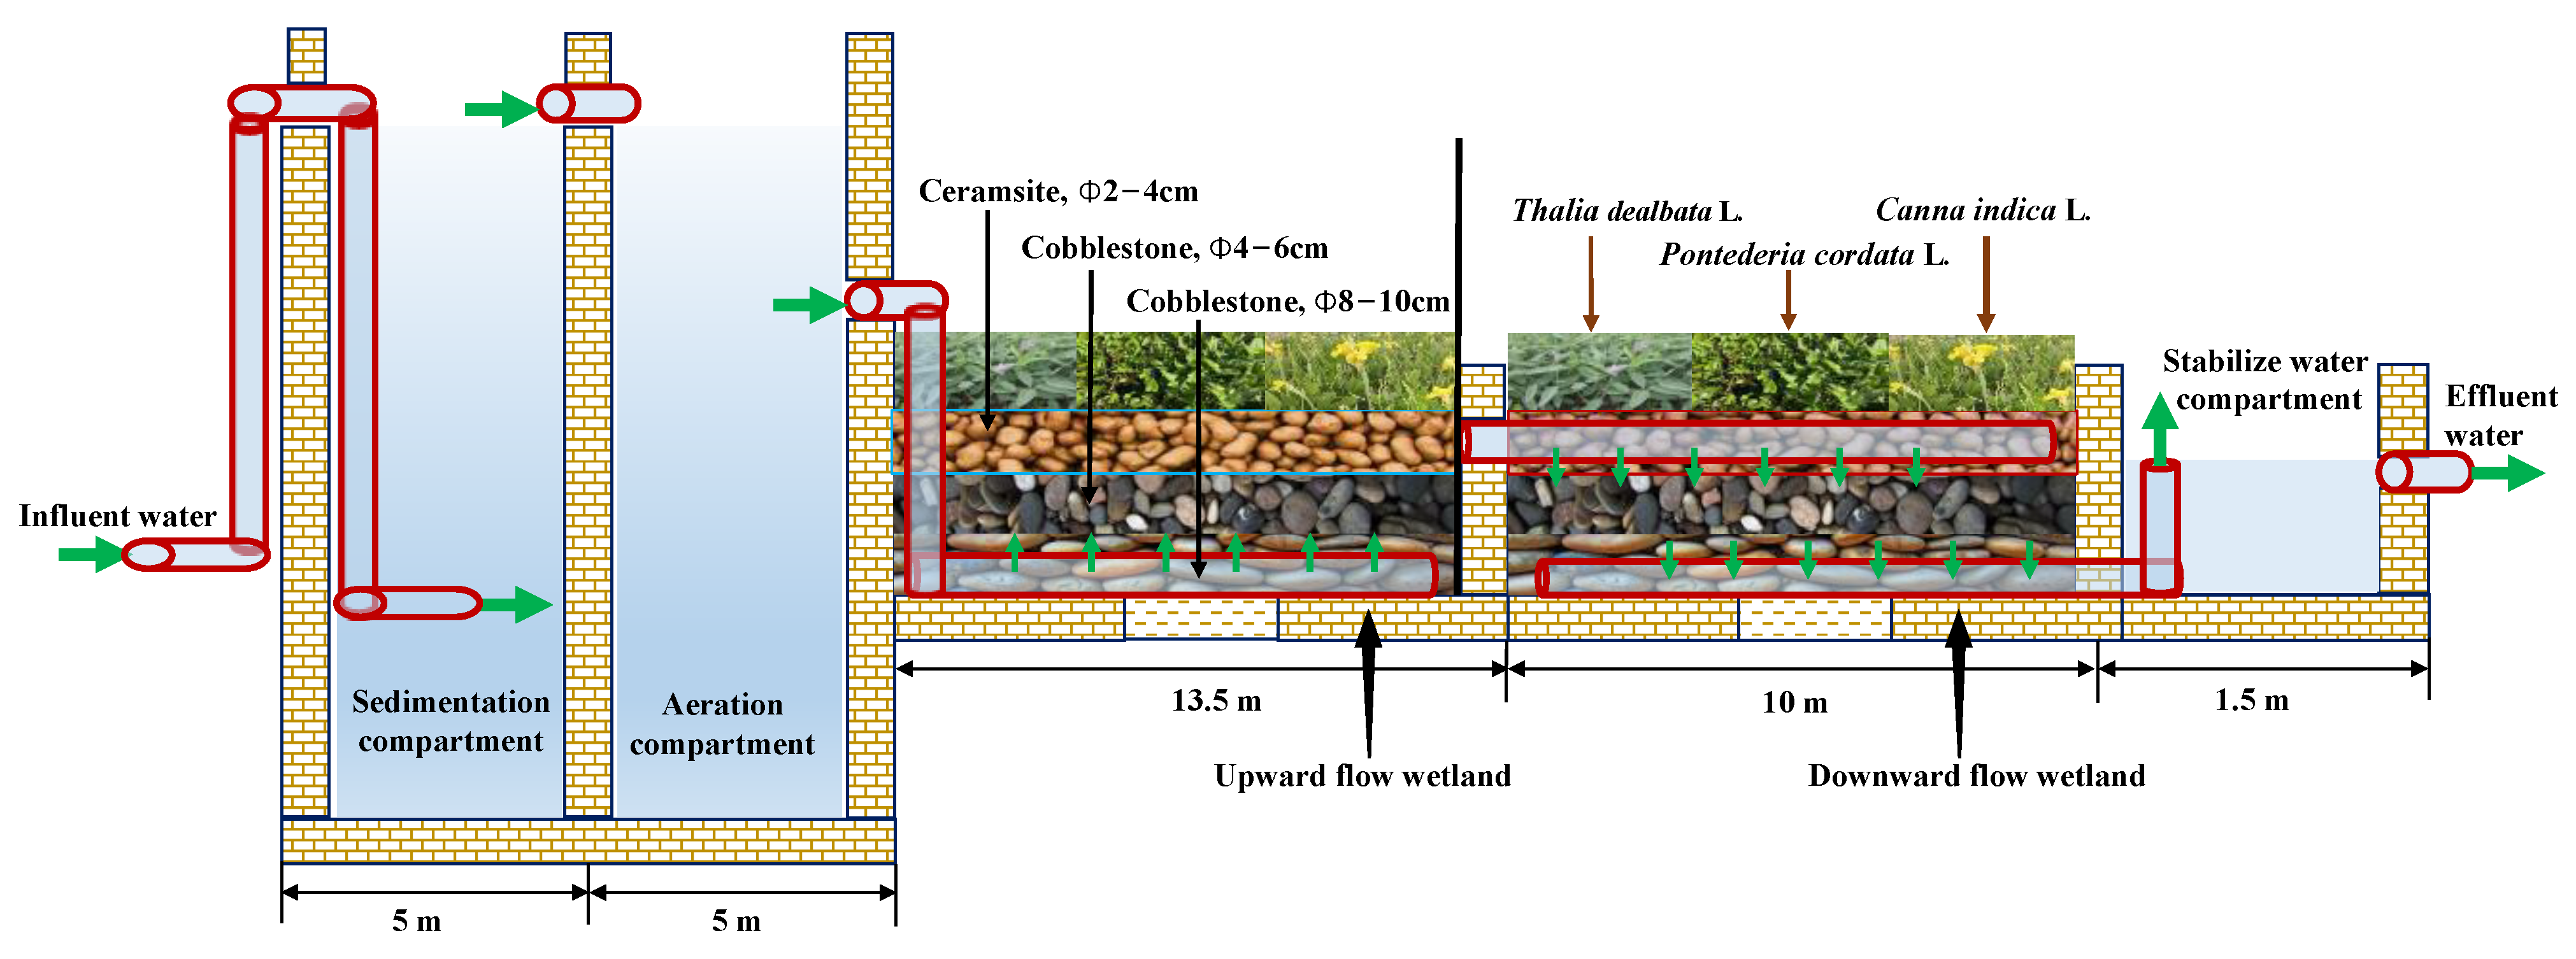
2.1. Constructed Wetlands and Aquaculture System

The research site was located in an aquaculture farm of Freshwater Fisheries Research Center in China (31°18′50.38′′ N, 119°55′38.54′′ E). The hybrid VSFCW (total surface area 450 m2) was built according to the measurements of the existing fish pond, which consisted of a sedimentation compartment (5 m × 7.5 m), continuously aerated compartment (5 m × 7.5 m), upward flow wetland (13.5 m × 15 m), downward flow wetland (10 m × 15 m) and stabilize water compartment (1.5 m × 15 m) (Figure 1). The bottom layer of wetland was filled with 20 cm of cobblestone (diameter 8–10 cm), the middle layer was filled with 20 cm of smaller cobblestone (diameter 4–6 cm), and a layer of 30 cm of biological ceramsite (diameter 2–4 cm) was laid on the top. The wetland was planted with Thalia dealbata L., Pontederia cordata L. and Canna indica L. which have longer growth periods and a stronger uptake capacity of nitrogen, phosphorus and metal [18,19].
The VSFCW was connected with the fish pond (3330 m2) using a pump and pipeline, to construct a recirculating aquaculture system. The treated water volume of the CW was 100 m3/d. The mean hydraulic loading rate (HLR) and hydraulic retention time (HRT) of the CW were 0.28 m3/m2·d and 1.25 d, respectively. Another pond without a water purification system was set as a control, which was managed in an identical way. The water in the CW-connected pond was not exchanged. The CW fish pond system was installed in early May 2013, and the test was conducted in June and July 2013 and formally conducted in August 2013.

2.2. Fish Culturing

In the fish ponds, we adopt a polyculture fish-stocking strategy. A blunt snout bream (Megalobrama amblycephala) was the main culture species, with an average initial weight of 85 g and a stocking density of 0.141 kg/m3. Each pond also contained crucian carp (Carassius auratus), silver carp (Hypophthalmichthys molitrix), bighead carp (Aristichthys nobilis) and grass carp (Ctenopharyngodon idellus). The stocking density of the crucian carp (average initial weight of 71 g), silver carp (average initial weight of 183 g), bighead carp (average initial weight of 135 g) and grass carp (average initial weight of 87 g) was 0.012, 0.021, 0.006 and 0.001 kg/m3, respectively. These fish were provided by the farm of Freshwater Fisheries Research Center. The fish farming began in the April of each year, and the fish were harvested in November of each year. During the study, the fish were fed 4 times per day with a commercial diet (Guangdong HAID Group Co., Ltd., Guangzhou, China) containing 30% crude protein, 4.5% crude fat, 10.8% crude fiber and 15% crude ash at a rate of 3–4% of their body weight. The use of fish was approved by the Freshwater Fisheries Research Centre (FFRC) of the Chinese Academy of Fishery Sciences, Wuxi, China.

2.3. Water Sampling and Water Quality Detection

According to the farming practice, the water quality of ponds may deteriorate at the later stage of farming as the fish grow and feeding diets are increased, thus we monitored the purification effect of CW in August, September and October 2013–2018. Water samples were collected twice per month from the CW inlet, CW outlet, and the control pond. The temperature and dissolved oxygen (DO) were measured using a YSI-DO 200 (YSI Inc., Yellow Springs, OH, USA), and the pH was measured using pH meter SG2 (METTLER TOLEDO, Switzerland). The water quality parameters including TP, TN, NH4+-N, NO2-N, NO3-N and COD were detected using standard methods [20]. Chlorophyl a (Chla) concentration was measured by the spectrophotometric method with acetone extraction [21]. Heavy metal contents, including copper (Cu), lead (Pb), cadmium (Cd) and chromium (Cr) were detected by the method recommended by Chen et al., using Agilent 7500ce ICP-MS (Agilent Technologies, USA) [22]. Total coliforms (TC) and fecal coliforms (FC) counts were measured via the paper strip method and the results were expressed as MPN/mL [23]. Removal efficiency (%) of the CW for each parameter was calculated using Equation (1).
Removal efficiency (%) = (C0 − C1)/C0 × 100
where C0 and C1 are the concentrations of the target parameter in the CW inlet and CW outlet, respectively.

2.4. Statistical Analysis

All data were expressed as mean ± standard error (SE) and calculated using SPSS software (Version 20). The data were confirmed to be of a normal distribution using the Shapiro–Wilk test, or transformed logarithmically in case of no normal distribution. Data were also assessed for heterogeneity of variance by Bartlett test. After an analysis of normal distribution and homogeneity of variances, the differences of water quality parameters among CW inlet, CW outlet and control pond were analyzed using a one-way analysis of variance (ANOVA) with LSD post hoc test, and the significance level was set as p < 0.05.

3. Results

3.1. Monitoring Running Parameters

The CW system was operated from June to November during the study period (2013–2018). The removal efficiency of pollutants in aquaculture wastewater gradually stabilized, and the water quality in the CW-connected pond was clearly improved.
During the experiment period, changes of temperature were similar in the CW influent and effluent, as well as in the control pond. Average temperature values were 28.07 ± 0.34 °C, 25.56 ± 0.29 °C and 22.10 ± 0.35 °C in August September and October during 2013–2018, respectively. Average pH values were, respectively, they were 7.26 ± 0.24, 7.02 ± 0.22 and 7. 03 ± 0.23 in the CW influent and effluent as well as in the control pond, and there were no significant differences among different sampling sites. The pH value varied in the range of 6.34–7.91. Data from different sites and times showed that DO values were kept in a range of 1.03–6.3 mg/L, with an average of 5.65 ± 0.23 mg/L in the control pond, 5.34 ± 0.42 mg/L in the CW inlet, and 1.33 ± 0.47 mg/L in the CW outlet. Interestingly, the DO values were significantly higher in CW inlet than that in CW outlet, indicative of oxygen depletion in the CW. The phenomenon may be caused by the aerobic respiration of heterotrophic microorganisms in CW, which can effectively degrade the pollutants in aquaculture wastewater [16].

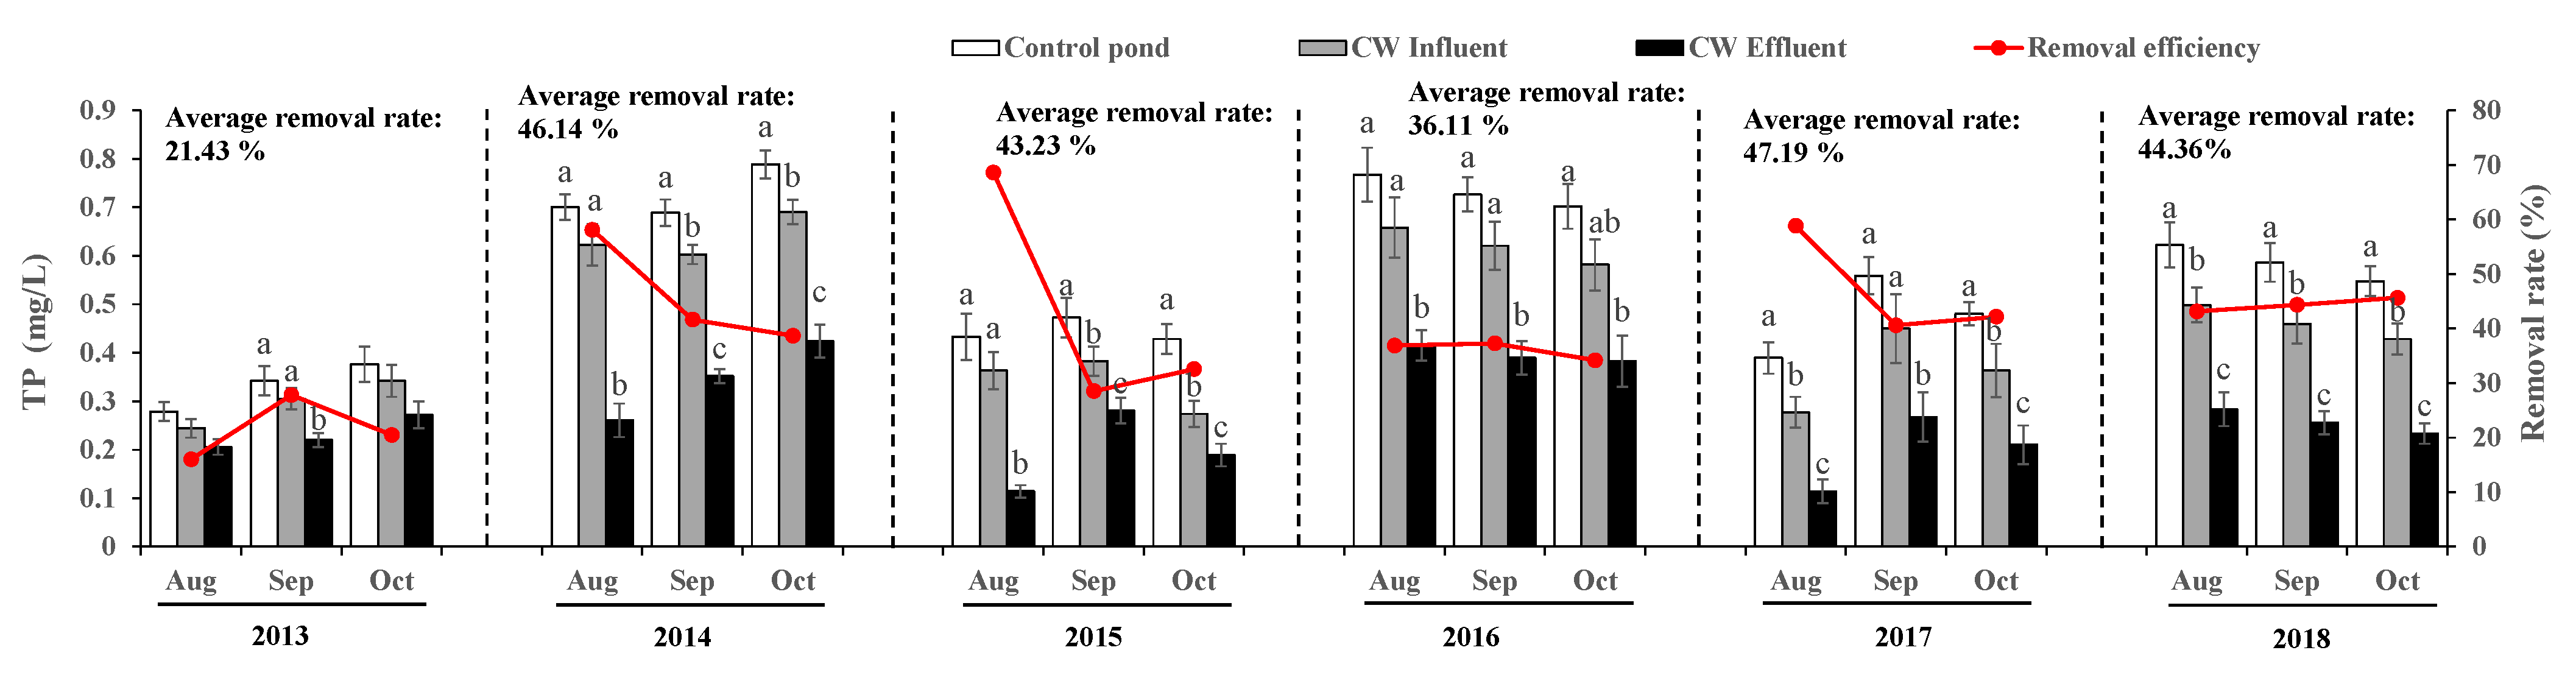
3.2. Removal Efficiency of CW on Phosphorus

During 2013–2018, CW significantly removed the TP content in aquaculture wastewater and the removal rate ranged from 21.43–47.19%, with a mean of 39.74% (Figure 2). The TP value was significantly lower in the CW outlet than that in the CW inlet during the experiment period, except for in August and October 2013 and October 2016 (p < 0.05). Meanwhile, the TP content in the control pond was higher than that for the CW influent, and the differences were of statistical significance in September and October 2014, September and October 2015, August and October 2017 and August, September and October 2018 (p < 0.05).

3.3. Removal Efficiency of CW on Nitrogen

As shown in Figure 3a, TN concentrations were 1.36 ± 0.38–5.31 ± 0.63 mg/L, 0.78 ± 0.15–3.11 ± 0.41 mg/L and 1.96 ± 0.30–5.49 ± 0.72 mg/L in the CW inlet, CW outlet and control pond, respectively, during the monitoring period. During 2013–2018, the average removal rate of TN showed an upward trend, ranging from 17.66–53.54%. The data from 2013 showed a lower removal rate on TN with an average of 17.66% and a lowest removal rate (10.67%) in August. The data from 2017 and 2018 showed a higher and more stable removal rate in August–October The TN concentration obviously decreased in the CW outlet, relative to the CW inlet in August and September 2016, and August–October 2017 and 2018 (p < 0.05). In the control pond, the TN concentration was, overall, higher than that in the CW influent, but there were no significant differences between the two groups except in September and October 2018.
The concentration of NH4+-N in water generally decreased from the CW inlet to CW outlet site, and the decrease was statistically significant in August–October 2013, August 2016, August–October 2017, and September and October 2018 (p < 0.05; Figure 3b). The average reduction rate of NH4+-N was 40.57%, with the lowest removal rate (32.85%) in 2014 and the highest removal rate (53.36%) in 2017. In the control pond, the NH4+-N concentration was generally higher than that in the CW inlet, and the difference was statistically significant in Oct 2013–2016 and September and October 2017–2018 (p < 0.05; Figure 3b).
The variation of the NH3-N level followed a similar trend to NH4+-N, decreasing from 0.023 mg/L (mean) at the inlet to 0.014 mg/L (mean) at the outlet. Specifically, the NH3-N level reduced at the CW outlet compared with the CW inlet in October 2013, September 2014 and 2016, August–October 2017, and August 2018 (p < 0.05; Figure 3c). The CW system revealed an effective removal efficiency for NH3-N, with a reduction rate 30.75–53.28% during the monitoring period.
The NO2-N concentration had temporal variations (Figure 4a). It was high at the beginning (August 2013), but rapidly decreased in September and October 2013. In August–October 2014, the NO2-N concentration showed a rising tendency with time. In 2015–2016, the NO2-N concentration showed a slight variation at different times. The mean NO2-N concentration at the outlet was signally lower than that at inlet during the entire monitoring period, except in August 2013 and October 2015 (p < 0.05; Figure 4a). The highest removal rate of 63.85% was observed in 2014, and the average removal rate was 49.53% during 2013–2018. Moreover, the NO2-N concentration in the control pond was generally higher than that in the CW inlet, and significant differences occurred in September and October 2013, September 2015, September and October 2016, October 2017 and September 2018 (p < 0.05; Figure 4a).
During the operation of the CW system, the NO3-N concentration at the CW outlet declined compared with the CW inlet, and significant differences were seen in October 2014, September and October 2015, August–October 2016 and 2017, and August and September 2018 (p < 0.05; Figure 4b). The reduction rate ranged from 30.32% to 56.01%. We also found that the NO3-N concentration in the control pond was generally higher than that in the CW inlet, and significant differences occurred in October 2013, September and October 2014–2015, October 2016 and 2017, and September 2018 (p < 0.05; Figure 4b).

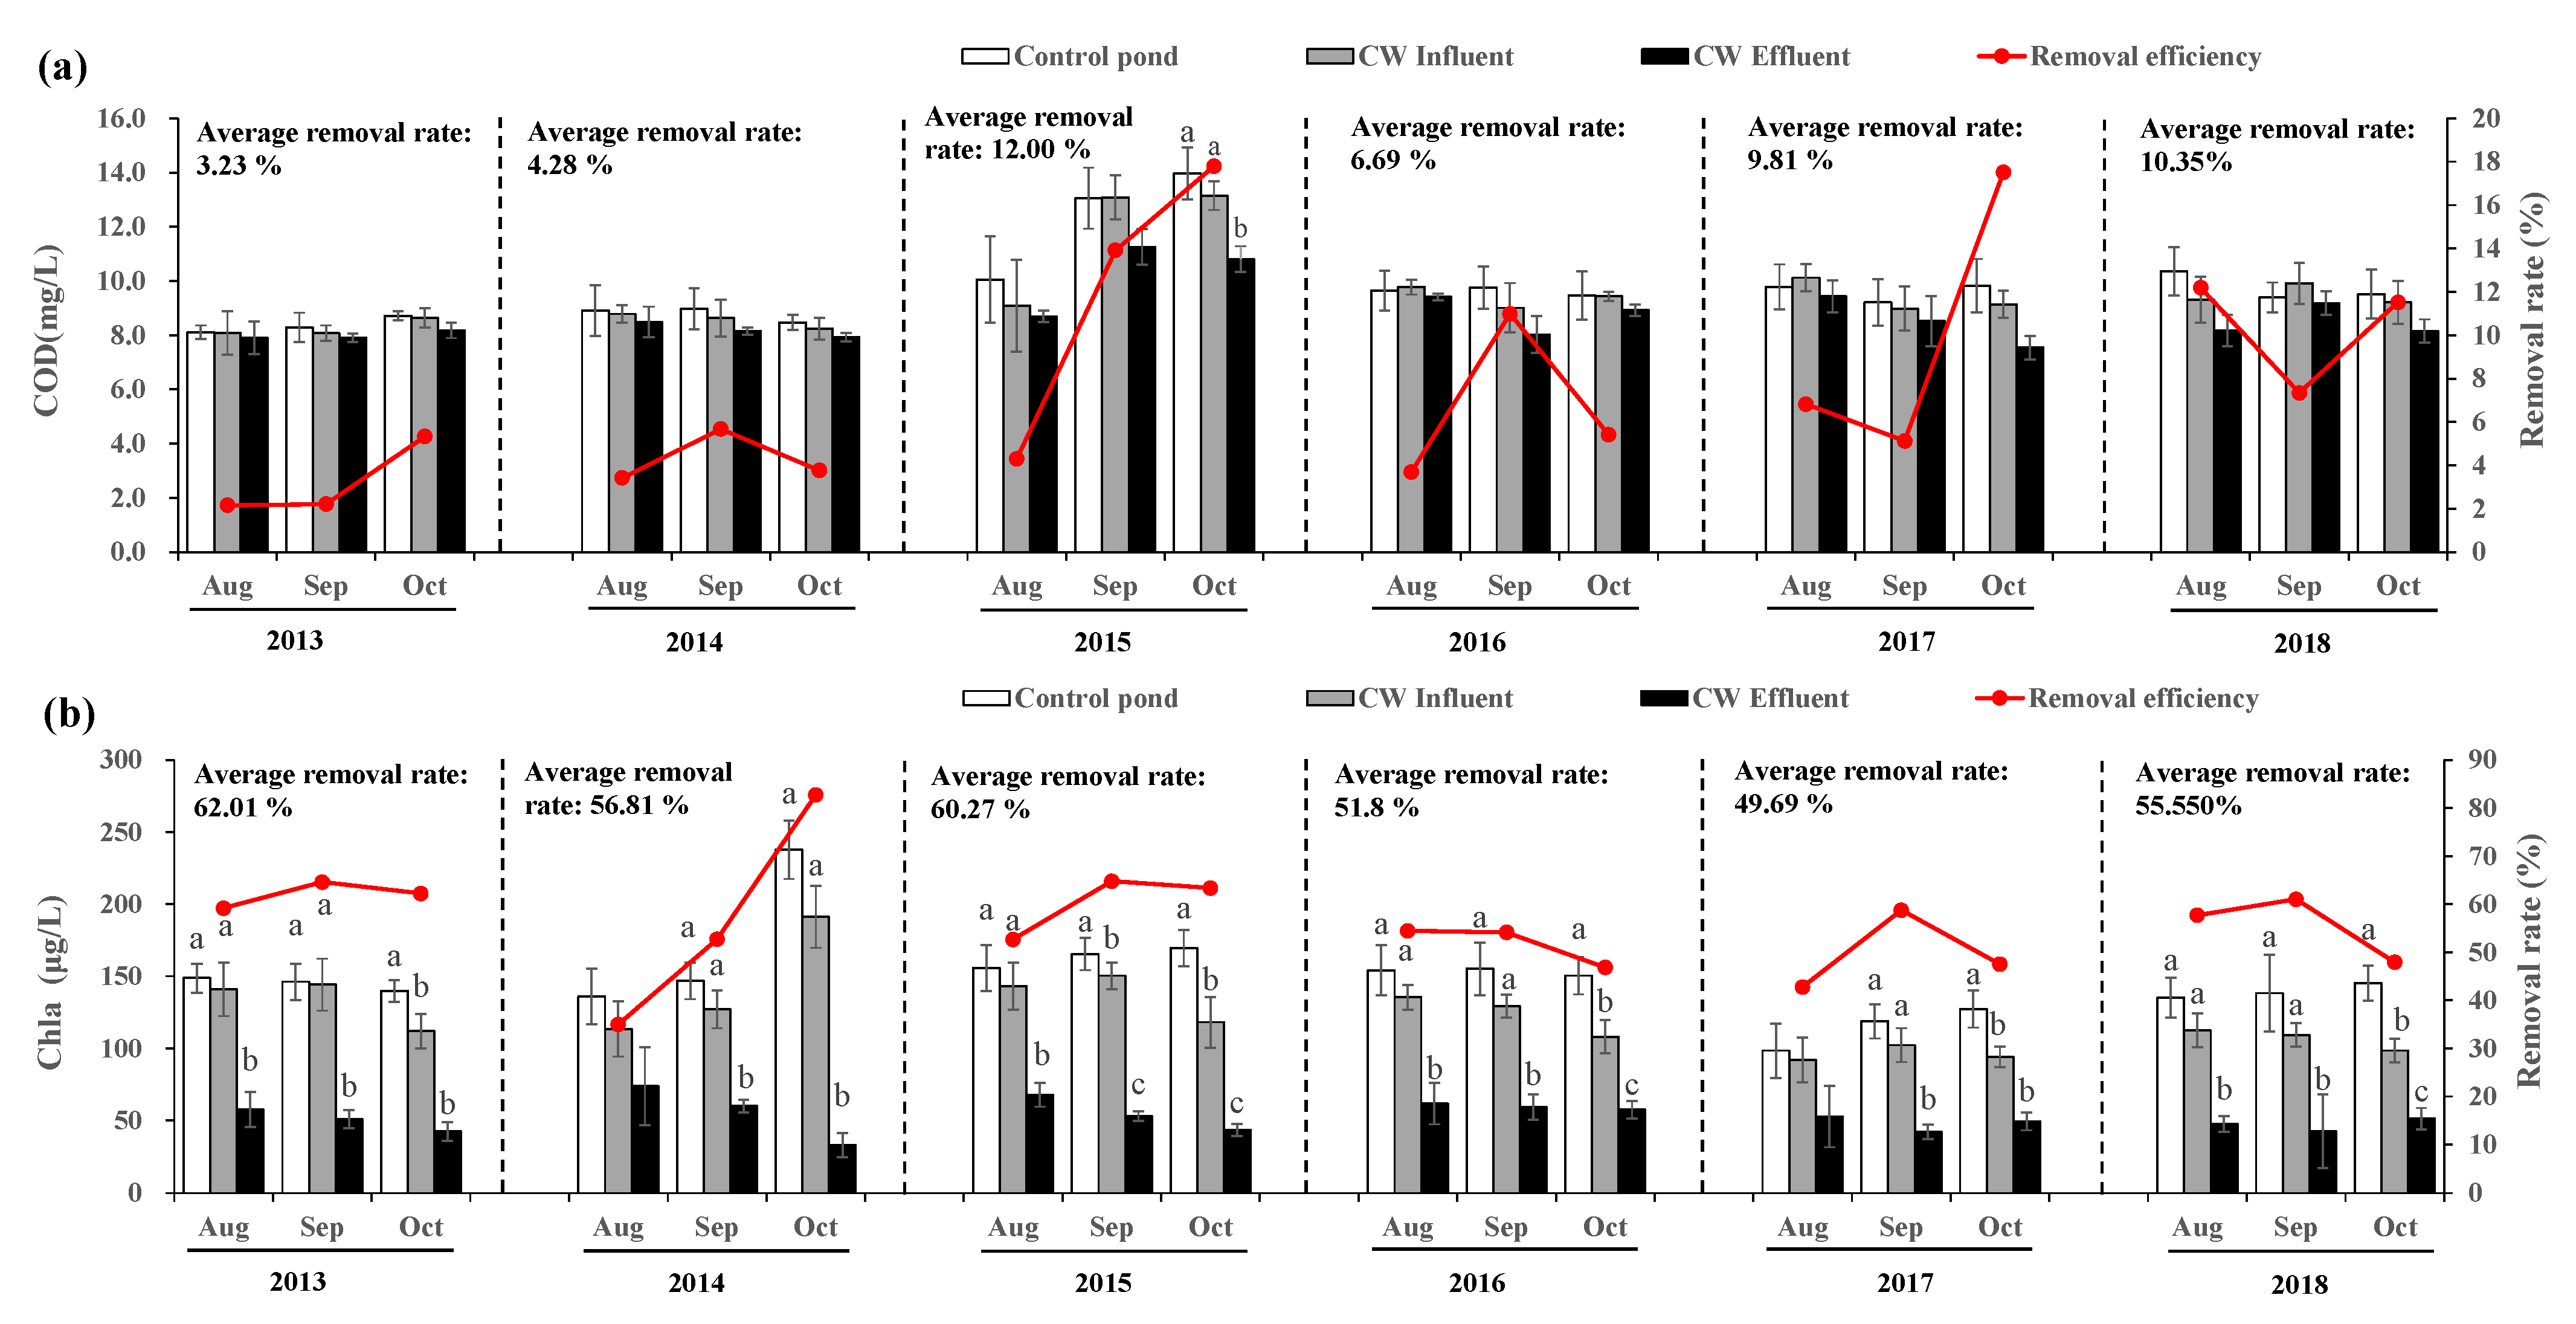
3.4. Removal Efficiency of CW on COD

COD detection was concerned for an analysis of organic matter content in the control pond, CW inlet and CW outlet (Figure 5a). As a result, the CW system was found to have a slight impact on the reduction of COD, and the removal rate ranged from 3.23–12.00%. There was no difference in COD value among the CW inlet, CW outlet and control pond during the monitoring period except in October 2015.

3.5. Removal Efficiency of CW on Chlorophyll a

As shown in Figure 5b, the CW system had a stronger removal efficiency for Chla in the aquaculture effluent. The average Chla value at the CW inlet was 123.43 μg/L, whereas the average Chla value at the CW outlet dropped to 52.55 μg/L during the monitoring period. Specifically, the Chla value at the CW outlet was obviously lower than that at the inlet during 2013–2018, except for in August 2014 and 2017 (p < 0.05). The removal rate of Chla was more than 49.69% and the highest value was 73.67% in October 2014. Meanwhile, compared with the CW inlet, the Chla concentration was higher in the control pond, and a markedly higher value was observed in October 2016–2018 (p < 0.05).

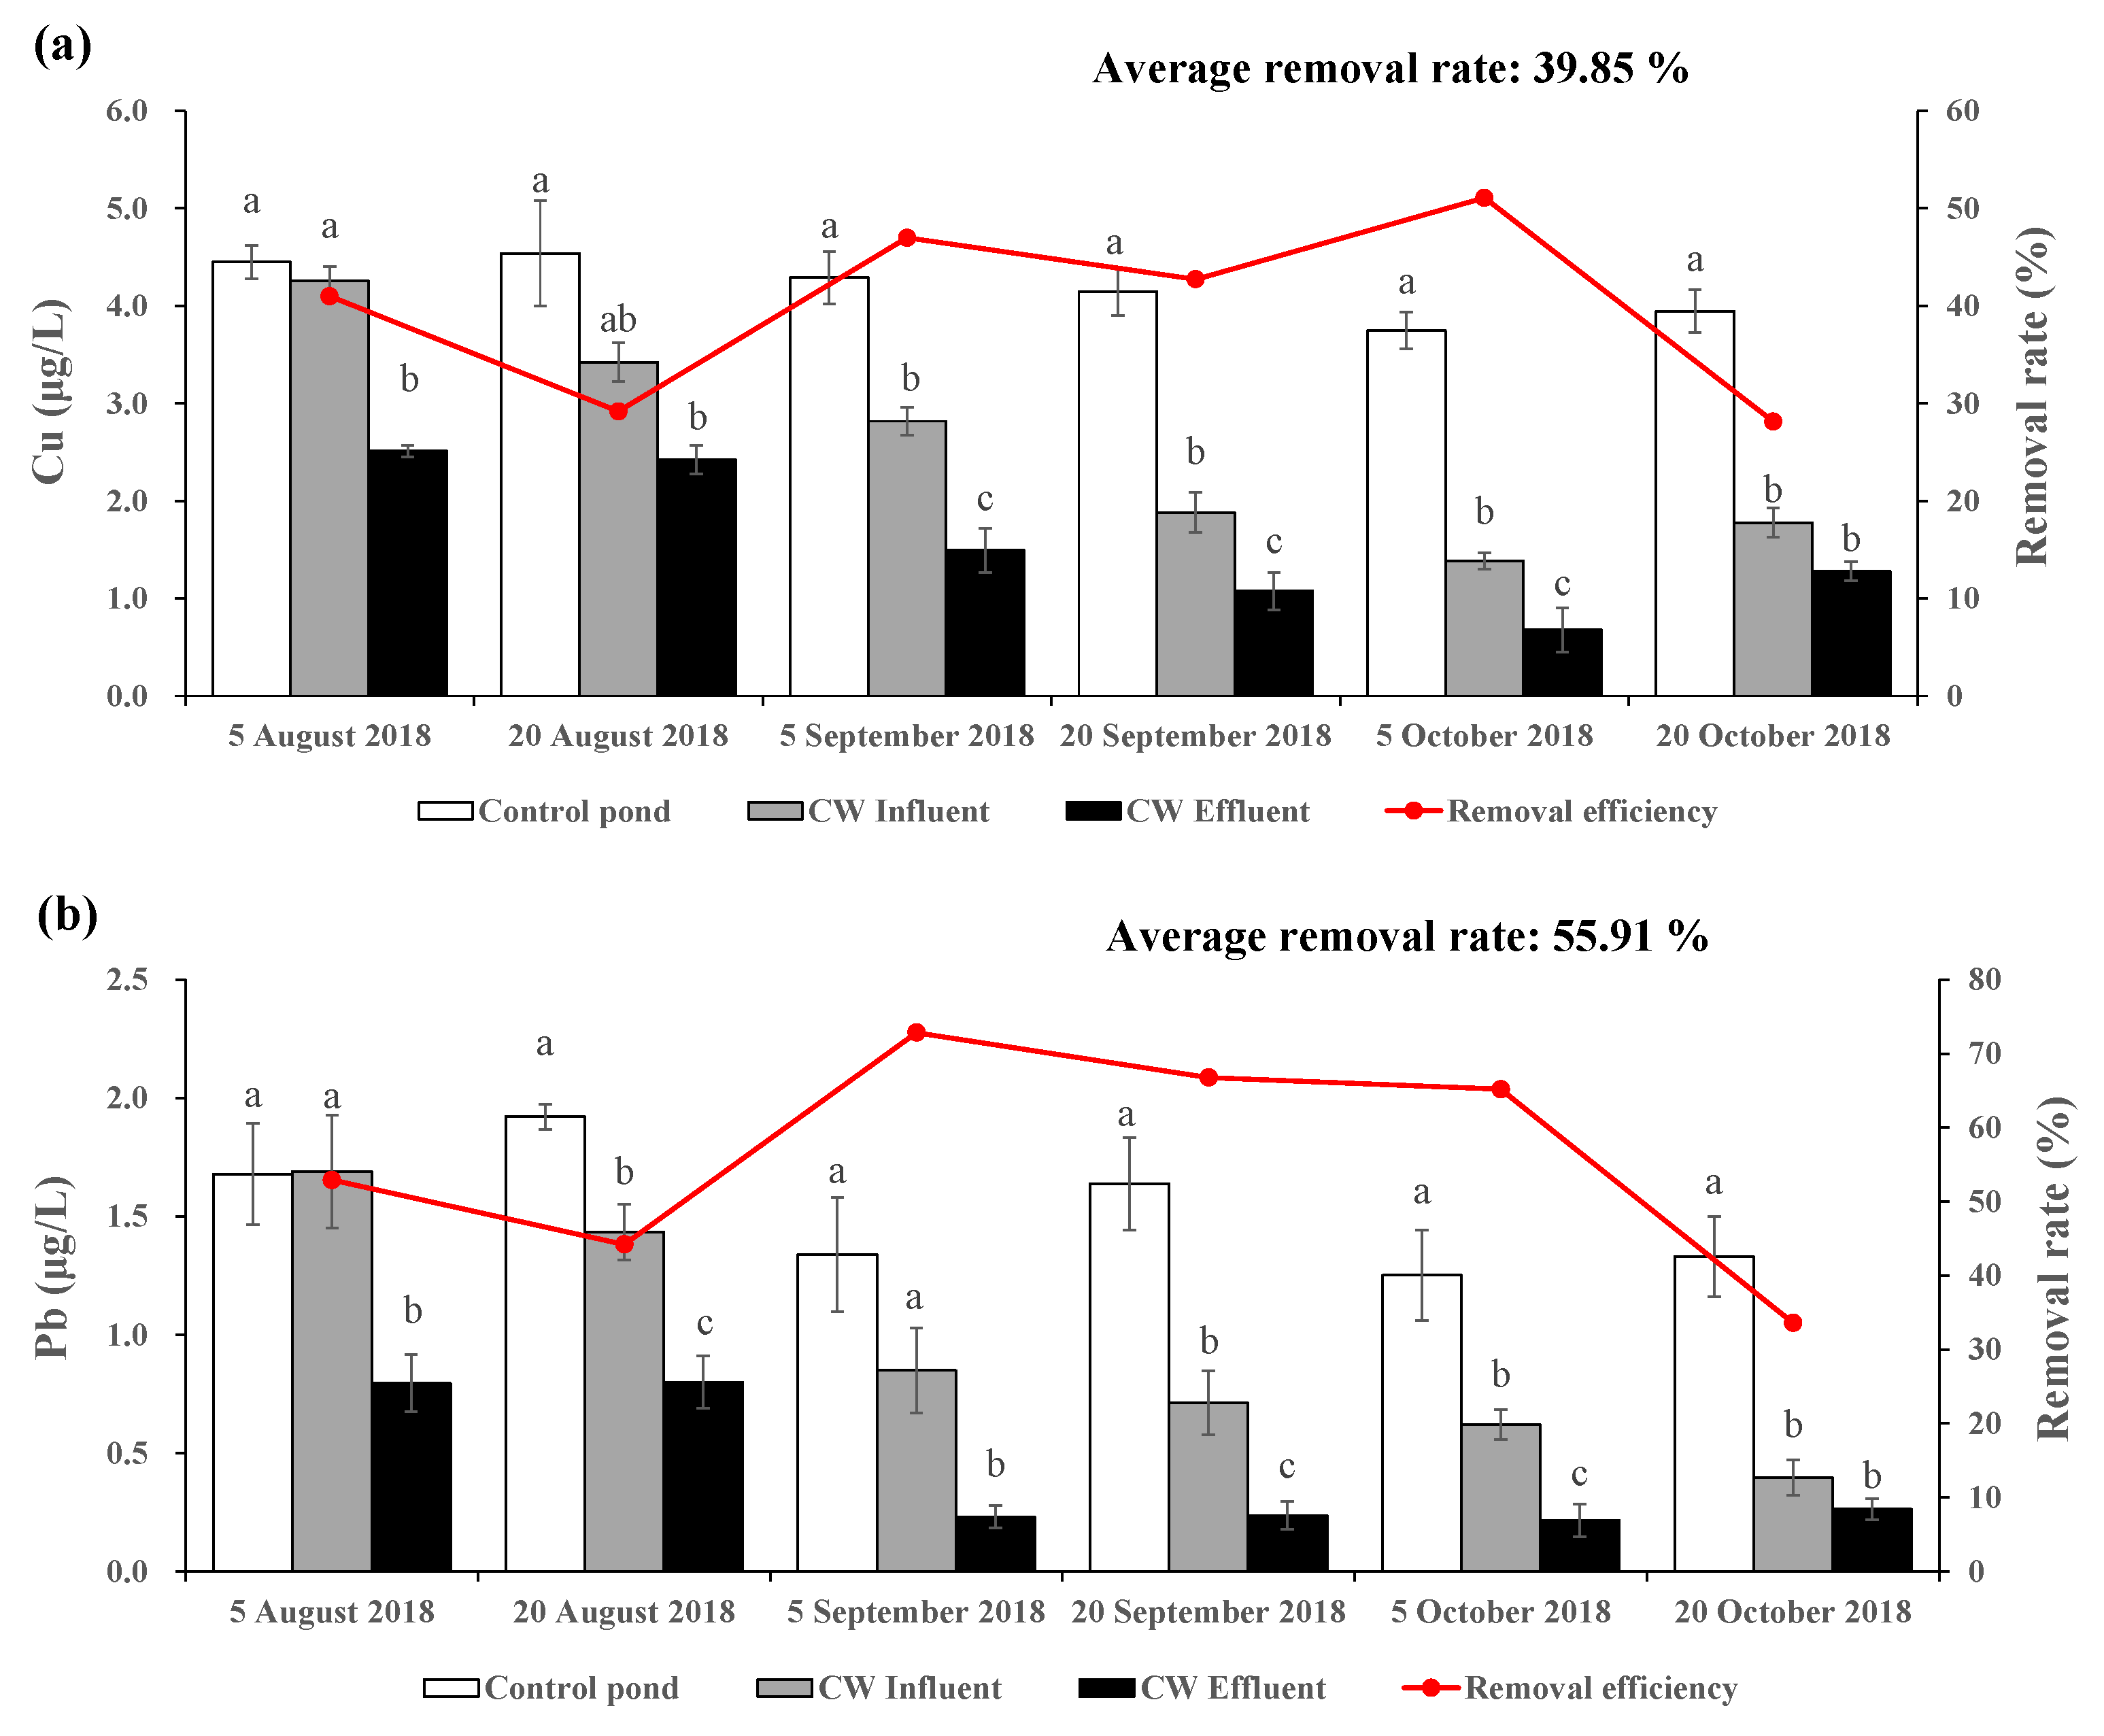
3.6. Removal Efficiency of CW on Heavy Metals

In August–October 2018, four heavy metals, including Cu, Pb, Cd and Cr, were detected to analyze the removal efficiency of the CW on heavy metals. Cr and Cd concentration in the aquaculture water was below the method detection limits. The two metals might not influence the quality of aquaculture water. The CW system was effective in removing Cu from the aquaculture effluent (Figure 6a). Cu concentrations tended to decline from the CW inlet to CW outlet site, from 2.59 μg/L at the CW inlet to 1.58 μg/L at CW outlet, and the average removal rate was 39.85%. There was a significant difference in Cu concentration between the CW inlet and CW outlet on 5 August, 5 September, 20 September and 5 October. In addition, with operation time, the Cu concentration in the CW inlet was found to be lower than that in the control pond, and a significant difference occurred on 5 September–20 October (p < 0.05).
The Pb concentration was found to have similar temporal variations of Cu, which was lower in the CW outlet than the inlet during 5 August–5 October 2018 (p < 0.05; Figure 6b). The removal rate ranged from 33.68–72.81%, and the mean removal rate was 55.91%. During 20 August–20 October 2018, Pb concentration was higher in the control pond than that in the CW inlet (p < 0.05; Figure 6b).

3.7. Removal Efficiency of CW on Pathogenic Microorganism

To further analyze the removal efficiency of CW on aquaculture effluent, we measured the counts of TC and FC in August–October 2018 (Figure 7). TC counts in water samples consistently decreased from the CW influent to CW effluent during August–October 2018 (p < 0.05; Figure 7a). The removal rate varied from 51.51 to 63.33%, with an average value of 55.93% (Figure 7a). Although the TC counts in the control pond were generally higher compared with the CW inlet, there were no significant differences between the two ponds. Similarly, the counts of FC in the CW effluent were notably reduced compared to the CW influent in August-October 2018 (p < 0.05; Figure 7b). The reduction rate slightly increased with the operation time, ranging from 33.33 to 55.56%. In addition, counts of FC were visibly higher in the control pond than that in CW influent on August 20th and October 20th (p < 0.05; Figure 7b).

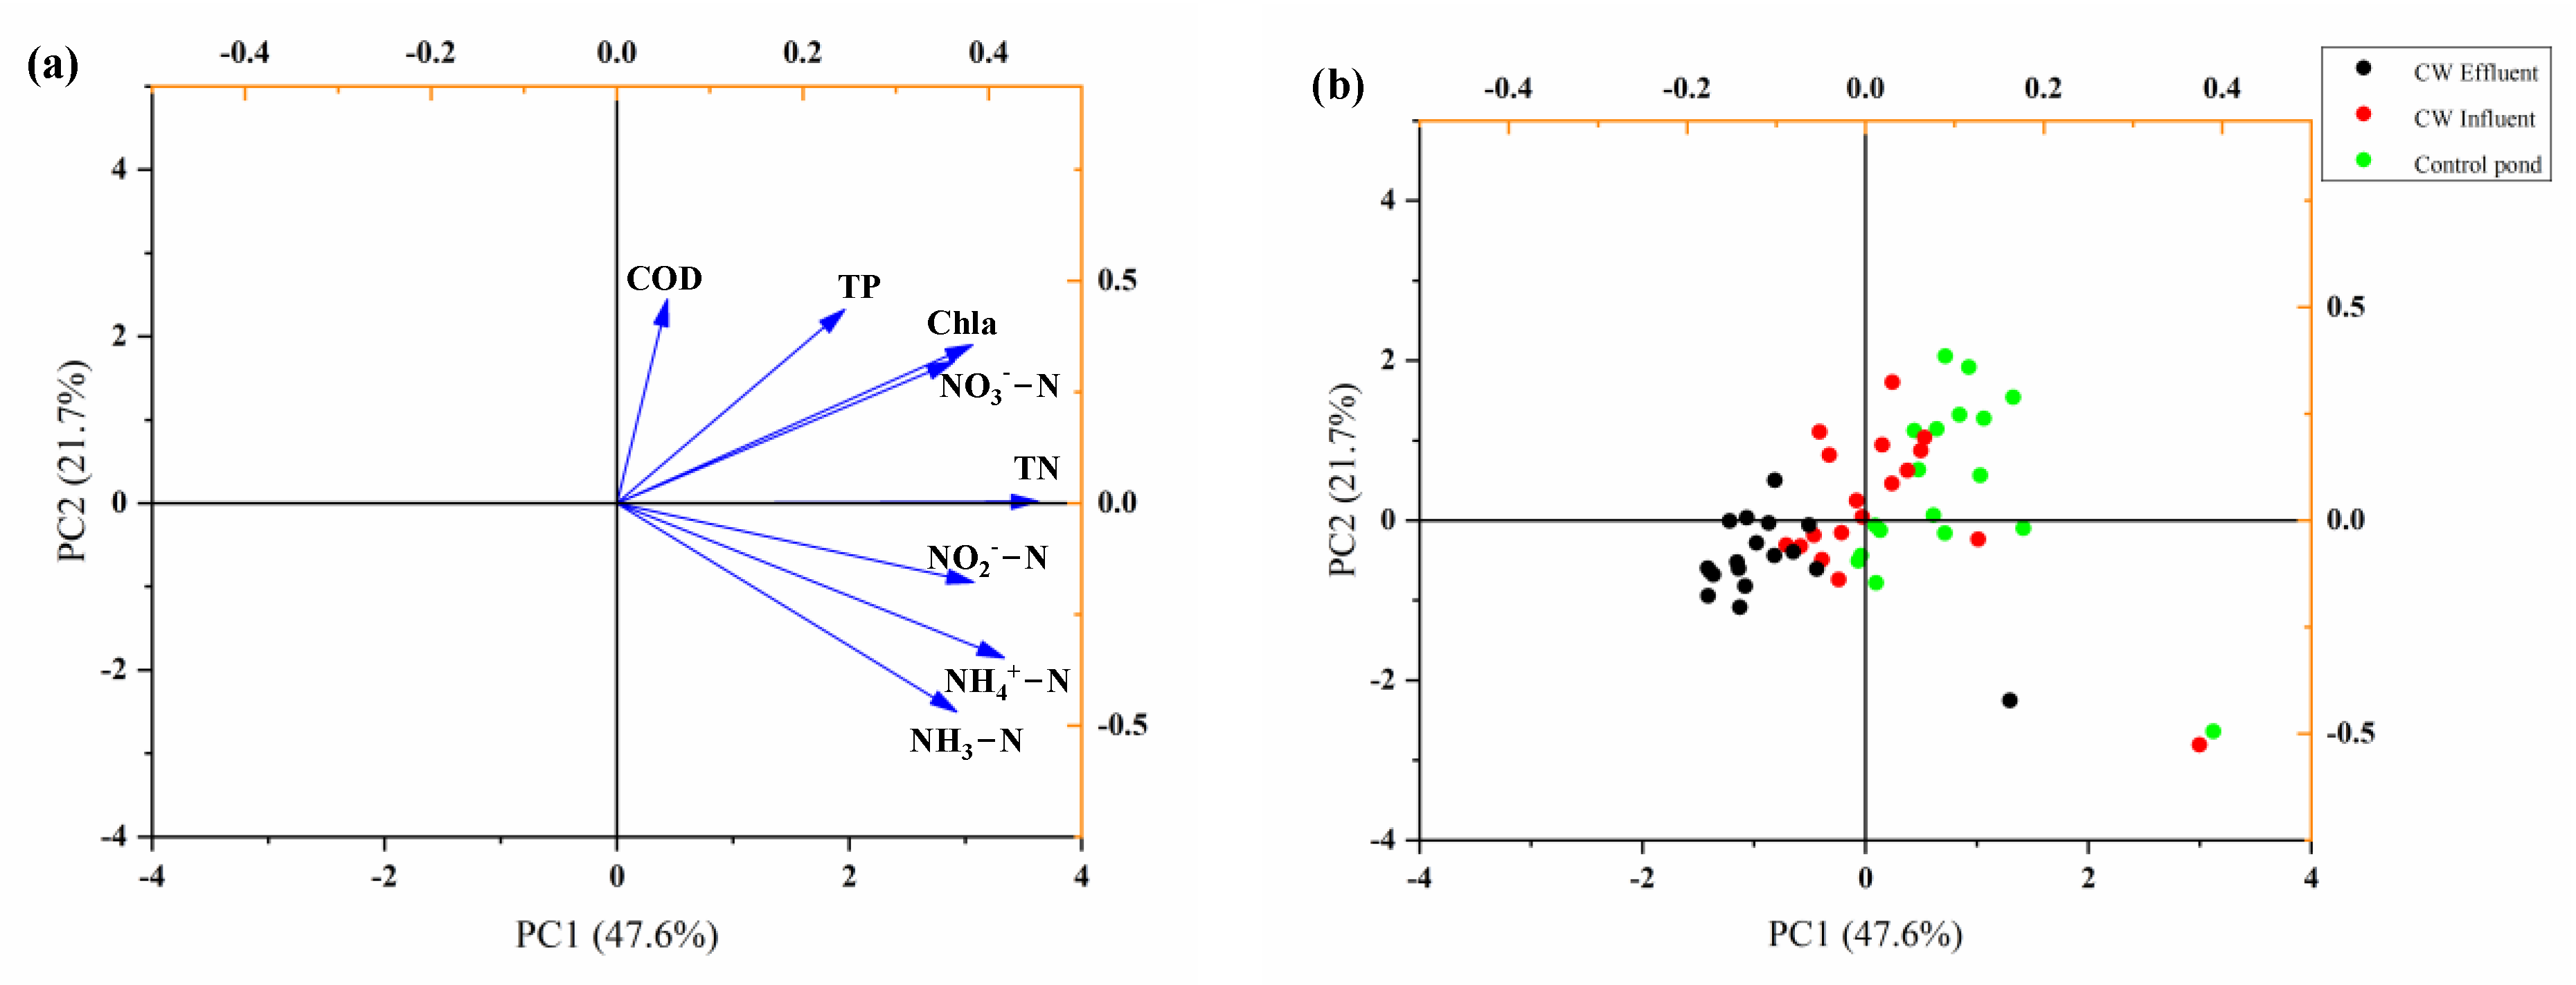
3.8. Principal Component Analysis for Water Quality Characteristics

A principal component analysis (PCA) of eight abiotic variables in water are shown in Figure 8. The first two components accounted for 69.3% of the data variability. For the first component (PC1, 47.6%), the most important variables were TN (0.45), NH4+-N (0.42), NO2-N (0.38) and Chla (0.38) (Figure 8a). For the second component (PC2, 21.7%), NH3-N (−0.47), COD (0.46) and TP (0.44) were the most important variables for this ordination (Figure 8a). As shown in Figure 8b, the values were clustered primarily according to sampling sites, and there was a certain separation when the samples belonged to the same sampling site. These results indicate that water quality characteristics varied among the control pond, CW influent and CW effluent during 2013–2018. Meanwhile, the water quality at the CW outlet was significantly improved.

3.9. Fish Breeding

During the experiment, no outbreaks of disease or massive deaths occurred. In the CW-connected pond, the average food coefficient was 1.65 ± 0.046 (p = 0.047 vs. control pond, t-test), and the average survival rate was 89.9 ± 1.91% (p = 0.045 vs. control pond, t-test). In the control pond, the average food coefficient was 1.86 ± 0.058, and the average survival rate was 82.7 ± 1.04%. These results imply that the fish in the CW-connected pond showed better growth performance, which might be related to the improvement of water quality.

4. Discussion

In aquaculture, water quality is one of the most important factors influencing the growth, survival, development, reproduction, and management of farmed creatures. It is affected by physical, chemical, and biological factors such as temperature, pH, DO, nitrogen, phosphorus and microorganisms. In addition to causing stress for farmed fish or shrimps, poor water quality can also lead to environmental impacts if it is directly released into surface water bodies. Thus, it is necessary to set up an effluent treatment system in aquaculture ponds, especially in an extensive culture.
In the aquaculture pond, a number of water quality variables were recorded, only few of these tend to play an important role. P is known to be a significant factor influencing fish populations, and its concentration is closely related to algal diversity and density [24]. High levels of P can cause eutrophication and water quality deterioration [25]. Thus, TP concentration is regarded as a common index to evaluate water quality. It has been reported that CW systems are an effective way to remove the P concentration from water, has and have been widely used in urban sewage treatment [26]. A recent study demonstrated that the removal rate of CW on TP reached up to 78.39% in polluted water of an urban river [7]. The CW system was also reported to be effective in the removal of TP (42%) in contaminated runoff/storm water from urban area [27]. In aquaculture effluent treatment, a study under laboratory-based CW showed an average of 31% in TP reduction [16]. In line with the previous study, our results showed that the CW system was able to effectively remove TP (39.74%) during 2013–2018. Meanwhile, we found that the TP concentration at the outlet was lower than the level of the effluent discharge standard of China [28]. In CW, the aquatic macrophytes are able to absorb nutrients through roots to reduce P content [29]. Furthermore, the adsorption of geological substrates, such as gravel, ceramsite limestone and zeolite also provides a mechanism for P removal in wetlands [30,31].
Nitrogen (N) is an essential nutrient for the growth of aquatic plants, but it is also considered to be an important pollutant in aquatic environments. N enrichment in the aquatic ecosystem impairs water quality and contributes to the phenomenon of eutrophication, which is responsible for toxic algal blooms, water anoxia, aquatic animal survival and habitat and biodiversity loss [32]. In the aquaculture pond, the primary source of N is metabolic waste and uneaten feed, and it may accumulate as a result of overfeeding [4]. Thus, N removal in aquaculture wastewater improves the water quality, which is a benefit to the growth of farmed aquatic animals [33]. Evidence has shown that CW is frequently applied for N removal and significantly reduces the TN concentration in waste water. In CW systems, wastewater is subjected to physical, chemical and microbial actions such as precipitation, aeration, filtration, adsorption and nitrification [27,34]. Different types of CW systems exhibit different TN removal efficiency. For instance, the TN removal rate in floating-bed CW, horizontal subsurface flow CW, and surface flow CW was 12.35%, 64.66%, and 23.00%, respectively [7]. In the present study, a vertical subsurface flow CW was used to purify the farming water, and TN removal efficiency was lower in 2013 (17.66%), and higher and relatively stable in 2017 (53.54%) and 2018 (48.98%). The lower TN removal efficiency may be attributable to imperfect management measures at the beginning of the system’s operation. The fluctuation of the TN removal rate (−42.9–78.9%) was also reported in a large-scale CW system (2 ha), which may be related to the season and abundance of aquatic plants [27]. Meanwhile, our results revealed that the majority of the TN concentration during the monitoring period at the outlet met the water quality standard of Class I in the freshwater sewage discharge standards of China (SCT9101-2017) [28], which indicated that the vertical subsurface flow of CW had good effectiveness for TN removal.
There are multiple forms of N in water, such as NH4+-N, NH3-N, NO3-N and NO2-N. Among these, NH3 and NO2- were the most concerning water quality indicators in the aquatic environment due to their high toxicity on aquatic animals [35,36]. High levels of NH3 and NO2-N- inhibit growth performance, induce physiological dysfunction and can even cause death in fish [37]. Hang pham et al. reported that horizontal subsurface flow CW had a clear impact on the removal of NO3-N and NO2-N, and allowed these parameters to maintain at a low level in CW-connected shrimp tanks [16]. Lin et al. [38] found an extremely high removal rate of CW on NH4+-N (>86%), NO3-N (>82%) and NO2-N (>99%), and they speculated that this might be related to low N concentrations in aquaculture wastewater. These values were similar to our study, where the average removal rate was 40.88%, 40.28%, 42.21% and 49.53% for NH4+-N, NH3-N, NO3-N and NO2-N, respectively, indicating that CW had a stable removal performance for inorganic nitrogen in aquaculture wastewater.
It has been reported that N is removed in CW via a complex process, such as aquatic plants’ uptake, microbial nitrifcation–denitrifcation, substrate adsorption, NO2 emission and volatilization [39,40]. In general, aquatic plants can absorb N from water for growth, which reduces the TN concentration in water. Previous studies have shown that Thalia dealbata L., and Pontederia cordata L. had an effective uptake of N, leading to a 54.09% and 77.39% reduction of NH4+-N, and 66.44% and 68.56% reduction of TN, respectively [41]. In this study, we also planted Thalia dealbata L. and Pontederia cordata L. in the CW. However, some forms of N, such as NH3-N, were harmful to the growth of aquatic plants, and thus were not easily absorbed by aquatic plants [27,42]. In CW, existing studies suggest that ammonification, nitrification and denitrification are the main methods of N removal, accounting for more than 50% of the reduction rate, but not aquatic plants’ uptake [39,40,43]. However, these N-removal methods are limited due to the lack of organic carbon and the low DO level in conventional CW, in which the TN removal rate is around 40% [39,44]. In this study, N removal may be also limited due to a low DO level (1.33 ± 0.47 mg/L at the outlet). Thus, advanced techniques are required so as to improve the CW performance in future studies. The N removal mechanism in CW requires further study.
COD is a common parameter to reflect the pollution of organic and inorganic oxidable substances in water, often used to evaluate organic pollutants in the aquatic environment. COD reduction in CW relates to plants uptake, matrix adsorption and microbial decomposition, but largely depends on the number and growth of micro-organisms [45,46]. Therefore, DO content is considered to be a limiting factor for COD removal, and insufficient DO affects the activity of microorganisms, which limits COD degradation in CW [47]. Nevertheless, it has been suggested that sedimentation and filtration are also important mechanisms of COD removal because they can remove most of the suspended solids [16]. Numerous studies have confirmed that VSF CW exhibits a good efficiency in COD removal, achieving a removal rate of more than 60% [48,49]. However, in this study, the CW showed a low COD removal rate ranging from 3.23–12.00%. The reason for the phenomenon is still unclear. We speculated that it may be related to a low DO content in CW. In addition, although the COD removal of the VSF CW was low, its concentration remained stable at a low level in the CW outlet, which was lower than the threshold value (15 mg/L) in freshwater the sewage discharge standard of China (SCT9101-2017) [28].
Chla, as a photosynthetic pigment, is widely used to assess the phytoplankton biomass in water bodies due to its extensive presence in various phytoplankton, including algae and cyanobacteria [50]. Excessive phytoplankton, especially cyanobacteria, can cause poor water quality and have negative effects on fish and shrimps in ponds [51]. It has been confirmed that aquatic macrophytes can inhibit the growth of algae and control algal bloom [52]. The inhibitory effect may be related to competition for nutrients, light and other resources with algae [52,53]. An earlier study reported that CW had a stable reduction percentage for Chla (58 to 73%) in aquaculture pond water [10]. In our study, using VSF CW, we achieved a similar Chla removal rate (49.69–62.01%). Meanwhile, our data also displayed a relatively stable removal rate for Chla during 2013–2018. These results indicate that CW could control the phytoplankton density in pond water and improve water quality. In addition to aquatic macrophytes inhibition, Chla reduction might relate to filtration and substrate adsorption [54].
Besides nutrients and organic matter, heavy metals are also important pollutants in water. High levels of heavy metals are highly toxic to aquatic animals, and they can also be accumulated in the muscles of fish or shrimps, which may cause an adverse impact on food safety [55,56]. CW has been applied extensively for the removal of heavy metals from urban sewage through different mechanisms [57]. The capacity of wetland plants for heavy metals removal is shown in many studies [58,59]. Previous studies confirmed that Thalia dealbata L., Pontederia cordata L. and Canna indica L. can uptake various metals from water and sediments, and store them in their tissues [18,60]. Thalia dealbata has been successfully used for the bioremediation of wastewaters polluted with Cd, Cu and Mn [18,61,62]. Canna indica L. is considered to be a promising species for heavy metal phytoremediation due to a fast growth rate and large biomass, and the fact that it is highly efficient in removing Cd, Pb, Ni and Zn [63,64,65]. A laboratory-scale CW planted with Canna generalis showed the effective removal of heavy metals in wastewater, with a removal efficiency of 96.5% for Cu, 69.5% for Cd and 68.4% Zn [66]. However, in a large-scale CW, the removal of heavy metals was not significant [27]. In this study, Cu and Pb concentrations were detected, but the Cd and Cr concentrations were below the detection limit in farming water. Meanwhile, the CW exhibited a relatively stable removal efficiency, with an average removal rate of 39.85% for Cu and 55.91% for Pb. The removal of Cu and Pb was possibly related to the uptake of wetland plants Thalia dealbata L., Pontederia cordata L. and Canna indica L.
Pathogenic micro-organisms were identified as important factors affecting water quality in aquaculture. TC and FC are the most significant indices for assessing microbial pollution in water. In aquaculture wastewater treatment, the removal of microbiological pollution is a crucial target for CWs. It can remove pathogenic microorganisms by multiple mechanisms, viz. sedimentation, natural die-off, biofilm sorption and predation by protozoans and bacteriophages [67,68]. In addition, the exudates from the roots of wetlands plants can control pathogenic bacteria [69]. Vymazal [70] surveyed 60 CWs, and found that the TC and FC removal rate in CW with emergent macrophytes was high (95 to >99%). In this study, a stable removal rate for TC (55.93%) and FC (48.93%) in the CW system was observed, similar to FC removal rate (68%) reported by a previous study [27]. Meanwhile, the counts of TC and FC at the CW outlet were less than the limit value in water quality standards for fisheries of China (GB11607-89) [71] and the environmental quality standards for class III surface water of China (GB3838-2002) [72], which indicate that the CW system was effective in removing microbial contaminants.

5. Conclusions

In the study, we built a farm-scale vertical subsurface flow CW, and its performance was evaluated during the later stage of blunt snout bream farming. The water quality was improved through the remediation of the CW system, and the concentrations of nutrients, Chla, heavy metals and pathogenic microorganisms at the outlet were significantly reduced. In general, the removal efficiency of the CW system for TP, TN, NH4+-N, NH3-N, NO3-N and NO2-N was effective and relatively stable during 2013–2018. TP and TN concentrations during the monitoring period at the outlet met the water quality of Class I in the freshwater sewage discharge standard of China (SCT9101-2017). The Cu and Pb reduction suggest the purification system to be effective in removing heavy metals. Furthermore, after CW-system treatment, the counts of TC and FC at the CW outlet were below the critical level for fisheries’ water. In addition, the fish in the CW-connected pond demonstrated better growth performance than those in the control pond. Because of the water quality improvement, the treated effluent is found to be suitable for recycling and reuse in the fish pond, which can regulate the water quality of the pond. Therefore, the application of CW in intensive fish culture systems may provide an advantageous alternative for ensuring environmental sustainability.

Author Contributions

Conceptualization, X.G. and J.Z.; methodology, B.L.; software, R.J.; validation, B.L., Y.H. and C.Z.; formal analysis, B.L.; investigation, B.L. and Y.H.; resources, C.Z.; data curation, R.J.; writing—original draft preparation, B.L.; writing—review and editing, R.J. and X.G; visualization, Y.H.; supervision, X.G.; project administration, J.Z.; funding acquisition, J.Z. All authors have read and agreed to the published version of the manuscript.

Funding

This research was funded by China Agriculture Research System of MOF and MARA, grant number (CARS-46) and the Major Projects of Fishery Technology in Jiangsu Province, grant number (No. D2018-3).

Institutional Review Board Statement

Not applicable.

Informed Consent Statement

Not applicable.

Data Availability Statement

Data is contained within the article.

Conflicts of Interest

The authors declare no conflict of interest.

References

  1. Yu, X.; Xu, L.; Wu, F. China Fishery Statistical Yearbook; China Agriculture Press: Beijing, China, 2020. [Google Scholar]
  2. Hossain, M.A.; Sarker, A.K.; Amin, M.N.; Hossain, M.M.; Miah, M.S. Development and performance evaluation of sludge remover for intensive aquaculture. Aquac. Eng. 2016, 74, 62–69. [Google Scholar] [CrossRef]
  3. Al-Shehri, A.M. Toxin-producing blooms of the cyanobacterium Microcystis aeruginosa in rainwater ponds in Saudi Arabia. Oceanol. Hydrobiol. Stud. 2010, 39, 171–187. [Google Scholar] [CrossRef]
  4. Jegatheesan, V.; Shu, L.; Visvanathan, C. Aquaculture Effluent: Impacts and Remedies for Protecting the Environment and Human Health. In Encyclopedia of Environmental Health; Nriagu, J.O., Ed.; Elsevier: Burlington, NJ, USA, 2011; pp. 123–135. [Google Scholar]
  5. Md Anawar, H.; Chowdhury, R. Remediation of polluted river water by biological, chemical, ecological and engineering processes. Sustainability 2020, 12, 7017. [Google Scholar] [CrossRef]
  6. Wang, W.; Chen, J.; Liu, H.; He, Y. The overview of aquaculture water purification technology in China. J. Shanghai Ocean Univ. 2010, 19, 41–48. [Google Scholar]
  7. Bai, X.; Zhu, X.; Jiang, H.; Wang, Z.; He, C.; Sheng, L.; Zhuang, J. Purification effect of sequential constructed wetland for the polluted water in urban river. Water 2020, 12, 1054. [Google Scholar] [CrossRef] [Green Version]
  8. Li, X.-L.; Marella, T.K.; Tao, L.; Dai, L.-L.; Peng, L.; Song, C.-F.; Li, G. The application of ceramsite ecological floating bed in aquaculture: Its effects on water quality, phytoplankton, bacteria and fish production. Water Sci. Technol. 2018, 77, 2742–2750. [Google Scholar] [CrossRef] [Green Version]
  9. Zhang, S.-Y.; Li, G.; Wu, H.-B.; Liu, X.-G.; Yao, Y.-H.; Tao, L.; Liu, H. An integrated recirculating aquaculture system (RAS) for land-based fish farming: The effects on water quality and fish production. Aquac. Eng. 2011, 45, 93–102. [Google Scholar] [CrossRef]
  10. Lin, Y.F.; Jing, S.R.; Lee, D.Y.; Chang, Y.F.; Sui, H.Y. Constructed wetlands for water pollution management of aquaculture farms conducting earthen pond culture. Water Environ. Res. 2010, 82, 759–768. [Google Scholar] [CrossRef] [PubMed]
  11. Konnerup, D.; Koottatep, T.; Brix, H. Treatment of domestic wastewater in tropical, subsurface flow constructed wetlands planted with Canna and Heliconia. Ecol. Eng. 2009, 35, 248–257. [Google Scholar] [CrossRef]
  12. Lin, Y.F.; Jing, S.R.; Lee, D.Y.; Wang, T.W. Removal of Solids and Oxygen Demand from Aquaculture Wastewater with a Constructed Wetland System in the Start-Up Phase. Water Environ. Res. 2002, 74, 136–141. [Google Scholar] [CrossRef]
  13. Sindilariu, P.D.; Brinker, A.; Reiter, R. Factors influencing the efficiency of constructed wetlands used for the treatment of intensive trout farm effluent. Ecol. Eng. 2009, 35, 711–722. [Google Scholar] [CrossRef]
  14. Sindilariu, P.-D.; Wolter, C.; Reiter, R. Constructed wetlands as a treatment method for effluents from intensive trout farms. Aquaculture 2008, 277, 179–184. [Google Scholar] [CrossRef]
  15. Omotade, I.F.; Alatise, M.O.; Olanrewaju, O.O. Recycling of aquaculture wastewater using charcoal based constructed wetlands. Int. J. Phytoremediat. 2019, 21, 399–404. [Google Scholar] [CrossRef]
  16. Hang Pham, T.T.; Cochevelou, V.; Khoa Dinh, H.D.; Breider, F.; Rossi, P. Implementation of a constructed wetland for the sustainable treatment of inland shrimp farming water. J. Environ. Manag. 2021, 279, 111782. [Google Scholar] [CrossRef]
  17. Gorito, A.M.; Ribeiro, A.R.; Gomes, C.R.; Almeida, C.M.R.; Silva, A.M.T. Constructed wetland microcosms for the removal of organic micropollutants from freshwater aquaculture effluents. Sci. Total Environ. 2018, 644, 1171–1180. [Google Scholar] [CrossRef] [PubMed]
  18. Jiang, F.Y.; Chen, X.; Luo, A.C. Iron plaque formation on wetland plants and its influence on phosphorus, calcium and metal uptake. Aquat. Ecol. 2009, 43, 879–890. [Google Scholar] [CrossRef]
  19. Hu, J. Study on the Growth and Sewage Purification Effect of Barracuda in Constructed Wetland; South China Normal University: Guangzhou, China, 2010. [Google Scholar]
  20. China Environmental Protection Administration. Monitor and Analysis Method of Water and Wastewater, 4th ed.; Chinese Environmental Science Publication House: Beijing, China, 2002.
  21. China Ministry of Environmental Protection. Water Quality-Determination of Chlorophyll a—Spectrophotometric Method; Standards Press of China: Beijing, China, 2017.
  22. Chen, X.; Su, Y.; Liu, H.; Yang, J. Active Biomonitoring of Metals with Cultured Anodonta woodiana: A Case Study in the Taihu Lake, China. Bull. Environ. Contam. Toxicol. 2019, 102, 198–203. [Google Scholar] [CrossRef]
  23. China Ministry of Environmental Protection. Water Quality-Determination of Total Coliforms and Fecal Coliforms Paper Strip Method; Standards Press of China: Beijing, China, 2015.
  24. Yi, D.; Wu, Z.; Wang, X. Potential of phosphorus release from lake water and sediments on algae growth in Taihu Lake. J. Nanjing Univ. 1996, 32, 253–260. [Google Scholar]
  25. Smith, V.H.; Tilman, G.D.; Nekola, J.C. Eutrophication: Impacts of excess nutrient inputs on freshwater, marine, and terrestrial ecosystems. Environ. Pollut. 1999, 100, 179–196. [Google Scholar] [CrossRef]
  26. Guan, C.; Yu, D.; Zheng, X.; Wei, Y. Removing Nitrogen and Phosphoros of Effluent from Wastewater Treatment Plants by Constructed Wetlands in China: An Overview. J. Agro Environ. Sci. 2012, 31, 2309–2320. [Google Scholar]
  27. Wang, J.; Wang, W.; Xiong, J.; Li, L.; Zhao, B.; Sohail, I.; He, Z. A constructed wetland system with aquatic macrophytes for cleaning contaminated runoff/storm water from urban area in Florida. J. Environ. Manag. 2021, 280, 111794. [Google Scholar] [CrossRef]
  28. China Ministry of Rural Agriculture. Freshwater Aquaculture Effluent Discharge Requirements; Standards Press of China: Beijing, China, 2017; pp. 1–14.
  29. Singh, R.P.; He, J.Y.; Peng, W.X. Phosphorus Removal Efficiency of Different Media and Macrophyte in Constructed Wetland. In Proceedings of the International Conference of Environment Materials and Environment Management, Harbin, China, 24–25 July 2010; pp. 2368–2372. [Google Scholar]
  30. Wu, H.; Zhang, J.; Ngo, H.H.; Guo, W.; Hu, Z.; Liang, S.; Fan, J.; Liu, H. A review on the sustainability of constructed wetlands for wastewater treatment: Design and operation. Bioresour. Technol. 2015, 175, 594–601. [Google Scholar] [CrossRef]
  31. Vohla, C.; Kõiv, M.; Bavor, H.J.; Chazarenc, F.; Mander, Ü. Filter materials for phosphorus removal from wastewater in treatment wetlands—A review. Ecol. Eng. 2011, 37, 70–89. [Google Scholar] [CrossRef]
  32. Grizzetti, B.; Bouraoui, F.; Billen, G.; van Grinsven, H.; Cardoso, A.C.; Thieu, V.; Garnier, J.; Curtis, C.; Howarth, R.W.; Johnes, P. Nitrogen as a Threat to European Water Quality; Cambridge University Press: Cambridge, UK, 2011. [Google Scholar]
  33. Vinni, M.; Horppila, J.; Olin, M.; Ruuhijarvi, J.; Nyberg, K. The food, growth and abundance of five co-existing cyprinids in lake basins of different morphometry and water quality. Aquat. Ecol. 2000, 34, 421–431. [Google Scholar] [CrossRef]
  34. Sehar, S.; Aamir, R.; Naz, I.; Ali, N.; Ahmed, S. Reduction of Contaminants (Physical, Chemical, and Microbial) in Domestic Wastewater through Hybrid Constructed Wetland. ISRN Microbiol. 2013, 2013, 350260. [Google Scholar] [CrossRef] [PubMed] [Green Version]
  35. Alonso, A.; Camargo, J.A. Short-Term Toxicity of Ammonia, Nitrite, and Nitrate to the Aquatic Snail Potamopyrgus antipodarum (Hydrobiidae, Mollusca). Bull. Environ. Contam. Toxicol. 2003, 70, 1006–1012. [Google Scholar] [CrossRef] [PubMed]
  36. Valencia-Castañeda, G.; Frías-Espericueta, M.G.; Vanegas-Pérez, R.C.; Chávez-Sánchez, M.C.; Páez-Osuna, F. Toxicity of ammonia, nitrite and nitrate to Litopenaeus vannamei juveniles in low-salinity water in single and ternary exposure experiments and their environmental implications. Environ. Toxicol. Pharmacol. 2019, 70, 103193. [Google Scholar] [CrossRef]
  37. Ip, Y.K.; Chew, S.F. Ammonia production, excretion, toxicity, and defense in fish: A review. Front. Physiol. 2010, 1, 134. [Google Scholar] [CrossRef] [Green Version]
  38. Lin, Y.-F.; Jing, S.-R.; Lee, D.-Y.; Wang, T.-W. Nutrient removal from aquaculture wastewater using a constructed wetlands system. Aquaculture 2002, 209, 169–184. [Google Scholar] [CrossRef]
  39. Lu, J.; Guo, Z.; Kang, Y.; Fan, J.; Zhang, J. Recent advances in the enhanced nitrogen removal by oxygen-increasing technology in constructed wetlands. Ecotoxicol. Environ. Saf. 2020, 205, 111330. [Google Scholar] [CrossRef] [PubMed]
  40. Liu, F.-F.; Fan, J.; Du, J.; Shi, X.; Zhang, J.; Shen, Y. Intensified nitrogen transformation in intermittently aerated constructed wetlands: Removal pathways and microbial response mechanism. Sci. Total Environ. 2019, 650, 2880–2887. [Google Scholar] [CrossRef]
  41. Liu, Y. The Ecological Evaluation of Nitrogen and Phosphorus Removals of Domestic Sewage for Constructed Wetland Plants; Nanchang University: Nanchang, China, 2011. [Google Scholar]
  42. Su, S.; Zhou, Y.; Qin, J.G.; Wang, W.; Yao, W.; Song, L. Physiological responses of Egeria densa to high ammonium concentration and nitrogen deficiency. Chemosphere 2012, 86, 538–545. [Google Scholar] [CrossRef]
  43. Uusheimo, S.; Huotari, J.; Tulonen, T.; Aalto, S.; Rissanen, A.; Arvola, L. High Nitrogen Removal in a Constructed Wetland Receiving Treated Wastewater in a Cold Climate. Environ. Sci. Technol. 2018, 52, 13343–13350. [Google Scholar] [CrossRef]
  44. Xie, A.; Chen, H.; You, S. Advance of Nitrogen Removal in Constructed Wetland. IOP Conf. Ser. Mater. Sci. Eng. 2018, 301, 012120. [Google Scholar] [CrossRef]
  45. Wang, Y.; Yang, J.; Xu, H.; Liu, C.; Shen, Z.; Hu, K. Preparation of Ceramsite Based on Waterworks Sludge and Its Application as Matrix in Constructed Wetlands. Int. J. Environ. Res. Public Health 2019, 16, 2637. [Google Scholar] [CrossRef] [PubMed] [Green Version]
  46. Xia, H.X.; Zhu, Q.H. Purification Effect of Self-Aeration Constructed Wetlands on COD. Adv. Mater. Res. 2013, 690–693, 1122–1126. [Google Scholar] [CrossRef]
  47. Lu, Y.; Shihe, W.; Weiguo, L.; Juan, H.; Qiushuang, Z. Study on the Oxygen Condition in Subsurface Flow Wetlands in Operation. Environ. Sci. 2006, 27, 2009–2013. [Google Scholar]
  48. Wang, H.; Jiang, D.L.; Yang, Y.; Cao, G.P. Analysis of chemical reaction kinetics of depredating organic pollutants from secondary effluent of wastewater treatment plant in constructed wetlands. Water Sci. Technol. 2013, 67, 353–358. [Google Scholar] [CrossRef]
  49. Ye, J.-F.; Xu, Z.-X.; LI, H.-Z. Dynamic Rule of Organic Matter Removal in Vertical-Flow Constructed Wetland. Environ. Sci. 2008, 29, 2167–2171. [Google Scholar]
  50. Jiang, S.H.; Tang, B.P.; Ren, Y.C.; Ge, B.M.; Tong, X.Y. Annual Variation Characteristics of Chlorophyll a in Typical Sea Cucumber Apostichopus japonicus Culture Ponds. Turk. J. Fish. Aquat. Sci. 2020, 20, 235–240. [Google Scholar] [CrossRef]
  51. Hartshorn, N.; Marimon, Z.; Xuan, Z.M.; Cormier, J.; Chang, N.B.; Wanielista, M. Complex interactions among nutrients, chlorophyll-a, and microcystins in three stormwater wet detention basins with floating treatment wetlands. Chemosphere 2016, 144, 408–419. [Google Scholar] [CrossRef]
  52. Zhong, T.; Tian, Y.H.; Song, B.R.; Chen, Z.J.; Zhang, Y.; Chen, Z.H. Effect of four wetland plants on nutrient removal and growth of eutrophic algae. Aquat. Ecosyst. Health Manag. 2016, 19, 49–57. [Google Scholar] [CrossRef]
  53. Moss, B. Biomanipulation Tool for Water Management; Engineering and Biological Approaches to the Restoration from Eutrophication of Shallow Lakes in Which Aquatic Plant Communities Are Important Components; Springer: New York, NY, USA, 1990; pp. 367–377. [Google Scholar]
  54. Cao, J.; Sheng, X.; Liu, Q.; Zhao, F. Removal Effects of Constructed Wetlands on Algae. J. Shanxi Agric. Univ. 2013, 33, 319–323. [Google Scholar]
  55. Gupta, A.; Rai, D.K.; Pandey, R.S.; Sharma, B. Analysis of some heavy metals in the riverine water, sediments and fish from river Ganges at Allahabad. Environ. Monit. Assess. 2009, 157, 449–458. [Google Scholar] [CrossRef] [PubMed]
  56. Pandey, G.; Madhuri, S. Heavy metals causing toxicity in animals and fishes. Res. J. Anim. Vet. Fish. Sci. 2014, 2, 17–23. [Google Scholar]
  57. Bakhshoodeh, R.; Alavi, N.; Mohammadi, A.S.; Ghanavati, H. Removing heavy metals from Isfahan composting leachate by horizontal subsurface flow constructed wetland. Environ. Sci. Pollut. Res. 2016, 23, 12384–12391. [Google Scholar] [CrossRef]
  58. Terzaki, S.; Fountoulakis, M.S.; Georgaki, I.; Albantakis, D.; Sabathianakis, I.; Karathanasis, A.D.; Kalogerakis, N.; Manios, T. Constructed wetlands treating highway runoff in the central Mediterranean region. Chemosphere 2008, 72, 141–149. [Google Scholar] [CrossRef]
  59. Khan, S.; Ahmad, I.; Shah, M.T.; Rehman, S.; Khaliq, A. Use of constructed wetland for the removal of heavy metals from industrial wastewater. J. Environ. Manag. 2009, 90, 3451–3457. [Google Scholar] [CrossRef]
  60. Zeng, Z.; Luo, W.-G.; Yi, F.-C.; Huang, F.-Y.; Wang, C.-X.; Zhang, Y.-P.; Cheng, Q.-Q.; Wang, Z. Horizontal Distribution of Cadmium in Urban Constructed Wetlands: A Case Study. Sustainability 2021, 13, 5381. [Google Scholar] [CrossRef]
  61. Wang, J.; Lu, X.; Zhang, J.; Ouyang, Y.; Wei, G.; Xiong, Y. Rice intercropping with alligator flag (Thalia dealbata): A novel model to produce safe cereal grains while remediating cadmium contaminated paddy soil. J. Hazard. Mater. 2020, 394, 122505. [Google Scholar] [CrossRef]
  62. Lin, Y.; Wen, S.; Wang, D. Heavy metals removal property of major afforested plants in Xiangtan manganese mine area, central-south China. In Proceedings of the 3rd International Conference on Civil Engineering and Transportation (ICCET 2013), Kunming, China, 14–15 December 2014; p. 833. [Google Scholar]
  63. Dong, X.X.; Yang, F.; Yang, S.P.; Yan, C.Z. Subcellular distribution and tolerance of cadmium in Canna indica L. Ecotoxicol. Environ. Saf. 2019, 185, 109692. [Google Scholar] [CrossRef]
  64. Wang, T.; Duan, J.; Wang, J.; Liu, J.; Hu, J. Biomass allocation pattern of Canna indica L. at different growthstages and its accumulation and distribution characteristics of heavy metals. Huanjing Huaxue Environ. Chem. 2020, 39, 1031–1038. [Google Scholar] [CrossRef]
  65. Li, S.; Zhang, K.; Zhang, L.; Chen, Q. Use of Ornamental in Phytoremediation of Heavy Metals in Sewage Sludge. In Proceedings of the 2nd International Conference on Civil Engineering and Transportation (ICCET 2012), Guilin, China, 27–28 October 2013; p. 1044. [Google Scholar]
  66. Song, X.; Yan, D.; Liu, Z.; Chen, Y.; Lu, S.; Wang, D. Performance of laboratory-scale constructed wetlands coupled with micro-electric field for heavy metal-contaminating wastewater treatment. Ecol. Eng. 2011, 37, 2061–2065. [Google Scholar] [CrossRef]
  67. Kaushal, M.; Patil, M.D.; Wani, S.P. Potency of constructed wetlands for deportation of pathogens index from rural, urban and industrial wastewater. Int. J. Environ. Sci. Technol. 2018, 15, 637–648. [Google Scholar] [CrossRef] [Green Version]
  68. Kaushal, M.; Wani, S.; Patil, M.; Datta, A. Monitoring efficacy of constructed wetland for treating domestic effluent–microbiological approach. Curr. Sci. 2016, 110, 1710–1715. [Google Scholar] [CrossRef]
  69. Alufasi, R.; Gere, J.; Chakauya, E.; Lebea, P.; Parawira, W.; Chingwaru, W. Mechanisms of pathogen removal by macrophytes in constructed wetlands. Environ. Technol. Rev. 2017, 6, 135–144. [Google Scholar] [CrossRef]
  70. Vymazal, J. Removal of enteric bacteria in constructed treatment wetlands with emergent macrophytes: A review. J. Environ. Sci. Health 2005, 40, 1355–1367. [Google Scholar] [CrossRef]
  71. China Environmental Protection Agency. Water Quality Standard for Fisheries; Standards Press of China: Beijing, China, 1989.
  72. China Environmental Protection Agency. Environmental Quality Standards for Surface Water; Standards Press of China: Beijing, China, 2002.
Figure 1. Schematic representation of the constructed wetland. It consists of a sedimentation compartment (5 m × 7.5 m), continuously aerated compartment (5 m × 7.5 m), upward flow wetland (13.5 m × 15 m), and downward flow wetland (10 m × 15 m) and stabilize water compartment (1.5 m × 15 m). The green arrow indicates the direction of the water flow. The bottom layer of wetland was filled with 20 cm of cobblestone (diameter 8–10 cm), the middle layer was filled with 20 cm of cobblestone (diameter 4–6 cm), and the top was laid a layer of 30 cm of biological ceramsite (diameter 2–4 cm). The wetland was planted with Thalia dealbata L., Pontederia cordata L. and Canna indica L.
Water 13 03418 g001
Figure 2. Concentration of TP in water samples collected from the control pond and the inlet and outlet of CW, and the removal efficiency during the monitoring period. The value is expressed as mean ± SE (n = 6), and different small letters in bar graphs indicate significant differences (p < 0.05) among the control pond, CW influent and CW effluent.
Water 13 03418 g002
Figure 3. Concentrations of TN (a), NH4+-N (b) and NH3-N (c) in water samples collected from the control pond and the inlet and outlet of CW, and the removal efficiency during the monitoring period. The value is expressed as mean ± SE (n = 6), and different small letters in bar graphs indicate significant differences (p < 0.05) among the control pond, CW influent and CW effluent.
Water 13 03418 g003
Figure 4. Concentrations of NO2-N (a) and NO3-N (b) in water samples collected from the control pond and the inlet and outlet of CW, and the removal efficiency during the monitoring period. The value is expressed as mean ± SE (n = 6), and different small letters in bar graphs indicate significant differences (p < 0.05) among the control pond, CW influent and CW effluent.
Water 13 03418 g004
Figure 5. Concentrations of COD (a) and Chla (b) in water samples collected from the control pond and the inlet and outlet of CW, and the removal efficiency during the monitoring period. The value is expressed as mean ± SE (n = 6), and different small letters in bar graphs indicate significant differences (p < 0.05) among the control pond, CW influent and CW effluent.
Water 13 03418 g005
Figure 6. Concentrations of Cu (a) and Pb (b) in water samples collected from the control pond and the inlet and outlet of CW, and the removal efficiency during the monitoring period. The value is expressed as mean ± SE (n = 6), and different small letters in bar graphs indicate significant differences (p < 0.05) among the control pond, CW influent and CW effluent.
Water 13 03418 g006
Figure 7. Concentrations of TC (a) and FC (b) in water samples collected from the control pond and the inlet and outlet of CW, and the removal efficiency during the monitoring period. The value is expressed as mean ± SE (n = 6), and different small letters in bar graphs indicate significant differences (p < 0.05) among the control pond, CW influent and CW effluent.
Water 13 03418 g007
Figure 8. Plot of the principal component analysis (PCA) variables (a) and scores applied to different sampling sites (b).
Water 13 03418 g008
Publisher’s Note: MDPI stays neutral with regard to jurisdictional claims in published maps and institutional affiliations.

