Article

Research on Flood Discharge and Energy Dissipation of a Tunnel Group Layout for a Super-High Rockfill Dam in a High-Altitude Region

1
School of Water Conservancy Engineering, Zhengzhou University, Zhengzhou 450001, China
2
Power China Guiyang Engineering Corporation Limited, Guiyang 550081, China
3
National Local Joint Engineering Laboratory of Major Infrastructure Testing and Rehabilitation Technology, Zhengzhou 450001, China
4
State Key Laboratory of Hydrology-Water Resources and Hydraulic Engineering, Nanjing Hydraulic Research Institute, Nanjing 210029, China
*
Author to whom correspondence should be addressed.
Water 2021, 13(23), 3408; https://doi.org/10.3390/w13233408
Submission received: 22 September 2021 / Revised: 25 November 2021 / Accepted: 1 December 2021 / Published: 2 December 2021
(This article belongs to the Section Hydraulics and Hydrodynamics)

Abstract

:
Under the condition of a large dip angle between the flood discharging structure axis and the downstream cushion pool centerline, the downstream flow connection for the discharging tunnel group is poor, and the lower air pressure in high-altitude areas increases its influence on the trajectory distance of the nappe, further increasing the difficulty of predicting the flood discharge and energy dissipation layout. Based on the RM hydropower project with the world’s highest earth-rockfill dam, this paper studies the problem of a large included angle flip energy dissipation layout of a tunnel group flood discharge using the method of the overall hydraulic physical model test. The test results show that the conventional flip outlet mode has a long nappe falling point, a serious shortage of effective energy dissipation space, a large dynamic hydraulic pressure impact peak value on the bottom slab and side wall of the plunge pool, a poor flow connection between the outlet of the plunge pool and the downstream river channel, and a low energy dissipation rate. Considering the influence of a low-pressure environment, when the “transverse diffusion and downward incidence” outflow is adopted, the nappe falling point shrinks by 11 m, the energy dissipation form of the plunge pool is greatly improved, the effective energy dissipation space is increased by 159%, the RMS of the maximum fluctuating pressure is reduced by 74%, the outflow is smoothly connected with the downstream river, the energy dissipation rate is increased by 0.8%, and the protection range of flood discharge atomization is significantly reduced. This effectively solves the safety problems of large included angle discharge return channels and the energy dissipation and erosion prevention of super-high rockfill dams.

1. Introduction

Super-high rockfill dam projects usually have water discharge structures on the bank. When the water is discharged and the energy is dissipated, the angle between the center line of the discharging tunnel and the center line of the downstream main rivel channel is often large, which is called the “large angle” of the water dissipator [1]. The large included flip angle energy dissipation type is usually used in the case of an open downstream open chute and good geological conditions. For example, the included angle between the flip energy dissipation axis of the open spillway tunnel of the Oroville dam [2] in the United States and the downstream river channel is nearly 90°, but the two banks are relatively open, the energy dissipation space is large and the energy dissipation safety is guaranteed. Meanwhile, the Yulong Kashi water control project [3] has excavated large quantities of loose ancient river channel strata to form an energy dissipation area with a large area and strong impact resistance, avoiding the problem of a large included angle layout. Most of the large angle flip energy dissipation devices are not equipped with special energy dissipation facilities. Their layout mainly considers solving the problems of water flow connection and scouring protection. The conventional solution is to adjust the tunnel central line or adopt special-shaped energy dissipators, change the direction of water flow flip and increase the diffusion of the nappe, so as to minimize the intersection angle and reduce the downstream scouring. Taking the Shuangjiangkou hydropower project as an example, the intersection angle between the axis of the flood discharge structure and the axis of the downstream main river channel is large. Therefore, the method of “river channel cutting and straightening” is fully used to arrange the discharge tunnel group, and the concave broken line oblique cut flip bucket is adopted at the flip outlet to make the connection between the nappe and the downstream smooth [4,5]. The tunnel line layout of the discharge structure of Lianghekou hydropower station shall be “flat, smooth and straight” as far as possible, so as to reduce the complex hydraulic problems caused by the curve. The oblique cut flip bucket is comprehensively selected to meet the layout requirements [6]. The deep inlet spillway tunnel of a power station has the problems of a high water head, large discharge, large intersection angle and being close to the tailrace outlet [7]. The outlet distorted flip bucket scheme is adopted to effectively solve the layout problem of flood discharge and energy dissipation. The spillway tunnel [8] of a hydropower station arranged on a narrow river channel has a large intersection angle with the river channel. The outlet shape of a side flaring inclined bucket is adopted to greatly reduce the scouring of discharge flow. Suo Huimin et al. [9] discussed the large angle relationship between the river channel and the axis of the spillway tunnel in the design of energy dissipation and anti-scouring and proposed that an oblique cut flip bucket with an increased diffusion angle can cause the water flow to diffuse more fully, reducing the unit width flow of inlet water and reducing the scouring on both banks. Qiu Yong [10] adopted an inclined flip bucket for the flood discharge tunnel of Heishiluo reservoir. The test results show that the nappe on the bucket is greatly opened along the vertical while turning on the plane, which increases the contact area between the nappe and air, and effectively reduces the scouring of the flow to the downstream. In the Manzhuanhe reservoir project, Cha Shuangquan [11] adopted measures such as high and low ridges, shortening the length of the free-flow section, controlling the gate opening, etc., to control the nappe falling point and reduce the scouring of mountains on the opposite bank. Zhang [12] adopted the standard k-ε turbulence model and the VOF method to simulate the movement characteristics of the nappe for the dovetail flip bucket. The research shows that a reasonable notch ratio and opening angle can effectively reduce the downstream impact force. Xu Min [13] believed that a dovetail flip bucket has good adaptability to the situation that the intersection angle between the axis of the spillway tunnel and the river is relatively small. Tan Zhewu [14] conducted an experimental study on a combined slit-type flip bucket with a dovetail flip bucket. The new shape has the advantages of both a dovetail flip bucket and a slit-type flip bucket and plays an important role in improving the flow pattern and the nappe in the bucket and reducing the scouring downstream. For the energy dissipation of a super-high rockfill dam with a large dip flip angle, it generally has the characteristics of a high head, large flow, narrow valley and strong energy. It is necessary to set up a plunge pool to ensure the safety of energy dissipation. The main technical problems are to control the downstream flow connection, reduce the dynamic hydraulic pressure of the plunge pool and improve the connection between the outlet and downstream. However, there are few studies on the hydraulic characteristics of plunge pools under the arrangement of a large included flip angle.
In addition, many water conservancy and hydropower projects in China and abroad are generally located in low-altitude areas (under 1500 m.a.s.l), and the systematic study of the impact of air pressure on high-speed water–air two-phase flow is almost non-existent. The main studies related to flood discharge, energy dissipation and hydraulic safety are as follows. Shima A [15] studied the regularity of cavitation dynamics mechanisms in high-altitude areas, and the study showed that the lower the air pressure, the smaller the degree of primary cavitation. Wang Yujie, Zhang Luchen, etc., [16] pointed out that the lower the air pressure, the greater the surface tension coefficient of the water, and the more difficult it is to aerate the water flow. Lian Jijian, Dong Zhao, etc., [17,18] found through model test studies that as the air pressure decreases, the nappe is more concentrated, and the hourly average pressure and pulsating pressure in the plunge pool increase to varying degrees. Li Yongmei [19] found through a decompression model test that after the ambient air pressure decreases, the impact angle near the bottom of the plunge pool increases, the hourly average pressure increases by 18%, and the pulsating pressure intensity increases by 42%. Pang Bohui et al. [20,21,22] showed through calculation and analysis that in a low air pressure environment, the number of flow cavitation decreases,, the length of the cavity of aeration facility decreases, and the risk of cavitation increases. Yan Zhen [23] pointed out, through the deflecting bucket test of Tuoxi dam, that the trajectory distance of the nappe is larger than that of the atmospheric pressure test. The distance is 84 m. Jiang Yongzhi, Zhang Luchen et al. [24,25] conducted generalized model decompression experiments and found that the air pressure has a good linear relationship with the trajectory distance of the nappe and the lateral diffusion of the nappe. As the air pressure decreases, the trajectory distance of the nappe shows a linear increasing trend, and the lateral diffusion of the nappe shows a linear decreasing trend. Preliminary studies have shown that low-pressure environments will increase the trajectory distance of the nappe, increase the hydrodynamic pressure, increase the risk of cavitation, increase the atomization of flood discharge [26,27], etc., which is unfavorable for the safety of flood discharge and energy dissipation in super-high rockfill dams. However, the current design specifications have not considered the influence of low air pressure.
Based on the above research status, it is necessary to carry out further research on the problems of large dip angle flip and environmental impact of low pressure in the flood discharge and energy dissipation of high-altitude and super-high rockfill dams. Combined with the RM hydropower project, including the aspects of flip flow pattern, hydraulic characteristics of the plunge pool, downstream river connection, flood discharge atomization and so on, this paper studies the problem of flip energy dissipation and the return channel at a large angle of flood discharge of an ultra-high rockfill dam tunnel group and considers the influence of low air pressure on the trajectory distance of the nappe. Through this study, we solve the problem of flood discharge and energy dissipation for the RM hydropower project, which will be the world’s highest earth-rockfill dam in the future, and improve the practical engineering research on the influence of a low-pressure environment on the hydraulic characteristics.

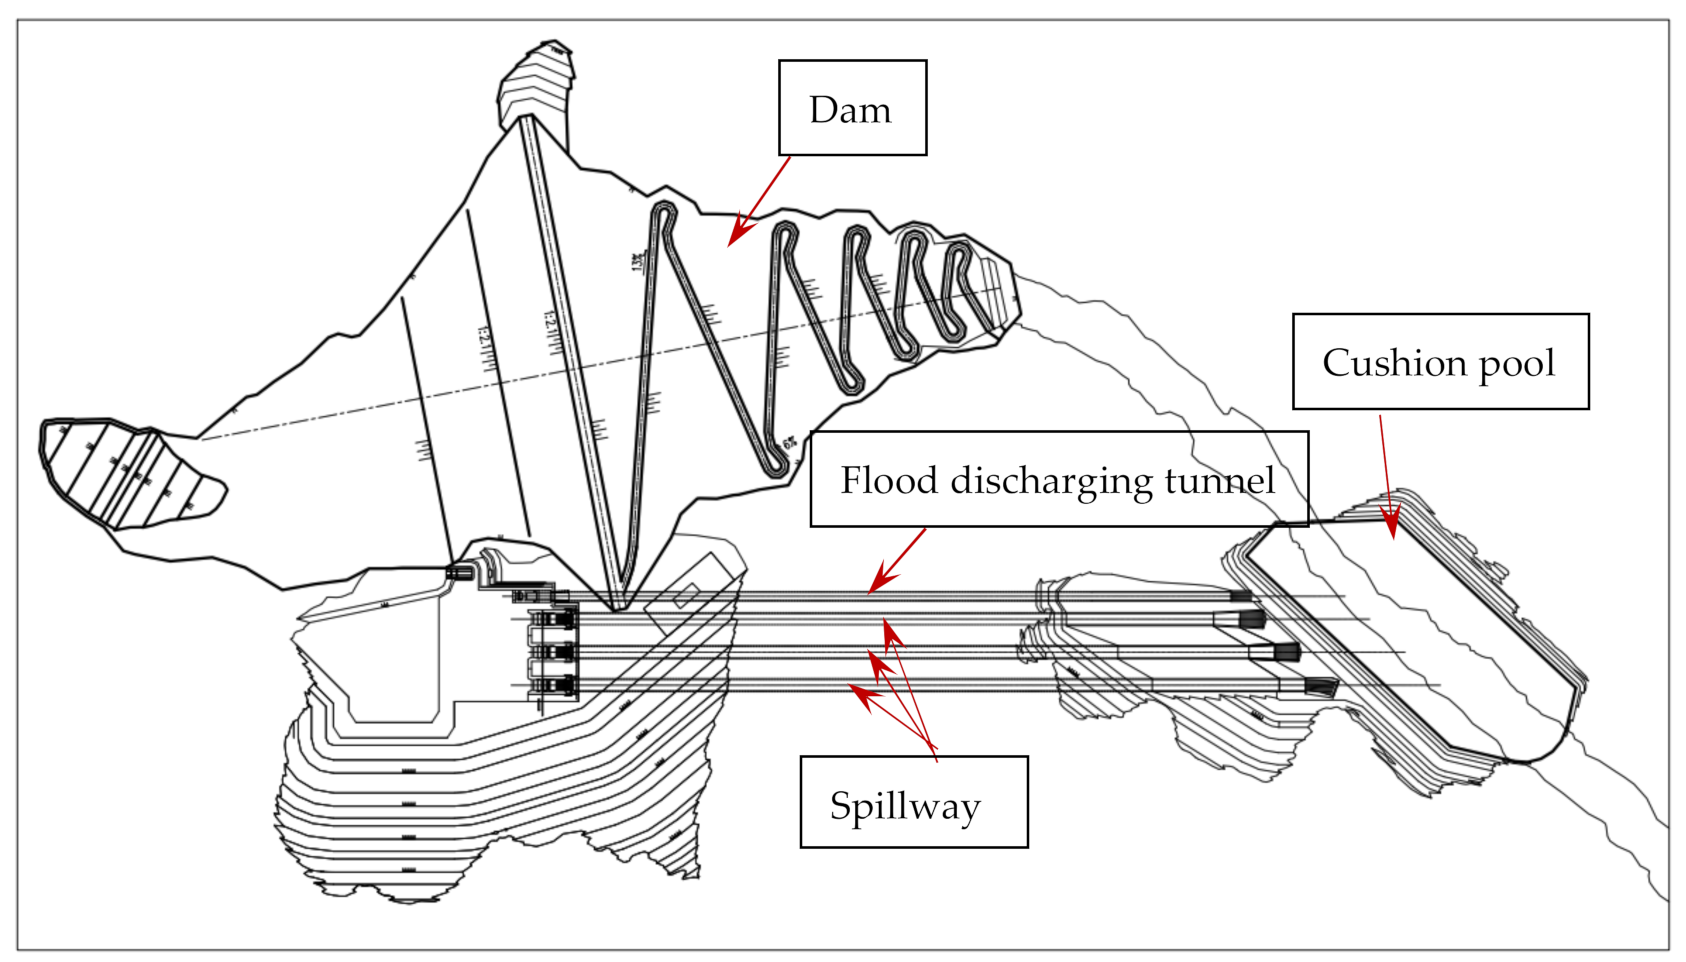
2. General Description of the Project

The RM hydropower project’s main dam is a gravel soil core wall rockfill dam, with a maximum dam height of 315.00 m, which will make it the highest earth rockfill dam in the world. The elevation of the dam site is nearly 3000 m.a.s.l, the maximum flood discharge water head is 252 m, the peak flood flow under PMF is 13,600 m3/s, and the maximum flood discharging power is 31,000 MW. It has the characteristics of “high altitude, high water head, large discharge and narrow valley”. The flood discharging structure comprises 3 spillway tunnels and 1 flood discharging tunnel at the right bank. The base plate elevation of the spillway tunnel is 2860.00 m, and the weir crest elevation is 2873.00 m, with a WES-type curve, the equation of which is Y = 0.035621 X1.85; after the WES curve is an ogee section with the radius of 40 m, and the end elevation of the control section is 2855.84 m. The slope of the tunnel’s longitudinal section is 3%, and the end of the tunnel section is connected with a Walsh curve, the equation of which is y = 0.03x + x2/320. After that is the steep channel section and ogee section (R = 120 m). The free-flow tunnel is designed as a D shape, and the dimensions of the cross-section are 15.00 m × 18.53 m (width × height). The ski-jump energy dissipating type is used, and the length is about 33 m, the ogee radius is 120 m, the oriented angle is 15°, the end plane spray angle is 3°, the spray wall length is 72 m, and the outlet elevation is 2735.00 m. The third spillway tunnel adopts a distorted-type flip bucket, with a left flip angle of 35°, a right flip angle of 27°, a height difference between left and right of 9.7 m and an outlet elevation of the central axis of 2735.00 m.
The bottom elevation of the inlet tower for the flood discharge tunnel is 2827.00 m, the crest elevation is 2902.00 m, and the top plate of the morning glory intake is elliptical. A flat emergency gate and sector service gate are adopted in the inlet tower, and the dimensions of the emergency gate are 7 m × 15.5 m (width × height), while the dimensions of the service gate are 7 m × 13 m (width × height). The length of the free-flow tunnel is 640 m, with the slope i = 3.0%, the tunnel section type is D-shape, and the cross-section is 11.0 m × 15.17 m (width × height). After the free-flow tunnel is the steep channel section, behind which is the ogee section R = 60 m and energy dissipators at the outlet—the original energy dissipater type is a flip bucket, with an oriented angle of 25°.
The plunge pool is excavated along the downstream narrow valley. The main central axis is consistent with the direction of the river and has a dip angle of 43° with the discharge axis of the tunnel group. The plunge pool is excavated downward, and the bottom slab elevation is 2590.00 m, the total length along the river is 451 m, and the width is 175 m. The distance from the end of the spillway tunnel to the left side of the bottom slab of the plunge pool is 63 m, while the distance to the right side is 293 m. The distance from the end of spillway tunnel to the left side of the bottom slab of the plunge pool is 75 m, and the distance to the right side is 305 m. The plane layout is shown in Figure 1.

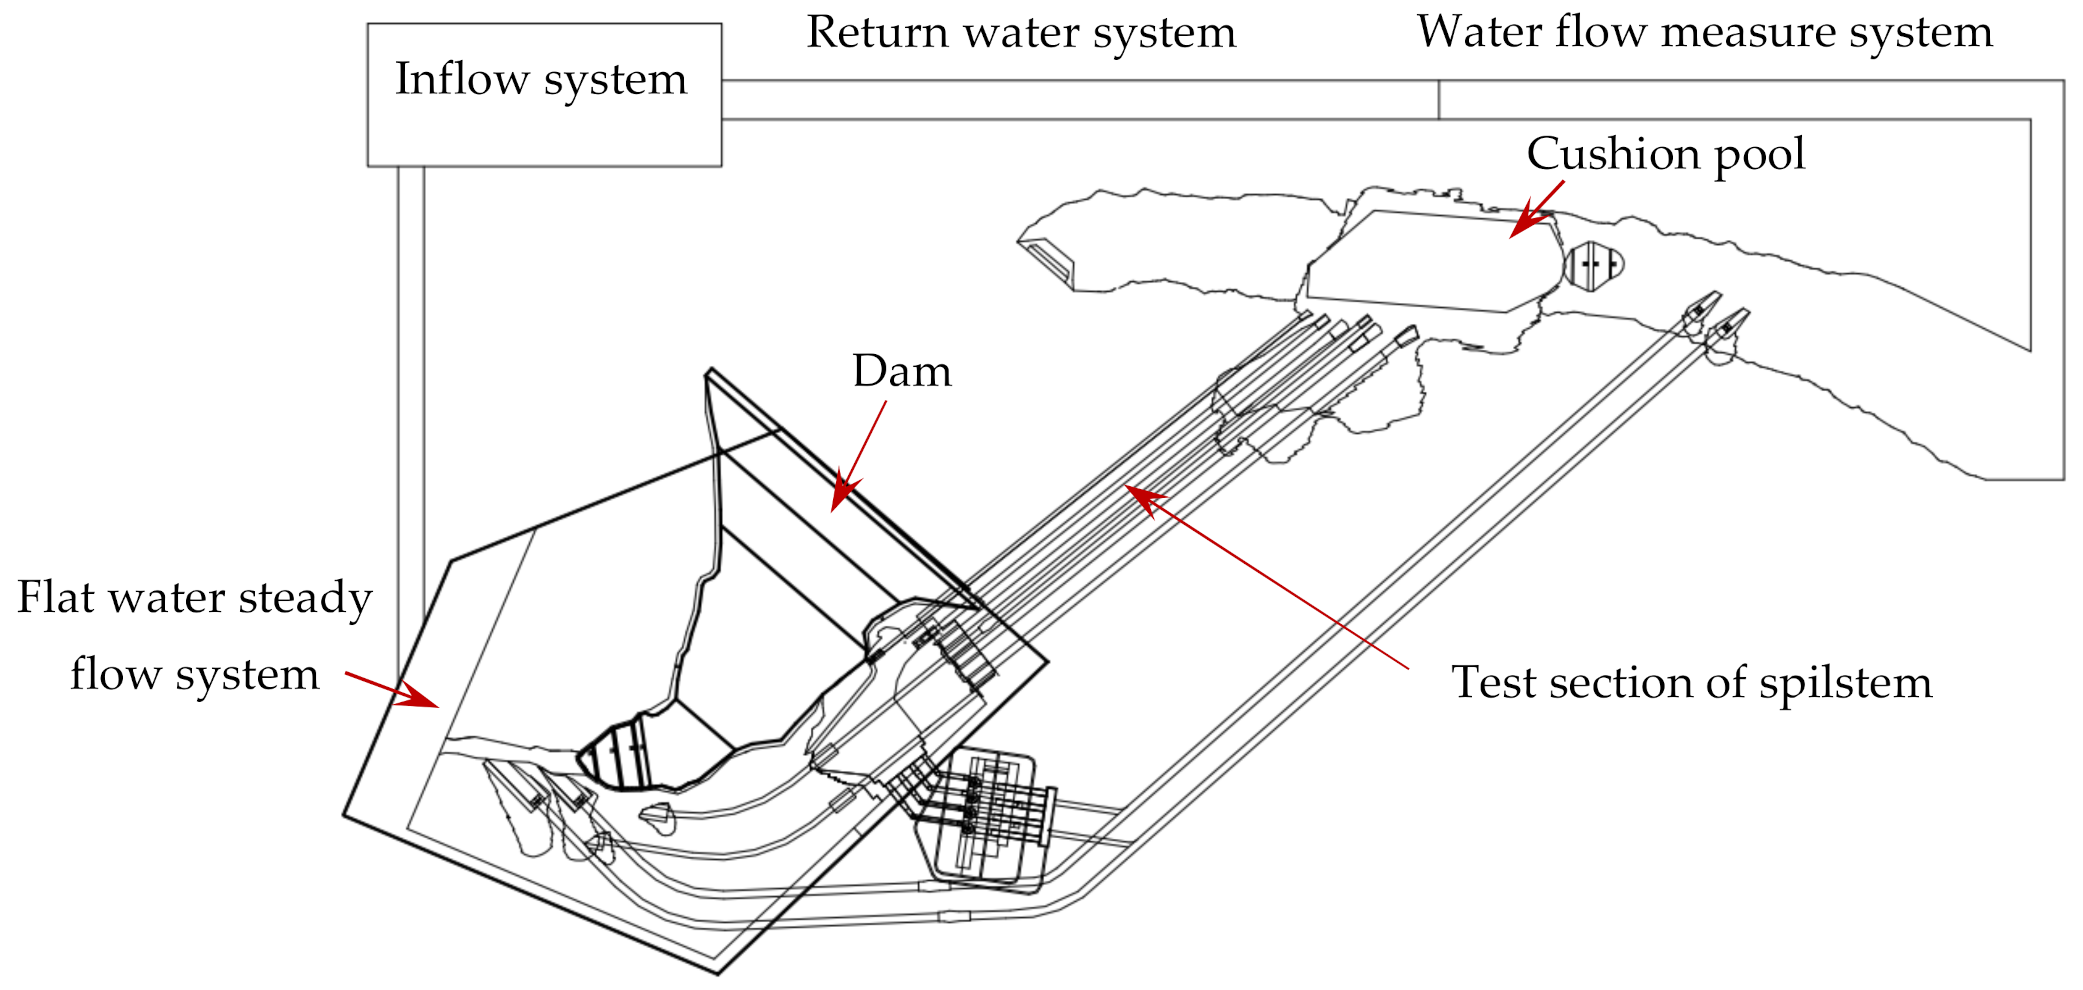
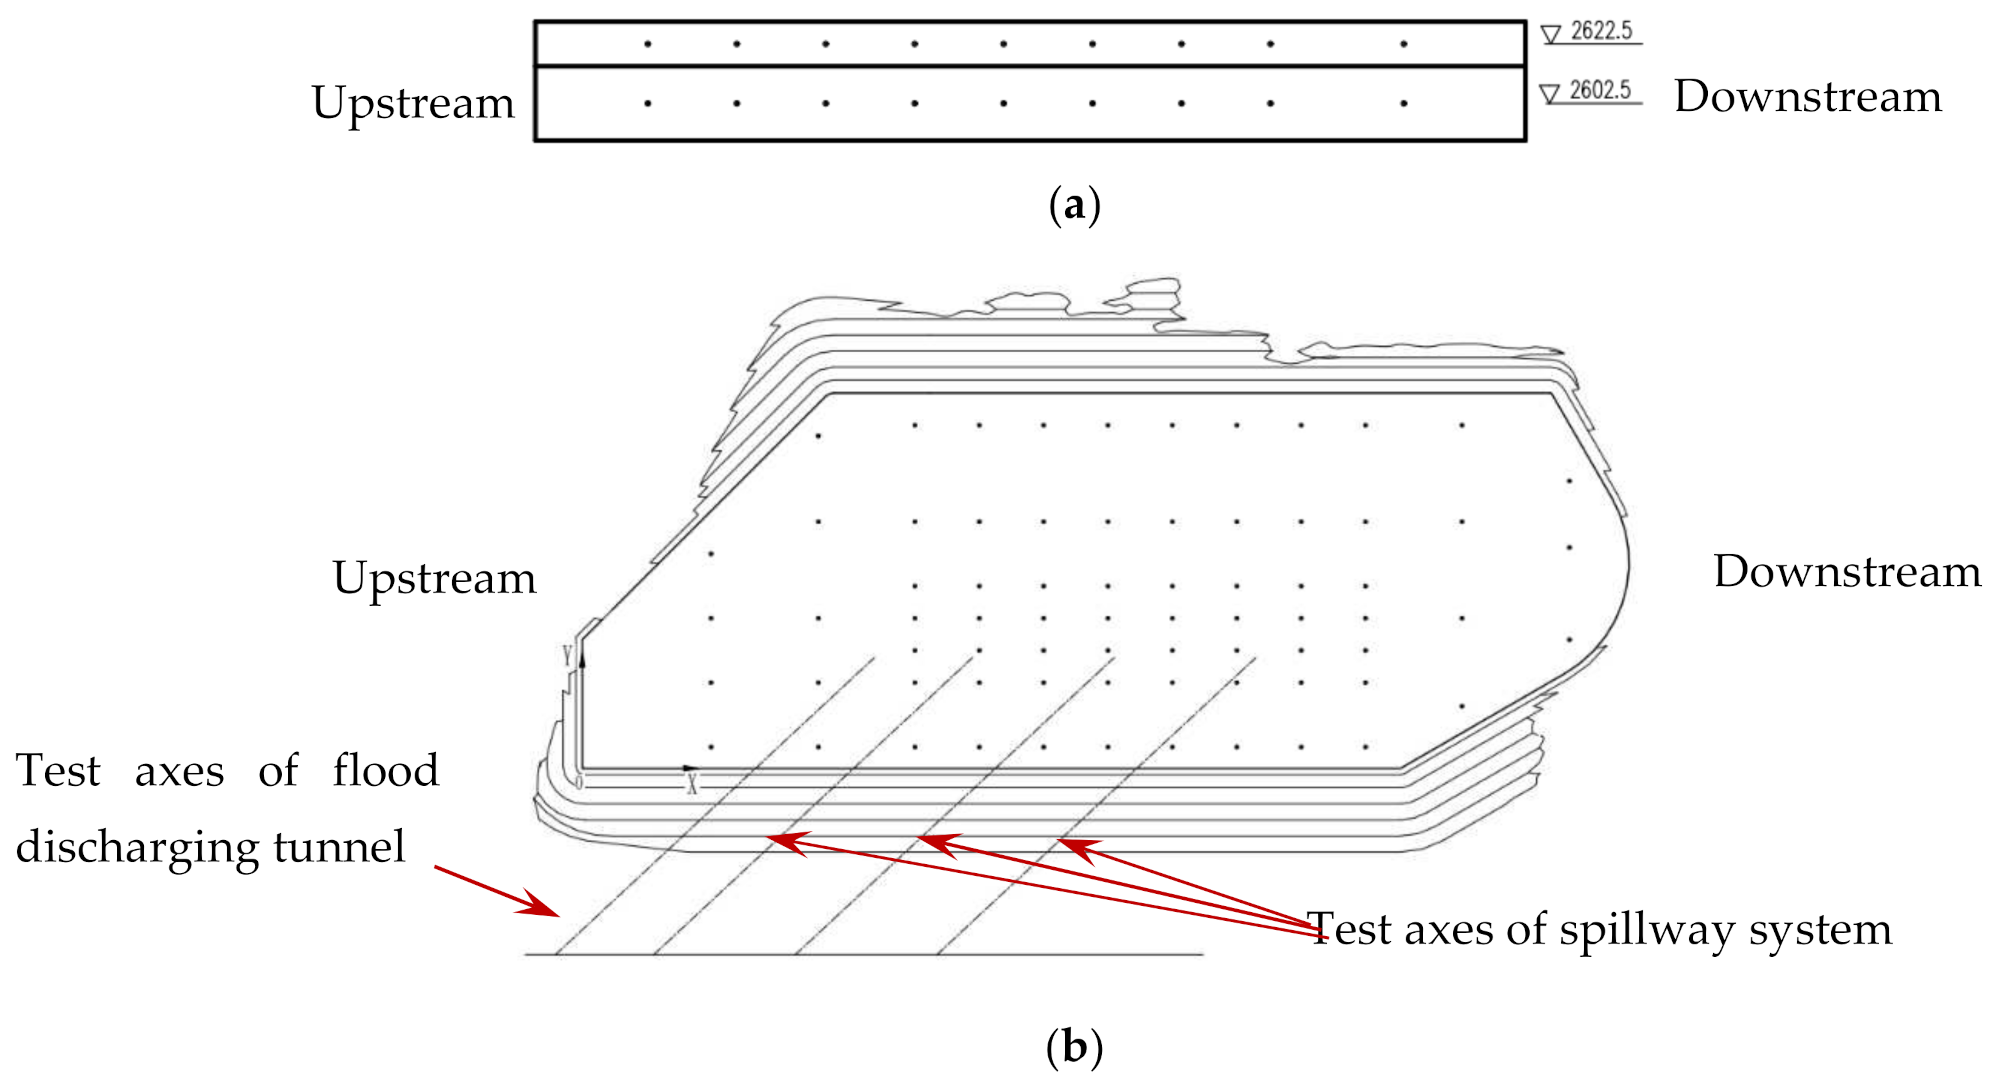
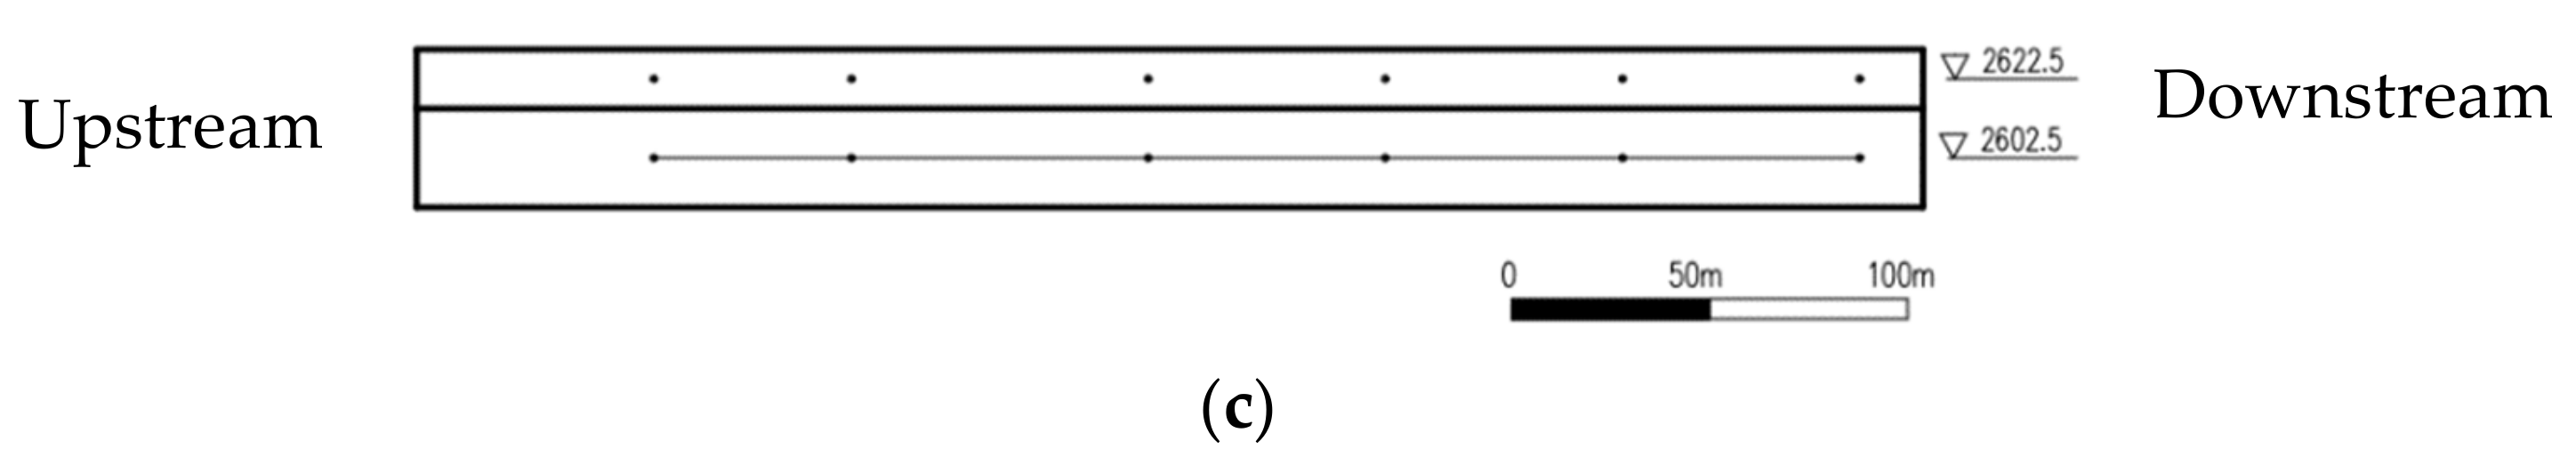
3. Research Methods and Measurement Techniques

The complete hydraulic model test was adopted, and the model scale was selected as 1:80. The main basis is as follows: for the complete model, the test scale is required to be no less than 1:100 for the layout and flood discharge and energy dissipation system. For similar atomization, the Weber number of the flow surface in the model is required to be We > 2.500 × 10⁵. We selected the test scale of 1:80. The characteristic velocity of the fog source area is 48 m/s, and the characteristic length of the fog source area is 784 m. The Weber number is about 2.500 × 10¹⁰ [28]. This paper mainly studies the macroscopic characteristics such as flow pattern, hydrodynamic pressure and average velocity, and the scale effect has little impact on these. In addition, although there are inevitable differences between the hydraulic characteristics of model simulation and reality, this study focuses on the comparison between various schemes under the same test conditions and the analysis of their energy dissipation effect, so as to provide technical support for the tunnel groups’ flood discharge and energy dissipation in an extra-high rockfill dam. Therefore, when the basic model scale requirements are met, the scale effect has little impact on the conclusion. The simulation objects of the model include the upstream river channel topography, the dam, the tunnel spillway, the discharge tunnel, the power water way and tail water, the plunge pool, the downstream river channel topography, etc. The size of the model is 45 m long, 25 m wide and 5 m high, and the water supply flow is 250 L/s. The overall model consists of a water inflow system, a flat water steady flow system, a building test section, a water flow measure system and a return water system, as shown in Figure 2.
The measurable physical quantities in the model test mainly include the flow pattern, the shape of the nappe, the hydrodynamic pressure and the velocity distribution in the downstream. The flow pattern was photographed, and the trajectory distance and the water inlet width of the nappe were measured using a ruler. During the trajectory distance measurement, a horizontal ruler was fixed above the nappe. One end of the ruler was placed at the end of the flip bucket, and a movable vertical rod was set at the other end of the ruler. We moved the vertical rod to the outer edge of the nappe falling point and measured the distance from the vertical rod to the starting end of the scale to obtain the trajectory distance of nappe. When measuring the width of the nappe as it enters the water, two horizontal rulers are fixed and two plumbs are placed on the left and right edges of the nappe. Respectively, the horizontal distance between the two vertical plumbs to are the nappe width (see Figure 3). The time average pressure was measured using a pressure measuring tube, and the fluctuation pressure was measured using an HQ130 piezoresistive pressure sensor, with a range of 0–10 kPa, a dynamic response frequency of 100 kHz and an accuracy of ±0.05%. F.S. INV6660 was selected as the acquisition system, the sampling frequency was 512 Hz, the sampling time was 80 s, and the total number of samples is 40,960. The optical fiber propeller current meter was used for velocity distribution. The starting velocity was 0.01 m/s, the maximum velocity was 5 m/s, and the measurement accuracy was ±1 cm/s.
The test groups are arranged as different types of flip bucket: upturned flip bucket, horizontal flip bucket and downturned flip bucket.
The hydrodynamic pressure measuring points on the bottom plate and side wall of the plunge pool are shown in Figure 4. In the upstream and downstream non-rectangular areas, the longitudinal (X-direction) spacing of the measuring points is 50 m and the cross (Y-direction) spacing is 30 m; in the middle rectangular area, the longitudinal spacing of measuring points is 30 m and the cross spacing is 15–30 m (the cross spacing from the first row is 30, 45, 60, 75, 105 and 150 m). There are 72 measuring points in the slab of the plunge pool. Only one row of the side wall measuring points is arranged longitudinally at elevations of 2602.5 and 2622.5 m, and its longitudinal position corresponds to the slab measuring points, including 9 for each row of the left bank wall, with a longitudinal spacing of 30–45 m, and 6 for each row on right bank wall, with a longitudinal spacing of 50–75 m. There are a total of 30 measuring points on the side wall of the plunge pool.

4. Analysis of Test Results
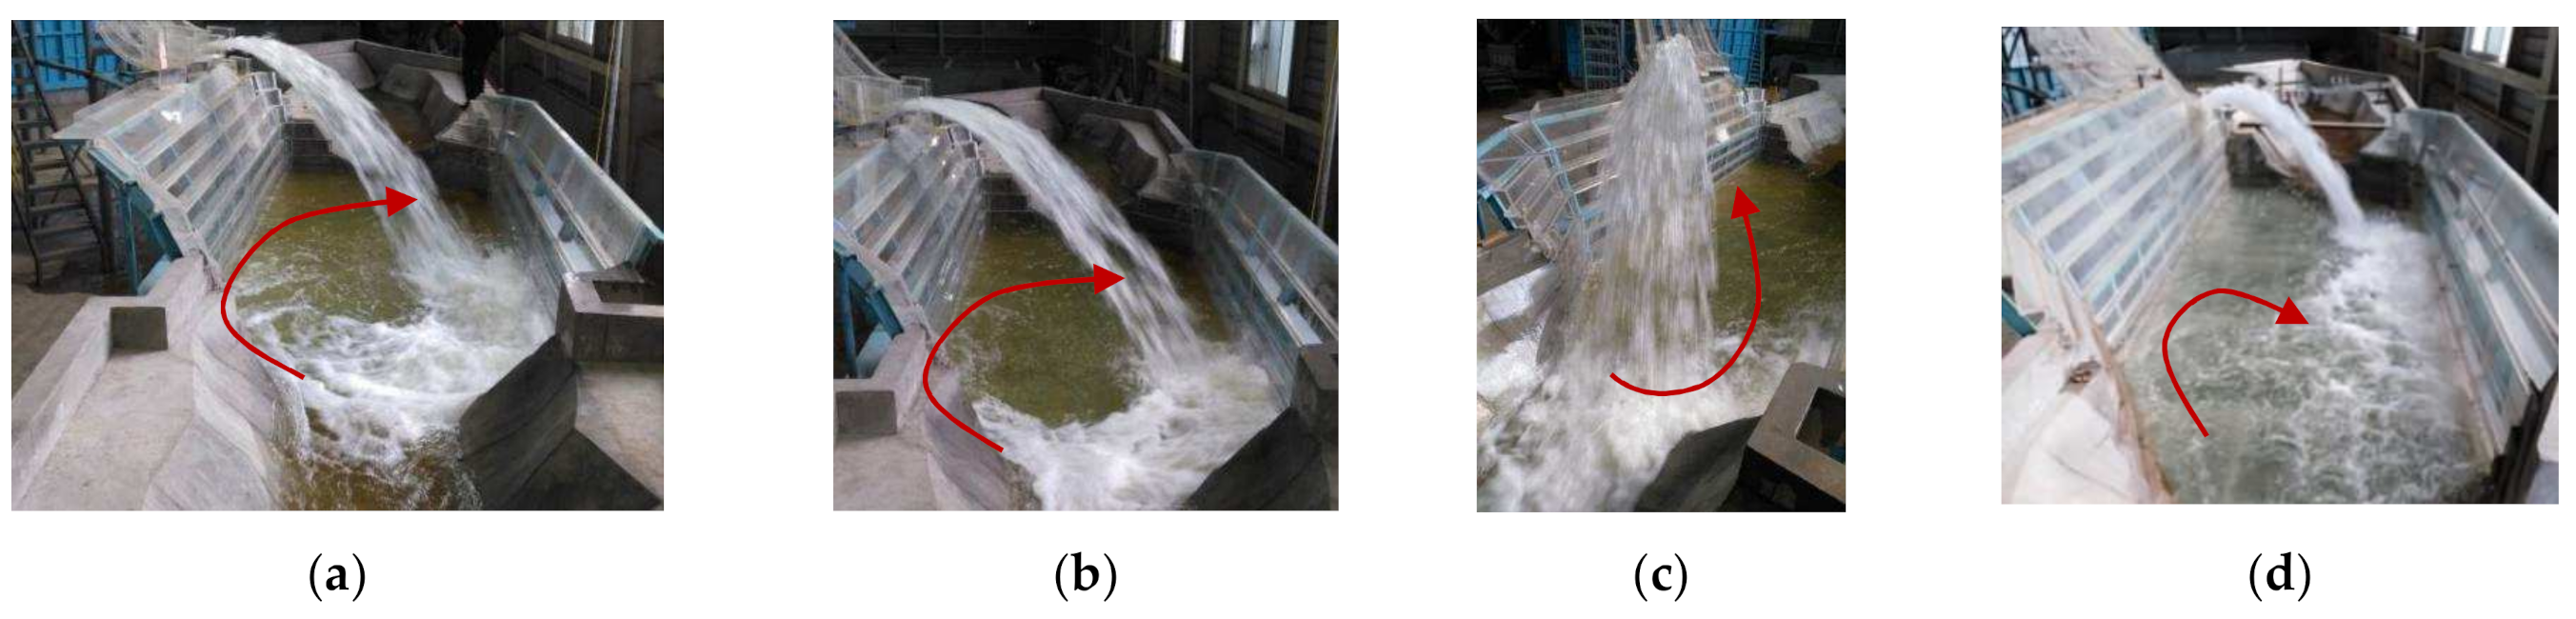
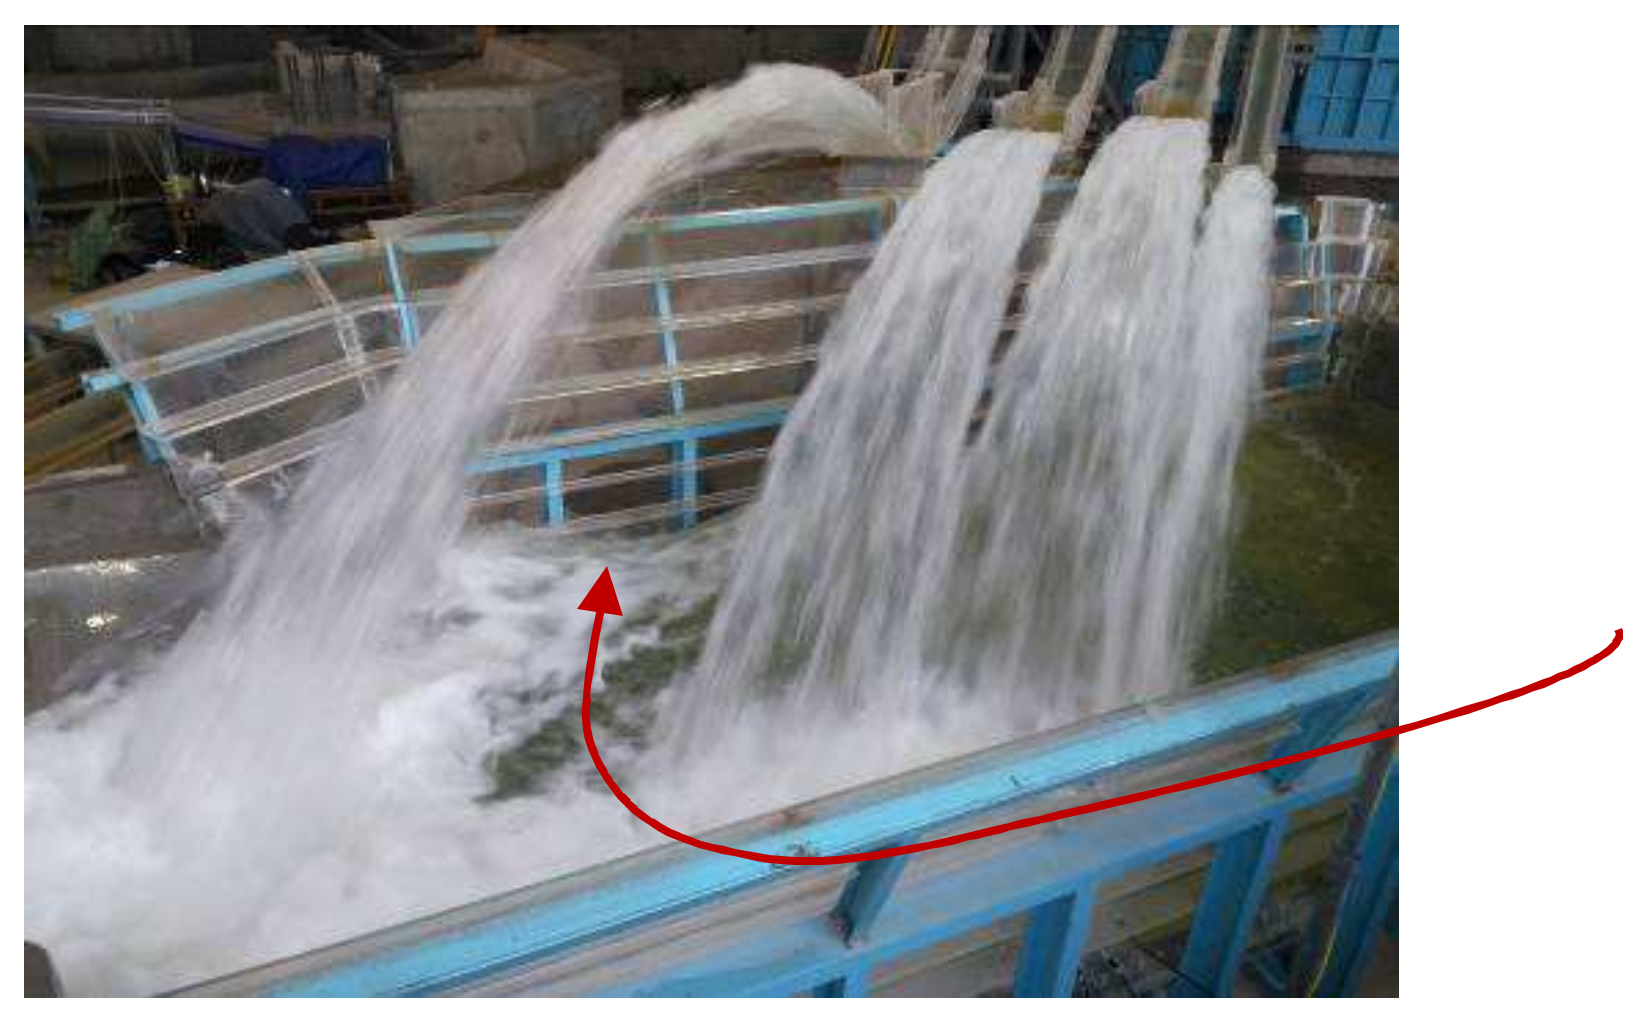
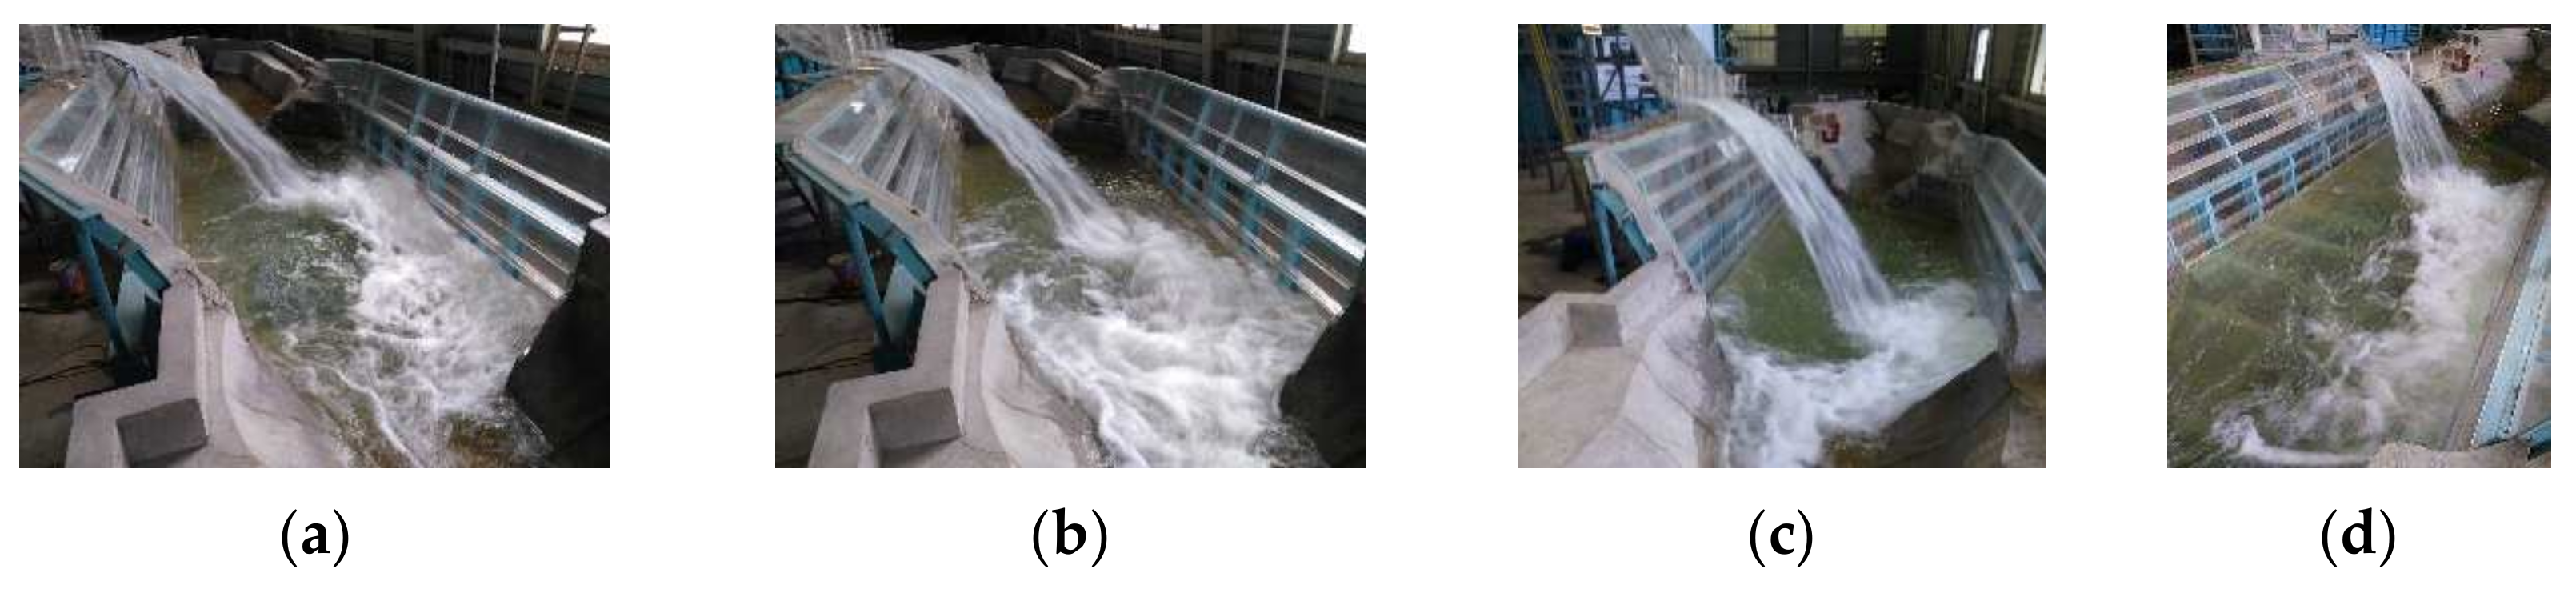
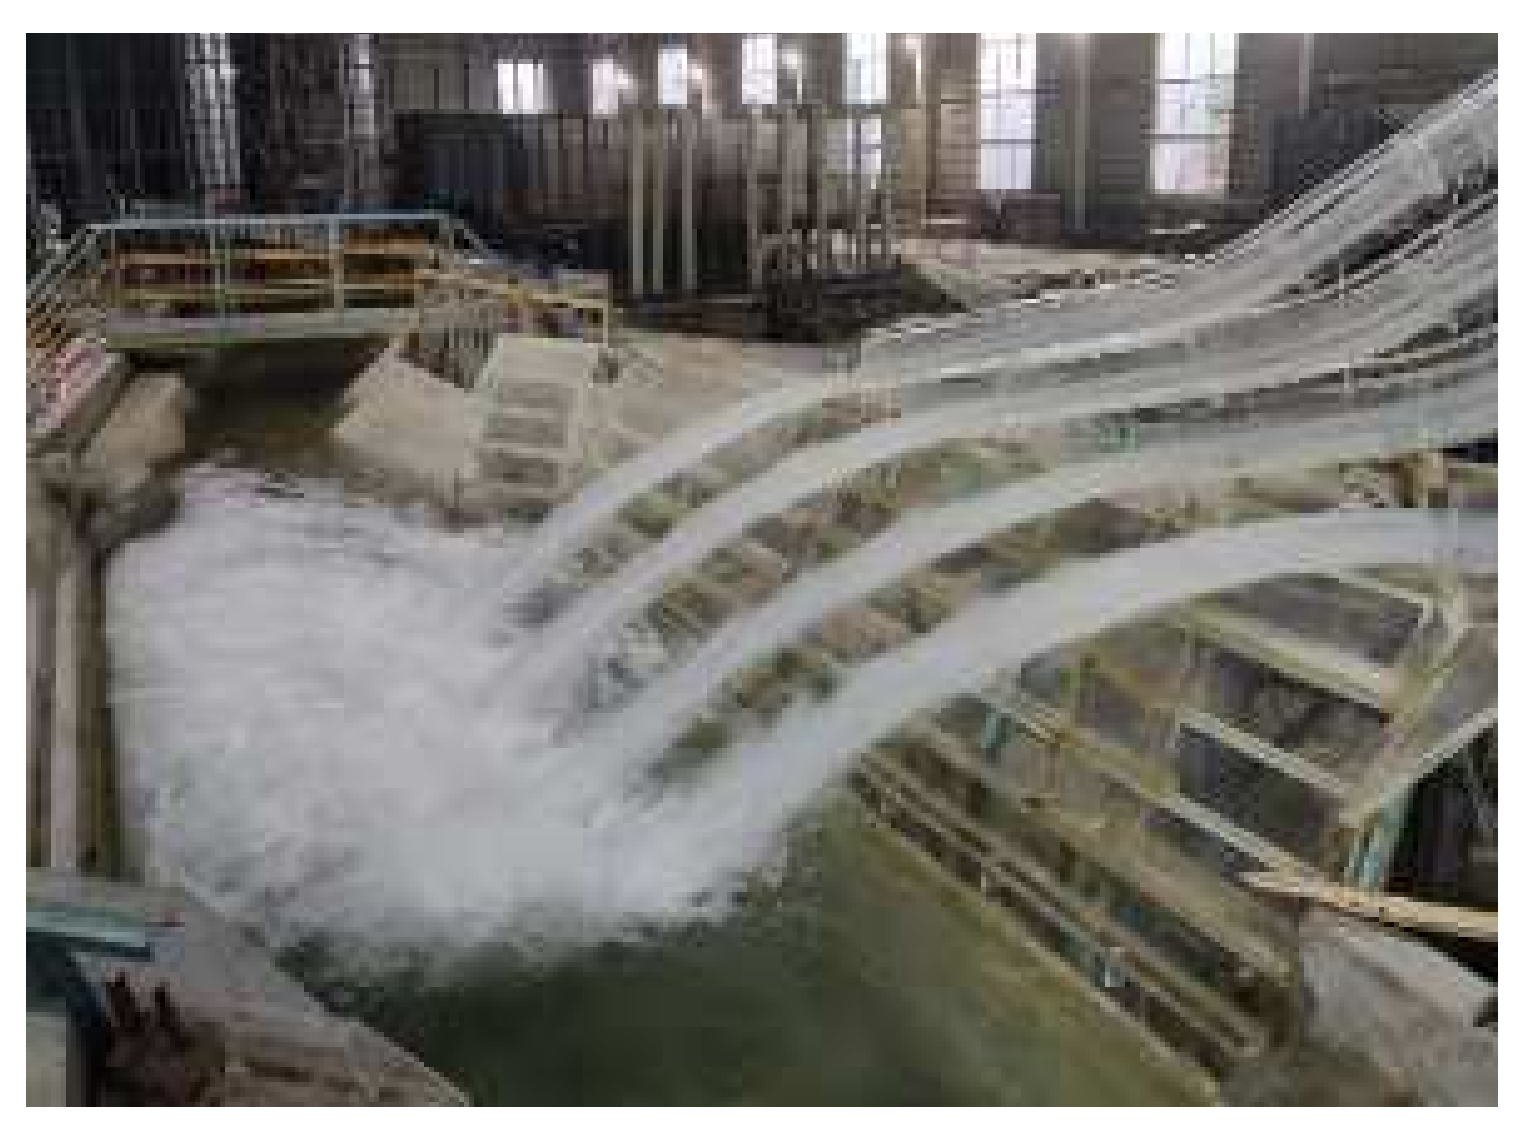
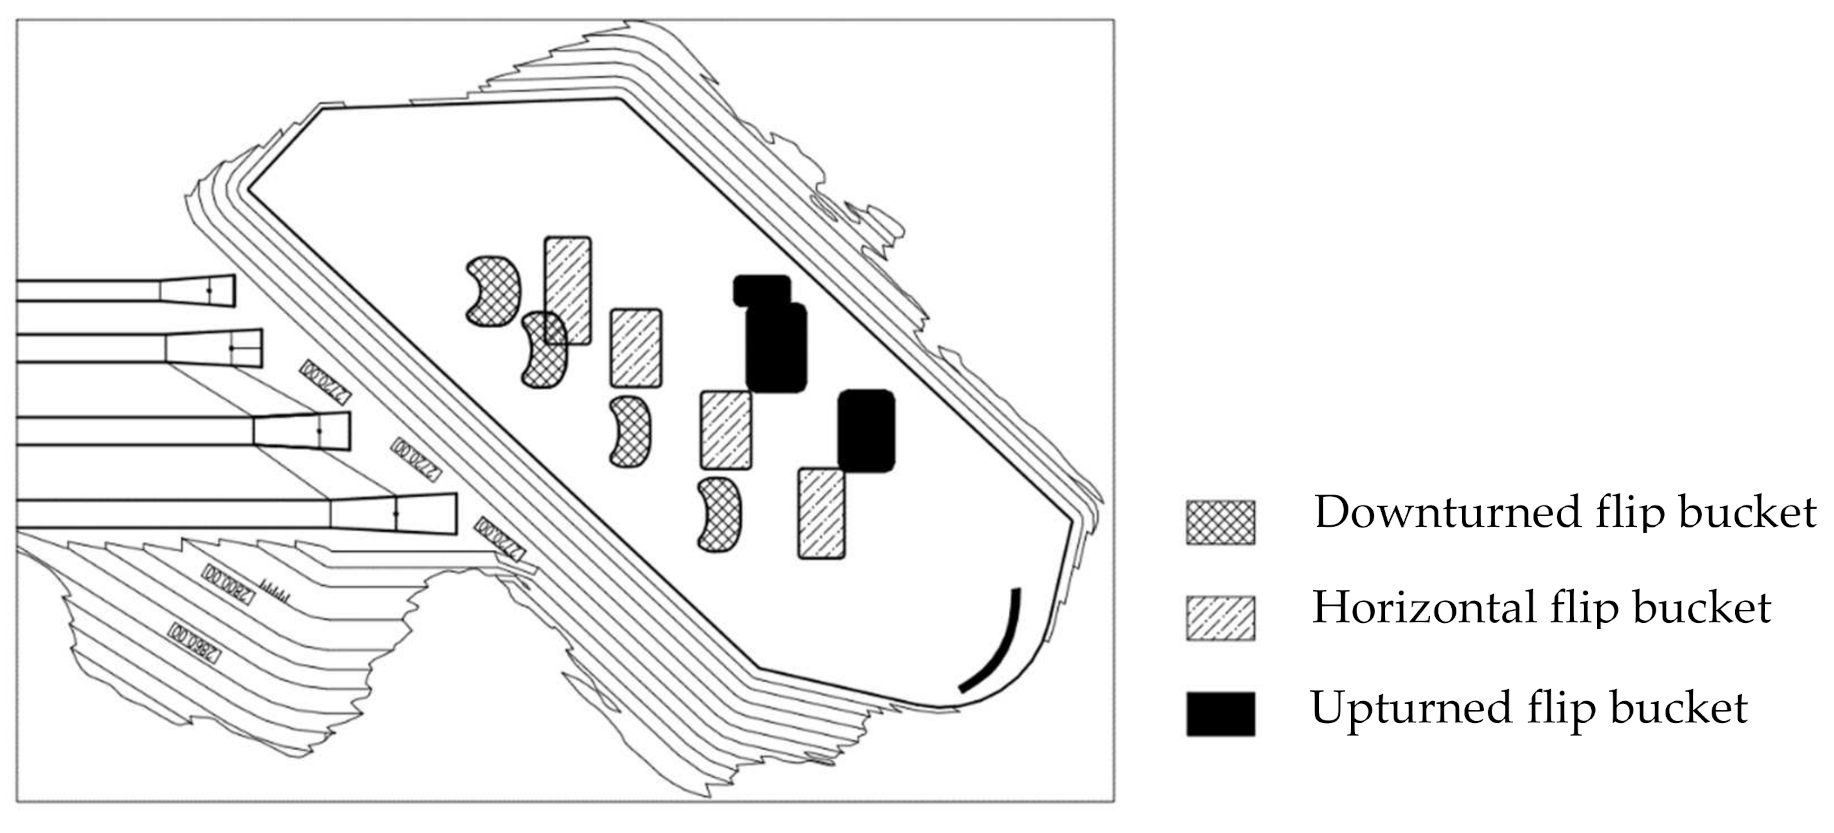
4.1. Flow Pattern

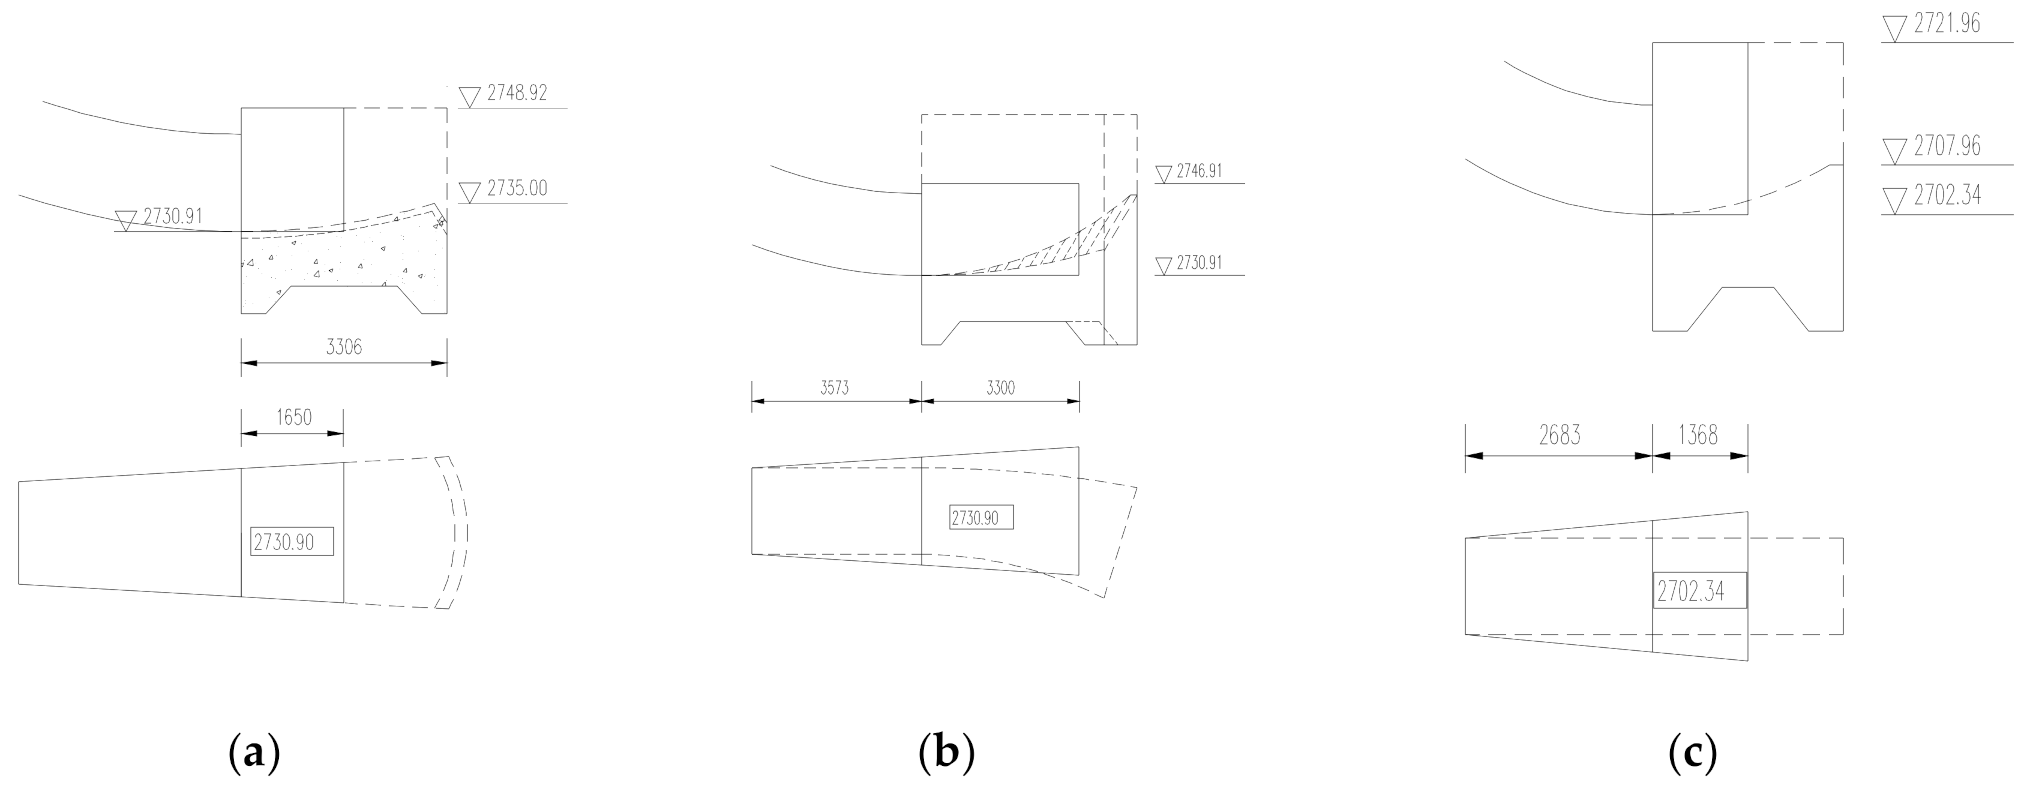
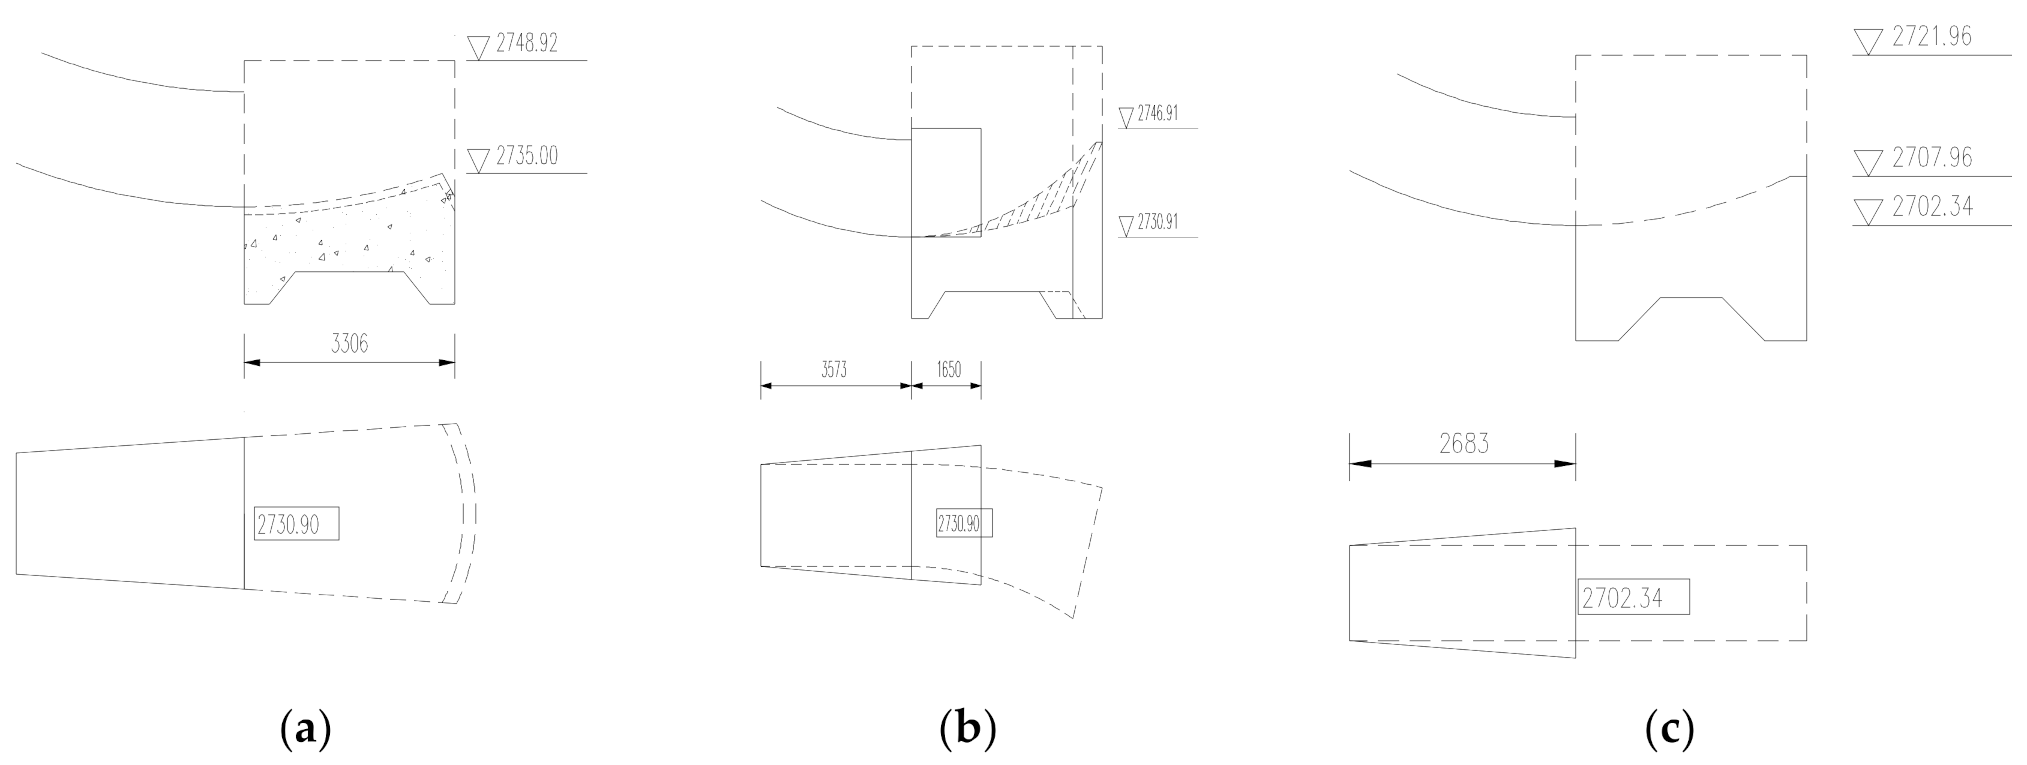
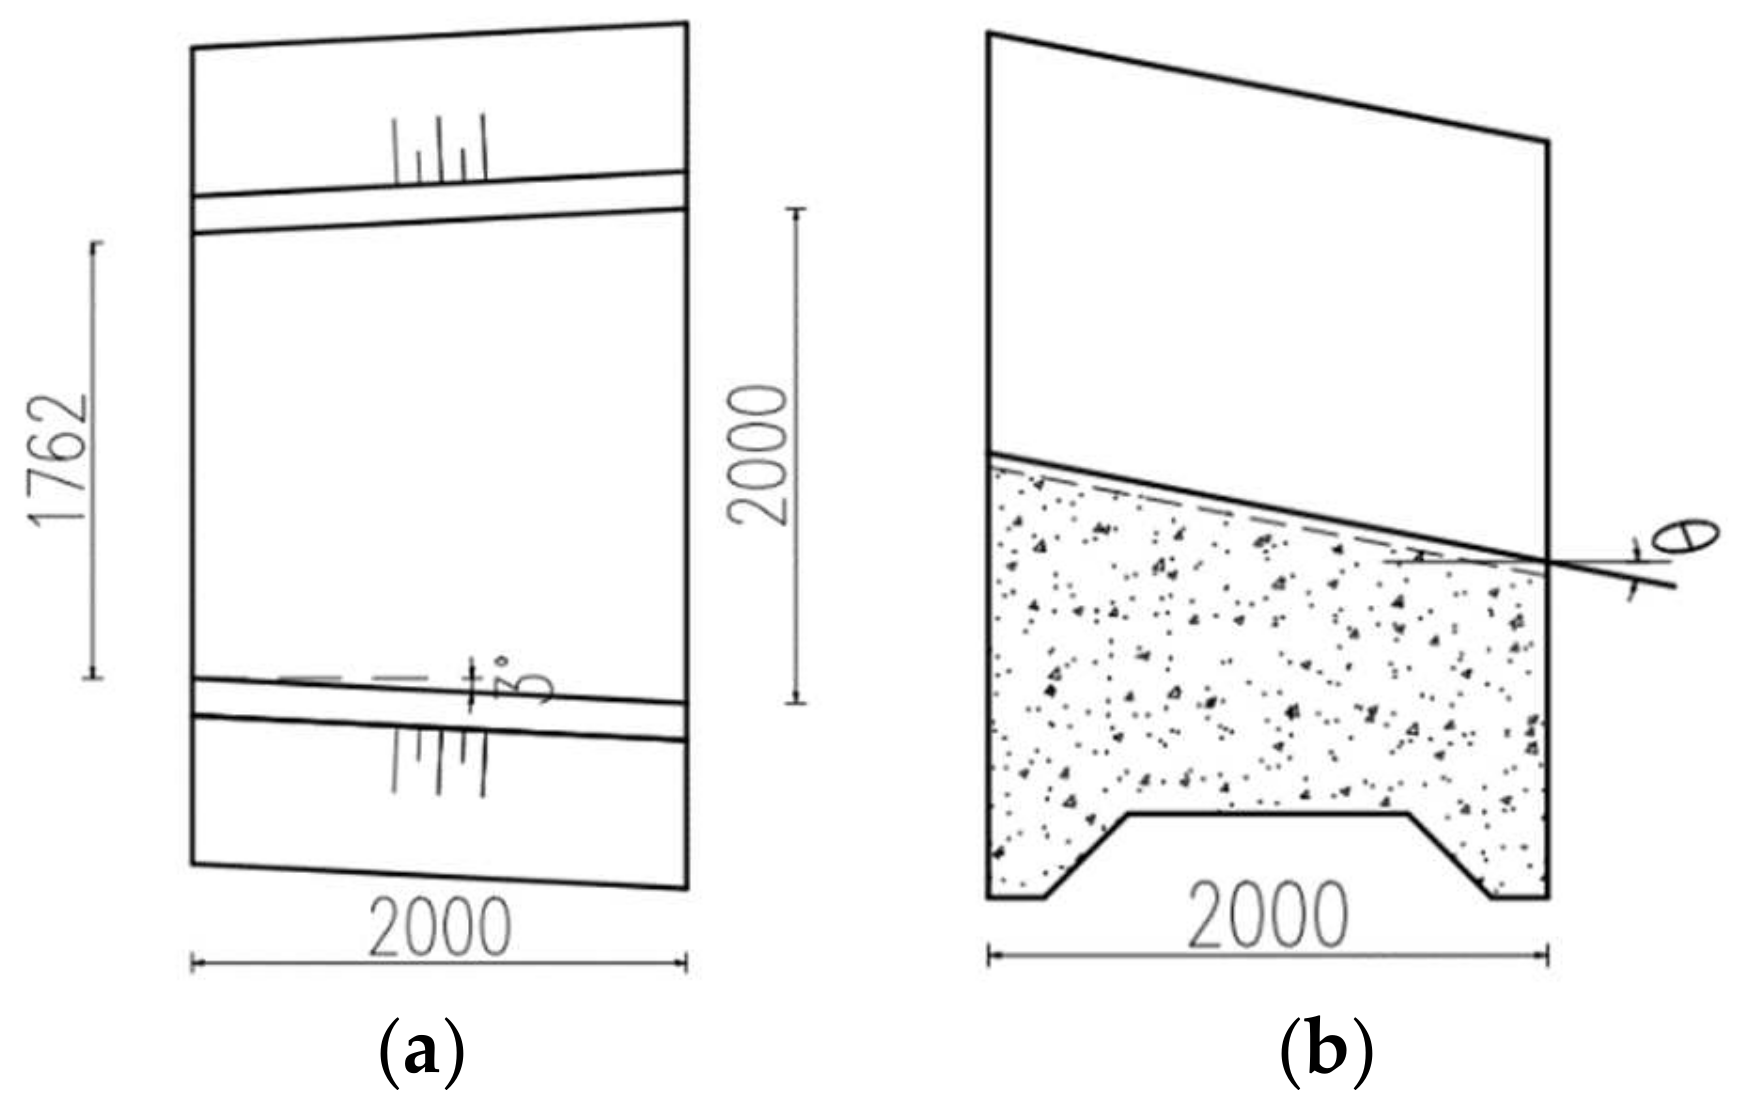
4.1.1. Upturned Flip Bucket

The trajectory distance of the nappe is 280–298 m under the condition of the designed flood water level, when the discharge structure operates individually. Because the distance between the nappe and each tunnel is longer, the distance between the nappe and the plunge pool side wall is closer. After the nappe is submerged, the impact area is formed on the corner of the side wall and the slab of the plunge pool, which is blocked by the side wall, and the nappe falling point moves along the side wall. The energy dissipation is concentrated in the southeast corner of the plunge pool, and the water surface is white foam. The water flow is fully aerated, the swirling is violent, and the atomization is serious. The mainstream is partially blocked at the junction of the downstream river channel and moves along the left bank side wall, forming a large backflow in the plunge pool. When the No.1 spillway tunnel operates alone, the No.2 spillway tunnel operates alone, the spillway operates alone and the flood discharge system operates at the same time, a clockwise backflow is formed in the plunge pool, and a counterclockwise backflow is formed when the No.3 spillway tunnel operates alone, as shown in Figure 5 and Figure 6, respectively. The drop point of the water tongue is shown in Figure 7, and the measured results of the hydraulic parameters are shown in Table 1.
It is revealed from the flow pattern that although the surface area of the plunge pool is large, there is little water volume actually involved in energy dissipation, and energy dissipation is mainly concentrated in the area near the side wall of the plunge pool. The area from the inner edge of the nappe to the left bank side wall of the plunge pool is defined as the effective energy dissipation area (see Figure 8), and the ratio of flood discharge power to the water volume of the effective energy dissipation area under various design conditions is the effective unit water volume energy dissipation power. The calculation formula is as follows:
η = E A h .  
Among them, η is the effective energy dissipation power per unit water body, E is the total energy of water body requiring energy dissipation (W), A . is the effective energy dissipation area (m2), h . is the thickness of effective energy dissipation water body (m), and the downstream water cushion thickness is taken in this test.
According to the built projects with a dam height greater than 200 m and a flood discharge power greater than 30,000 MW, the energy dissipation power of the unit water volume of the flip bucket energy dissipation plunge pool is about 11–15 kW/m3, such as Ertan (13.5 kW/m3), Xiaowan (12.3 kW/m3), Jinping (13.1 kW/m3), Baihetan (13.5 kW/m3), Xiluodu (11.5 kW/m3), Nuozhadu (12.6 kW/m3) and Goupitan (15.3 kW/m3). The maximum flood discharge power borne by the stilling basin of the flood discharge system of RM Hydropower Station under the check condition is 31,000 mw, and the depth of the plunge pool is 64.6 m. In the design scheme, the effective energy dissipation area in the plunge pool is 15,185 m2, which is only about one-fifth of the total area of 74,109 m2. The calculated maximum energy dissipation power per unit water volume is 31.60 kW/m3, which is far greater than the normal range of high dams and large reservoirs in operation. The effective energy dissipation area of the plunge pool is seriously insufficient.

4.1.2. Horizontal Flip Bucket

According to the design specifications and the design scheme formed by conventional torsional deflection, the long span leads to an insufficient effective engy dissipation area of the plunge pool, resulting in an impact area at the corner of the right bank side wall and the bottom slab in the plunge pool, and the downstream flow connection is poor, which seriously threatens the safety of flood discharge and energy dissipation, so the energy dissipater needs to be optimized. If the optimization idea of deflecting the nappe direction is adopted, on the one hand, the nappe will be opened longitudinally, the atomization of the nappe itself will increase, and the overlapping collision between the nappe will further increase the atomization and threaten the safety of the slope. On the other hand, we need to consider the cavitation of the distorted-type flip bucket at the velocity of 50 m/s. Therefore, the optimization idea adopts the method of “transverse diffusion and horizontal flip bucket”, so as to make the nappe emit horizontally and diffuse horizontally, realize the “longitudinal contraction and transverse dispersion” of the discharge nappe and make full use of the energy dissipation space of the plunge pool.
In order to achieve the above objectives, the optimization measures of energy dissipaters are: reducing the flip angle, shortening the length of the flip bucket and using the No.3 spillway tunnel without distortion and diffusion at the end of the spillway. A comparative analysis of the two schemes was carried out. The shapes of schemes 1 and 2 are shown in Figure 9 and Figure 10, respectively (the solid line is the optimized scheme and the dotted line is the original scheme).
Under the designed flood level condition, compared with scheme 1, the trajectory distance of the nappe is greatly shortened by 40–80 m, and the nappe basically falls into the middle of the plunge pool. Each nappe has distinct layers during combined flood discharge, and the total effective energy dissipation area is 29,928 m2, about 40% of the total area of the plunge pool, which is nearly twice the upturned flip bucket scheme. The calculated maximum energy dissipation power of the effective unit water volume is 16.03 kW/m3, which is still higher than the normal range of high dams and large reservoirs in operation, and the effective energy dissipation area of plunge pool is slightly insufficient.
In order to further increase the effective energy dissipation space of the plunge pool, scheme 2 optimizes the nappe falling point by shortening the length of the horizontal outlet section on the basis of scheme 1, and the overall flow pattern has little difference from scheme 1. Under the designed flood level condition, the nappe layers are still distinct during combined flood discharge. The nappe falls into the middle of the plunge pool, and the nappe falling point is shortened by 15.7–21.5 m compared with scheme 1. The flow pattern of the plunge pool is further improved, and the effective energy dissipation space is further increased. The total effective energy dissipation area is 33,904 m2, which is 13% larger than that of scheme 1, 2.23 times that of scheme 1, and about 46% of the total area of the plunge pool. The calculated maximum energy dissipation power per unit water volume is 14.15 kW/m3, which is within the normal range of high dams and large reservoirs in operation.
See Figure 11 and Figure 12 for the shape and falling point of the nappe.

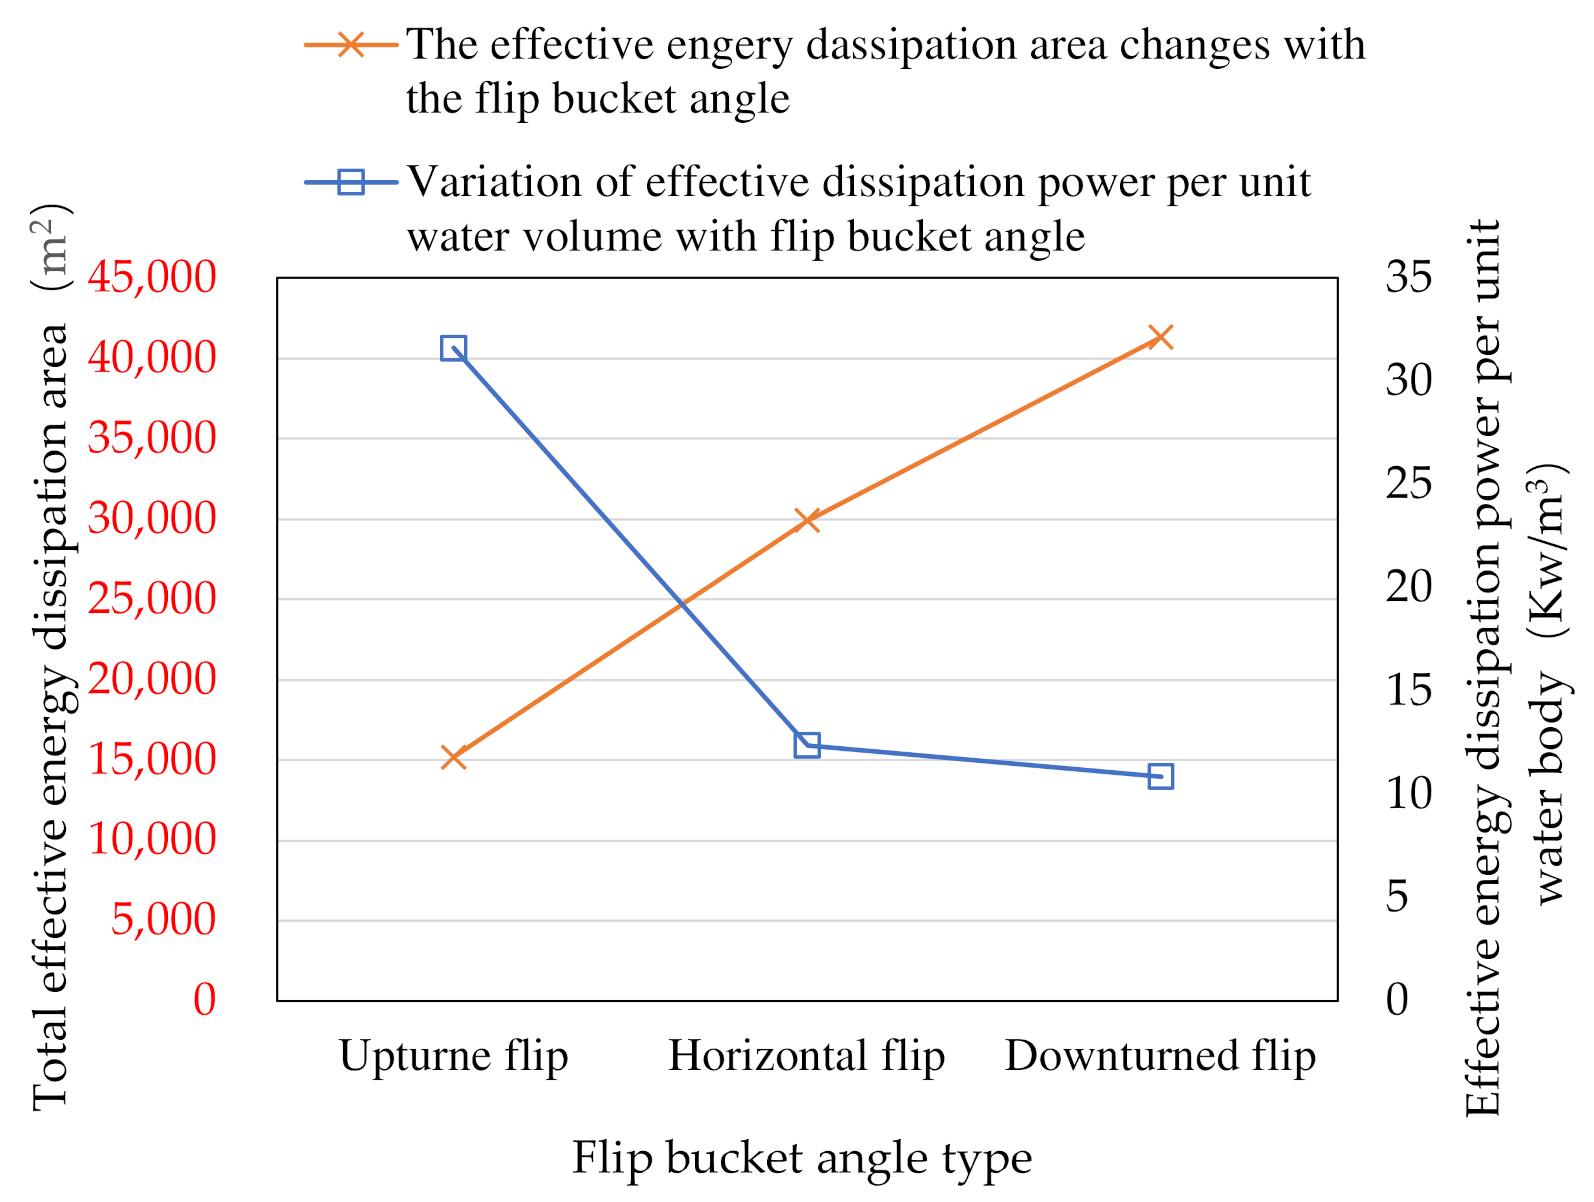
4.1.3. Downturned Flip Bucket

The falling point of the nappe in the horizontal flip bucket in scheme 2 is basically feasible, but the influence of low pressure on the increase in the trajectory distance is not considered. The elevation of the dam site for the RM hydropower project is nearly 3000 m, the air pressure is 66.46 kPa, and the atmospheric pressure is equivalent to 65.8% of the standard atmospheric pressure. In the low-pressure environment at high altitude, the trajectory distance will increase due to the reduction in air resistance.
In order to study the influence of different low-pressure environments on the trajectory distance of nappe, the research team [25] conducted a decompression model test. The camera method was adopted for nappe span observation. After the flow was stable, a 4K-level (resolution 3840 × 2160) high-definition network camera was used to record the flow at an appropriate location. The camera was fixed when shooting, and the shooting time was 120 s; due to the inevitable fluctuation of the nappe, in order to improve the observation accuracy and reduce the manual reading error, the video was exported as an image at an interval of 1 s, and the color hexadecimal value intersecting the edge of the nappe and the solid color ruler was obtained. Then, the image recognition program was written to automatically identify all images according to this hexadecimal value and to obtain the process line of the nappe within a certain time; the average value was calculated as the final trajectory distance. The thin-wall weir with high accuracy was used for flow observation. In the test, the flow velocity on the top surface of the flip bucket was calculated from the observed flow and the thickness of the nappe at the flip bucket. The measurement of the nappe thickness was consistent with the above observation method of the nappe trajectory distance, and the ambient air pressure was obtained by observing the vacuum degree of the decompression tank.
In order to study the influence of ambient air pressure reduction on water tongue flip distance and jet diffusion, 8 working conditions were set up, including 2 flip bucket exit angles and 4 different flows. Six different air pressure tests were carried out under each working condition, with a total of 48 groups of tests. Among them, 24 groups were used to fit and correct the flip distance formula under low pressure, and the remaining 24 groups were used to verify. Finally, the flip distance correction formula for flood discharge tongue in specification [29] considering the influence of air pressure is proposed, as follows:
L = 1 g k 1 2 v 1 2 s i n k 2 θ c o s k 2 θ + k 1 v 1 c o s k 2 θ k 1 2 v 1 2 s i n 2 k 2 θ + 2 g h 1 c o s k 2 θ + h 2
k 1 and k 2 are also basically linear with the air pressure, and their calculation formula is as follows.
k 1 = 0.02 p 0 p / p 0 + k 0
k 2 = 0.8 p 0 p / p 0 + θ 0 .  
where p is the ambient air pressure, p 0 is the atmospheric pressure, k 0 is the influence coefficient of air resistance on flow velocity under atmospheric pressure, which is calculated from the results of model test on the outer edge of water tongue, and θ 0 . is the angle of the flip bucket.
Based on the test results of optimization scheme 2 in the previous section, according to Formulas (2)–(4), taking the discharging tunnel of the RM hydropower project as an example, the test pick distance under normal pressure is 184 m. This value is substituted into Formulas (3) and (4) to calculate k 0 k 1 ,     k 2 .Then, it is calculated that the cantilever distance of the nappe at low pressure is 195 m, the trajectory distance of the nappe under low pressure is 195 m, which is 11 m higher than that obtained under normal pressure, the effective energy dissipation area will be reduced by 8.6%, and the energy dissipation power per unit water volume will be increased by 9.4%. Therefore, it is necessary to offset the impact of low pressure with the further internal shrinkage of the nappe falling point.
Scheme 2 of “cross-section diffusion and horizontal flip bucket” is further optimized to shrink the falling point of the nappe by 10–20 m as far as possible and make it located in the 1 3   ~   1 2 section of the bank of the plunge pool. The optimization idea is to adopt the method of “cross-section diffusion and downturned flip bucket”, that is, widening and lengthening the diffusion section, and the energy dissipater changes from a horizontal bucket to a downturned bucket. After preliminary hydraulic calculation, in the negative angle combination of a downturned bucket, the end angle of the bucket for the spillway tunnel is −11°, and the end angle of the bucket for the discharging tunnel is −2°, as selected for the model test. The typical shape is shown in Figure 13.
Considering the low-pressure environment, when the tunnel group flood discharge adopts downturned flip bucket discharge, the falling point of the nappe continues to retract, which greatly increases the utilization rate of the plunge pool and the effective energy dissipation area. The shape of the nappe under the combined flood discharge condition is shown in Figure 14. After the water fully dissipates energy in the plunge pool, the mainstream flows along the left wall of the plunge pool, and the outlet is smoothly connected with the downstream.
The larger the negative angle, the closer to the right bank the nappe falling point is, the greater the effective energy dissipation distance, the better the flow pattern, and the lower the energy dissipation power per unit water volume, the safer the energy dissipation is (see Figure 15, Figure 16 and Figure 17). According to the test results, the total effective energy dissipation area is 39,309 m2, which is 16% larger than that of the horizontal flip bucket in scheme 2, 2.59 times than that of scheme 2, and about 53% of the total area of plunge pool. The calculated maximum energy dissipation power per unit water volume is 12.21 kW/m3, which is also within the normal range of high dams and large reservoirs in operation, considering the influence of low pressure.

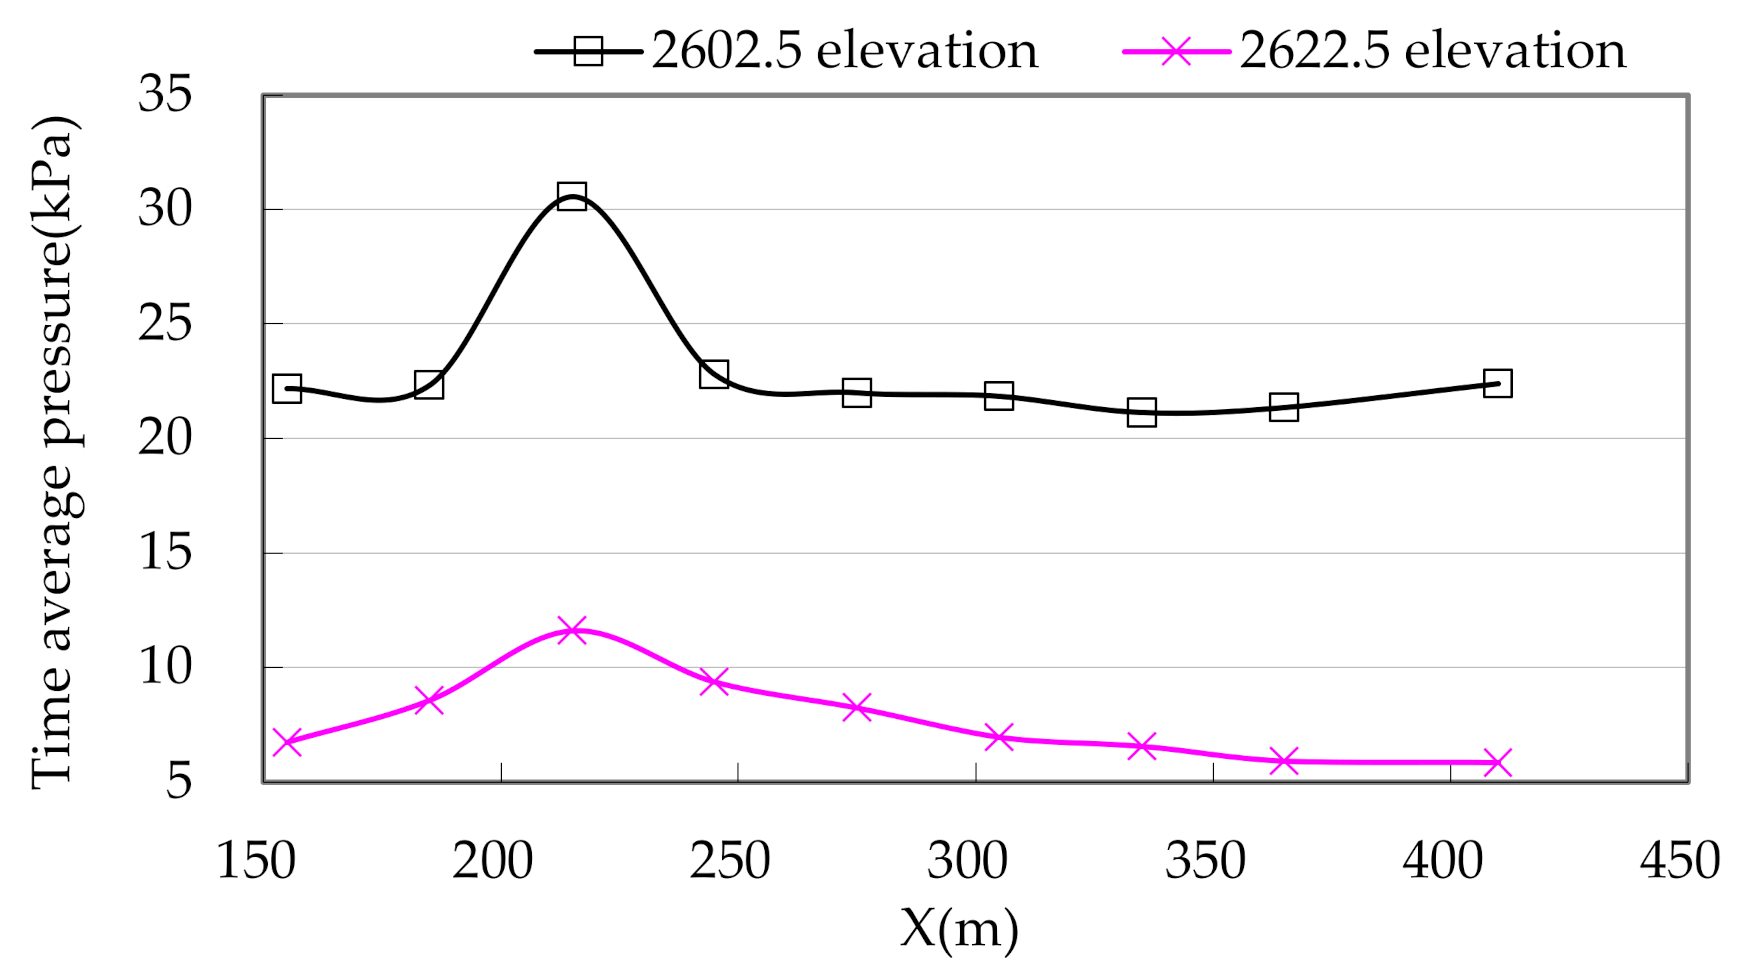
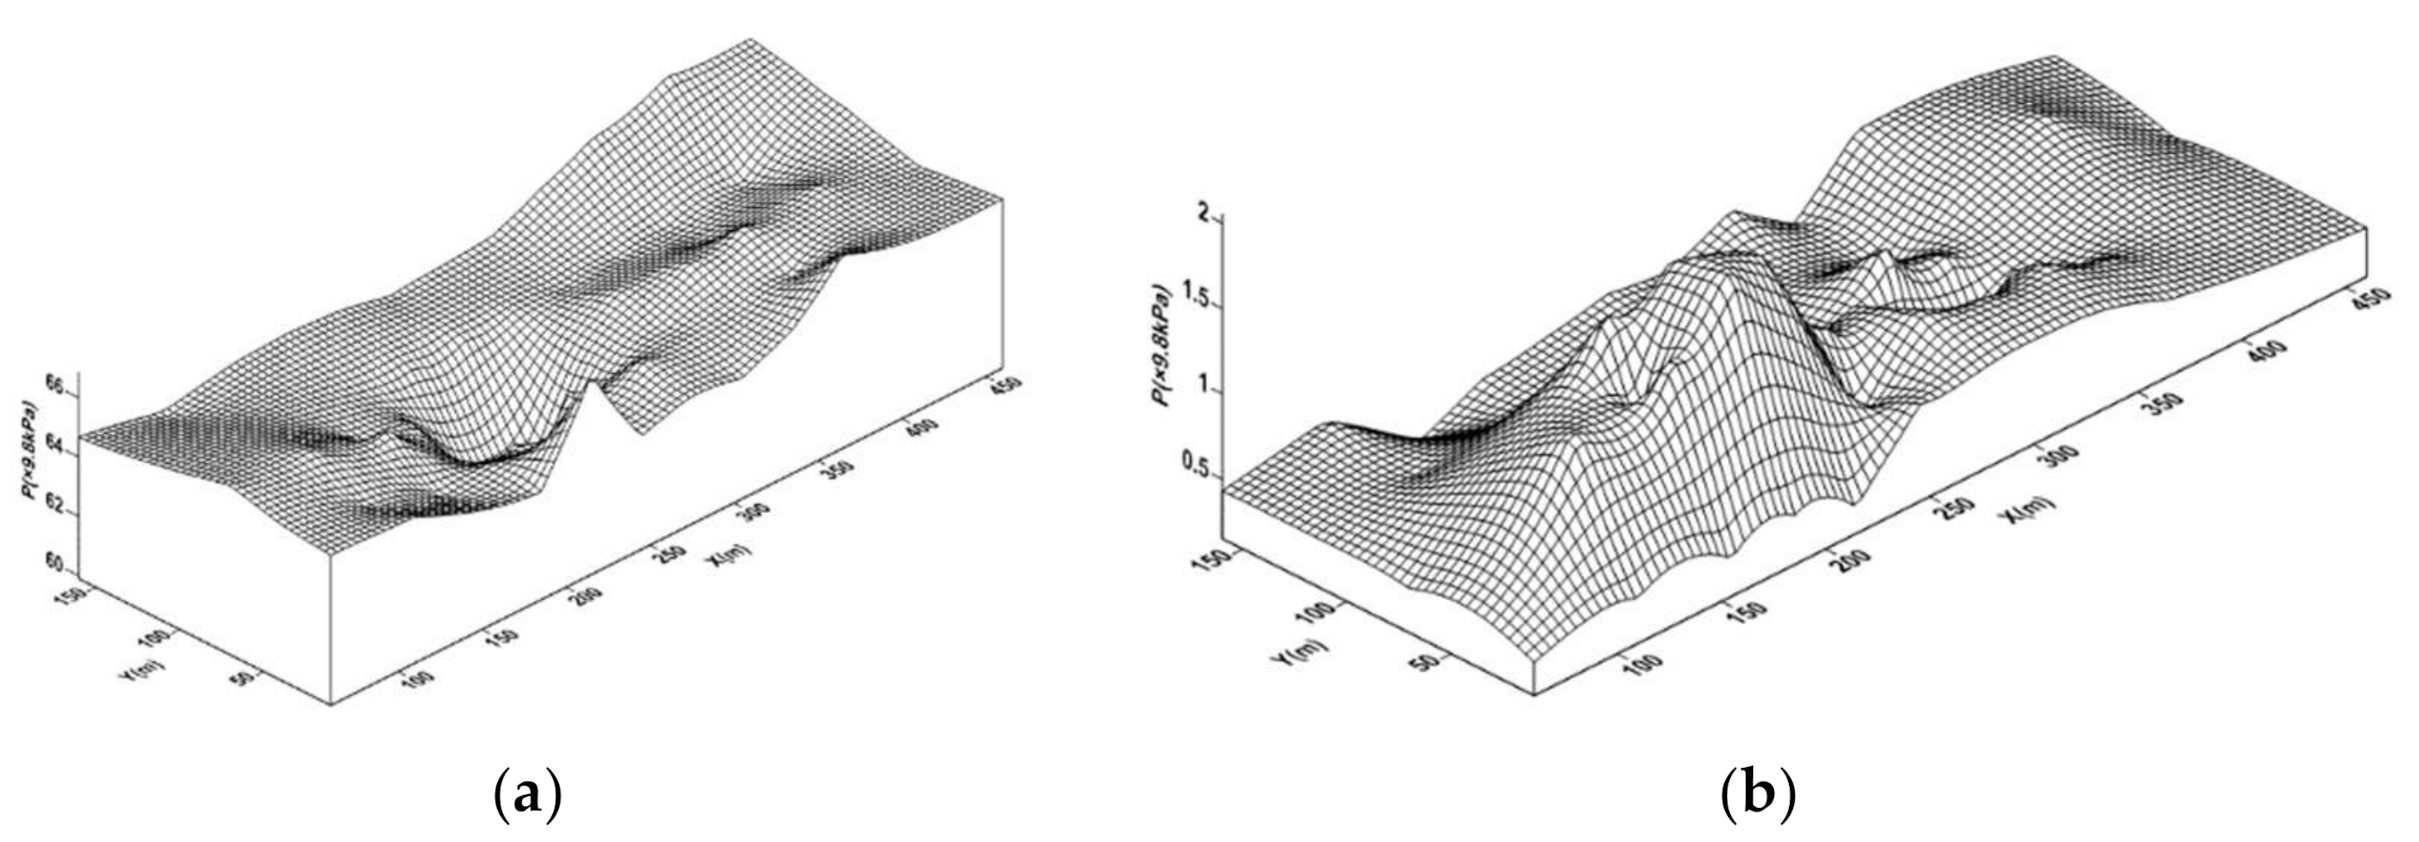
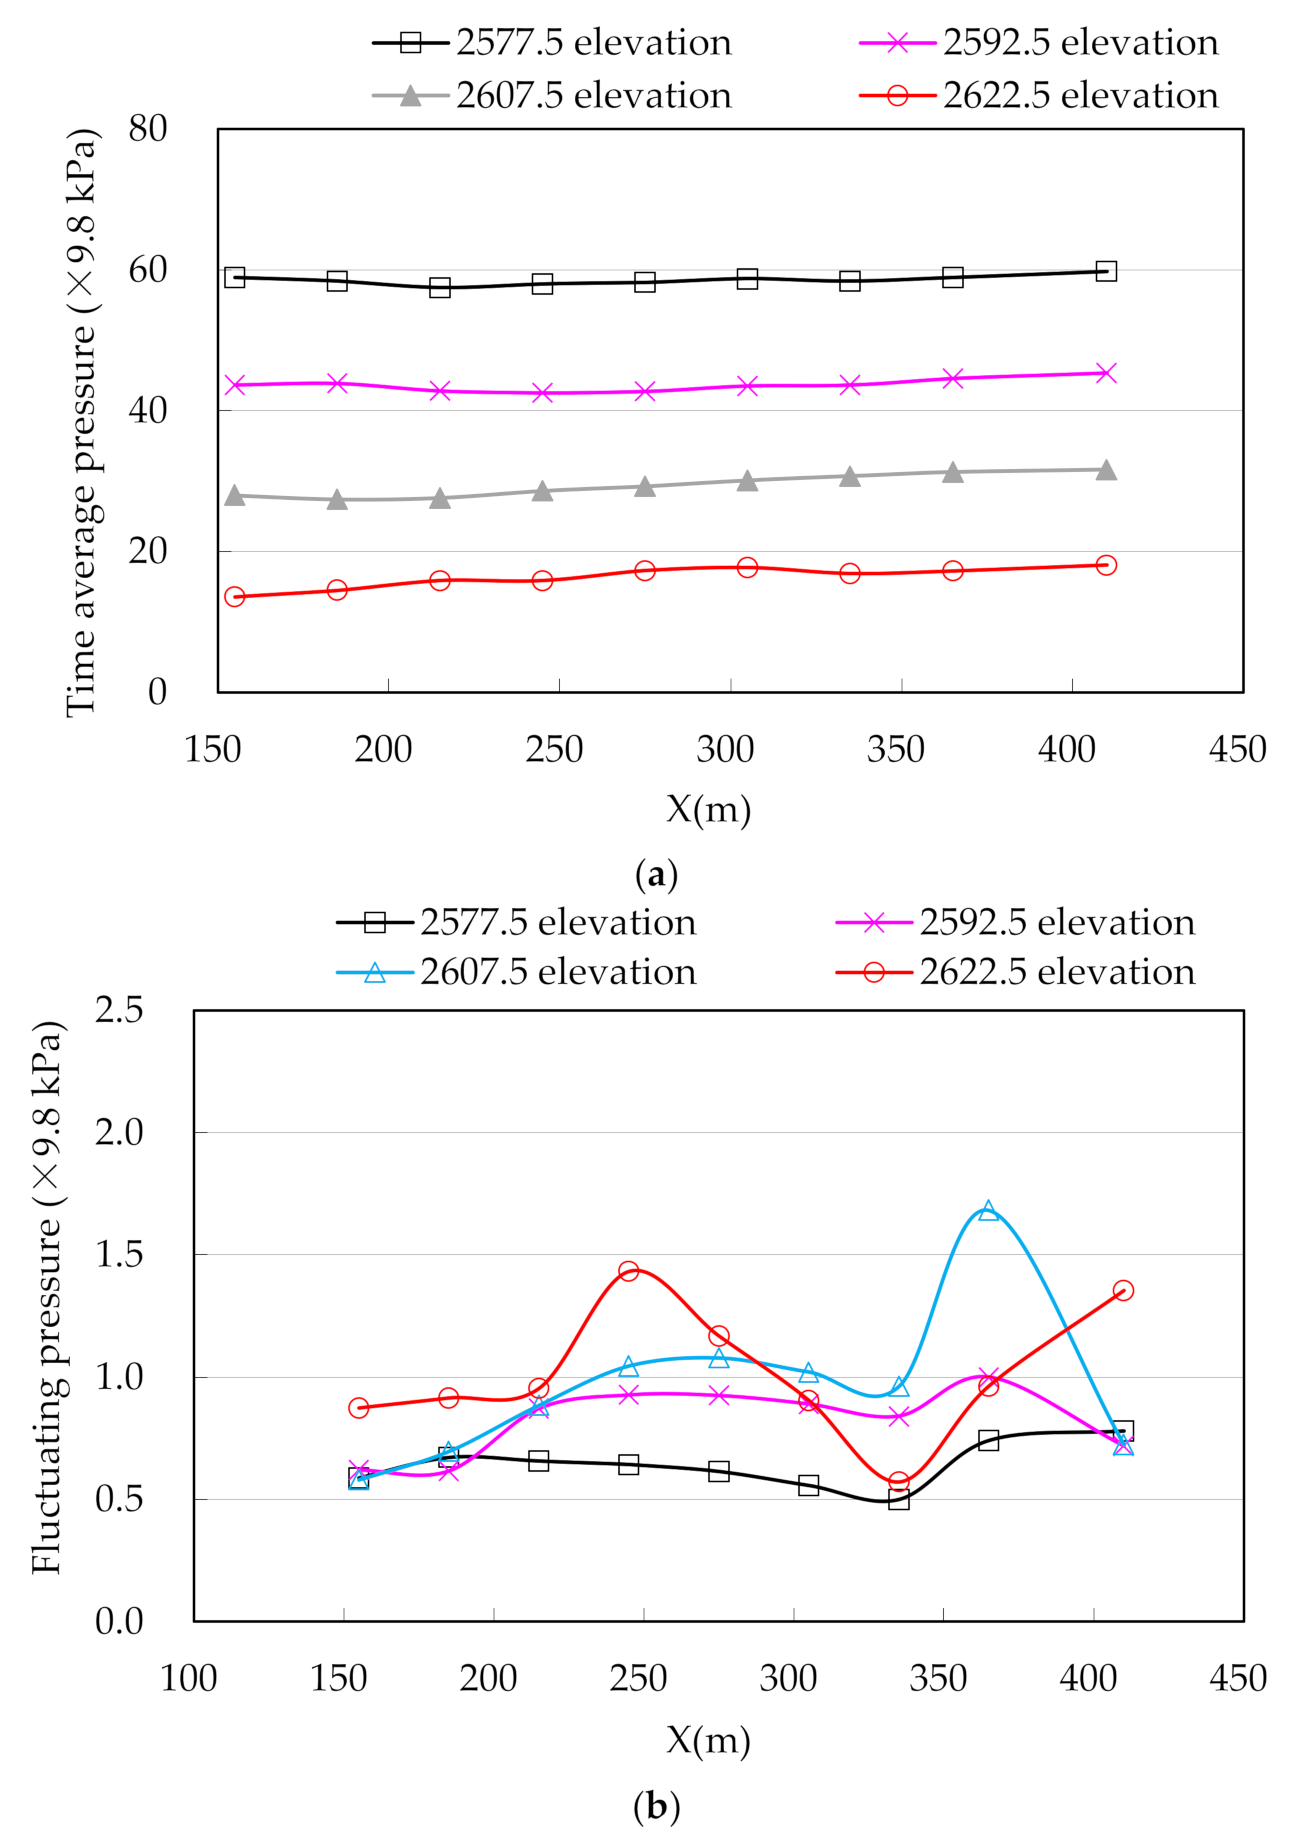
4.2. Hydrodynamic Pressure

Both the flood discharge system’s individual operation and the combined operation under various working conditions result in a significant impact on the bottom slab and the side wall at the corners, increasing the water pressure on the side wall and bottom slab. Taking the individual operation of the flood discharging tunnel as an example, the time average pressure distribution of the bottom slab when the gate is fully opened is shown in Figure 18, and the time average pressure distribution along the right bank wall is shown in Figure 19. The impact effect of the corner impact area on the bottom slab and side wall is obvious, and there are significant peaks in the time average pressure. The maximum hourly average pressure in the impact zone under each working condition is 51.6 × 9.8 kPa. The maximum hydrodynamic impact pressure of the bottom slab is 7.1 × 9.8 kPa.
The fluctuating pressure of the plunge pool is basically a stationary random process with approximately normal distribution.
The time domain amplitude characteristics of the fluctuating pressure stationary random process p t , t = 1 , 2 , 3 , , N   . are expressed using time domain digital characteristics such as mean, maximum amplitude, minimum amplitude and root mean square:
Mean:
P ¯ = 1 N t = 1 N p t
Maximum amplitude:
  P M a x = M a x p t p ¯
Minimum amplitude:
P M i n = M i n p t p ¯ .  
Root mean square value:
σ = 1 N t = 1 N p t p ¯ 2 .  
where   p t is the different value of fluctuating pressure with time.
In this study, the root mean square value of fluctuating pressure is used to analyze the distribution characteristics of fluctuating pressure. The fluctuating uplift force generated by the propagation of the fluctuating pressure wave along the plate joint of the plunge pool may lead to plate instability. The research on the flip energy dissipation plunge pool for high dams such as Xiaowan, Jinping, Laxiwa and Nuozhadu shows that [30] the fluctuating uplift force is closely related to the fluctuating pressure and impact pressure. The RMS value of the maximum fluctuating pressure is about 0.45 times the maximum impact pressure value. At present, the commonly used impact pressure control standard is 150 kPa, so it is estimated that the control standard of the fluctuating pressure is 67.5 kPa. The RMS value of the bottom slab’s fluctuating pressure in the corner impact area under various working conditions of the tunnel group scheme is as high as 10.4 × 9.8 kPa, and that of the side wall is up to 8.8 × 9.8 kPa. Compared with the individual operation and combined operation conditions of the discharge structure, the maximum fluctuating pressure does not decrease significantly due to the increase in the water cushion thickness, indicating that the longitudinal energy dissipation of the water flow is too small, and the increase in the water cushion cannot be improved. The RMS value of fluctuating pressure seriously exceeds that of the plunge pool, threatening the stability of the plunge pool slab.
For both the horizontal flip bucket and the downturned flip bucket, the falling point of the nappe is located in the middle of the plunge pool. The dynamic water pressure distribution of the plunge pool is obviously different from that of the upturned flip bucket. The dynamic water pressure distribution of the bottom slab of the typical plunge pool is shown in Figure 20; close to the nappe falling point, the time averaged pressure distribution is concave, while the fluctuating pressure distribution is convex. This shows that the drowned nappe under each working condition does not hit the bottom, so there is no impact pressure peak at the bottom during flow discharging. The time average pressure of the bottom slab mainly represents the change in water depth in the plunge pool. The static water depth in the nappe falling point area is pushed away by the high-speed flow. Therefore, the water depth in the falling point area is relatively shallow and the time average pressure is low, forming a concave distribution. However, the turbulent flow of energy dissipation in this area is relatively violent, and the fluctuating pressure is relatively high, meaning that it has a convex distribution. The dynamic water pressure distribution of the side wall of the typical plunge pool is shown in Figure 21. The average pressure along the flow direction of the bank wall generally increases, which is mainly caused by the narrow downstream river, which blocks the outlet and raises the water level. There is no peak characteristic formed by impact, indicating that the nappe falling point of the optimization scheme is reasonable and meets the requirements. Affected by the surface mainstream fluctuation and rolling turbulence, there is a peak value on the surface of the side wall at the axis of the tunnel group, and the fluctuating pressure is significantly greater than that of the right wall.
The energy dissipaters of the tunnel group horizontal flip bucket scheme adopt the diffusion type. The transverse diffusion of the nappe inlet is more significant, the angle of the nappe into the water cushion is reduced, and the dynamic water pressure of the water cushion pond is significantly lower than that of scheme 1. The maximum impact pressure on the plunge pool bottom slab is (2.9–3.6) × 9.8 kPa, and the RMS value of maximum fluctuating pressure is 4.6 × 9.8 kPa, 56% lower than the scheme 1. For the downturned flip bucket scheme, the nappe falling point is farther away from the left bank, the energy dissipation is more sufficient after the effective energy dissipation space is greatly increased, the RMS value of fluctuating pressure on the bottom slab and side wall is reduced, the maximum RMS value of fluctuating pressure on the bottom slab under various working conditions is 2.9 × 9.8 kPa, 72% lower than for scheme 1, the maximum RMS value of fluctuating pressure on the side wall is 2.3 × 9.8 kPa, 74% lower than for scheme 1, and the RMS value of the fluctuating pressure is within the control standard range.

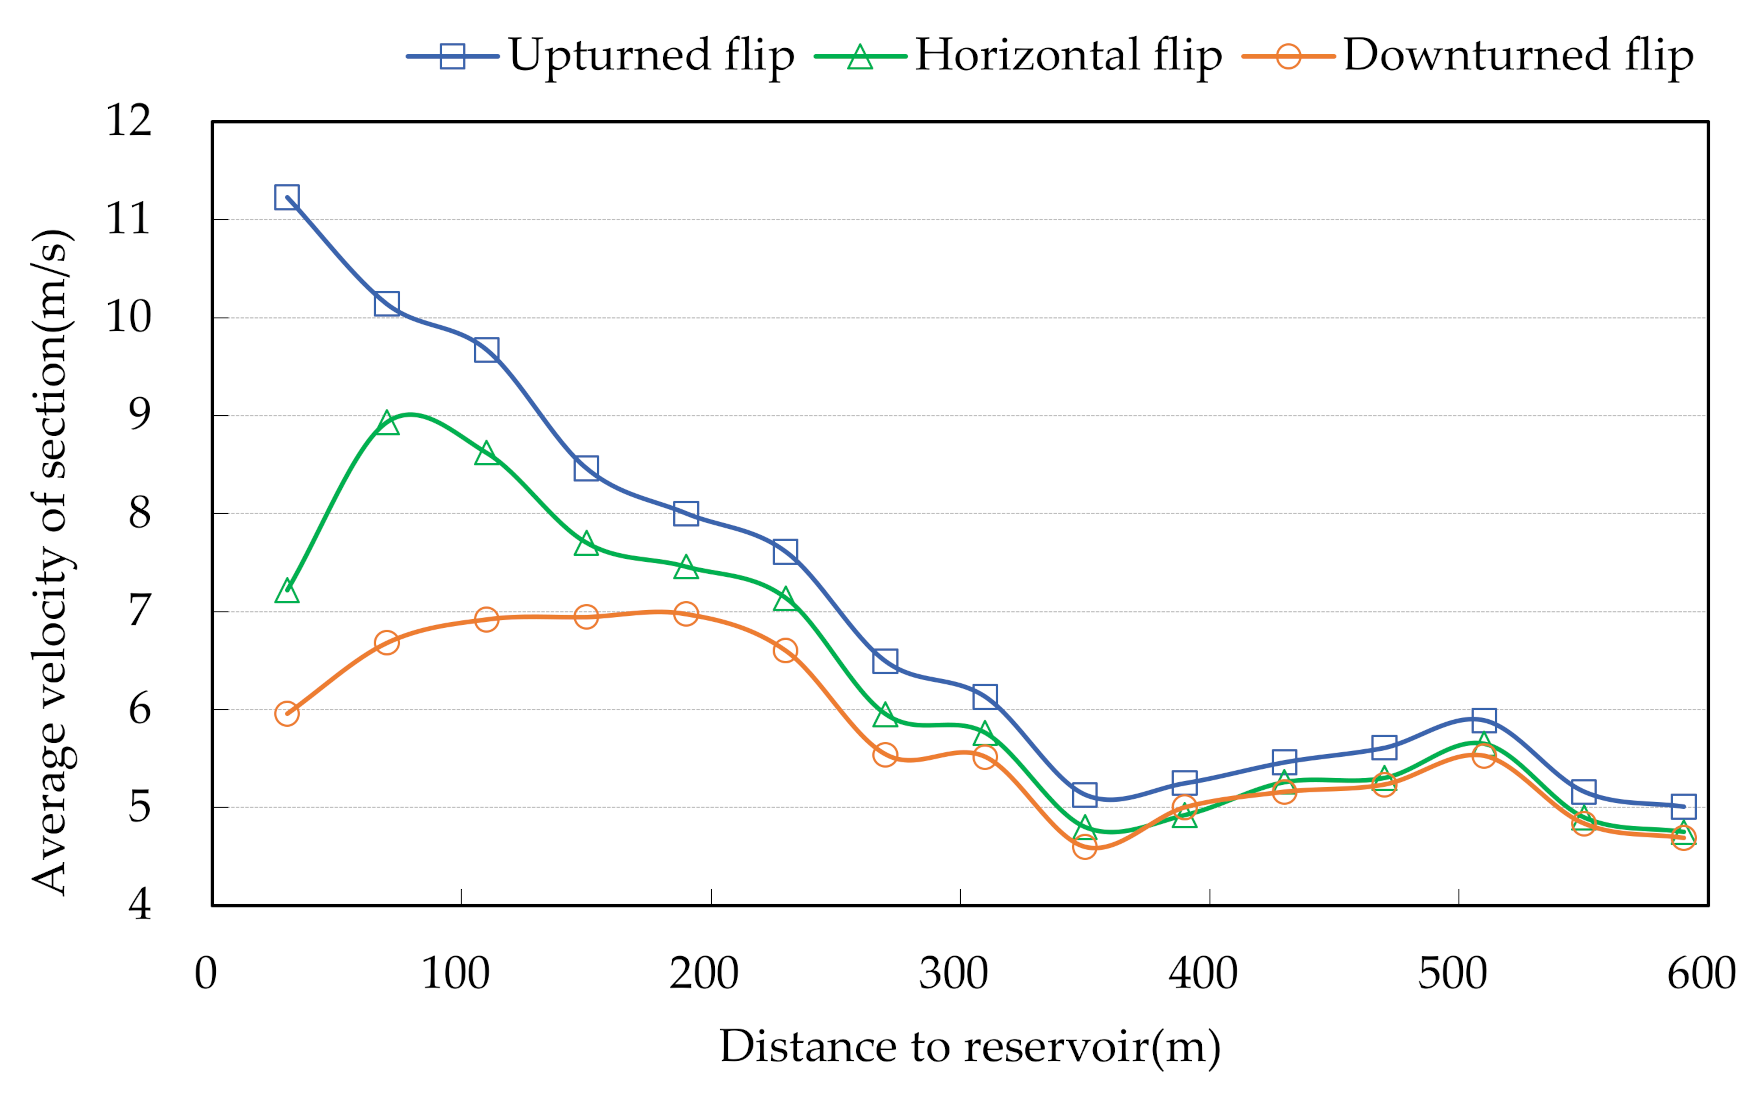
4.3. Velocity Distribution in Downstream

The comparison of average velocity along the downstream during the upturned scheme, horizontal scheme and downturned scheme is shown in Figure 22. From the distribution of flow velocity along the river, under different discharge modes, the area where the flow velocity of the downstream varies greatly is within 200 m from the outlet of the plunge pool; due to the distant falling point of the nappe, the mainstream is close to the downstream channel, especially the No.3 spillway tunnel located at the most downstream point, the outer edge of the nappe is only 15 m away from the downstream channel, and the discharged flow leaves the cushion pond without sufficient energy dissipation. The connection with the downstream channel is poor, and so the average velocity of the channel has a steep drop distribution. The maximum average velocity at the section 30 m away from the outlet of the plunge pool is 11.23 m/s, and the maximum velocity at each measuring point is 15.38 m/s. For the horizontal flip scheme, the average velocity of the downstream channel within this range has a parabolic distribution. Within 30 m from the outlet of the plunge pool, the flow is in the turning adjustment section. The velocity is high on the left and low on the right, and the average velocity is relatively low. The average velocity at the section 70 m from the outlet of the plunge pool is the maximum, which is 8.96 m/s, and the maximum velocity at each measuring point is 12.80 m/s. For the downturned flip scheme, the average velocity of the downstream channel within this range has a stable distribution. After the flow direction is adjusted, the average velocity is 6.68–6.97 m/s, and the change is relatively stable. The maximum velocity of each measuring point at the section 30 m away from the outlet of the plunge pool is 10.23 m/s. After effective energy dissipation, the outflow is well connected with the downstream channel. Within the range of 200–600 m from the outlet of the plunge pool, the velocity distribution along the downstream channel with different outlet modes is basically the same, which is mainly related to the change in river regime. In terms of flow velocity, the flow velocity in the downstream channel of the upturned flip scheme is the largest, the horizontal flip scheme is the second largest, and the downturned flip scheme is the smallest.
In order to compare the energy dissipation rate of the plunge pool under different discharge modes, taking the combined flood discharge of tunnel group as the typical working condition, the energy equations of the tunnel group outlet and downstream channel are calculated, respectively. The calculation method of the total energy E 1 1 at the outlet of tunnels is as follows:
E 1 1 = i = 1 4 Q i Q h i + s i + v i 2 2 g
where Q is the total flood discharge capacity of the tunnel group; Q 1 , Q 2 , Q 3 and Q 4 are the discharge capacity of the No.1 spillway tunnel, No.2 spillway tunnel, No.3 spillway tunnel and the flood discharging tunnel, respectively; h 1 , h 2 , h 3 and h 4 are the outlet water depths of the No.1 spillway tunnel, No.2 spillway tunnel, No.3 spillway tunnel and the flood discharging tunnel, respectively; s 1 , s 2 , s 3 and s 4 are the height from the bottom of the No.1 spillway tunnel, No.2 spillway tunnel, No.3 spillway tunnel and the flood discharging tunnel outlet to the datum plane, respectively—the datum plane is the bottom slab of the plunge pool with an elevation of 2590 m; and v 1 , v 2 , v 3 and v 4 are the average velocity at the outlet of the No.1 spillway tunnel, No.2 spillway tunnel, No.3 spillway tunnel and the flood discharging tunnel, respectively.
The total energy E 2 2 at the downstream channel is calculated as follows:
E 2 2 = h t + s t + v t 2 2 g
where h t is the water depth at the calculation section, s t   is the height from the riverbed bottom elevation at the calculation section to the datum plane, and v t is the average velocity at the calculated section.
The calculation method of energy dissipation rate η is as follows:
η = E 1 1 - E 2 2 E 1 1
Ignoring the small difference between the total energy E 1 1 at the outlet of the tunnels under the same working condition and different outlet modes, the total energy E1-1 is calculated using the downturned flip mode, which is listed in Table 2. In the case of combined energy dissipation of the tunnel group, E 1 1 is 259.82 m. In the test, since the flow pattern and velocity of the downstream channel basically do not change much compared with 110 m downstream of the plunge pool, the energy dissipation is basically completed and the flow pattern of the conventional channel is restored. Therefore, taking 110 m downstream of the plunge pool as the calculation section, the calculation of energy dissipation rate under different outlet modes is shown in Table 3. Since the total energy is up to 259.82 m head, the energy dissipation of high head and large energy hydropower projects is a difficult problem. According to Formulas (10) and (11), the total energy is composed of position head, pressure head and velocity head. On the basis of the total energy of 259.82 m, the position head, pressure head and velocity head can be reduced to the greatest extent, which can achieve a good energy dissipation effect. It can be seen from Table 2 and Table 3 that the position head and pressure head under different discharge modes are the same, and the important index to judge the energy dissipation effect is the velocity head. The downstream average velocity of the overhead discharge is the smallest, which is best connected with the downstream river channel, and its average velocity is the smallest. The average velocity at 110 m downstream of the plunge pool is 28% lower than that of the jet discharge and 20% lower than that of the horizontal discharge. Therefore, the energy dissipation rate of the downturned flip scheme is the highest, which is 80.2%, followed by the horizontal flip scheme, which is 79.8%, and the energy dissipation rate of the upturned flip scheme is the lowest, which is 79.4%. With the increase in effective energy dissipation space in plunge pool, the energy dissipation rate is significantly improved.

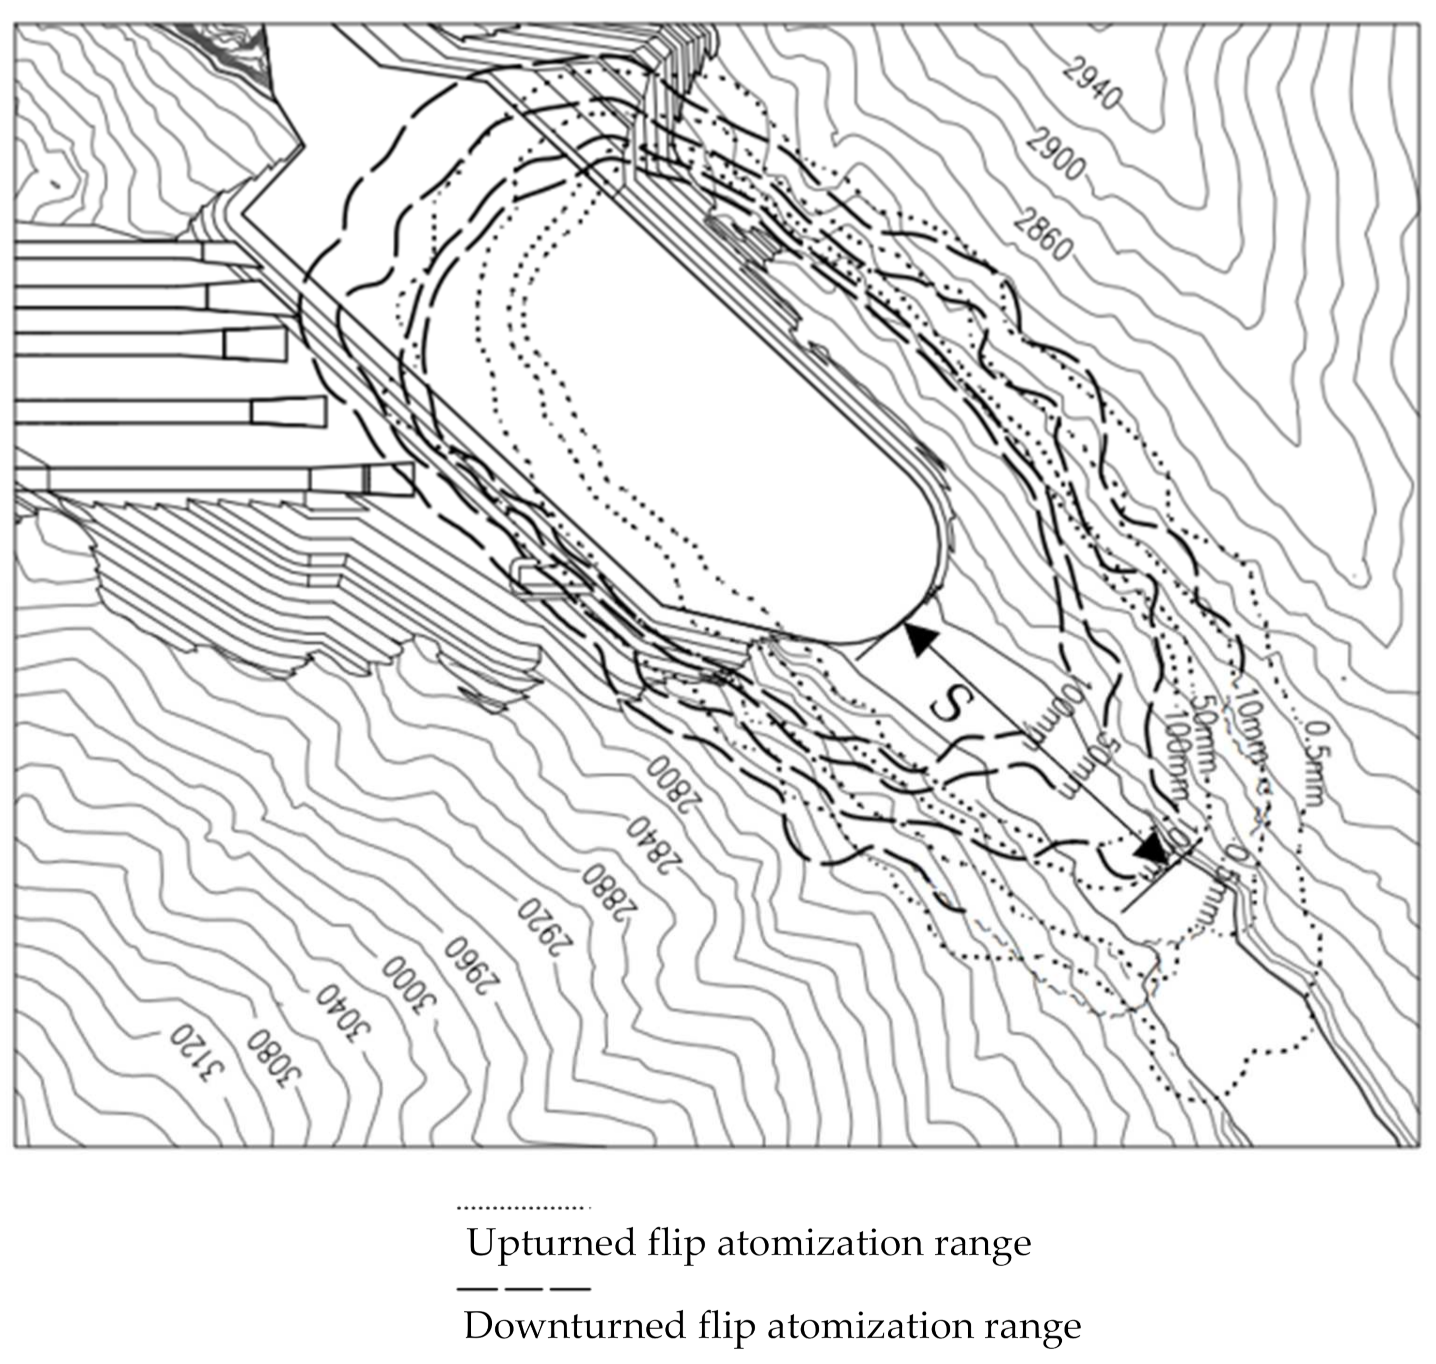
4.4. Analysis of Flood Discharge Atomization

The flood discharge atomization phenomenon is the phenomenon of unnatural rain and fog diffusing in the local area downstream due to the aeration and spalling of the nappe and the splash of the nappe going into the water. Among the effects of this, the rainfall intensity in the atomized rainfall area will mostly exceed the standard of a severe rainstorm in natural rainfall. In the built projects all over the world, it is common that the operation of projects is affected, or even more serious consequences are caused by flood discharge atomization. According to the atomization rainfall intensity, it is classified as follows: the area with rainfall intensity ≥ 50 mm/h is a heavy rainstorm region, which may cause landslides and damage to buildings, and effective protective measures need to be taken. An area with rain intensity ≥ 10 mm/h is a rainstorm region. Fog and rain will cause harm to the hydropower station. Buildings should be protected and vehicles should be prohibited. An area with rain intensity ≥ 0.5 mm/h is a drizzle area, in which fog and rain do little harm to the project, and atomization outside this range has no impact on the project. In order to compare the atomization characteristics of downstream flood discharge under different discharge modes, the atomization model of Tianjin University was used [31], and the atomization range of flood discharge under the upturned flip and downturned flip modes was calculated and analyzed. The atomization range of the flood discharge is shown in Figure 23 for when the tunnel group combined flood discharges under the designed flood conditions, and a comparison of the longitudinal and transverse ranges of different rain intensity levels is shown in Table 4.
It can be seen from the drawing that there is little difference in the transverse influence range of flood discharge atomization between the upturned flip mode and downturned flip mode, but there is a large difference in the longitudinal influence range along the downstream river channel. It is defined that the length S of the downstream river channel protection section is the distance between the downstream boundary of a certain rainfall area grade and the outlet of the plunge pool. The protection length S of the 100 mm rainfall area is 43.4% shorter than the upturned flip mode. The protection length S in the heavy rain area is 34.1% shorter than the upturned flip mode, and the protection length S in the heavy rain area is 20.9% shorter than the upturned flip mode. The downstream protection range of flood discharge atomization in the downturned flip mode is much smaller than that in upturned flip mode.

5. Conclusions

Through detailed model test research, the problems related to a large intersection angle between flood discharge facilities on the bank of an ultra-high rockfill dam and downstream energy dissipation facilities at a high altitude and a poor discharge return channel are studied. At the same time, the influence of low pressure on the water tongue span is preliminarily considered. In the future, the impact of low pressure on flood discharge flow characteristics can be comprehensively studied. The specific conclusions of this study are as follows:
(1) Under the condition of a large dip angle between the flood discharging structure axis and downstream cushion pool centerline, the downstream flow connection for the discharging tunnel group is poor, and the effective energy dissipation space is seriously insufficient, resulting in the maximum energy dissipation power per unit water volume being as high as 31.60 kW/m3, far exceeding the normal range for high dams and large reservoirs in operation. The effect of a horizontal flip scheme is significantly improved, but considering the impact of a low-pressure environment on the increase in the trajectory distance of the nappe, the energy dissipater should adopt the downturned flip shape. The larger the depression angle, the closer the nappe falling point, the larger the effective energy dissipation space, the better the flow pattern connection, the lower the energy dissipation power per unit water volume, and the safer the energy dissipation.
(2) The hydrodynamic pressure at the corner of the local sidewall and the bottom slab of the projecting water cushion pool of the tunnel group forms a significant impact peak; the bottom slab and side wall of the plunge pool have no impact characteristics during the upturned flip and downturned flip outflow. The pressure distribution near the nappe falling point is concave, and the fluctuating pressure distribution is convex; after effective energy dissipation, the hydrodynamic pressure decreases significantly, and the downturned flip mode decreases by 72–74% compared with the upturned flip mode.
(3) Different outlet modes of the tunnel group have a great impact on the downstream flow connection between the plunge pool and the river channel. The average velocity of the upturned flip mode is a steep drop distribution, a parabolic distribution in the horizontal flip mode and a stable distribution in the downturned flip mode. The flow velocity and energy dissipation rate of the upturned flip mode are the largest and the lowest in the downstream channel, while the flow velocity and energy dissipation rate of the downturned flip mode are the smallest and the highest in the downstream channel, respectively.
(4) The outlet mode of the tunnel group has little impact on the horizontal diffusion of flood discharge atomization but has a greater impact on the longitudinal diffusion. The vertical influence range of the flood discharge atomization of the downturned flip mode is much smaller than that of the upturned flip mode. The level of rainstorm area is shown above. The protection length of the downstream river channel of the downturned flip mode is about 21–43% shorter than that of the upturned flip mode.

Author Contributions

Conceptualization and methodology, S.W. and F.W.; validation and test, H.Z. (Haichao Zhang), L.Z. and W.B.; formal analysis, H.Z. (Haichao Zhang); investigation, X.Z.; resources, Z.Z.; data curation, H.Z. (Heng Zhang); writing—original draft preparation, H.Z. (Haichao Zhang); writing—review and editing, S.W. and F.W.; supervision and funding acquisition, S.W. All authors have read and agreed to the published version of the manuscript.

Funding

This research was mainly financed by Fund project of Nanjing Water Conservancy Research Institute (Y120001, Y121011), Science and Technology Projects of China Power Construction Corporation Limited (DJ-ZDXM-2017-05), National Natural Science Foundation of China (51909169), Basic research program of Jiangsu Province (Natural Science Foundation) (SBK2019042181).

Institutional Review Board Statement

Not applicable.

Informed Consent Statement

Not applicable.

Data Availability Statement

Not applicable.

Acknowledgments

All the authors sincerely thank the reviewers who contributed their expertise and time for reviewing this manuscript.

Conflicts of Interest

The authors declare no conflict of interest.

References

  1. Zhang, L.C.; Luo, S.Z.; Wu, S.Q. Experimental Study on Overall Hydraulic Model of Rumei Hydropower Station in Tibet; Nanjing Institute of Hydraulic Sciences: Nanjing, China, 2018. [Google Scholar]
  2. Miracle, A.; Denslow, N.D.; Kroll, K.J.; Liu, M.C.; Wang, K.K.W.; Andrew, I. Spillway-induced salmon head injury triggers the generation of brain alphaII-spectrin breakdown product biomarkers similar to mammalian traumatic brain injury. PLoS ONE 2009, 4, e4491. [Google Scholar] [CrossRef]
  3. Zhang, L.C.; Luo, S.Z. Experimental Study on Integral Hydraulic Model of Yulong Kashi Water Control Project; Nanjing Institute of Hydraulic Sciences: Nanjing, China, 2020. [Google Scholar]
  4. Li, S.; Duan, B. The Highest Dam in the World under Construction: The Shuangjiangkou Core-Wall Rockfill Dam. J. Eng. 2016, 2, 274–275. [Google Scholar] [CrossRef] [Green Version]
  5. Pan, L.; Wang, C. Experimental Study on the Optimization of the Bucket Shape at the Exit of High Head, Narrow Valley and Large Overflow Spillway Tunnel C. In Proceedings of the Academic Exchange Meeting of Sichuan Hydropower Engineering Association and Six Provincial (District) Construction Technology Exchange Meeting of ”Sichuan Yungui, Hunan, Guangdong and Qing”, Chengdu, Sichuan, China, 2018; p. 4. Available online: https://kns.cnki.net/kcms/detail/detail.aspx?dbcode=CPFD&dbname=CPFDLAST2018&filename=SDFD201811001066&uniplatform=NZKPT&v=jnttCh4w8dpEPuuWpS0aell9T3D%25mmd2FnfKTYq5bnLrcMa6IFEOypKC%25mmd2BlLuqmbUPDyhKbAqO0mG2mAk%3d (accessed on 22 September 2021).
  6. Zhu, X.W.; Xie, J.J.; Wang, C.; Hou, D.M.; Deng, J. Study on the Type of Flip Bucket at the Outlet of Ultra-High Velocity Spillway tunnel of Lianghekou Hydropower Station. J. Hydropower Stn. Design. 2018, 34, 7–9. [Google Scholar]
  7. Zhang, Y.C.; Peng, Y. Research for the Optimization test of outlet of flood discharge tunnel in Narrow Water Course with Large Included Angle. J. Jilin Water Resour. 2008, 4, 25–27. [Google Scholar] [CrossRef]
  8. Xu, L.L.; Diao, M.J.; Yue, S.B.; Ji, C.M. Research on optimizing flip bucket of a certain narrow river hydropower station spillway with big angle of skew. J. Southwest Univ. Natl. (Nat. Sci. Ed.) 2012, 38, 316–319. [Google Scholar] [CrossRef]
  9. Suo, H.M.; Wang, F.L. Ski-jump energy dissipation and scour prevention design for spillway with high head, narrow river channel and large obliquity. J. Hongshuihe 2013, 32, 5–8. [Google Scholar] [CrossRef]
  10. Qiu, Y.; Gong, A.M. Application of Flip Trajectory Bucket Skip-Jump Energy Dissipation in Heishiluo Reservoir. J. Hydropower Energy Sci. 2016, 34, 101–103. [Google Scholar]
  11. Zha, S.Q.; Wang, J.X.; Zhu, Z.G. Control of fall point of waterjet for flood discharge tunnel in narrow channel with right angle. J. Hydropower Energy Sci. 2011, 29, 92–94. [Google Scholar] [CrossRef]
  12. Zhang, L.; Zhang, J.; Guo, Y.; Peng, Y. Numerical Simulation of the Hydraulic Performances and Flow Pattern of Swallow-Tailed Flip Bucket. J. Math Probl. Eng. 2020, 2020, 6062780. [Google Scholar] [CrossRef]
  13. Xu, M. Comparative study on flip bucket of spillway tunnel. J. Sichuan Hydropower 2017, 36, 120–123. [Google Scholar] [CrossRef]
  14. Tan, Z.W.; Wang, J.X. Experimental research on flip bucket combining narrow slit and swallow-tail in flood release tunnel. J. Chang. Acad. Sci. 2015, 32, 40–44. [Google Scholar] [CrossRef]
  15. Shima, A. The Behavior of a Spherical Bubble in the Vicinity of a Solid Wall. J. Fluid Eng. 1970, 90, 75. [Google Scholar] [CrossRef]
  16. Wang, Y.J.; Zhang, L.C.; Luo, S.Z. Influence of environmental pressure drop on surface tension coefficient of water. J. Sci. Technol. Eng. 2017, 17, 136–138. [Google Scholar] [CrossRef]
  17. Lian, J.J.; Dong, Z.; Liu, F.; Liu, D. Experimental study on the influence of low atmospheric pressure on the dynamic pressure. J. Hydropower 2019, 38, 101–110. [Google Scholar] [CrossRef]
  18. Dong, Z. Study on the Influence of Low-Pressure Environmental on the Hydrodynamic Pressure and the Trajectory Distance of Jet; Tianjin University: Tianjin, China, 2018. [Google Scholar]
  19. Li, Y.; Wang, Y.; Zhang, D. Influence of environmental pressure on hydraulic characteristics of high arch dam plunge pool. J. Hydraul. Eng. 1999, 9–13. Available online: https://kns.cnki.net/kcms/detail/detail.aspx?dbcode=CJFD&dbname=CJFD9899&filename=SLXB903.001&uniplatform=NZKPT&v=r_FUNe6hGV9hicLe353n6x0mZ3pVeqLPgCfwi-8rAP_rYmWhWPTGwdWsPJP_UT1s (accessed on 22 September 2021).
  20. Pang, B.H.; Zhang, L.C.; Chi, F.D. Analysis of Ambient Air Pressure Effect on Cavity Length of Aeration Facility. J. Hydropower Energy Sci. 2020, 38, 114–116. [Google Scholar]
  21. Pang, B.H.; Ma, H.Q. Influence of low atmospheric pressure trajectory distance of high velocity jet nappes at high altitude. J. Hydropower 2018, 37, 88–95. [Google Scholar] [CrossRef]
  22. Pang, B.H. Influence of Atmospheric Pressure on Cavitation Characteristics of High Velocity Flow at High Altitude. J. Yangtze River Acad. Sci. 2019, 36, 64–67. [Google Scholar] [CrossRef]
  23. Yan, Z. The similarity of subatmospheric hydraulic model test. J. Water Conserv. 1983, 3, 33–42. [Google Scholar] [CrossRef]
  24. Jiang, Y.Z. Low Pressure Hydraulics—Study on Characteristics; Nanjing Institute of hydraulic Sciences, Ministry of Water Resources, Ministry of Communications, National Energy Administration: Nanjing, China, 2021. [Google Scholar]
  25. Jiang, Y.Z.; Zhang, L.C.; Luo, S.Z.; Wu, S.Q. Influence of Decrease of Environmental Pressure on Trajectory of Jet. J. Hydropower Energy Sci. 2021, 39, 101–103. [Google Scholar]
  26. In model tests under atmospheric and vacuum ambient. J. Water Conserv. 1999, 30, 9–13. [CrossRef]
  27. Luo, S.Z.; Zhang, L.C. Theory and Method of Comprehensive Evaluation of Hydraulic Safety of Hub Operation Regulation; Yellow River Water Conservancy Press: Zhengzhou, China, 2020; pp. 94–99. [Google Scholar]
  28. NB, National Energy Administration of the People’s Republic of China. Code of Practice for Hydraulic Model Test of Flood Discharge Atomization for Hydropower Projects; China Electric Power Press: Beijing, China, 2021; p. 2.
  29. State Economic and Trade Commission of the People’s Republic of China. Design Specification for River-Bank Spillway, DL/T5166-2002; China Electric Power Press: Beijing, China, 2012; pp. 61–62.
  30. Lian, J.J.; Yang, M. High Dam Discharge Project; China Water Resources and Hydropower Press: Beijing, China, 2008. [Google Scholar]
  31. Lian, J.J.; Liu, F. Study on Mathematical Model of Flood Discharge Atomization of LC RM Hydropower Project; Tianjin University: Tianjin, China, 2019. [Google Scholar]
Figure 1. Layout plan of flood discharging and the energy dissipation system.
Water 13 03408 g001
Figure 2. Schematic diagram of the overall physical model.
Water 13 03408 g002
Figure 3. A sketch of the way of the width of the nappe was measured.
Water 13 03408 g003
Figure 4. The hydrodynamic pressure measuring points in the plunge pool: (a) the right side wall; (b) the bottom plate; (c) the left side wall.
Water 13 03408 g004aWater 13 03408 g004b
Figure 5. The nappe shape of each discharge structures operating individually under the design flood condition: (a) No.1 spillway tunnel; (b) No.2 spillway tunnel; (c) No.3 spillway tunnel; (d) flooding discharging tunnel.
Water 13 03408 g005
Figure 6. The nappe shape under the combining operating condition and design flood.
Water 13 03408 g006
Figure 7. The nappe falling point under the design flood condition.
Water 13 03408 g007
Figure 8. The effective energy dissipation area.
Water 13 03408 g008
Figure 9. Scheme 1 of the energy dissipater of the flood discharging tunnel group: (a) No.1 and No.2 spillway tunnels; (b) No.3 spillway tunnel; (c) flood discharging tunnel.
Water 13 03408 g009
Figure 10. Scheme 2 of the energy dissipater of the flood discharging tunnel group: (a) No.1 and No.2 spillway tunnels; (b) No.3 spillway tunnel; (c) flood discharging tunnel.
Water 13 03408 g010
Figure 11. The nappe shape of scheme 1 under the designed flood conditions: (a) No.1 spillway tunnel; (b) No.2 spillway tunnel; (c) No.3 spillway tunnel; (d) flood discharging tunnel.
Water 13 03408 g011
Figure 12. The comparison of the nappe falling point under the design flood condition for the transverse diffusion and flat jet angle scheme. (a) scheme 1; (b) scheme 2; (c) the comparison of the nappe falling point.
Water 13 03408 g012
Figure 13. Basic shape of flip bucket negative angle combination. (a) Plan; (b) section.
Water 13 03408 g013
Figure 14. The nappe shape under united operating condition for all working conditions.
Water 13 03408 g014
Figure 15. Comparison of the upturned flip bucket, horizontal flip bucket and downturned flip bucket nappe falling points.
Water 13 03408 g015
Figure 16. Variation relationship between flip bucket angle and flip bucket distance at the outer edge of the nappe.
Water 13 03408 g016
Figure 17. Relationship between total effective energy dissipation area and effective energy dissipation power per unit water volume and flip bucket angle.
Water 13 03408 g017
Figure 18. Typical averaged pressure distribution of the bottom slab on the plunge pool.
Water 13 03408 g018
Figure 19. Pressure distribution of the nappe cushion pond on the local bank sidewall.
Water 13 03408 g019
Figure 20. Dynamic water pressure at the base plate of the cushion pool: (a) time-averaged mean water pressure; (b) fluctuating pressure.
Water 13 03408 g020
Figure 21. Dynamic water pressure at the sidewall of the cushion pool: (a) time-averaged mean water pressure at the left sidewall; (b) fluctuating pressure at the left sidewall.
Water 13 03408 g021
Figure 22. Comparison of average velocity along the downstream channel.
Water 13 03408 g022
Figure 23. Isoline of rain intensity under no wind conditions (the isolines of rain intensity are 100, 50, 10 and 0.5 mm from outside to inside). Note: S shown in the figure is the length of the protection section in the heavy rainstorm area of the downstream river during the flow discharging. The blue line shows downturned flip atomization range, the red line indicates upturned flip atomization range.
Water 13 03408 g023
Table 1. The hydraulic parameters of the nappe under the designed flood conditions.
Flood Discharging StructureFlow Speed at the Outlet (m/s)Jet Trajectory Distance (m)Nappe Width While Diving into Water (m)
Outer LimitInternal Limit
No.1 spillway tunnel48.428225048
No.2 spillway tunnel48.028025244
No.3 spillway tunnel48.6298 (outer limit at the left side)285 (outer limit at the right side)64
Flood discharging tunnel48.529026016
Table 2. Calculation of total energy of combined flood discharge outlet of tunnel group.
Discharge Structure Q i   ( m 3 / s ) h i ( m ) s i   ( m ) v i ( m / s ) E i ( m ) E 1 1 ( m )
No.1 spillway tunnel31863.6514048.467.43259.82
No.2 spillway tunnel31863.5714048.066.91
No.3 spillway tunnel31863.5914048.667.67
flood discharging tunnel27635.1413548.557.80
Table 3. Calculation of energy dissipation rate of different outlet modes.
Flip Flow Mode h t ( m ) s t ( m ) v i ( m / s ) E 2 2 ( m ) η
upturned flip mode23.81259.6753.4979.4%
horizontal flip mode23.898.6252.6179.8%
downturned flip mode24.016.9251.4080.2%
Table 4. Comparison of vertical and horizontal ranges of different rain intensity levels.
Flip Flow ModeRain RegionLongitudinal Range (Distance from the Outlet of Plunge Pool, Negative Sign Is Downstream)Left ElevationRight Elevation
upturned flip100 mm rainstorm region−145–23827602660
heavy rainstorm region−164–24627652694
rainstorm region−206–27027902718
drizzle area−260–28928202760
downturned flip100 mm rainstorm region−82–25927202728
heavy rainstorm region−108–26827402743
rainstorm region−163–29027882759
drizzle area−193–31728222783
Publisher’s Note: MDPI stays neutral with regard to jurisdictional claims in published maps and institutional affiliations.

