Abstract
Drought has become a recurrent phenomenon in Algeria in the last few decades. Significant drought conditions were observed during the late 1980s and late 1990s. The agricultural sector and water resources have been under severe constraints from the recurrent droughts. In this study, spatial and temporal dimensions of meteorological droughts in the Wadi Mina basin (4900 km2) were investigated to assess vulnerability. The Standardized Precipitation Index (SPI) method and GIS were used to detail temporal and geographical variations in drought based on monthly records for the period 1970–2010 at 16 rainfall stations located in the Wadi Mina basin. Trends in annual SPI for stations in the basin were analyzed using the Mann–Kendall test and Sen’s slope estimator. Results showed that the SPI was able to detect historical droughts in 1982/83, 1983/84, 1989/90, 1992/93, 1993/94, 1996/97, 1998/99, 1999/00, 2004/05 and 2006/07. Wet years were observed in 1971/72, 1972/73, 1995/96, 2008/09 and 2009/10. Six out of 16 stations had significant decreasing precipitation trends (at 95% confidence), whereas no stations had significant increasing precipitation trends. Based on these findings, measures to ameliorate and mitigate the effects of droughts, especially the dominant intensity types, on the people, community and environment are suggested.
1. Introduction
Drought is a recurring phenomenon that affects a wide variety of sectors, making it difficult to develop a single definition of it. According to a water-resource-oriented definition, which takes into account the water requirements related to biological, economic and social characteristics of a region, drought refers to a condition of severe reduction of water supply availability (compared to a normal value), extending along a significant period of time over a large region [1]. Drought is a complex phenomenon that involves different human and natural factors that determine the risk and vulnerability to it [2].
The particularly strong influence of drought on many sectors is visible in arid and semiarid regions, where water is scarce [3]. Water scarcity can strongly impact the agricultural sector in such regions [4]. In the case of the Mediterranean Basin, much of which is arid or semiarid, the extremely variable precipitation across temporal and spatial scales is influenced by geographical position of the region between two contrasting masses of water: the Atlantic Ocean and the Mediterranean Sea [5,6,7]. An additional feature determining high variability of precipitation in this region is the presence of various mountain ranges distributed along the coastal areas from east to west [7]. To avoid water scarcity, increased knowledge about variability of meteorological conditions could be used to mitigate the effect of drought, as well as guide various irrigation scheduling and water productivity strategies in arid sandy soils. According to Rossi [8] the drought mitigation measures can be divided into three main categories: (1) water-supply oriented, such as using additional sources of low quality water and improvement of existing water system efficiency, (2) water-demand reduction: restriction of municipal uses and irrigation, pricing, dual distribution system, water recycling and (3) minimalization of drought impact by temporal relocation of water resources, tax relief, and development of warning systems. Knowledge about drought phenomena can also help with sustaining reforestation programs under an eventual increase in aridity [9] and with water resources planning and management via reservoirs to overcome scarcity [10].
Meteorological drought can be assessed using many indicators. For example, Weighted Anomaly Standardized Precipitation Index (WASP) was developed by Lyon [11] to monitor precipitation in the tropical regions. Crop Moisture Index (CMI) is commonly calculated weekly along with the Palmer Drought Severity Index (PDSI) output as a short-term drought indicator of impact on agriculture [12]. Drought Reconnaissance Index (DRI) [13] is based on a simplified water balance equation considering precipitation and potential evapotranspiration. Effective Drought Index (EDI) as a good index for operational monitoring of both meteorological and agricultural drought [14]. Hydro-thermal Coefficient of Selyaninov (HTC) developed by Selyaninov, Bokwa et al. [15] uses temperature and precipitation values, and is sensitive to dry conditions specific to the climate regime being monitored. RPI (Relative Precipitation Index) is the ratio of precipitation sum for the given period and the long-term average for the same period expressed in percent [15]. NOAA Drought Index (NDI) is a precipitation-based index in which the actual precipitation measured is compared with normal values during the growing season [16]. Palmer Drought Severity Index (PDSI) [17] uses monthly temperature and precipitation data along with information on the water-holding capacity of soils. SPEI (Standardized Precipitation Evapotranspiration Index) is a standardized monthly climatic balance computed as the difference between the cumulative precipitation and the potential evapotranspiration [18]. The Standardized Precipitation Index (SPI), developed by McKee et al. [19] in the 1990s, is robust and effective for evaluating meteorological drought and remains a very popular choice among researchers to reveal drought and to estimate duration and intensity of drought events [19]. The SPI has several advantages, as discussed by [20] and [21], over many other drought indices, such as some of those mentioned above. Firstly, it is based only on rainfall, so that in the absence of other hydro-meteorological measurements, drought assessment is still possible. Secondly, SPI can be used to quantify precipitation deficit for multiple timescales, which enables it to assess drought conditions in meteorological, hydrological and agriculture applications. Finally, standardization of the SPI index ensures that the frequency of extreme drought events at any location and any timescale is approximately constant.
Due to its robustness and convenience, SPI has already been widely used to characterize dry and wet conditions in many countries in the Mediterranean region, such as Turkey [22,23], Spain [24,25], Italy [26,27,28,29,30], Iran [31,32,33], Greece [34,35,36], Iraq [37,38,39], and Palestine [40].
In particular, many researchers in North Africa have studied meteorological drought using SPI indices, including in Algeria [41,42,43,44,45], in Morocco [46], and in Tunisia [47,48,49]. So far, there has not been a study on spatial and temporal variations of meteorological drought, expressed by SPI, in the region of the Wadi Mina basin of northwest Algeria, which is characterized by high intensities of agriculture and presence of forest cover. According to [50], renewable water resources in Algeria are quite low and can be approximated as 19 billion cubic meters per year. In the other words, the water resources are equal 450 cubic meters (m3) per capita per year and are slightly below the 500 m3 per capita per year that is recommended as the scarcity threshold indicating a water crisis. Moreover, the water resources have high variability and projections are that rainfall could decrease by more than 20% by 2050, which would result in greatly worsening water shortages in different basins of Algeria [51]. Knowledge on extreme dry conditions is also very important because these can influence not only on water scarcity for agriculture but also on natural ecosystems, mainly forest in the case of the studied basin. For example, Mensah et al. [52] showed that elevated temperatures will further exacerbate the drought impacts on forest ecosystems at sites with precipitation levels equal or smaller than the atmospheric evaporative demand and strong influence of vapor pressure deficits on carbon uptake, and can worsen the decline in soil moisture.
In this work, the objective was to better characterize annual-scale drought patterns over the Wadi Mina basin in order to aid water resource planning. The main objectives are to (1) map characteristics of drought patterns over the basin during 1970–2010, (2) identify any trends in precipitation or in drought characteristics, (3) identify drought years over the observation period, and (4) estimate the return periods for severe drought across the basin.
2. Study Area and Data
2.1. Study Area
The Wadi Mina basin, with an area of 4900 km2, is located in the northwest of Algeria (Figure 1). The Wadi Mina involves four major tributaries: Wadi Mina, Wadi Haddad, Wadi Abd and Wadi Taht. The climate is continental, with cold winters and hot summers. Mean annual precipitation ranges from about 220 to 400 mm, and most precipitation occurs between November and March. Mean annual temperatures are about 16 °C to 19.5 °C. Almost half the basin is covered by a varying density of vegetation, with in particular 32% of scrub, 35.8% of forests and 20% cereal crops [53].
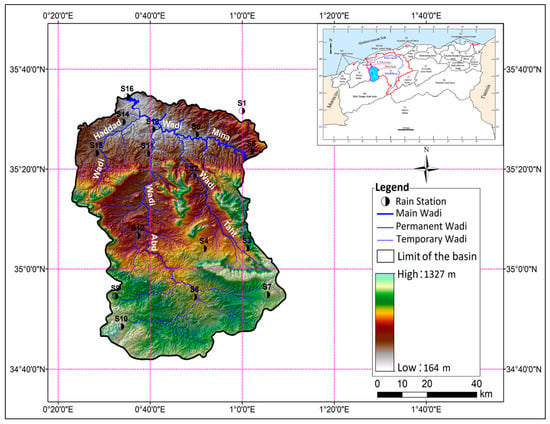
Figure 1.
Topography and station distribution for the Wadi Mina basin in northern Algeria.
2.2. Data Used
Monthly precipitation records for a 40-year observation period (September 1970 to August 2010, using water years that go from September to August) are compiled for 16 stations from the Algeria National Agency of Water Resources (Figure 1 and Table 1). These stations constitute a relatively well-distributed network with acceptable spatial density over the basin. To assure quality, data was checked for inhomogeneities using the double mass curve, linear regression and Mann-Whitney test methods. The procedure detected a few inhomogeneities, for which the irregular data were adjusted using data of nearby reliable stations. Rainfall data of these 16 stations were analyzed statistically to evaluate rainfall variability in the study area (Table 2). These preliminary statistical analyses included measure of central tendency (mean, and median), dispersion (standard deviation SD, coefficient of variation CV) and distribution (skewness Cs and kurtosis Ck).

Table 1.
Characteristics of rain gauge stations used in the analysis.
Table 2.
Descriptive statistics of annual rainfall series in the Wadi Mina basin (1970/71–2009/10 water years).
To test for stationarity, the Kwiatkowski–Phillips–Schmidt–Shin test (KPSS) was used [54]. The results of the stationarity test for monthly, seasonal and yearly series are shown in Table 3. All the monthly, seasonal and annual series of the rainfall stations are indicated as showing stationarity (p-value is more than 0.05).
Table 3.
Results of stationarity tests for the monthly, seasonal and yearly series.
3. Methodology
3.1. SPI
The standardized precipitation index (SPI) is commonly used to detect meteorological drought. Each drought is characterized by drought intensity (Di), a drought magnitude (Dm) and drought duration (Dd). Run intensity can be either the value of the SPI at any moment (Dint) or the minimum SPI value during a drought event (Dmi) The drought magnitude (Dm) is equal to the accumulated values of below-threshold SPI during each drought event (Figure 2).
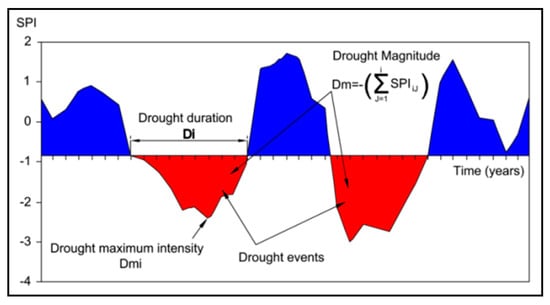
Figure 2.
Definition of drought properties based on the SPI index [55].
SPI is mathematically based on the cumulative probability of monthly precipitation amount recorded at the observation post [56,57]. No evaporation estimate is considered, unlike other drought indices such as SPEI. SPI = 0 denotes average (climatological) precipitation, SPI = 1 denotes 1 standard deviation wetter than average, and SPI = −1 denotes 1 standard deviation drier than average. In the case of the presented analysis, the monthly precipitations were aggregated over water years, and finally a yearly SPI (12-month timescale) for each water year was calculated. SPI periods (years) with SPI below the defined threshold are considered drought years, and consecutive drought years are grouped into droughts. The whole period of observation at a meteorological station is used to determine the parameters of a precipitation probability density function, taken to be in the form of a gamma distribution:
where α and β are the shape and scale parameters respectively. x is consecutively precipitation and Γ(α) is the gamma function. The gamma function defined by the following:
The alpha and beta parameters of the gamma distribution are estimated from the precipitation time series as
where is the mean value of precipitation quantity; n is the precipitation measurement number; xi is the quantity of precipitation in a sequence of data.
The cumulative probability can be presented as:
To allow for the possibility that the precipitation may be zero, a mixture probability distribution is used, for which the cumulative probability becomes
where q is the probability that the quantity of precipitation equals zero.
The calculation of the SPI is presented on the basis of the following equation [20,58]:
where t is determined as
and c0. c1. c2. d1. d2 and d3 are coefficients whose values are:
According to McKee et al. [18] different categories and approximate probabilities of wet and dry spells can be considered based on SPI for the timescale of interest, as shown in Table 4. SPI is expected to follow a near-normal (bell curve) distribution, with SPI values near 0 being the most common and high positive or negative SPI (corresponding to very wet or very dry periods, respectively) being rare.
Table 4.
Drought classification based on SPI value and corresponding event probabilities based on the approximation that SPI values follow a standard normal distribution.
These probabilities shown in Table 4 are estimates, assuming that SPI is normally distributed. Achieving an approximately standard normal probability distribution is the main motivation behind the transformation of precipitation to SPI.
3.2. Trend Analysis
Trend analysis determines whether the measured values of a variable show a consistent increase or decrease during a time period. Many statistical methods can be used for trend detection in a time series of meteorological and hydrological records. In this study we used simple and accepted methods for evaluating trends, the Mann–Kendall test and Sen’s estimator of slope.
The Mann–Kendall method is a widely used non-parametric test for detecting trends in climatological and hydrological time series. It has been suggested by many authors to assess trends in environmental data time series because, unlike least-squares linear regression, it is robust to outlying and extreme values.
The Mann–Kendall test statistic S is given by [59]:
where n is the number of data. x are the data values at times j and k (j > k) and the sign function is
The variance of S is computed by
where ti is the number of ties of extent i and m is the number of tied rank groups. For n larger than 10, a Z test statistic that, under the null hypothesis of no correlation, approximates a standard normal distribution is computed as the Mann–Kendall test statistic as follows:
If a linear trend is present in a time series, then the true slope (change per unit time) can be estimated by using a simple non-parametric procedure developed by Sen [60]. The slope estimates of the n(n − 1)/2 unique pairs of data are first computed by:
where xj and xi are data values at time j and i (j > i). respectively. The median of these N values of Q is Sen’s estimator of slope. After sorting the Q values, if N is even, then Sen’s estimator is calculated by:
If N is odd, then Sen’s estimator is computed by:
Sen’s estimator Qmed provides the rate of change and enables determination of the total change in any variable during the analysis period. Sen’s slopes are expressed here as rate of change per 40 years (1970–2010) in mm.
3.3. Drought Charcateristics
3.3.1. Frequency Analysis
Drought frequency (Fi) is the chance of a station being in drought in a given year. This was estimated empirically based on the following formula:
where n—number of years of drought (SPI equal 0 or less), N—number of analyzed years.
3.3.2. Drought Intensity (DI)
Drought intensity (DI) is used to represent the severity of the drought. The drought intensity of a site within a certain period is usually reflected by the SPI value. The more negative the SPI value, the more serious the drought is. Its formula is as follows:
3.3.3. Drought Magnitude (DM)
DM corresponds to the cumulative water deficit over a drought period. DM is the sum of the absolute values of all SPI values (0 or less) during a drought event (Equation (16)):
3.3.4. Drought Duration (DD)
DD equals the number of time periods between the drought start and its end. In our case, we consider all SPI values below 0 as drought years.
3.4. Return Period of Drought
In addition to computing drought frequencies as empirical probabilities in the 40-year observation record, return periods of severe drought were also computed in this study using the annual maximum series (AMS) approach. The AMS here is based on the time series of SPI values for drought years. A drought was described as an SPI value less than zero. Drought-free years were given a zero value. The number of years for which SPI values are available is used to calculate the duration of the sequence. Only non-zero values were used in the drought frequency calculation. To account for the number of zero values, a correction was made using nonexceedance likelihood (F′) according to the following expression [55,61]:
where F is the non exceedance probability value obtained by using frequency analysis on the non zero values and q is the probability of zero values which can be calculated as the ratio of the number of time intervals without drought occurrences to the total number of time intervals in the recording period [55,61].
To estimate the return period of drought severity that may go beyond the values observed over the 40-year period for which we have data, we fitted a probability distribution to the derived AMS. In this case, the drought event time series were fitted with gamma distributions. The return period of drought with particular severity was then calculated as:
4. Results and Discussion
4.1. Temporal Variability
The SPI was used to provide an indicator of drought severity in this study. The temporal characteristics of droughts in Wadi Mina basin was analyzed based on the 12-month timescale water-year SPI computed for each station (Figure 3). Analysis of the computed SPI series shows the basin has experienced droughts of high severity and duration in the 1980s and 1990s. A drought is defined whenever the SPI reaches a value of 0.00 and continues until the SPI becomes positive again.
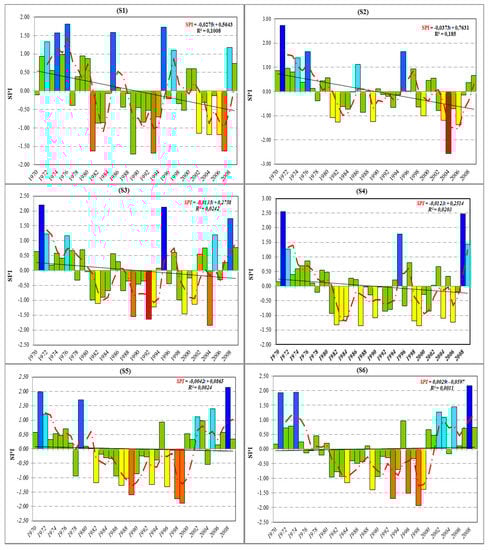
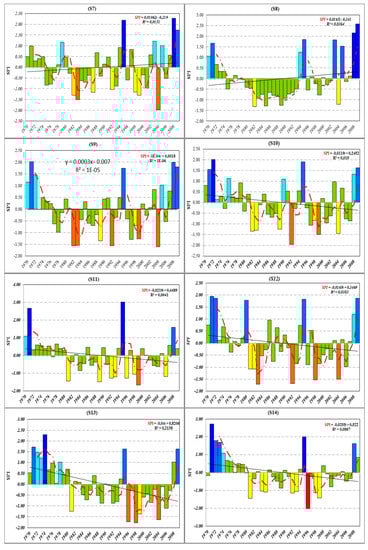
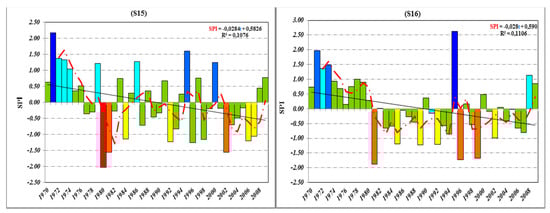
Figure 3.
Annual SPI time series and its linear trend and 3 year moving average of the pluviometric stations of Wadi Mina basin. Note that colors are linked with drought classification based on Table 4. Number in branches above figures is number of station.
The main historical droughts observed in the study area were in 1982/83, 1983/84, 1989/90, 1992/93, 1993/94, 1996/97, 1998/99, 1999/00, 2004/05 and 2006/07. Wet years were observed in 1971/72, 1972/73, 1995/96, 2008/09 and 2009/10. A decreasing trend of SPI, implying a likely increased frequency and intensity of drought, was observed on 13 of 16 rain gauge stations. Most of the stations with the strongest decreasing SPI trend are observed in the lower part of the Wadi Mina basin where are observed relatively lower sums of precipitation (Table 2). Increase of trend of SPI and likely decreased intensity of drought is observed on three rain gauge stations located mainly in upper part of the basin, in the Wadi Abd tributary. Spatio-temporal changes of SPI is caused by change of precipitation. Elouissi et al. [62] detected similar decreasing trends of precipitation in the northern part of the Macta basin (Algeria), close to the Mediterranean coast, and increasing trends in the southern part. The changes of precipitation and SPI can be affected by geographical position of the area in relation to the Atlantic Ocean, the Mediterranean Sea and the Atlas mountain ranges [63]. We can also see from Figure 3 that dry periods have tendency to cluster over long stretches of years. Clustering is especially visible in station S8 during 1975–1993, S5 (1981–1999), S6 (1981–1999) and S13 (1996–2007). Figure 3 also shows that at station S3 located in the upper part of the Wadi Taht subbasin, and S6 and S5 in the upper Wadi Mina, intensity of meteorological drought since 2000, expressed by SPI, was small, with wet years being more common.
Trend analysis determines whether the measured values of a variable show a significant increase or decrease during a time period. In this study, we used a simple method for evaluating trends, Mann-Kendall test and annual and seasonal Sen’s slopes of trend values are expressed as rate of change per 40 years (1970–2010) in mm. The result of this analysis is shown in Table 5. At 7 of 16 rain gauge stations, or 44% all stations, there was a significant negative trend (p < 0.1). The significance level of trend in 6 cases was p < 0.05, and in the case of S13 station the p value was under 0.01. At most stations, from 1996 onward there were mainly severe droughts. Significant decreasing trends were observed at stations located in the upper part of the Wadi Mina and middle part of the Wadi Taht tributary. A significant increasing trend was not detected at any of the Wadi Mina basin stations.
Table 5.
Values of statistics b, Z of the Mann–Kendall test for the annual SPI series (1970–2010).
Table A1 presents drought classification for the 16 rain gauge stations in each year. The most common SPI category overall was near normal (NN). For several years (1971, 1972, 1995, 2008 and 2009) most stations were in wet categories (EW, VW and MW). For 1971, 1995 and 2008 only 2–5 out of 16 stations were dry, and no severe or extreme drought was observed. The highest number of stations with severe or extreme drought (SD and ED) was observed in the years 1981, 1983, 1989, 1992, 1996, 1998, 1999 and 2004. The highest number of years with unusually wet conditions (MW, VW and EW) were observed on stations S13 and S15-8 cases. These stations were located in the lower part of the Wadi Mina. The most cases of intense drought (ED, SD and ED) were observed at station S9-9 cases, and the highest number of years with severe and extreme drought were observed at stations S1, S9 and S12-4 cases.
4.2. Spatial Variability
To visualize the distribution of droughts in the basin, the study area is divided using Theissen Polygon tool in Arc GIS 10.2 into 16 polygons corresponding to the 16 rainfall stations. Stations that are closely spaced are assigned less area and vice versa (Figure 4). Lee et al. [64] showed that the spatial distribution of the rain gauge networks and the density have a significant influence on accurately calculating areal precipitation and Thiessen method gave good results when the spatial distribution of the rain gauge networks was even, as was the case here. Moreover, the weights assigned to the different stations do not vary with time, and thus it is easy to map the precipitation falling during each period. Geostatistical methods offer more sophisticated approaches to making maps based on station data, but the uncertainty of areal precipitation is in any case high if there are relatively few stations, like in this basin [65]. Even though some stations may show drought conditions, a regional drought is acknowledged only when some major portion of the total study area is under drought. Regional drought is determined by the intra-annual precipitation distribution, which can be affected by teleconnection patterns [66,67], and the North Atlantic Oscillation indices [68]. Moreover, regional-scale influence on the rainfall conditions in North Africa could result from the response of the African summer monsoon to oceanic forcing, amplified by land-atmosphere interaction [69].
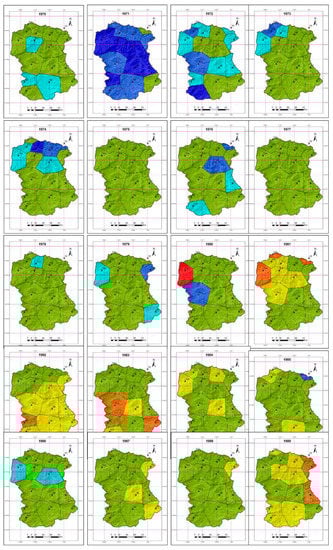
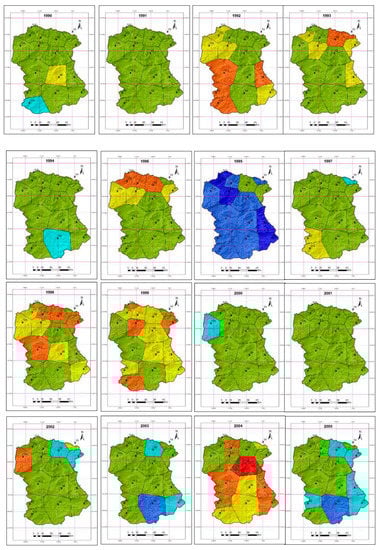
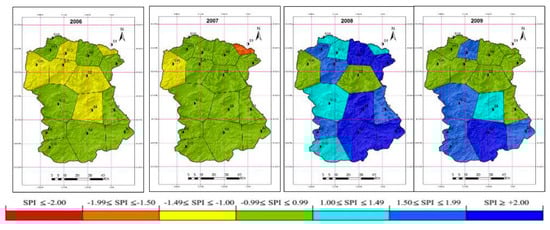
Figure 4.
Spatial variability of meteorological drought in the wadi Mina basin.
The spatial distribution of drought intensity is shown (Figure 4) in each analyzed year. In 1971, 1995, and 2008, wet conditions prevailed over almost all the Wadi Mina basin (SPI ≥ 1.0). Less widespread wet conditions were seen in 1972 (east and central part of basin in wet condition) and 2009 (upper and middle part of basin). No droughts were seen between 1970 and 1979 in the region. The year 1980 is an example of intra-basin variability: almost all area of basin had near normal conditions, but particular areas had either very wet conditions (middle part of the Wadi Abd catchment) or extreme drought (upper part of the Wadi Haddad tributary). The years where a large part of the Wadi Mina basin was in drought were 1982, 1989, 1999, 2004 and 2006, but the worst situation was in 2004, where all the upper and middle parts of the basin had moderate to extreme drought. Spatial patterns of drought within the basin varied unpredictably during the study period, which could be due to the complex interaction of storm tracks with orographic features.
4.3. Drought Evaluation Indicators
4.3.1. Frequency Analysis
Drought frequency calculated for all analyzed stations is presented in Table 6. Near normal (NN) conditions occurred most frequently at all stations (57.5% to 72.5% of the time, depending on station). The extreme categories—extreme wetness (EW) and extreme drought (ED)—were the least frequently observed. Extreme drought only occurred at 3 of 16 rainfall gauge stations over the 40-year observation period. However, all but 2 rainfall gauge stations (S4 and S8) observed either ED and SD.
Table 6.
Frequency of each drought and wetness class for the considered stations, %.
Table A2 shows drought duration, magnitude and intensity, as well as average, maximum and minimum SPI at annual time scale for the meteorological stations considered in this study area. All drought indicators have strong variability over the study area. Drought duration (DD) varied between 1 to 16 years, and most frequently was only 1 year. The highest DD of 12, 13 and 16 years were observed at stations S13, S6 and S5, respectively. The highest drought intensity was observed at S16 station and lowest at S8. The largest drought magnitude was observed at S5 and the smallest at S11. Extreme drought was observed in 1980/81, 1996/97 and 2004/05 in stations located in the lower part of basin.
4.3.2. Calculation of Return Period and the Severity-Area-Frequency (SAF) Curve
The Severity-Area-Frequency (SAF) curve is a very useful method for showing the spatial extent of different types of drought in a given area. This technique has been undertaken by several researchers around the world, for example in India [70]; China [71]; Southern Africa [72] and in Iraq [39]. Figure 5 illustrates the drought Severity-Area-Frequency curves of SPI annual scale time for 10-, 25-, 50-, 100-year exceedance periods, along with the curves for the four most severe drought years of 1984/85, 1993/94, 1998/99 and 2004/05 that affected the region.
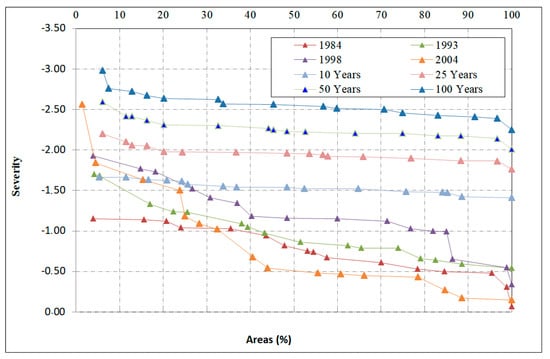
Figure 5.
Estimated drought severity—area—frequency curves for the annual SPI values for the Wadi Mina basin, as compared those seen in historical droughts.
The severity analysis shows that all selected droughts have smaller severity than for return periods 10, 25, 50 and 100 years. Moreover, the high drought severity occurred on relatively small areas, less than 20% of analyzed basin and is observed mainly on the north part of the basin—Figure 4. Moderate or near normal years are observed on the most parts of the basin.
4.3.3. Spatial Pattern of Return Periods of Droughts
The return periods of moderate, severe and extreme droughts at all stations were calculated and the values were then used to prepare the corresponding maps by using inverse distance weighted (IDW) interpolation method analysis tool of ArcMap (Figure 6). The presentation of these maps shows spatial variability of the drought for the different classes, with extreme drought more likely (shorter return period) in the north and east, apparently modulated by the high heterogeneity of the spatial distribution of the rainfall [45,73]. Assessing vulnerability to drought across the Wadi Mina basin is important, considering that, as shown by Henchiri et al. [74], grasslands and croplands in the northern region of the Africa are highly vulnerable to drought risk.
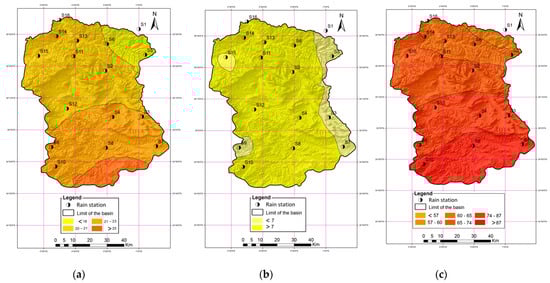
Figure 6.
Return periods of meteorological droughts in Wadi Mina with (a) moderate; (b) severe; and (c) extreme severities.
To mitigate risks of drought, proper water management techniques must be adopted. One of these techniques is supplemental irrigation, which is an efficient practice used for increasing agricultural production under limited water resources in areas affected by drought [75].
5. Conclusions
This study was focused on analyzing temporal and spatial extents of droughts in the Wadi Mina basin, Algeria, using SPI as an indicator of drought severity. The aim of this study was to investigate spatial and temporal dimensions of meteorological droughts in the Wadi Mina basin. Meteorological drought was expressed by the Standardized Precipitation Index (SPI) method and GIS was used to detail temporal and geographical variations in the drought vulnerability based on severity of drought events at annual time steps. This study is applied to rainfall monthly records for the period 1970–2010 at 16 rainfall stations located in the Wadi Mina basin.
The results showed that the SPI was able to detect historical droughts of 1982/83, 1983/84, 1989/90, 1992/93, 1993/94, 1996/97, 1998/99, 1999/00, 2004/05 and 2006/07. Wet years were observed in 1971/72, 1972/73, 1995/96, 2008/09 and 2009/10. Decreasing SPI was observed on 13 of 16 rain gauge stations, with six showing statistically significant (p < 0.05) decreases. Most of the stations with the greatest decreasing trend were observed in the lower part of the Wadi Mina basin, where average precipitation is already low. As expected given the process used to construct SPI, near normal conditions dominated at all stations, and severe and extreme drought categories were uncommon. The spatial variability of the drought showed that extreme drought is more likely (shorter return period) in the north and east.
Severity-Area-Frequency curves that can aid the development of a drought preparedness plan were developed for Wadi Mina basin, so as to ensure sustainable water resource planning within the basin.
One limitation of the study is that we used only SPI to detect drought intensities. In the future, we plan to add evapotranspiration and calculate the SPEI indicator, which can give more complex information about meteorological conditions influencing drought events, particularly for agricultural and forestry applications. Moreover, in this study only annual sum of precipitation was used and thus seasonal variability of drought was not detected. While this is to some extent justified for this region given that precipitation is concentrated in only a few months per year, in a future study monthly and seasonal precipitation variations could also be explored. Moreover, as a future study, we plan to compare drought analyses based on different sources of rainfall data, including the Soil Moisture to Rainfall (SM2RAIN) [76] algorithm to estimate rainfall based on soil moisture time series.
The SM2RAIN is based on the inversion of the hydrological water balance, for estimation of rainfall from soil moisture observations. In this approach the soil is assumed as reservoir used for measuring the amount of rainfall [77]. This method gives independent rainfall product with a different error structure and allows integration with other satellite-based rainfall products. According to [76], the SM2RAIN method can be useful in regions for which satellite rainfall data are affected by higher errors or not available. Because Northwest Algeria is the region where water scarcity is high, we will perform analysis that can show potential use of SM2RAIN as indirect source of rainfall to detect meteorological drought, including seasonal variations.
Author Contributions
Conceptualization, M.A.; methodology, M.A., A.W., H.M. and N.K.; software, M.A. and A.K.T.; formal analysis, M.A., A.W.; validation: M.A., A.W. and N.K.; investigation, M.A., A.K.T., A.W. and H.M.; data curation, M.A.; writing—original draft preparation, M.A., A.W. and N.K.; writing—review and editing, M.A., A.W. and N.K.; visualization, A.W.; supervision, M.A., A.W. and N.K. All authors have read and agreed to the published version of the manuscript.
Funding
This research received no external funding. The APC was funded by MDPI Editor.
Data Availability Statement
The data presented in this study are available on request from the Corresponding authors.
Acknowledgments
Thanks to peer reviewers who improved this manuscript. We also thank the General Directorate of Scientific Research and Technological Development of Algeria (DGRSDT) for their financial support.
Conflicts of Interest
The authors declare no conflict of interest.
Appendix A
Table A1.
Drought classification in the Wadi Mina basin.
Table A1.
Drought classification in the Wadi Mina basin.
| Years | S1 | S2 | S3 | S4 | S5 | S6 | S7 | S8 | S9 | S10 | S11 | S12 | S13 | S14 | S15 | S16 |
|---|---|---|---|---|---|---|---|---|---|---|---|---|---|---|---|---|
| 1970 | NN | NN | NN | NN | NN | NN | NN | MW | MW | NN | MW | NN | NN | NN | NN | NN |
| 1971 | NN | EW | EW | EW | VW | VW | NN | VW | EW | VW | EW | VW | VW | EW | EW | VW |
| 1972 | MW | NN | MW | MW | MW | NN | NN | NN | MW | EW | NN | VW | MW | VW | MW | MW |
| 1973 | NN | NN | NN | NN | NN | NN | NN | NN | NN | NN | NN | NN | MW | VW | MW | VW |
| 1974 | VW | MW | NN | NN | NN | VW | NN | NN | NN | NN | NN | NN | EW | MW | MW | NN |
| 1975 | NN | NN | NN | NN | NN | NN | NN | NN | NN | NN | NN | NN | NN | NN | NN | NN |
| 1976 | VW | VW | MW | NN | NN | NN | NN | NN | NN | MW | NN | NN | NN | NN | NN | NN |
| 1977 | NN | NN | NN | NN | NN | NN | NN | NN | NN | NN | NN | NN | NN | NN | NN | NN |
| 1978 | NN | NN | NN | NN | NN | NN | NN | NN | NN | NN | NN | NN | MW | NN | NN | NN |
| 1979 | NN | NN | NN | NN | VW | NN | MW | NN | NN | NN | NN | NN | NN | NN | MW | NN |
| 1980 | NN | NN | NN | NN | NN | NN | NN | NN | NN | NN | NN | VW | NN | NN | ED | NN |
| 1981 | SD | MD | NN | NN | NN | NN | NN | NN | NN | NN | MD | MD | MD | MD | SD | SD |
| 1982 | NN | MD | MD | MD | MD | NN | MD | MD | SD | MD | NN | MD | NN | NN | NN | NN |
| 1983 | NN | NN | NN | MD | NN | NN | SD | NN | SD | MD | NN | SD | NN | NN | NN | NN |
| 1984 | NN | NN | NN | MD | NN | MD | NN | NN | NN | NN | NN | NN | NN | MD | MD | NN |
| 1985 | VW | NN | NN | NN | NN | NN | NN | MD | NN | NN | NN | NN | NN | MD | NN | MD |
| 1986 | NN | MW | NN | NN | NN | NN | NN | NN | NN | NN | NN | NN | NN | NN | MW | NN |
| 1987 | NN | NN | NN | MD | MD | NN | MD | NN | NN | NN | NN | NN | NN | NN | NN | NN |
| 1988 | NN | NN | NN | NN | MD | NN | NN | NN | NN | NN | NN | NN | NN | NN | NN | NN |
| 1989 | SD | MD | SD | NN | SD | MD | NN | MD | MD | MD | MD | NN | NN | NN | NN | MD |
| 1990 | NN | NN | NN | MD | NN | NN | NN | NN | NN | MW | NN | NN | NN | NN | NN | NN |
| 1991 | NN | NN | NN | NN | NN | NN | NN | NN | NN | NN | NN | NN | NN | NN | NN | NN |
| 1992 | NN | NN | SD | NN | NN | NN | MD | NN | SD | SD | MD | SD | NN | MD | MD | MD |
| 1993 | SD | NN | MD | NN | MD | SD | NN | NN | NN | NN | MD | NN | NN | MD | NN | NN |
| 1994 | NN | NN | NN | NN | NN | NN | NN | MW | NN | NN | NN | NN | NN | NN | NN | NN |
| 1995 | VW | VW | EW | VW | NN | NN | EW | VW | VW | VW | EW | VW | VW | EW | VW | EW |
| 1996 | NN | NN | NN | NN | MD | SD | NN | NN | NN | NN | MD | NN | SD | SD | MD | SD |
| 1997 | MW | NN | NN | NN | NN | NN | NN | NN | MD | MD | NN | NN | NN | NN | NN | NN |
| 1998 | NN | NN | NN | MD | SD | SD | MD | NN | NN | NN | MD | SD | SD | MD | MD | NN |
| 1999 | NN | MD | MD | MD | SD | MD | MD | NN | MD | SD | SD | NN | MD | MD | NN | SD |
| 2000 | NN | NN | NN | NN | NN | NN | NN | NN | NN | NN | NN | NN | NN | NN | MW | NN |
| 2001 | NN | NN | NN | NN | NN | NN | NN | NN | NN | NN | NN | NN | NN | NN | NN | NN |
| 2002 | MD | NN | NN | NN | MW | MW | NN | NN | NN | NN | NN | NN | NN | NN | SD | NN |
| 2003 | NN | NN | NN | NN | NN | MW | MW | VW | NN | NN | NN | NN | NN | NN | NN | NN |
| 2004 | MD | ED | SD | MD | NN | NN | SD | MD | SD | MD | NN | SD | SD | NN | NN | NN |
| 2005 | NN | NN | MW | NN | MW | MW | MW | VW | MW | NN | NN | NN | NN | NN | NN | NN |
| 2006 | MD | MD | NN | MD | NN | NN | NN | NN | NN | NN | MD | NN | MD | NN | MD | NN |
| 2007 | SD | NN | NN | NN | NN | NN | NN | NN | NN | NN | NN | NN | NN | NN | MD | NN |
| 2008 | MW | NN | VW | EW | EW | EW | EW | EW | VW | MW | VW | MW | MW | VW | NN | MW |
| 2009 | NN | NN | NN | MW | NN | NN | VW | EW | VW | VW | NN | VW | VW | NN | NN | NN |
EW—extremely wet, VW—very wet, MW—moderately wet, NN—near normal, MD—moderate drought, SD—severe drought, ED—extreme drought.
Table A2.
Average and maximum annual SPI values during drought years for the meteorological stations considered.
Table A2.
Average and maximum annual SPI values during drought years for the meteorological stations considered.
| Stations | Events | Duration DD (Years) | Intensity DI | Magnitude DM | SPI Values | ||||
|---|---|---|---|---|---|---|---|---|---|
| Average | Maximum | Year | Minimum | Year | |||||
| S1 | 1 | 1 | −0.11 | −0.11 | −0.74 | −1.71 | 1989/90 | −0.07 | 1984/85 |
| 2 | 1 | −0.39 | −0.39 | ||||||
| 3 | 4 | −0.86 | −3.42 | ||||||
| 4 | 8 | −0.80 | −6.42 | ||||||
| 5 | 1 | −0.21 | −0.21 | ||||||
| 6 | 2 | −0.43 | −0.86 | ||||||
| 7 | 6 | −0.93 | −5.58 | ||||||
| S2 | 1 | 1 | −0.39 | −0.39 | −0.79 | −2.56 | 2004/05 | −0.01 | 1985/86 |
| 2 | 5 | −0.74 | −3.71 | ||||||
| 3 | 1 | −0.86 | −0.86 | ||||||
| 4 | 1 | −1.25 | −1.25 | ||||||
| 5 | 4 | −0.29 | −1.14 | ||||||
| 6 | 2 | −0.83 | −1.66 | ||||||
| 7 | 6 | −1.13 | −6.76 | ||||||
| S3 | 1 | 1 | −0.32 | −0.32 | −0.84 | −1.84 | 2004/05 | −0.04 | 1980/81 |
| 2 | 5 | −0.74 | −3.71 | ||||||
| 3 | 7 | −0.89 | −6.24 | ||||||
| 4 | 1 | −0.44 | −0.44 | ||||||
| 5 | 4 | −0.96 | −3.84 | ||||||
| 6 | 1 | −1.84 | −1.84 | ||||||
| 7 | 1 | −0.31 | −0.31 | ||||||
| S4 | 1 | 1 | −0.21 | −0.21 | −0.80 | −1.36 | 1999/00 | −0.02 | 1991/92 |
| 2 | 4 | −1.12 | −4.48 | ||||||
| 3 | 7 | −0.63 | −4.43 | ||||||
| 4 | 1 | −0.67 | −0.67 | ||||||
| 5 | 4 | −0.92 | −3.67 | ||||||
| 6 | 1 | −1.09 | −1.09 | ||||||
| 7 | 2 | −0.71 | −1.42 | ||||||
| S5 | 1 | 1 | −0.94 | −0.94 | −0.86 | −1.88 | 1999/00 | −0.05 | 1997/98 |
| 2 | 13 | −0.76 | −9.84 | ||||||
| 3 | 4 | −1.25 | −4.98 | ||||||
| 4 | 1 | −0.54 | −0.54 | ||||||
| S6 | 1 | 2 | −0.10 | −0.19 | −0.77 | −1.93 | 1989/99 | −0.06 | 1977/78 |
| 2 | 1 | −0.21 | −0.21 | ||||||
| 3 | 7 | −0.74 | −5.16 | ||||||
| 4 | 6 | −0.88 | −5.30 | ||||||
| 5 | 4 | −1.29 | −5.15 | ||||||
| 6 | 1 | −0.17 | −0.17 | ||||||
| S7 | 1 | 3 | −0.62 | −1.87 | −0.97 | −1.98 | 2004/05 | −0.26 | 1977/78 |
| 2 | 7 | −0.85 | −5.97 | ||||||
| 3 | 1 | −0.41 | −0.41 | ||||||
| 4 | 2 | −0.95 | −1.90 | ||||||
| 5 | 1 | −0.59 | −0.59 | ||||||
| 6 | 4 | −0.94 | −3.77 | ||||||
| 7 | 1 | −1.98 | −1.98 | ||||||
| 8 | 1 | −0.52 | −0.52 | ||||||
| S8 | 1 | 2 | −0.31 | −0.62 | −0.62 | −1.33 | 1983/84 | −0.02 | 1978/79 |
| 2 | 16 | −0.73 | −11.67 | ||||||
| 3 | 1 | −0.55 | −0.55 | ||||||
| 4 | 2 | −0.51 | −1.02 | ||||||
| 5 | 2 | −0.20 | −0.40 | ||||||
| 6 | 1 | −1.22 | −1.22 | ||||||
| 7 | 1 | −0.14 | −0.14 | ||||||
| S9 | 1 | 1 | −0.01 | −0.01 | −0.81 | −1.60 | 2004/05 | −0.01 | 1973/74 |
| 2 | 3 | −0.59 | −1.77 | ||||||
| 3 | 3 | −1.19 | −3.56 | ||||||
| 4 | 8 | −0.49 | −3.91 | ||||||
| 5 | 4 | −0.92 | −3.69 | ||||||
| 6 | 1 | −0.27 | −0.27 | ||||||
| 7 | 1 | −1.60 | −1.6 | ||||||
| 8 | 1 | −0.53 | −0.53 | ||||||
| S10 | 1 | 1 | −0.28 | −0.28 | −0.85 | −1.96 | 1992/93 | −0.11 | 1984/85 |
| 2 | 1 | −0.41 | −0.41 | ||||||
| 3 | 3 | −0.91 | −2.74 | ||||||
| 4 | 4 | −0.75 | −2.98 | ||||||
| 5 | 2 | −1.12 | −2.24 | ||||||
| 6 | 4 | −0.91 | −3.65 | ||||||
| 7 | 2 | −0.79 | −1.57 | ||||||
| 8 | 1 | −1.45 | −1.45 | ||||||
| 9 | 2 | −0.81 | −1.61 | ||||||
| S11 | 1 | 1 | −0.07 | −0.07 | −0.85 | −1.67 | 1999/00 | −0.07 | 1977/78 |
| 2 | 2 | −0.90 | −1.80 | ||||||
| 3 | 2 | −0.66 | −1.32 | ||||||
| 4 | 3 | −0.81 | −2.42 | ||||||
| 5 | 3 | −1.00 | −2.99 | ||||||
| 6 | 1 | −1.29 | −1.29 | ||||||
| 7 | 2 | −1.37 | −2.73 | ||||||
| 8 | 3 | −0.49 | −1.47 | ||||||
| 9 | 1 | −0.19 | −0.19 | ||||||
| S12 | 1 | 1 | −0.37 | −0.37 | −0.8 | −1.70 | 1983/84 | −0.10 | 1978/79 |
| 2 | 1 | −0.10 | −0.10 | ||||||
| 3 | 5 | −0.93 | −4.65 | ||||||
| 4 | 1 | −0.76 | −0.76 | ||||||
| 5 | 1 | −0.34 | −0.34 | ||||||
| 6 | 3 | −0.91 | −2.73 | ||||||
| 7 | 1 | −0.90 | −0.90 | ||||||
| 8 | 5 | −0.75 | −3.76 | ||||||
| 9 | 1 | −1.50 | −1.50 | ||||||
| 10 | 1 | −0.98 | −0.98 | ||||||
| S13 | 1 | 1 | −1.25 | −1.25 | −0.77 | −1.77 | 1998/99 | −0.04 | 1991/92 |
| 2 | 3 | −0.49 | −1.48 | ||||||
| 3 | 2 | −0.69 | −1.38 | ||||||
| 4 | 3 | −0.57 | −1.70 | ||||||
| 5 | 12 | −0.87 | −10.42 | ||||||
| S14 | 1 | 1 | −0.17 | −0.17 | −0.68 | −2.02 | 1996/97 | −0.02 | 1980/81 |
| 2 | 3 | −0.61 | −1.83 | ||||||
| 3 | 2 | −1.07 | −2.13 | ||||||
| 4 | 3 | −0.54 | −1.62 | ||||||
| 5 | 3 | −0.81 | −2.42 | ||||||
| 6 | 5 | −0.56 | −2.79 | ||||||
| 7 | 4 | −0.31 | −1.22 | ||||||
| 8 | 2 | −0.42 | −0.83 | ||||||
| S15 | 1 | 2 | −0.32 | −0.64 | −0.81 | −2.03 | 1980/81 | −0.17 | 2005/06 |
| 2 | 3 | −1.29 | −3.86 | ||||||
| 3 | 1 | −1.14 | −1.14 | ||||||
| 4 | 1 | −0.71 | −0.71 | ||||||
| 5 | 2 | −0.39 | −0.78 | ||||||
| 6 | 2 | −1.03 | −2.05 | ||||||
| 7 | 1 | −1.25 | −1.25 | ||||||
| 8 | 2 | −0.68 | −1.35 | ||||||
| 9 | 7 | −0.76 | −5.32 | ||||||
| S16 | 1 | 1 | −1.88 | −1.88 | −0.76 | −1.88 | 1981/82 | −0.01 | 2005/06 |
| 2 | 7 | −0.63 | −4.43 | ||||||
| 3 | 4 | −0.70 | −2.80 | ||||||
| 4 | 1 | −1.73 | −1.73 | ||||||
| 5 | 2 | −1.11 | −2.21 | ||||||
| 6 | 2 | −0.54 | −1.07 | ||||||
| 7 | 4 | −0.47 | −1.87 | ||||||
References
- Rossi, G. Drought mitigation measures: A comprehensive frame work. In Drought and Drought Migation in Europe; Voght, J.V., Somma, F., Eds.; Kluwer: Dordrecht, The Netherlands, 2000. [Google Scholar]
- Mishra, A.K.; Singh, V.P. A review of drought concepts. J. Hydrol. 2010, 391, 202–216. [Google Scholar] [CrossRef]
- Achite, M.; Buttafuoco, G.; Toubal, K.A.; Lucà, F. Precipitation spatial variability and dry areas temporal stability for different elevation classes in the Macta basin (Algeria). Environ. Earth Sci. 2017, 76, 458. [Google Scholar] [CrossRef]
- Hossard, L.; Fadlaoui, A.; Ricote, E.; Belhouchette, H. Assessing the resilience of farming systems on the Saïs plain, Morocco. Reg. Environ. Chang. 2021, 21, 36. [Google Scholar] [CrossRef]
- Lionello, P.; Bhend, J.; Buzzi, A.; Della-Marta, P.M.; Krichak, S.O.; Jansa, A.; Maheras, P.; Sanna, A.; Trigo, I.F.; Trigo, R. Cyclones in the Mediterranean region: Climatology and effects on the environment. In Mediterranean Climate Variability Developments in Earth and Environmental Sciences; Lionello, P., Malanotte-Rizzoli, P., Boscolo, R., Eds.; Elsevier: Amsterdam, The Netherlands, 2006; Volume 4, pp. 325–372. [Google Scholar] [CrossRef]
- Norrant, C.; Douguedroit, A. Tendances recentes des precipitations et des pressions de surface dans le Bassin mediterraneen. Ann. Geogr. 2003, 631, 298–305. [Google Scholar] [CrossRef]
- Buttafuoco, G.; Caloiero, T.; Coscarelli, R. Spatial and temporal patterns of the mean annual precipitation at decadal time scale in southern Italy (Calabria region). Appl. Clim. 2011, 105, 431–444. [Google Scholar] [CrossRef]
- Rossi, G. Drought Mitigation Measures: A Comprehensive Framework, in: Advances in Natural and Technological Hazards Research. Adv. Nat. Technol. Hazards Res. 2000, 14, 233–246. [Google Scholar] [CrossRef]
- Ghouil, H.; Sancho-Knapik, D.; Ben Mna, A.; Amimi, N.; Ammari, Y.; Escribano, R.; Alonso-Forn, D.; Ferrio, J.P.; Peguero-Pina, J.J.; Gil-Pelegrín, E. Southeastern Rear Edge Populations of Quercus suber L. Showed Two Alternative Strategies to Cope with Water Stress. Forests 2020, 11, 1344. [Google Scholar] [CrossRef]
- Akbas, A.; Freer, J.; Ozdemir, H.; Bates, P.D.; Turp, M.T. What about reservoirs? Questioning anthropogenic and climatic interferences on water availability. Hydrol. Process. 2020, 34, 5441–5455. [Google Scholar] [CrossRef]
- Lyon, B. The strength of El Niño and the spatial extent of tropical drought. Geophys. Res. Lett. 2004, 31, 21204. [Google Scholar] [CrossRef]
- Palmer, W.C. Keeping track of crop moisture conditions, nationwide: The Crop Moisture Index. Weatherwise 1968, 21, 156–161. [Google Scholar] [CrossRef]
- Tsakiris, G.; Vangelis, H. Establishing a drought index incorporating evapotranspiration. Eur. Water 2005, 9/10, 3–11. [Google Scholar]
- Byun, H.R.; Wilhite, D.A. Daily quantification of drought severity and duration. J. Clim. 1996, 5, 1181–1201. [Google Scholar]
- Bokwa, A.; Klimek, M.; Krzaklewski, P.; Kukułka, W. Drought Trends in the Polish Carpathian Mts. in the Years 1991–2020. Atmosphere 2021, 12, 1259. [Google Scholar] [CrossRef]
- Strommen, N.D.; Motha, R.P. An operational early warning agricultural weather system. In Planning for Drought: Toward a Reduction of Societal Vulnerability; Wilhite, D.A., Easterling, W.E., Wood, D.A., Eds.; Westview Press: Boulder, CO, USA, 1987. [Google Scholar]
- Alley, W.M. The Palmer Drought Severity Index: Limitations and assumptions. J. Appl. Meteorol. 1984, 23, 1100–1109. [Google Scholar] [CrossRef]
- McKee, T.; Doesken Kleist, J. The relationship of drought frequency and duration to time scales. In Proceedings of the Eighth Conference on Applied Climatology, Anaheim, CA, USA, 17–22 January 1993; American Meteorological Society: Boston, MA, USA, 1993; pp. 179–184. [Google Scholar]
- Bordi, I.; Fraedrich, K.; Jiang, J.-M.; Sutera, A. Spatio-temporal variability of dry and wet periods in eastern China. Theor. Appl. Climatol. 2004, 79, 81–91. [Google Scholar] [CrossRef]
- Lloyd-Hughes, B.; Saunders, M.A. A drought climatology for Europe. Int. J. Climatol. 2002, 22, 1571–1592. [Google Scholar] [CrossRef]
- Hayes, M.J.; Svoboda, M.D.; Wilhite, D.A.; Vanyarkho, O.V. Monitoring the 1996 drought using the Standardized Precipitation Index. Bull. Am. Meteorol. Soc. 1999, 80, 429–438. [Google Scholar] [CrossRef]
- Umran Komuscu, A. “Using the SPI to Analyze Spatial and Temporal Patterns of Drought in Turkey” Drought Network News (1994–2001). 1999. Available online: https://digitalcommons.unl.edu/droughtnetnews/49 (accessed on 2 November 2021).
- Kemal Sonmez, K.; Umran Komuscu, A.; Erkan, A.; Turgu, E. An Analysis of Spatial and Temporal Dimension of Drought Vulnerability in Turkey Using the Standardized Precipitation Index. Nat. Hazards 2005, 35, 243–264. [Google Scholar] [CrossRef]
- Lana, X.; Serra, C.; Burgueno, A. Patterns of monthly rainfall shortage and execess In terms of standardized precipitation index for Catalonia (NE Spain). Int. J. Climatol. 2001, 21, 1669–1691. [Google Scholar] [CrossRef]
- Vicente-Serrano, S.M.; González-Hidalgo, J.C.; de Luis, M.; Raventós, J. Drought patterns in the Mediterranean area: The Valencia region (eastern Spain). Clim. Res. 2004, 26, 5–15. [Google Scholar] [CrossRef]
- Bonaccorso, B.; Cancelliere, A.; Rossi, G.; Sutera, A. Spatial Variability of Drought: An Analysis of the SPI in Sicily. Water Resour. Manag. 2003, 17, 273–296. [Google Scholar] [CrossRef]
- Piccarreta, M.; Capolongo, D.; Boenzi, F. Trend analysis of precipitation and drought in Basilicata from 1923 to 2000 within a Southern Italy context. Int. J. Climatol. 2004, 24, 907–922. [Google Scholar] [CrossRef]
- Capra, A.; Consoli, S.; Scicolone, B.; Calafiore, G. Precipitation and drought variability in the last century in Calabria (Italy). In Proceedings of the XXXIII CIOSTA-CIGR V Conference Technology and Management to Ensure Sustainable Agriculture, Agro-Systems, Forestry and Safety, Reggio Calabria, Italy, 17–19 June 2009; pp. 1655–1659. [Google Scholar]
- Vergni, L.; Todisco, F. Spatio-temporal variability of precipitation, temperature and agricultural drought indices in central Italy. Agric. Meteorol. 2010, 151, 301–313. [Google Scholar] [CrossRef]
- Buttafuoco, G.; Caloiero, T.; Coscarelli, R. Analyses of Drought Events in Calabria (Southern Italy) Using Standardized Precipitation Index. Water Resour. Manag. 2015, 29, 557–573. [Google Scholar] [CrossRef]
- Raziei, T.; Saghafian, B.; Paulo, A.A.; Pereira, L.S.; Bordi, I. Spatial Patterns and Temporal Variability of Drought in Western Iran. Water Resour. Manag. 2009, 23, 439. [Google Scholar] [CrossRef]
- Moradi, H.R.; Rajabi, M.; Faragzadeh, M. Investigation of meteorological drought characteristics in Fars province, Iran. Catena 2011, 84, 35–46. [Google Scholar] [CrossRef]
- Nafarzadegana, A.R.; Zadeha, M.R.; Kherada, M.; Ahania, H.; Gharehkhania, A.; Karampoora, M.A.; Kousari, M.R. Drought area monitoring during the past three decades in Fars Province, Iran. Quat. Int. 2012, 250, 27–36. [Google Scholar] [CrossRef]
- Livada, I.; Assimakopoulos, V.D. Spatial and temporal analysis of drought in greece using the standardized precipitation index (SPI). Theor. Appl. Climatol. 2007, 89, 143–153. [Google Scholar] [CrossRef]
- Nalbantis, I.; Tsakiris, G. Assessment of Hydrological Drought Revisited. Water Resour. Manag. 2009, 23, 881–897. [Google Scholar] [CrossRef]
- Karavitis, C.A.; Alexandris, S.; Tsesmelis, D.E.; Athanasopoulos, G. Application of the Standardized Precipitation Index (SPI) in Greece. Water 2013, 3, 787–805. [Google Scholar] [CrossRef]
- AL-Timimi, Y.K.; Loay, G.E.; AL-Jiboori Monim, H. Drought Risk Assessment In Iraq Using Remote Sensing And GIS Techniques. Iraqi. J. Sci. 2012, 53, 1078–1082. [Google Scholar]
- Awchi, T.A.; Kalyana, M.M. Meteorological drought analysis in northern Iraq using SPI and GIS. Sustain. Water Resour. Manag. 2017, 3, 451–463. [Google Scholar] [CrossRef]
- Jasim Ansam, I.; Awchi Taymoor, A. Regional meteorological drought assessment in Iraq. Arab. J. Geosci. 2020, 13, 284. [Google Scholar] [CrossRef]
- Shadeed, S. Spatio-temporal Drought Analysis in Arid and Semi-arid Regions: A Case Study from Palestine. Arab. J. Sci Eng. 2013, 38, 2303–2313. [Google Scholar] [CrossRef]
- Djellouli, F.; Abderrazak, B.; Baba-Hamed, K. Efficiency of some meteorological drought indices in different time scales, case study: Wadi Louza basin (NW-Algeria). J. Water Land Dev. 2016, 31, 33–41. [Google Scholar] [CrossRef][Green Version]
- Khezazna, A.; Amarchi, H.; Derdous, O.; Bousakhria, F. Drought monitoring in the Seybouse basin (Algeria) over the last decades. J. Water Land Dev. 2017, 33, 79–88. [Google Scholar] [CrossRef]
- Brahim, H.; Meddi, M.; Torfs, P.J.J.F.; Remaoun, M.; Van Lanen, H.A.J. Characterisation and prediction of meteorological drought using stochastic models in the semi-arid Chéli–Zahrez basin (Algeria). J. Hydrol. Reg. Stud. 2018, 16, 15–31. [Google Scholar] [CrossRef]
- Fellag, M.; Achite, M.; Wałęga, A. Spatial-temporal characterization of meteorological drought using the Standardized precipitation index. Case study in Algeria. Acta Sci. Polonorum. Form. Circumiectus 2021, 20, 19–31. [Google Scholar]
- Achite, M.; Krakauer, N.Y.; Wałęga, A.; Caloiero, T. Spatial and Temporal Analysis of Dry and Wet Spells in the Wadi Cheliff Basin, Algeria. Atmosphere 2021, 12, 798. [Google Scholar] [CrossRef]
- Ouatiki, H.; Boudhar, A.; Ouhinou, A.; Arioua, A.; Hssaisoune, M.; Bouamri, H.; Benabdelouahab, T. Trend analysis of rainfall and drought over the Oum Er-Rbia River Basin in Morocco during 1970–2010. Arab. J. Geosci. 2019, 12, 128. [Google Scholar] [CrossRef]
- Jemai, S.; Ellouze, M.; Agoubi, B.; Abida, H. Drought intensity and spatial variability in Gabes Watershed, south-eastern Tunisia. J. Water Land Dev. 2016, 31, 63–72. [Google Scholar] [CrossRef]
- Jemai, H.; Ellouze, M.; Abida, H.; Laignel, B. Spatial and temporal variability of rainfall: Case of Bizerte-Ichkeul Basin (Northern Tunisia). Arab. J. Geosci. 2018, 11, 177. [Google Scholar] [CrossRef]
- Ben Abdelmalek Nouiri, I. Study of trends and mapping of drought events in Tunisia and their impacts on agricultural production. Sci. Total Environ. 2020, 734, 139311. [Google Scholar] [CrossRef]
- Rapport d’Information Déposé en Application de L’article 145 du Règlement par la Commission des Affaires Étrangères de France en Conclusion des Travaux D’une Mission d’Information Constituée le 5 Octobre 2010 sur La Géopolitique de L’eau. 2011. Available online: https://www.assemblee-nationale.fr/dyn/15/rapports/cion_afetr/l15b3581_rapport-information (accessed on 30 September 2021).
- Hamiche, A.; Stambouli, A.; Flazi, S. A review on the water and energy sectors in Algeria: Current forecasts, scenario and sustainability issues’. Renew. Sustain. Energy Rev. 2016, 41, 261–276. [Google Scholar] [CrossRef]
- Mensah, C.; Šigut, L.; Fischer, M.; Foltýnová, L.; Jocher, G.; Acosta, M.; Kowalska, N.; Kokrda, L.; Pavelka, M.; Marshall, J.D.; et al. Assessing the Contrasting Effects of the Exceptional 2015 Drought on the Carbon Dynamics in Two Norway Spruce Forest Ecosystems. Atmosphere 2021, 12, 988. [Google Scholar] [CrossRef]
- Achite, M. Sécheresse et Gestion des Ressources en Eau Dans le Bassin Versant de la Mina. Algérie. 2ème Colloque International Sur L’eau et L’Environnement. 30 et 31 Janvier 2007. Sidi Fredj. Alger (Algérie). Available online: https://www.worldwatercouncil.org/ (accessed on 5 September 2021).
- Ng, C.K.; Ng, J.L.; Huang, Y.F.; Tan, Y.X.; Mirzaei, M. Tropical rainfall trend and stationarity analysis. Water Supply 2020, 20, 2471–2483. [Google Scholar] [CrossRef]
- Santos, J.F.; Portela, M.M.; Pulido-Calvo, I. Regional frequency analysis of droughts in Portugal. Water Resour. Manag. 2011, 25, 3537–3558. [Google Scholar] [CrossRef]
- Thom, H.C.S. A note on the gamma distribution. Mon. Weather Rev. 1958, 86, 117–122. [Google Scholar] [CrossRef]
- Edwards, D.C.; McKee, T.B. Characteristics of 20th century drought in the United States at multiple scales. Atmos. Sci. Pap. 1997, 634, 1–30. [Google Scholar]
- Abramowitz, M. Stegun, I.A. Handbook of Mathematical Functions; Dover Publications: New York, NY, USA, 1965. [Google Scholar]
- Młyński, D.; Wałęga, A.; Petroselli, A.; Tauro, F.; Cebulska, M. Estimating Maximum Daily Precipitation in the Upper Vistula Basin, Poland. Atmosphere 2019, 10, 43. [Google Scholar] [CrossRef]
- Sen, P.K. Estimates of the regression coefficient based on Kendall’s tau. J. Am. Stat. Assoc. 1968, 63, 1379–1389. [Google Scholar] [CrossRef]
- Vicente-Serrano, S.M. Differences in spatial patterns of drought on different time scales: An analysis of the Iberian Peninsula. Water Resour. Manag. 2006, 20, 37–60. [Google Scholar] [CrossRef]
- Elouissi, A.; Sen, Z.; Habi, M. Algerian rainfall innovative trend analysis and its implications to Macta watershed. Arab. J. Geosci. 2016, 9, 1–12. [Google Scholar] [CrossRef]
- Caloiero, T.; Caloiero, P.; Frustaci, F. Long-term precipitation trend analysis in Europe and in the Mediterranean basin. Water Environ. J. 2018, 32, 433–445. [Google Scholar] [CrossRef]
- Lee, J.; Kim, S.; Jun, H. A Study of the Influence of the Spatial Distribution of Rain Gauge Networks on Areal Average Rainfall Calculation. Water 2018, 10, 1635. [Google Scholar] [CrossRef]
- Hingray, B.; Picouet, C.; Muy, A. Hydrology. In A Science for Engineers; CRC Press: Boca Raton, FL, USA, 2014. [Google Scholar]
- Vicente-Serrano, S.M.; López-Moreno, J.I.; Lorenzo-Lacruz, J.; Kenawy, A.; Azorin-Molina, C.; Morán-Tejeda, E.; Pasho, E.; Zabalza, J.; Beguería, S.; Angulo-Martínez, M. The NAO Impact on Droughts in the Mediterranean Region. In Advances in Global Change Research; Springer Science and Business Media LLC: Berlin, Germany, 2011; pp. 23–40. [Google Scholar]
- Hoerling, M.P.; Eischeid, J.K.; Perlwitz, J.; Quan, X.; Zhang, T.; Pegion, P.J. On the Increased Frequency of Mediterranean Drought. J. Clim. 2012, 25, 2146–2161. [Google Scholar] [CrossRef]
- Meddi, H.; Meddi, M.; Assani, A.A. Study of Drought in Seven Algerian Plains. Arab. J. Sci. Eng. 2013, 39, 339–359. [Google Scholar] [CrossRef]
- Giannini, A.; Saravanan, R.; Chang, P. Oceanic Forcing of Sahel Rainfall on Interannual to Interdecadal Time Scales. Science 2003, 302, 1027–1030. [Google Scholar] [CrossRef]
- Mishra, A.K.; Desa, V.R. Spatial and temporal drought analysis in the Kansabati river basin. India. Intl. J. River Basin Manag. 2005, 3, 31–41. [Google Scholar] [CrossRef]
- Cai, W.; Zhang, Y.; Yao, Y.; Chen, Q. Probabilistic Analysis of Drought Spatiotemporal Characteristics in the Beijing-Tianjin-Hebei Metropolitan Area in China. Atmosphere 2015, 6, 431–450. [Google Scholar] [CrossRef]
- Alemaw Berhanu, F.; Kileshye-Onema, J.M.; Love, D. Regional Drought Severity Assessment at a Basin Scale in the Limpopo Drainage System. J. Water Resour. Prot. 2013, 5, 1110–1116. [Google Scholar] [CrossRef]
- Meddi, H.; Meddi, M. Variabilité spatiale et temporelle des précipitations du Nord-Ouest de l’Algérie. Géogr. Tech. 2007, 2, 49–55. [Google Scholar]
- Henchiri, M.; Liu, Q.; Essifi, B.; Javed, T.; Zhang, S.; Bai, Y.; Zhang, J. Spatio-Temporal Patterns of Drought and Impact on Vegetation in North and West Africa Based on Multi-Satellite Data. Remote Sens. 2020, 12, 3869. [Google Scholar] [CrossRef]
- Attia, A.; El-Hendawy, S.; Al-Suhaibani, N.; Alotaibi, M.; Tahir, M.U.; Kamal, K.Y. Evaluating deficit irrigation scheduling strategies to improve yield and water productivity of maize in arid environment using simulation. Agric. Water Manag. 2021, 249, 106812. [Google Scholar] [CrossRef]
- Brocca, L.; Ciabatta, L.; Massari, C.; Moramarco, T.; Hahn, S.; Hasenauer, S.; Kidd, R.; Dorigo, W.; Wagner, W.; Levizzani, V. Soil as a natural rain gauge: Estimating global rainfall from satellite soil moisture data. J. Geophys. Res. Atmos. 2014, 119, 5128–5141. [Google Scholar] [CrossRef]
- Brocca, L.; Melone, F.; Moramarco, T.; Wagner, W. A new method for rainfall estimation through soil moisture observations. Geophys. Res. Lett. 2013, 40, 853–858. [Google Scholar] [CrossRef]


Publisher’s Note: MDPI stays neutral with regard to jurisdictional claims in published maps and institutional affiliations. |
© 2021 by the authors. Licensee MDPI, Basel, Switzerland. This article is an open access article distributed under the terms and conditions of the Creative Commons Attribution (CC BY) license (https://creativecommons.org/licenses/by/4.0/).