Article

Abiotic Aggregation of Organic Matter in Coastal and Estuarine Waters: Cases in the Eastern Long Island Sound, USA

1
Institute of Marine Environment and Ecology, National Taiwan Ocean University, Keelung 202, Taiwan
2
Center of Excellence for the Oceans, National Taiwan Ocean University, Keelung 202, Taiwan
3
Department of Marine Sciences, University of Connecticut, Groton, CT 06340, USA
*
Author to whom correspondence should be addressed.
Water 2021, 13(21), 3077; https://doi.org/10.3390/w13213077
Submission received: 28 September 2021 / Revised: 27 October 2021 / Accepted: 1 November 2021 / Published: 2 November 2021
(This article belongs to the Special Issue Marine Environmental Research)

Abstract

:
Organic aggregates, which formed from small particles and dissolved material, were chemically characterized in the Long Island Sound coastal waters. In this study, six aggregation experiments were conducted on low-salinity samples (the Thames River, CT, USA; salinity of 6.3–6.8) and high-salinity samples (the coast of Avery Point, CT, USA; salinity of 21.4–26.7). Water samples were incubated on a roller table for two days under dark conditions to generate laboratory-made aggregates. Particulate organic carbon (POC) concentrations increased 5–39% after two days of rolling. A higher POC increase occurred in low-salinity samples. The concentrations of neutral aldoses and amino acids, as well as their C- and N-yields, decreased during the experiments (except for particulate hydrolysable amino acid in low-salinity samples), while bacterial abundance increased 50–476%, indicating microbial degradation of biologically labile organic matter. Particulate hydrolysable amino acid was preferentially preserved in P-limited systems. An enrichment factor analysis showed the preferential microbial degradation of particulate hydrolysable neutral aldose and glucose appeared as the most labile aldose. The increase in bulk POC and the decrease in the fraction of labile organic carbon (neutral aldose and amino acid) in the particulate phase resulted in an accumulation of uncharacterized (presumably more refractory) particulate organic matter.

1. Introduction

Particulate organic matter (POM) is essential to marine and estuarine ecosystems. Floating POM (mostly living microorganisms) forms the bases of the food webs and could be transported to higher trophic levels. On the other hand, sinking POM fuels benthic ecosystems. In the marine environment, the particulate organic carbon (POC) pool is at least an order less than the dissolved organic carbon (DOC) pool [1]. In spite of the relatively small reservoir of marine POC, the transport of sinking POM to the deep ocean is generally assumed to balance new production in marine organic carbon cycling [2]. The intensive algal blooms occurring mainly in upwelling and coastal areas have been shown to induce high POC fluxes, and therefore large e-ratios (export to total primary production), because of the formation of large amounts of algal biomass/aggregates [3,4]. In addition, abiotic aggregation of DOC may contribute a significant amount of POC flux in aquatic systems and can account for as much as 25% of primary production [5]. Abiotic aggregation provides an important link between the relatively small pool of POC and the very large pool of DOC.
Aggregation occurs when particles collide and stick together. There are a number of mechanisms that can form larger particles from the dissolved and small-sized particle pools [6,7]. These processes are responsible for altering the size spectrum, shape, and abundance of suspended particles in the ocean [8]. Kepkay [6] summarized seven collision mechanisms for particle aggregation. Which of these mechanisms is the most important varies in time and space within the ocean. Shear and surface coagulation are the dominant mechanisms in the upper ocean, whereas differential sedimentation, diffusive capture, and filtration are more important in the ocean interior. Brownian motion and bacterial motility are two relatively slow aggregation mechanisms that are ubiquitous in the ocean. In this study, we focused on the aggregation induced by differential sedimentation and shear gradient.
In studying aggregation, various experimental designs have been used that employ different dominant aggregation mechanisms. Rolling tables [9], Couette flocculators [10], and bubbling devices [11] have all been used for aggregation experiments; a roller table provides a combination of shear and differential sedimentation, a Couette flocculator provides a quantifiable shear gradient, and a bubbling device can generate aggregates by surface coagulation. Aggregation studies carried out in marine systems can be divided into two groups: characterization of size, abundance, and chemical/microbial composition of existing aggregates [8,12], and mathematical modeling based on particle size distributions [13,14]. The first study of laboratory-made organic aggregates was published by Shanks and Edmonson [9]. They generated aggregates from unfiltered seawater using a roller table and examined the abundance and dimensions of aggregates and the microbial characteristics of field and laboratory-made aggregates. Since Shanks and Edmonson’s study, many aggregate studies using roller tables have been focused on biological aspects, such as microorganism abundance [15,16] and bacterial colonization [17]. In contrast, there are few studies that are concerned with the effect of the aggregate formation process on the chemical characteristics of the dissolved and particulate phases [18,19]. Furthermore, the role of the aggregation process on the POC flux attracts increasing attention in this changing world [20].
In this study, a roller table was used for the formation of aggregates from the dissolved and the particulate phase. The trace-organic clean glass containers that were employed allowed for detailed, compound-specific determinations of concentrations of the biologically labile diagenetic indicators, such as neutral aldoses and amino acids, in both dissolved and particulate phases. This is the first aggregation study where compound-specific determinations of both amino acids and neutral aldoses have been carried out in both the dissolved and the particulate phase. The main goals of the experiments were: to determine the effect of aggregation and concomitant bacterial degradation on concentrations of labile material in the dissolved and particulate phase, to quantify the aggregation effect on POC flux, and to determine whether there is a difference between low- and high-salinity samples in the relative fraction of organic matter (OM) and labile material that is transferred from the dissolved to the particulate phase during aggregation.

2. Materials and Methods

2.1. Study Sites and Field Sampling

Long Island Sound (LIS) is a major coastal estuary in the northeastern United States and there are more than 20 million people living around the LIS. Due to its large population, LIS receives a large amount of waste inputs, including nutrients, OM, and pollutants. The large OM flux induces hypoxia in western and central LIS during summer seasons [21]. The Thames River is a short river about 25 kilometers in length with a strong tidal effect, which flows into LIS in eastern Connecticut.
Water samples were collected in the late spring and the summer of 2003 at two sites in the eastern LIS (Figure 1): (1) the coast of Avery Point (28 May, 2 June, and 10 June; referred to as high-salinity samples and denoted HS1, HS2, and HS3, respectively); (2) the Thames River estuary (26 JulyA, 26 JulyB, and 14 August; referred to as low-salinity samples and denoted LS1, LS2, and LS3, respectively). In situ temperatures and salinities were determined using a portable conductivity, salinity, and temperature system (YSI, Yellow Springs, OH, USA). Water samples were collected using acid-washed 5 L Niskin bottles (General Oceanics, Miami, FL, USA) and were kept sheltered and cool for transport to the laboratory. Field samples were collected for the determination of concentrations of POC, particulate organic nitrogen (PON), DOC, total dissolved nitrogen (TDN), dissolved hydrolysable amino acids (DHAA), dissolved hydrolysable neutral aldoses (DHNA), particulate hydrolysable amino acids (PHAA), particulate hydrolysable neutral aldoses (PHNA), nutrients (nitrate, nitrite, and phosphate), and bacterial abundance (see Section 2.3 for details).

2.2. Roller Table Experiments

The roller table used in this study was modified from Shanks and Edmonson [9]. The roller table consisted of five parallel plastic bars connected to a variable speed motor, providing a speed of up to 30 revolutions per minute (rpm) and holding a capacity of 20 glass bottles (125 mL). Six roller-table experiments (three high-salinity Avery Point samples and three low-salinity Thames River samples) were conducted. Before rotation, water samples were filtered through 200 μm mesh nets to remove large particles and grazers and then placed in 125 mL muffled glass bottles. The glass bottles were rotated at a speed of 8 rpm at 15 °C in the dark (to eliminate photosynthesis) for two days. Roller-table samples were collected for determination of concentrations of POC, PON, DOC, TDN, DHAA, DHNA, PHAA, PHNA, nitrate, nitrite, phosphate, and bacterial abundance (same as the field samples).

2.3. Chemical and Biological Determinations

Particulate matter was defined as the material retained on a GF/F filter (i.e., particles larger than the nominal diameter of 0.7 μm; Whatman, Chicago, IL, USA), whereas the filtrate was defined as dissolved material. For particulate samples, 100–150 mL of water was filtered through each GF/F filter and the filters were stored at −20 °C until analysis. For dissolved samples, GF/F filtrate was collected in 22 mL muffled glass vials and kept at −20 °C until analysis. All analyses were carried out in 2–3 replicates.
POC and PON samples were acidified with 10% HCl and concentrations were determined using a Carlo Erba CHN elemental analyzer (Waltham, MA, USA). The determinations were standardized using a calibration curve of acetanilide (C8H9NO; r2 > 0.999). DOC and TDN concentrations were determined by the high temperature catalytic oxidation (HTCO) method on a Shimadzu TOC-V analyzer (Kyoto, Japan) equipped with a pyrochemoluminescence detector and an automatic sample injection system [22]. DOC and TDN were calibrated using potassium hydrogen phthalate (C6H4⋅COOK⋅COOH; r2 > 0.999) and potassium nitrate (KNO3; r2 > 0.998), respectively.
Hydrolysable amino acids, including DHAA and PHAA, were hydrolyzed using concentrated HCl and concentrations were determined by high-pressure liquid chromatography (HPLC; Agilent/HP, Santa Clara, CA, USA) using a C-18 column and a methanol/acetonitrile mobile phase with fluorescence detection after O-phthaldialdehyde derivatization [23]. A mixed standard from Pierce (Waltham, MA, USA) and 3 additional amino acids (0.05–10 μM; averaged r2 = 0.998) were applied.
Hydrolysable neutral aldoses, including DHNA and PHNA, were hydrolyzed using concentrated H2SO4 and determined by high-performance anion-exchange chromatography with pulsed amperometric detection (HPAE-PAD; Dionex, Sunnyvale, CA, USA), according to Skoog and Benner [24]. A standard mixture of all determined neutral aldoses (0.05–10 μM each; averaged r2 = 0.996) was applied.
Nutrient (including nitrate, nitrite, and phosphate) concentrations were determined for the dissolved fractions only. Nitrate was reduced to nitrite with cadmium-copper filings and concentrations were determined by the diazo-pink method [25]. Artificial seawater (ASW), prepared using Milli-Q water, NaCl, MgSO4, and NaHCO3 to a salinity of 30, was used as a blank. Nitrite concentrations were determined in the same way as the nitrate concentration but excluding the reduction process. Phosphate concentrations were determined by the molybdenum-blue method [25]. ASW, as described above, was used as a blank. All nutrient determinations were carried out on a SmartChem auto sampler (Westco, Milford, MA, USA) using nitrate (0–40 μM, r2 > 0.998) and phosphate (0–5 μM, r2 > 0.999) standard solutions.
Samples for bacterial abundance were fixed with buffered formaldehyde (final conc. 2%) and collected on 0.2 µm pore-size polycarbonate filters that had been pre-stained with Irgalan Black solution. Bacterial abundance was then determined by the acridine orange direct count (AODC) method [26] using an epifluorescence microscopy. The cellular carbon content of 20 fg C cell1 was used for heterotrophic bacteria [27]. All bacterial counts were carried out in triplicate.

2.4. Data Analysis

JMP 15 software (SAS Institute, Cary, NC, USA) was used for statistical analysis. A t-test was performed in parameters between the field and the treatment in each experiment. Analysis of Variance (ANOVA) was used to compare the aggregation effect on POC, PHNA, and PHAA. Unless otherwise indicated, variation around each mean is presented as ± one standard deviation.

3. Results

3.1. Environmental Conditions

The Thames River and Avery Point samples had salinities in the range of 6.3 to 6.8 (low-salinity samples) and 21.4 to 26.7 (high-salinity samples), respectively (Table 1). Phosphate concentrations were similar in low-salinity (0.53 to 0.88 μM) and high-salinity samples (0.58 to 0.97 μM; Table 1). However, dissolved inorganic nitrogen (DIN; nitrate + nitrite) concentrations were higher in low-salinity samples (17.1 to 27.0 μM) than those in high-salinity samples (0.88 to 1.90 μM), resulting in higher inorganic N/P ratios of 19 to 51 in low-salinity samples than those of 1.5 to 3.2 in high-salinity samples (Table 1). The N/P ratio indicated that the Thames River low-salinity waters were phosphorous-limited, whereas the Avery Point high-salinity waters were nitrogen-limited.

3.2. Concentrations of Bulk Organic Matter (OM) and Bacterial Abundance

Field (Samples before Rolling)—DOC concentrations in low-salinity samples (310 to 425 μM) were about two times higher than those in high-salinity samples (141 to 171 μM; Table 1). The low-salinity samples also had higher POC and PON concentrations. POC concentrations in low-salinity samples (77.5 to 98.3 μM) were about three times higher than those in high-salinity samples (24.1 to 29.9 μM; Table 1). Similar to the POC concentration, PON concentrations in low-salinity samples (10.7 to 14.8 μM) were also about three times higher than those in high-salinity samples (3.6 to 5.0 μM; Table 1). The POC and PON concentration led to a particulate C/N ratio similar to the Redfield ratio of 6.6 in both low-salinity samples (6.7 to 7.3) and high-salinity samples (6.0 to 6.7; Table 1), indicating that phytoplankton-derived material could be the major component of POM at both sites. Despite higher OM concentrations in low-salinity samples, bacterial abundances were on the same order of magnitude at the two study sites (9.6 to 14.1 and 7.5 to 14.6 × 10⁵ cells mL1 in low-salinity samples and high-salinity samples, respectively; Table 1).
Treatment (Samples after Rolling)—After two days of rolling, POC concentrations had increased from 3.8 to 35.3 μM in low-salinity samples and 2.2 to 2.7 μM in high-salinity samples. POC concentration changes were statistically significant (t-test, p < 0.05; Table 2) and are equivalent to 5 to 39% of POC increases. In general, low-salinity samples had higher increases in POC concentrations (37.6 ± 2.4%), in which LS3 was excluded based on the Q test [28], than that in high-salinity samples (9.1 ± 1.9%). PON concentrations in the treatment group were in the range of 11.6 to 21.2 μM in low-salinity samples and 4.8 to 5.3 μM in high-salinity samples (Table 1), which are equivalent to a PON change of 0.9 to 7.4 μM in low-salinity samples and −0.19 to 1.7 μM in high-salinity samples. In the treatment group, particulate C/N ratios ranged from 6.1 to 7.2 in low-salinity samples and from 5.5 to 6.7 in high-salinity samples (Table 1), showing a slight decrease in four of the six experiments from the field C/N ratio (6.7 to 7.3 in low-salinity samples and 6.0 to 6.7 in high-salinity samples; Table 2). DOC concentrations ranged from 312 to 416 μM in low-salinity samples and 134 to 170 μM in high-salinity samples (Table 1). In general, DOC concentrations significantly decreased in the treatment (Table 2), indicating microbial respiration and aggregation from the dissolved phase to the particulate phase. Direct bacterial counts ranged from 21.9 to 68.2 × 10⁵ cells mL1 in low-salinity samples and from 27.2 to 31.8 × 10⁵ cells mL1 in high-salinity samples (Table 1). Bacterial abundance increased in the range of 7.3 to 56.4 × 10⁵ cells mL1, which is equivalent to an increase of 50 to 476% in bacterial biomass (Table 1).

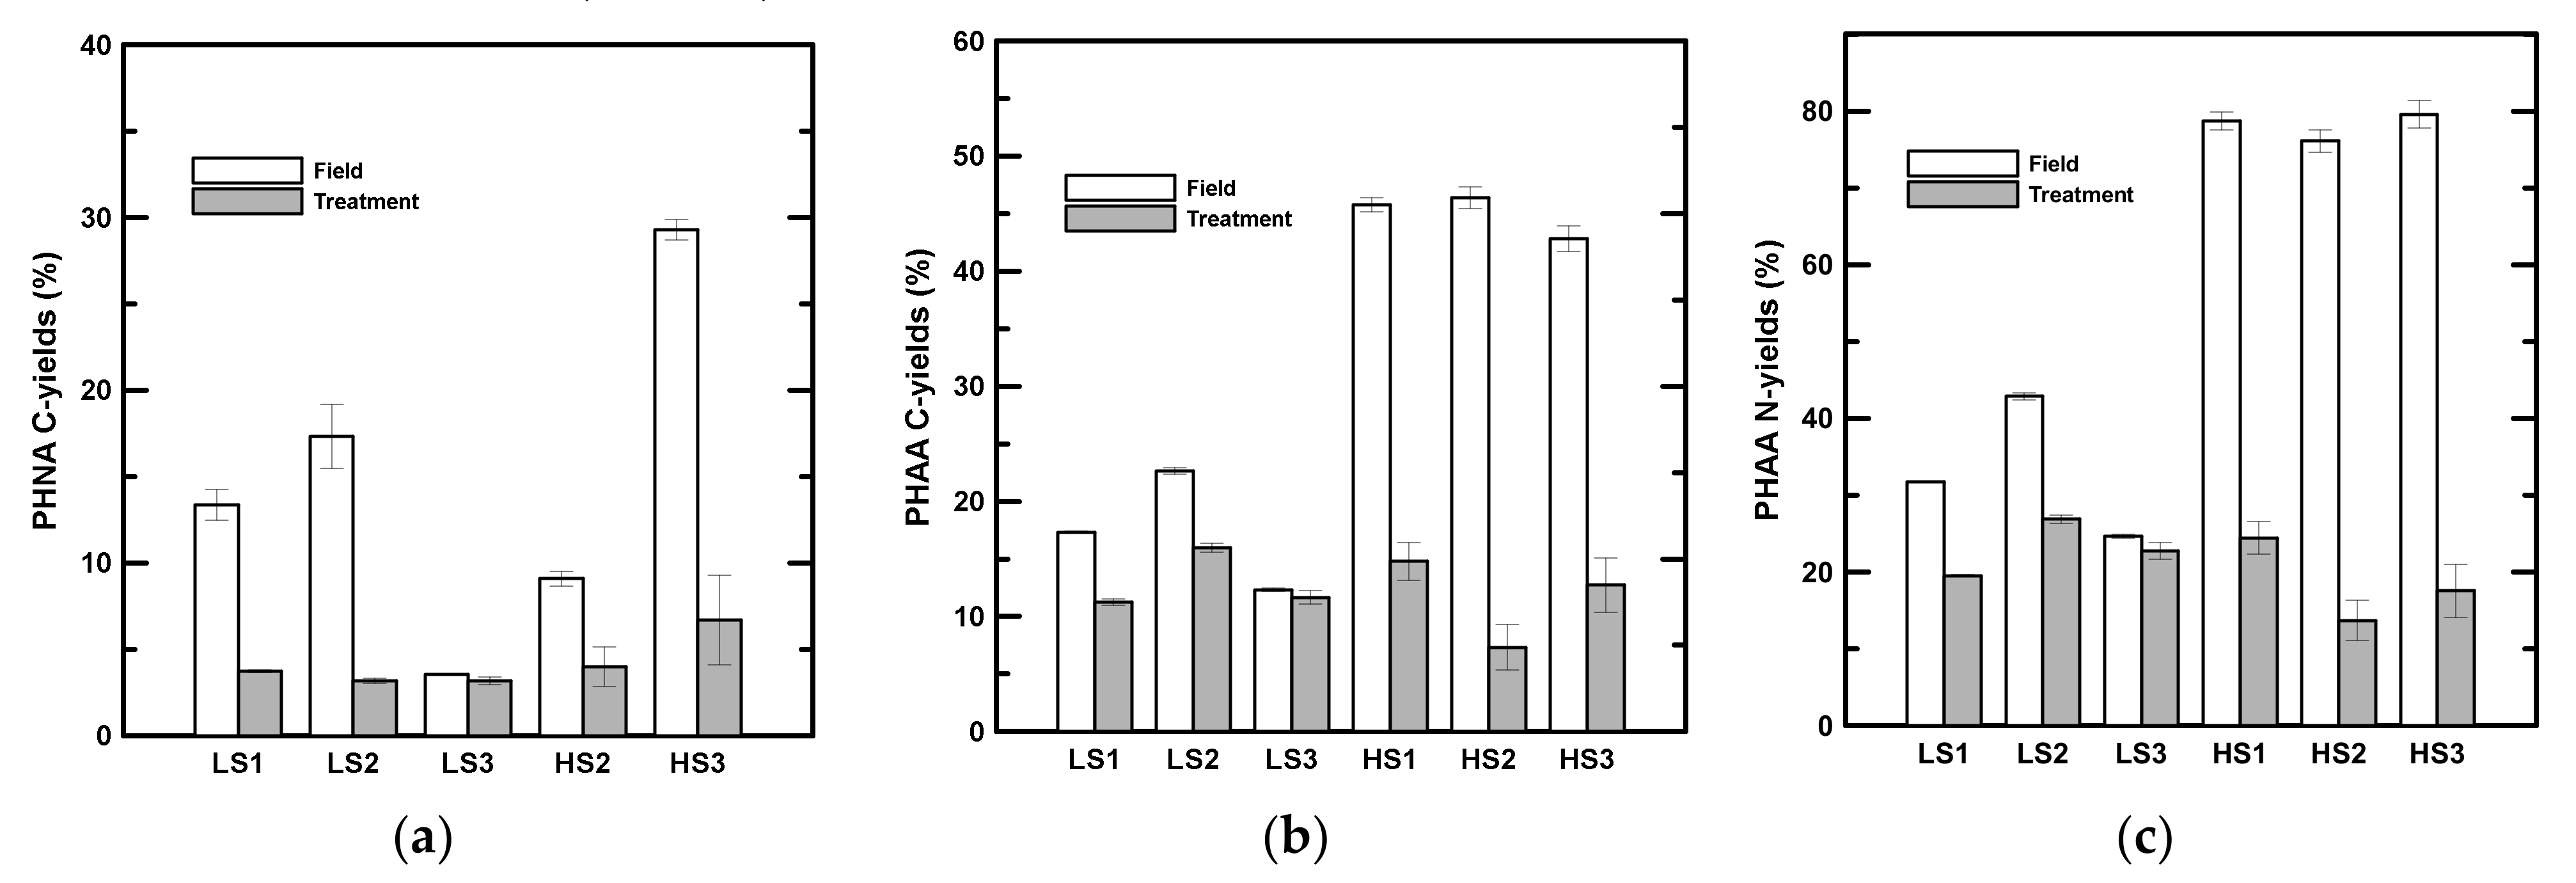
3.3. Concentrations of Bulk Neutral Aldose and Amino Acid

Field—In situ PHNA concentrations varied in both low- and high-salinity samples (2.73 to 15.46 μM and 2.72 to 7.07 μM, respectively; expressed as total concentrations in Table 3). Concentrations of DHNA had a fairly narrow concentration range (1.33 to 1.36 μM) in low-salinity samples but were more variable (0.89 to 4.24 μM) in high-salinity samples (expressed as total concentrations in Table 3). Bulk DHAA and PHAA had similar ranges in low- and high-salinity samples. Concentrations of DHAA were 0.79 to 1.12 μM in low-salinity samples and 0.38 to 0.62 μM in high-salinity samples, whereas PHAA concentrations ranged from 2.11 to 4.42 μM in low-salinity samples and from 2.31 to 3.05 μM in high-salinity samples (expressed as total concentrations in Table 4). The majority of hydrolysable amino acids were in the particulate phase in both low- and high-salinity samples.
The carbon yields (C-yields) from PHNA had a wide range in the study, showing a range of 3.5 to 17.3% and 3.7 to 29.3% in low- and high-salinity samples, respectively (Table 5). The C-yields from DHNA were lower than those from PHNA. The DHNA C-yields ranged from 1.8 to 2.5% in low-salinity samples, while those in high-salinity samples were higher and in a wider range (3.7 to 9.1%). In low-salinity samples, the carbon and nitrogen yields (N-yields) from PHAA were 12.3 to 22.7% and 24.7 to 42.9%, respectively (Table 5). In high-salinity samples, the PHAA C- and N-yields (42.8 to 46.4% of POC and 76.1 to 79.6% of PON) were higher than those in low-salinity samples. In general, the C- and N-yields from DHAA (0.9 to 1.2% of DOC and 2.6 to 4.5% of TDN) were lower than those from PHAA (Table 5).
Treatment—After two days of rolling, PHNA had a significant decrease of 0.06 to 1.92 μM in low-salinity samples and of 0.24 to 0.89 μM in high-salinity samples with the exception of LS3 (t-test, p < 0.05, Table 2). Unlike PHNA, there was no obvious trend in DHNA concentrations between field and treatment groups in either low- or high-salinity samples. PHAA concentrations were higher in low-salinity samples (ranging from 2.12 to 5.03 μM) than those in high-salinity samples (ranging from 0.51 to 0.98 μM; expressed as total concentrations in Table 4). PHAA had a significant decrease of 1.55 to 2.54 μM in high-salinity samples, but there was no significant change in low-salinity samples (t-test, p < 0.05; Table 2). DHAA concentrations ranged from 0.97 to 1.19 μM in low-salinity samples and from 0.22 to 0.59 μM in high-salinity samples (expressed as total concentrations in Table 4). There was no significant difference between field and treatment DHAA concentrations in either low- or high-salinity samples (Table 2).
The PHNA C-yields showed a sharp drop after two days of rolling (Table 5, Figure 2a) with the exception of LS3. The C-yields of PHNA decreased to 3.2 to 3.7% in low-salinity samples and to 4.8 to 6.0% in high-salinity samples. The DHNA C-yields in the treatment ranged from 2.0 to 2.9% in low-salinity samples and from 3.9 to 11.2% in high-salinity samples (Table 5). In contrast to the particulate phase, there was no statistically significant difference in the DHNA C-yield after two days of rolling (Table 2). In low-salinity samples, the PHAA C- and N-yields were 9.5 to 19.8% of POC and 19.6 to 26.9% of PON after two days of rolling (Table 5, Figure 2b,c). Although there was no significant difference in PHAA concentrations in the low-salinity samples after rolling, the C and N-yields decreased significantly during the experiments in low-salinity samples (Table 5, Figure 2b,c), with the exception of the C-yield in LS3. An even more obvious decrease was found in high-salinity samples (Figure 2b,c). The PHAA C- and N-yields decreased from 7.3 to 14.8% of POC and 13.7 to 24.5% of PON in high-salinity samples after two days of rolling (Table 5, Figure 2b,c). In low-salinity samples, the DHAA C- and N-yields after two days of rolling ranged from 1.3 to 1.7% and from 3.1 to 5.0%, respectively (Table 5). In high-salinity samples, DHAA accounted for 0.8 to 1.3% of DOC and 2.2 to 4.4% of TDN after two days of rolling (Table 5). There was no statistically significant difference between the field and treatment DHAA C- and N-yields either in low- or high-salinity samples (Table 2).

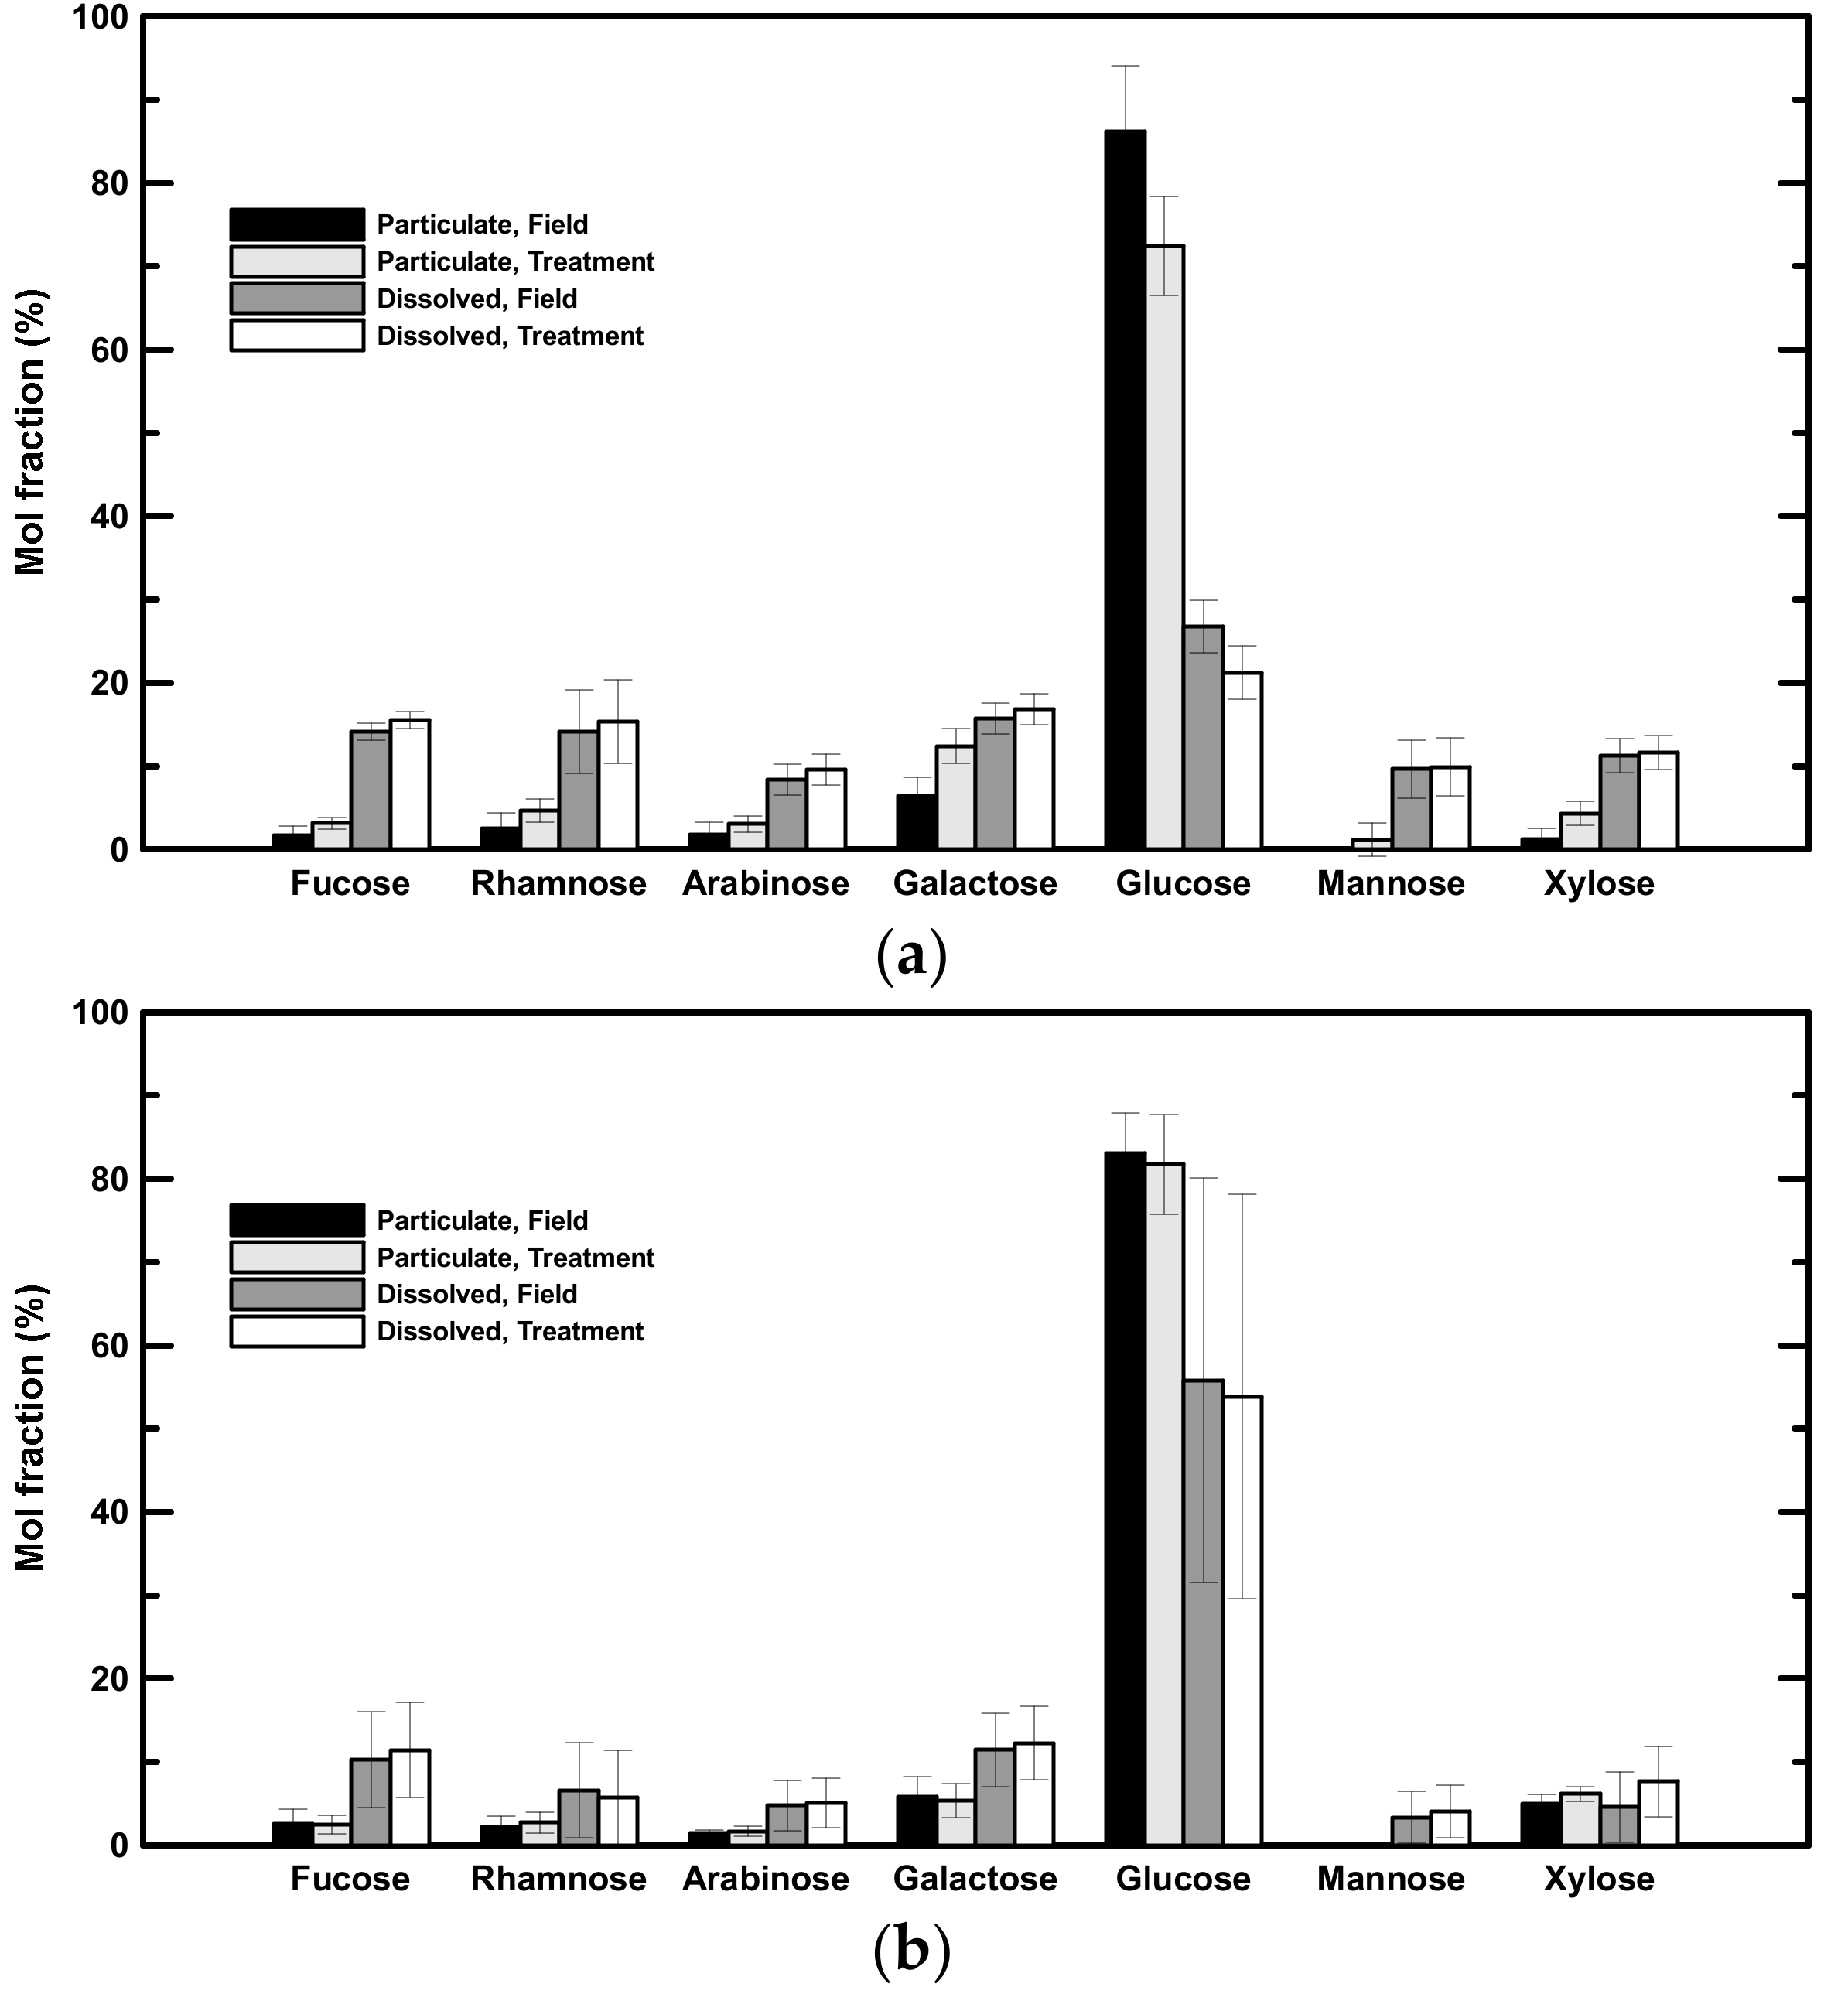
3.4. Concentrations of Compound-Specific Neutral Aldose and Amino Acid

Field—The concentrations of seven neutral aldoses, including fucose, rhamnose, arabinose, galactose, glucose, mannose, and xylose were determined (Table 3). Glucose was the most abundant aldose in both low- and high-salinity samples (Figure 3). In low-salinity samples, glucose concentrations ranged from 0.37 to 0.51 µM in the dissolved phase (comprising 27 ± 3% of DHNA) and from 0.38 to 2.39 µM in the particulate phase (comprising 86 ± 8% of PHNA; Table 3, Figure 3a). In high-salinity samples, glucose concentrations ranged from 0.26 to 3.42 µM in the dissolved phase (comprising 56 ± 24% of DHNA) and from 0.26 to 0.36 µM in the particulate phase (comprising 83 ± 5% of PHNA; Table 3, Figure 3b). Galactose was the second predominant neutral aldose, comprising 14 ± 4% of DHNA and 6 ± 2% of PHNA (Figure 3). Fucose was also abundant in the dissolved phase (14 ± 1% and 15 ± 1% of DHNA in low- and high-salinity samples, respectively; Figure 3). In brief, hydrolysable neutral aldose accounted for 4 to 29% of POC and 2 to 15% of DOC (Table 5). There was a statistically significant difference in the mol fraction of neutral aldose between the dissolved and particulate phases in both low- and high-salinity samples. In general, the mol fraction of glucose in the particulate phase was higher than that in the dissolved phase in both low- and high-salinity samples (t-test, p < 0.05). In contrast, the mol fractions of fucose and galactose in the dissolved phase were higher than those in the particulate phase (t-test, p < 0.05).
The concentrations of individual amino acids were determined (Table 4). Alanine, aspartic acid, glutamic acid, and glycine had the highest mol fractions among the determined amino acid concentrations in the particulate phase of both low- and high-salinity samples (Figure 4). These four amino acids accounted for 46 ± 2% and 47 ± 0.4% of the PHAA in low- and high-salinity samples, respectively. The amino acid mol fractions were more variable in the dissolved phase (Figure 4). In general, aspartic acid, glutamic acid, glycine, and threonine were abundant in both low- and high-salinity samples (Figure 4). These four amino acids accounted for 35 ± 28% and 53 ± 14% of the DHAA in low- and high-salinity samples, respectively. Serine was also abundant in low-salinity samples (Figure 4a), whereas alanine and methionine were relatively abundant in high-salinity samples (Figure 4b).
Treatment—Glucose was the dominant neutral aldose before rolling, and it was still the dominant neutral aldose after rolling. In low-salinity samples, glucose accounted for 21 ± 2% of the DHNA and 72 ± 8% of the PHNA (3a). In high-salinity samples, glucose accounted for 54 ± 20% of the DHNA and 82 ± 6% of the PHNA (Figure 3b). The mol fraction of glucose in PHNA had significantly decreased with 14 ± 2% in low-salinity samples, whereas there was no significant change in high-salinity samples. Galactose was the second major neutral aldose in low-salinity samples after two days of rolling (12 ± 2% of the PHNA and 17 ± 1% of the DHNA; Figure 3a), but it was only abundant in the DHNA fraction in high-salinity samples (Figure 3a). Fucose was also abundant in the treatment (15 ± 1% and 11 ± 6% of the DHNA in low- and high-salinity samples, respectively; Figure 3). In contrast to the particulate phase, the neutral aldose mol fraction of DHNA showed no significant difference between the field and treatment groups.
The amino acid mol fractions in the treatment had similar distributions as field mol fractions in both low- and high-salinity samples, i.e., there was no significant difference in the amino acid mol fractions in the particulate and dissolved phases in either low- or high-salinity samples (Figure 4). Alanine, aspartic acid, glutamic acid, and glycine were still the dominant species in the particulate phase after two days of rolling. These four major amino acids accounted for 46 ± 3% and 48 ± 3% of the PHAA and showed no significant difference from samples in the field. Similar to amino acid mol fractions in the field, aspartic acid, glutamic acid, glycine, and threonine were still the major amino acids in the dissolved phase after rolling, comprising 37 ± 30% and 53 ± 11% of the DHAA in low- and high-salinity samples (Figure 4). Serine was the most abundant in low-salinity samples (Figure 4a), whereas alanine and methionine were relatively abundant in high-salinity samples (Figure 4b).

4. Discussion

4.1. Aggregation of Bulk Organic Matter

The roller table has long been used for the generation of laboratory-made aggregates [9,18,29], in which the dominant mechanism for the aggregation is differential sedimentation. Differential sedimentation occurs when large particles fall faster than small particles, overtaking each other and colliding together. Jackson [30] further stated that the shear vanishes and the fluid rotates as the full-body rotation within 20 min of the startup of the roller table. In this study, we evaluated aggregation processes using particulate organic matter concentrations (i.e., POC and PON) instead of particle size distributions. We conceptualized that the aggregation process could be described by the following equation:
ΔPOM = POMaggregation + POMbacterial colonization – POMconsumption − POMdisaggregation
A change in POM concentration reflects the combination of the aggregation of OM, concomitant bacterial colonization, and the POM consumption or disaggregation. The overall effect of collision was positive, increasing POC from 2.2 to 35.3 μM in laboratory-made aggregates (Table 2). The disaggregation process could be ignored in this case because it has been reported only in extremely high turbulent conditions [31,32,33]. Previous studies have shown that OM aggregation may enhance microbial activities [34,35]. Although a direct estimate of the microbial consumption of POM is unavailable, enhanced microbial activity is usually associated with an increase in bacterial abundance. We observed significant increases in bacterial abundance in all experiments (t-test, p < 0.05, Table 2). In order to estimate the potential contribution of bacterial biomass to the increased POM, we carried out a simple calculation using a nominal bacterial C conversion factor of 20 fg cell1 and a bacterial C/N ratio of 5. Using these numbers, we found that the increases in bacterial biomass C and N ranged from 1.22 to 9.40 μM C and from 0.24 to 1.88 μM N, respectively (Table 1). A previous sediment trap study suggested that the abundance of particle-attached bacteria is similar to that of free-living bacteria in seawater [36]. If half of the bacteria are attached, bacterial colonization might contribute a major part of the POC increase (43.7 to 71.0%) in high-salinity samples, while bacterial carbon biomass accounted for 4.9 to 16.1% of the POC increase in low-salinity samples. However, separate counts of free-living and particle-attached bacteria would be needed for accurate estimates. Note that the bacteria collected from water samples included both free-living and particle-attached bacteria using 0.2 μm pore-size polycarbonate filters, while aggregates were collected using GF/F filters with a nominal pore size of 0.7 μm.
As indicated by the above equation, a net POM increase will only occur if the sum of the aggregated material and associated bacterial biomass is larger than the amount of POM consumed by bacteria. Besides bacterial colonization, an increase in the POM concentration indicated that a net increase of POM is considered from the empirically defined dissolved phase through aggregation processes. Our results showed a significant POC concentration increase after two days of rolling (Table 2). A series of ANOVA was used to compare the aggregation effect on concentrations of POC, PHNA, and PHAA. The ANOVA showed that the aggregation effect on these parameters varied significantly among experiments, which is consistent with Shanks and Edmonson’s observations [9]. Shanks and Edmonson [9] found that the aggregation effect on particle size, abundance, and total volume varied significantly between sampling dates. A previous laboratory study [37] showed that OM aggregation increases with salinity from 0 to 20 and that less aggregation occurs above 20. Our results were similar: the POC concentration increased more in low-salinity samples (POC increase = 37.6 ± 2.4% at salinity of 6.3–6.8) than in high-salinity samples (POC increase = 9.1 ± 1.9% at salinity of 21.4–26.7), indicating that abiotic aggregation may enhance more POC flux in estuarine waters.

4.2. Changes in Biologically-Labile Components

As the equation described in Section 4.1, aggregation processes in the particulate phase perform as two cases: (1) a net aggregation of OM; (2) a net consumption of OM with enhanced microbial activities. Concentrations of labile organic components (neutral aldoses and amino acids in this study) in the particulate phase decreased in the treatment (case 2; except for PHAA in low-salinity samples; Table 2, Table 3 and Table 4), while DHNA and DHAA concentrations in the treatment remained in a relatively narrow range compared to those in the field, indicating preferential microbial degradation of biologically labile organic components in the particulate phase. These results are consistent with previous studies indicating that the biological lability of OM decreases in the order of POM → Colloidal OM → DOM [24,38]. However, PHAA concentrations in the treatment in low-salinity samples were not significantly different from those in the field (more like case 1), indicating that PHAA might be preserved and can escape from microbial degradation in low-salinity waters. Our results support Chen and Skoog’s [39] hypothesis, that aggregation tends to accumulate non-essential (non-limiting) elements for microbial growth. The inorganic nutrient concentrations indicated that low-salinity samples may have been P-limited and PHAA (containing the non-limiting element N) appeared to be preserved.
The C- and N-yields from PHNA and PHAA appeared in a wide range in the field. PHNA accounted for 3.5 to 29.3% of bulk POC, whereas PHAA comprised 17.3 to 46.4% of bulk POC and 24.7 to 79.6% of bulk PON (Table 4). Irrespective of the yields in the field, the particulate C- and N-yields decreased to a relatively narrow range in the treatment (3.2 to 6.7% in PHNA C-yields, 7.3 to 16.0% in PHAA C-yields, and 13.7 to 26.9% in PHAA N-yields; Table 4). Larger decreases of the C- and N-yields from the PHAA in high-salinity samples than those in low-salinity samples indicated that POM in high-salinity samples was more freshly produced and more bioavailable (Figure 2b,c).
The C-yields of combined PHNA and PHAA (%(TNA + TAA)OC) and the N-yields of PHAA (%TAAN) have been recognized as indicators of the diagenetic status of marine OM [40]. These indices reflect the behaviors of the major labile organic components and could be sensitive to the presence of the relatively refractory components such as lignin and humic substances, showing a decrease as diagenesis progresses. In this study, the %(TNA + TAA)OC and %TAAN in the field were higher than those in the treatment, except for LS3. Within the field group, the %(TNA + TAA)OC and %TAAN (63.8 ± 11.7% and 78.1 ± 1.8%, respectively) in high-salinity samples were higher than those in low-salinity samples (35.4 ± 6.6% and 37.4 ± 7.8%, respectively), indicating more bioavailability of POM in high-salinity samples. LS3 had relatively low indices (%(TNA + TAA)OC of 15.8% and %TAAN of 24.7%), performing a more refractory OM composition than other field samples. After two days of rolling, the %(TNA + TAA)OC and %TAAN decreased to 16.0 ± 3.4% and 20.8 ± 4.8%, respectively, indicating that OM in the treatment became more degraded than that in the field.
Compound-specific neutral aldoses have been proposed as an indicator for the quality of marine aggregates [41,42]. Hernes et al. [41] found that glucose is the most labile neutral aldose, followed by galactose. On the other hand, rhamnose, xylose, fucose, and mannose are relatively refractory from microbial degradation. Therefore, the mol fraction of glucose usually decreases with increased degradation of POM. Similar to the observations of Hernes et al. [41], our results showed that the mol fraction of particulate glucose in low-salinity waters significantly decreased after two days of rolling (Figure 3a), while mol fractions in other particulate neutral aldoses slightly increased in the treatment. However, difference between the PHNA mol fractions in high-salinity waters appeared insignificant in the field and treatment samples. The enrichment factor (EF) is a good aid in understanding a process effect for a specific component, which is expressed as the following:
EF X = X Treatment X Field
An EF of > 1 indicates that the process favors the accumulation of the component X, while an EF of < 1 indicates that the process favors the consumption of the X. When the EF is equal to 1, it indicates that the process does not favor either accumulation or consumption of the X. The EF analysis showed significant results for particulate neutral aldoses (Table 6). In general, EFs of particulate neutral aldoses were less than 1 (except for LS3), indicating the preferential microbial degradation of neutral aldoses. Glucose had the lowest EFs, which supports the observations from Hernes et al. [41]. In low-salinity samples, EFs of xylose were larger than 1, indicating the preservation of xylose. PHNA in LS3 and HS3 behaved in totally different directions, indicating that aggregation-induced microbial activities could be complicated and occur on a case-by-case basis. In summary of the change of biologically labile components, aggregation and concomitant microbial activities potentially decreased the bioavailability of POM (i.e., caused more degraded POM).

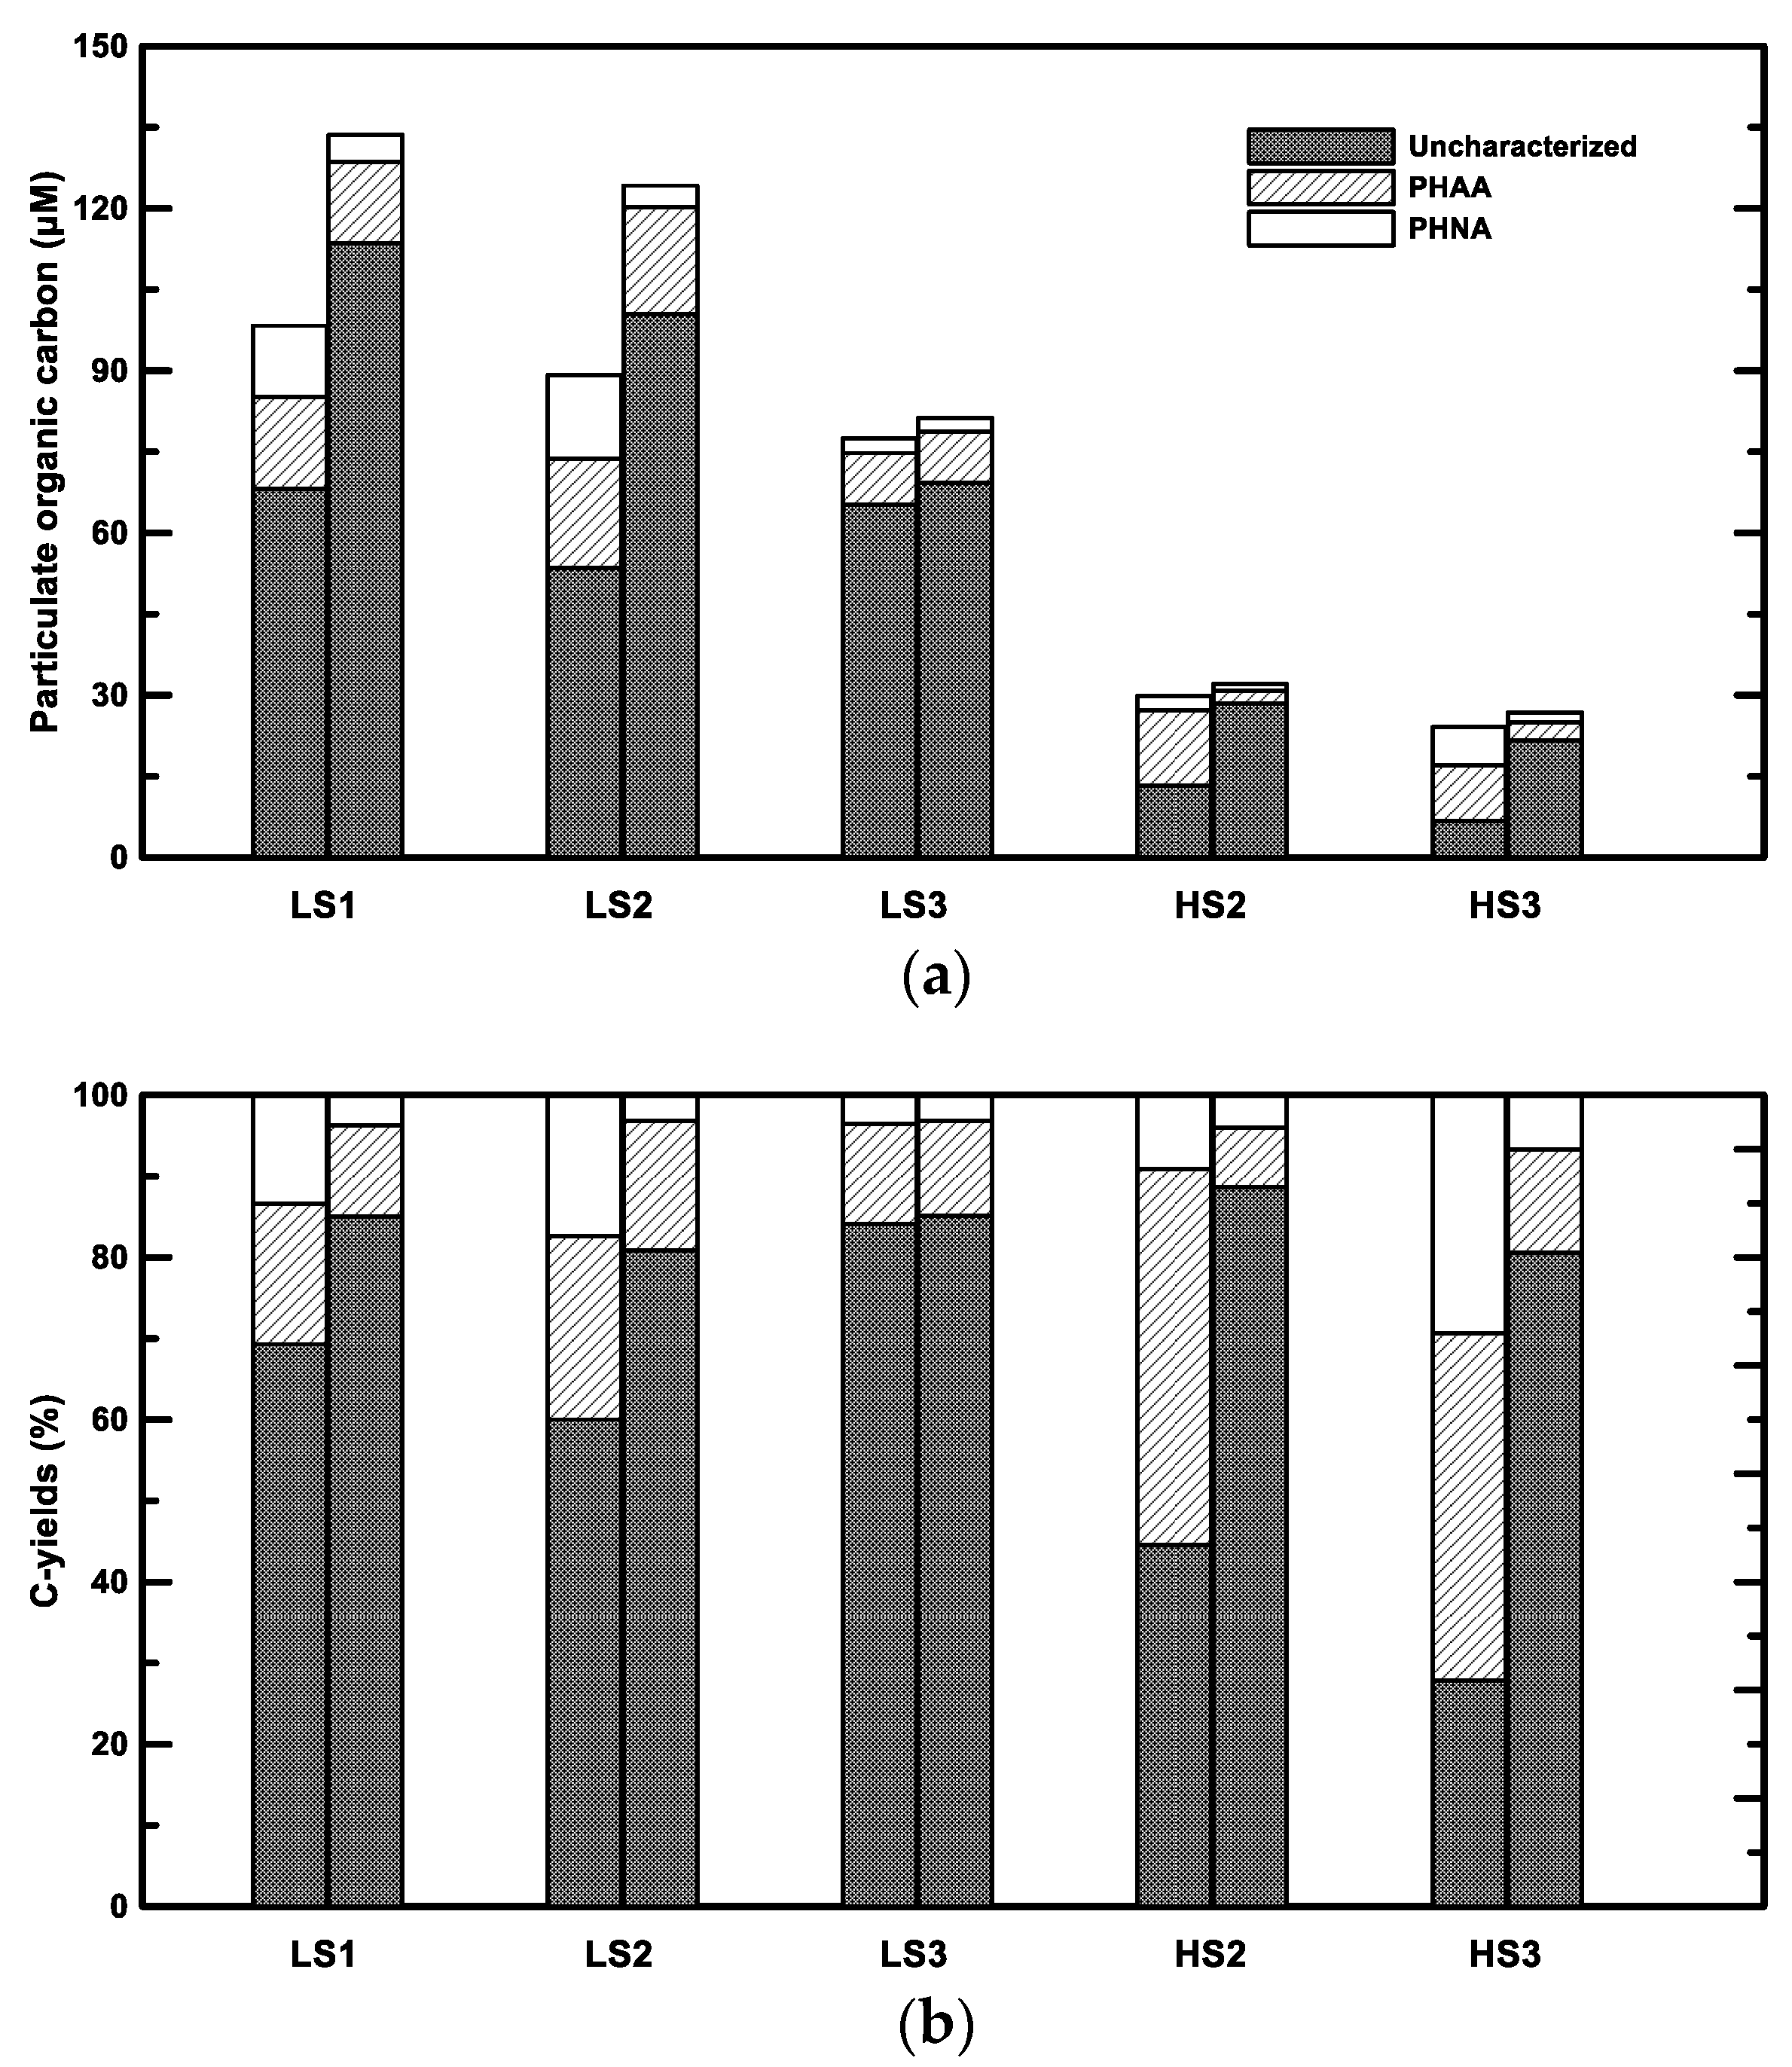
4.3. Changes in Uncharacterized Component

The decrease of PHNA and PHAA and the increase of bulk POC resulted in the increase of uncharacterized POC (Figure 5). The increase of uncharacterized POC was 32.1 ± 24.3 μM and 15.0 ± 0.2 μM in the low- and high-salinity samples, respectively (Figure 5a). The C-yields from uncharacterized POC in the treatment ranged from 81 to 89% (Figure 5b), indicating that aggregation and concomitant microbial activities potentially caused more refractory POM. The increases of both uncharacterized POC concentrations and C-yields were also observed in the aggregation study using a Couette flocculator [39]. These increases of uncharacterized POC might be from direct sources of bacterial colonization and the processes such as the transformation of POM and abiotic aggregation. Bacterial cells contain some “uncharacterized” biomacromolecules. For example, Benner and Kaiser [43] found that muramic acid, an “uncharacterized” amino sugar in bacterial cell wall peptidoglycan, was relatively abundant in POM. Therefore, bacterial colonization might contribute to a fraction of uncharacterized POC increases. Microbial activity may also produce uncharacterized OM. For example, transparent exopolymer particles (TEP), which play an important role in OM aggregation, are thought to be produced by algae and bacteria [44]. In fact, only about a half of TEP is characterized as neutral aldose, and the rest of the carbohydrates remain unidentified [11]. Moreover, heterotrophic bacteria could not only utilize the labile components, but also alter the molecular structure to form a small fraction of uncharacterized and refractory OM [45]. Since the increase of bacterial biomass only accounted for less than one third of the uncharacterized POC increase, bacterial colonization and microbial processes may only be minor factors. The combination effect of differential sedimentation and shear is likely the major contributor on the aggregation of uncharacterized POC from the dissolved phase. In estuarine and coastal waters, biologically-refractory humic substances were found to be rapidly aggregated and removed [46,47,48]. Black carbon (BC), which is formed by the incomplete combustion of biomass and fossil fuel, could also play an important role in the aggregation of uncharacterized POC. BC itself constitutes up to 50% of uncharacterized POC [49]. With high surface affinities and easy-to-adsorb organic substances, such as hydrophobic organic compounds, BC has a strong potential to aggregate uncharacterized POM. The detailed contributions and mechanisms of an uncharacterized POC increase needs further investigation.

5. Conclusions

The goal of this study was to study the formation of POC and the subsequent alterations of chemical characteristics in estuarine (low-salinity) and coastal (high-salinity) samples using 2-day roller-table incubations. We found that POC concentrations increased significantly by introducing a combined mechanism of differential sedimentation and shear from a roller table. Low-salinity samples had a higher increase in the POC concentration (POC increased 37.6 ± 2.4%) than high-salinity samples (POC increased 9.1 ± 1.9%). This implied that abiotic aggregation could play a crucial role in the export of organic carbon and therefore regulate the budget of atmospheric CO2. In fact, OM aggregation depends on its stickiness, which can possibly be evaluated using a protein to carbohydrate ratio [50]. Aggregation of OM also enhanced concomitant bacterial growth in both low- and high-salinity samples (an increase of 50 to 476% in bacterial biomass). Concentrations of PHNA and PHAA decreased in the treatment (except for PHAA in low-salinity samples), while DHNA and DHAA concentrations in the treatment remained similar to those in the field, indicating preferential microbial degradation of biologically labile organic components in the particulate phase. PHAA concentrations in the treatment in low-salinity samples were not significantly different from those in the field, indicating that PHAA might be preserved. The PHAA results support Chen and Skoog’s [39] hypothesis that aggregation tends to accumulate non-essential (non-limiting) elements for microbial growth. An enrichment factor analysis showed the preferential microbial degradation of PHNA and glucose appeared as the most labile aldose. The C- and N-yields from PHNA and PHAA decreased after two days of rolling, indicating that aggregation processes led to more degraded POM. A decrease of labile organic components in the treatment resulted in an increase of uncharacterized POM both in concentration and in C-yields, indicating that aggregation potentially causes the accumulation of refractory POM. Deciphering more components of uncharacterized POM (e.g., lipids and black carbon) would improve our knowledge in the bioavailability of sinking particles and the role of aggregates in benthic ecosystems.

Author Contributions

A.S. and T.-Y.C. designed and managed the project; T.-Y.C. analyzed data; T.-Y.C. led the writing of the manuscript and all authors reviewed and approved the final manuscript. All authors have read and agreed to the published version of the manuscript.

Funding

This research was partially supported by the NSF of the USA (grant # OCE-0526358) and a University of Connecticut Research Foundation Small Grant awarded to A.S., and by grants from the Ministry of Science and Technology of Taiwan (grants # 110-2611-M-019-016-) awarded to T.-Y.C.

Institutional Review Board Statement

Not applicable.

Informed Consent Statement

Not applicable.

Data Availability Statement

The data presented in this study are available in the article.

Acknowledgments

We would like to thank Evan Ward for providing the roller table and Jeff Godfrey and Jose Santana for their assistance in water sampling and the use of a small boat.

Conflicts of Interest

The authors declare no conflict of interest.

References

  1. Kepkay, P.E. Colloids and the ocean carbon cycle. In Marine Chemistry; Wangersky, P.J., Ed.; Springer: New York, NY, USA, 2000; pp. 35–56. [Google Scholar]
  2. Eppley, R.W.; Peterson, B.J. Particulate organic matter flux and planktonic new production in the deep ocean. Nature 1979, 282, 677–680. [Google Scholar] [CrossRef]
  3. Thornton, D.C.O. Diatom aggregation in the sea: Mechanisms and ecological implications. Eur. J. Phycol. 2002, 37, 149–167. [Google Scholar] [CrossRef]
  4. Simon, M.; Grossart, H.P.; Schweitzer, B.; Ploug, H. Microbial ecology of organic aggregates in aquatic ecosystems. Aquat. Microb. Ecol. 2002, 28, 175–211. [Google Scholar] [CrossRef] [Green Version]
  5. Kerner, M.; Hohenberg, H.; Ertl, S.; Reckermann, M.; Spitzy, A. Self-organization of dissolved organic matter to micelle-like microparticles in river water. Nature 2003, 422, 150–154. [Google Scholar] [CrossRef] [PubMed]
  6. Kepkay, P.E. Particle aggregation and biological reactivity of colloids. Mar. Ecol. Prog. Ser. 1994, 109, 293–304. [Google Scholar] [CrossRef]
  7. Chin, W.-C.; Orellana, M.V.; Verdugo, P. Spontaneous assembly of marine dissolved organic matter into polymer gels. Nature 1998, 391, 568–572. [Google Scholar] [CrossRef]
  8. Alldredge, A.L.; Silver, M.W. Characteristics, dynamics and significance of marine snow. Prog. Oceanogr. 1988, 20, 41–82. [Google Scholar] [CrossRef]
  9. Shanks, A.L.; Edmondson, E.W. Laboratory-made marine snow: A biological model of the real thing. Mar. Biol. 1989, 101, 463–470. [Google Scholar] [CrossRef]
  10. Drapeau, D.T.; Dam, H.G.; Grenier, G. An improved flocculator design for use in particle aggregation experiments. Limnol. Oceanogr. 1994, 39, 723–729. [Google Scholar] [CrossRef]
  11. Mopper, K.; Zhou, J.; Sri Ramana, K.; Passow, U.; Dam, H.G.; Drapeau, D.T. The role of surface-active carbohydrates in the flocculation of a diatom bloom in a mesocosm. Deep.-Sea Res. Part II 1995, 42, 47–73. [Google Scholar] [CrossRef]
  12. Alldredge, A.L. The carbon, nitrogen, and mass content of marine snow as a function of aggregate size. Deep.-Sea Res. 1998, 45, 529–541. [Google Scholar] [CrossRef]
  13. Jackson, G.A.; Lochmann, S. Modeling coagulation of algae in marine ecosystem. In Environmental Particles; Buffle, J., van Leeuwen, H.P., Eds.; Lewis Publisher: Boca Raton, FL, USA, 1993; Volume 2, pp. 387–414. [Google Scholar]
  14. Kiørboe, T.; Andersen, K.P.; Dam, H.G. Coagulation efficiency and aggregate formation in marine phytoplankton. Mar. Biol. 1990, 107, 235–245. [Google Scholar] [CrossRef]
  15. Grossart, H.-P.; Berman, T.; Simon, M.; Pohlmann, K. Occurrence and microbial dynamics of macroscopic organic aggregates (lake snow) in Lake Kinneret, Israel, in fall. Aquat. Microb. Ecol. 1998, 14, 59–67. [Google Scholar] [CrossRef] [Green Version]
  16. Artolozaga, I.; Santamaría, E.; López, A.; Ayo, B.; Iriberri, J. Succession of bacterivorous protists on laboratory-made marine snow. J. Plankton Res. 1997, 19, 1429–1440. [Google Scholar] [CrossRef] [Green Version]
  17. Knoll, S.; Zwisler, W.; Simon, M. Bacterial colonization of early stages of limnetic diatom microaggregates. Aquat. Microb. Ecol. 2001, 25, 141–150. [Google Scholar] [CrossRef]
  18. Engel, A.; Meyerhöfer, M.; von Bröckel, K. Chemical and biological composition of suspended particles and aggregates in the Baltic Sea in summer (1999). Estuar. Coast. Shelf Sci. 2002, 55, 729–741. [Google Scholar] [CrossRef] [Green Version]
  19. Unanue, M.A.; Azua, I.; Arrieta, J.M.; Herndl, G.J.; Iriberri, J. Laboratory-made particles as a useful approach to analyse microbial processes in marine aggregates. FEMS Microbiol. Ecol. 1998, 26, 325–334. [Google Scholar] [CrossRef]
  20. Quigg, A.; Santschi, P.H.; Burd, A.; Chin, W.-C.; Kamalanathan, M.; Xu, C.; Ziervogel, K. From nano-gels to marine snow: A synthesis of gel formation processes and modeling efforts involved with particle flux in the ocean. Gels 2021, 7, 114. [Google Scholar] [CrossRef] [PubMed]
  21. Welsh, B.L.; Eller, F.C. Mechanisms controlling summertime oxygen depletion in western Long Island Sound. Estuaries 1991, 14, 265–278. [Google Scholar] [CrossRef]
  22. Benner, R.; Strom, M. A critical evaluation of the analytical blank associated with DOC measurements by high-temperature catalytic oxidation. Mar. Chem. 1993, 41, 153–160. [Google Scholar] [CrossRef]
  23. Svensson, E.; Skoog, A.; Amend, J.P. Concentration and distribution of dissolved amino acids in a shallow hydrothermal system, Vulcano Island (Italy). Org. Geochem. 2004, 35, 1001–1014. [Google Scholar] [CrossRef]
  24. Skoog, A.; Benner, R. Aldoses in various size fractions of marine organic matter: Implications for carbon cycling. Limnol. Oceanogr. 1997, 42, 1803–1813. [Google Scholar] [CrossRef] [Green Version]
  25. Parsons, T.R.; Maita, Y.; Lalli, C.M. A Manual of Chemical and Biological Methods for Seawater Analysis; Pergamon Press: New York, NY, USA, 1984; p. 173. [Google Scholar]
  26. Hobbie, J.E.; Daley, R.J.; Jasper, S. Use of nuclepore filters for counting bacteria by fluorescence microscopy. Appl. Environ. Microb. 1977, 33, 1225–1228. [Google Scholar] [CrossRef] [PubMed] [Green Version]
  27. Lee, S.; Fuhrman, J.A. Relationships between biovolume and biomass of naturally derived marine bacterioplankton. Appl. Environ. Microb. 1987, 53, 1298–1303. [Google Scholar] [CrossRef] [PubMed] [Green Version]
  28. Rorabacher, D.B. Statistical treatment for rejection of deviant values: Critical values of Dixon’s "Q" parameter and related subrange ratios at the 95% confidence level. Anal. Chem. 1991, 63, 139–146. [Google Scholar] [CrossRef]
  29. Ortiz, V.L.; Mason, R.P.; Ward, J.E. An examination of the factors influencing mercury and methylmercury particulate distributions, methylation and demethylation rates in laboratory-generated marine snow. Mar. Chem. 2015, 177, 753–762. [Google Scholar] [CrossRef] [PubMed] [Green Version]
  30. Jackson, G.A. Particle trajectories in a rotating cylinder: Implications for aggregation incubations. Deep.-Sea Res. I 1994, 41, 429–437. [Google Scholar] [CrossRef]
  31. Burban, P.-Y.; Lick, W.; Lick, J. The flocculation of grained sediments in estuarine waters. J. Geophys. Res. 1989, 94, 8323–8330. [Google Scholar] [CrossRef]
  32. Spicer, P.T.; Pratsinis, S. Shear-induced floccultion: The evolution of floc structure and the shape of the size distribution at steady state. Water Res. 1996, 30, 1049–1056. [Google Scholar] [CrossRef]
  33. Tsai, C.-H.; Iacobellis, S.; Lick, W. Flocculation of fine-grained lake sediments due to a uniform shear stress. J. Great Lakes Res. 1987, 13, 135–146. [Google Scholar] [CrossRef]
  34. Kepkay, P.E.; Johnson, B.D. Microbial response to organic particle generation by surface coagulation in seawater. Mar. Ecol. Prog. Ser. 1988, 48, 193–198. [Google Scholar] [CrossRef]
  35. Kepkay, P.E.; Johnson, B.D. Coagulation on bubbles allows the microbial respiration of oceanic dissolved organic carbon. Nature 1989, 385, 63–65. [Google Scholar] [CrossRef]
  36. Ducklow, H.W.; Hill, S.M.; Gardner, W.D. Bacterial growth and the decomposition of particulate organic carbon collected in sediment traps. Cont. Shelf Res. 1985, 4, 445–464. [Google Scholar] [CrossRef]
  37. Sholkovitz, E.R. Flocculation of dissolved organic and inorganic matter during the mixing of river water and seawater. Geochim. Cosmochim. Acta 1976, 40, 831–845. [Google Scholar] [CrossRef]
  38. Amon, R.M.W.; Benner, R. Bacterial utilization of different size classes of dissolved organic matter. Limnol. Oceanogr. 1996, 41, 41–51. [Google Scholar] [CrossRef] [Green Version]
  39. Chen, T.-Y.; Skoog, A. Aggregation of organic matter in coastal waters: A dilemma of using a Couette flocculator. Cont. Shelf Res. 2017, 139, 62–70. [Google Scholar] [CrossRef]
  40. Cowie, G.L.; Hedges, J.I. Biochemical indicators of diagenetic alteration in natural organic matter mixtures. Nature 1994, 369, 304–307. [Google Scholar] [CrossRef]
  41. Hernes, P.J.; Hedges, J.I.; Peterson, M.L.; Wakeham, S.G.; Lee, C. Neutral carbohydrate geochemistry of particulate material in the central equatorial Pacific. Deep.-Sea Res. II 1996, 43, 1181–1204. [Google Scholar] [CrossRef]
  42. Skoog, A.; Alldredge, A.; Passow, U.; Dunne, J.; Murray, J. Neutral aldoses as source indicators for marine snow. Mar. Chem. 2008, 108, 195–206. [Google Scholar] [CrossRef] [Green Version]
  43. Benner, R.; Kaiser, K. Abundance of amino sugars and peptidoglycan in marine particulate and dissolved organic matter. Limnol. Oceanogr. 2003, 48, 118–128. [Google Scholar] [CrossRef]
  44. Alldredge, A.L.; Passow, U.; Logan, B.E. The abundance and significance of a class of large, transparent organic particles in the ocean. Deep.-Sea Res. I 1993, 40, 1131–1140. [Google Scholar] [CrossRef]
  45. Ogawa, H.; Amagai, Y.; Koike, I.; Kaiser, K.; Benner, R. Production of refractory dissolved organic matter by bacteria. Science 2001, 292, 917–920. [Google Scholar] [CrossRef] [PubMed]
  46. Sholkovitz, E.R.; Boyle, E.A.; Price, N.B. The removal of dissolved humic acids and iron during esturine mixing. Earth Planet. Sci. Lett. 1978, 40, 130–136. [Google Scholar] [CrossRef]
  47. Fox, L.E. The removal of dissolved humic acid during esturine mixing. Estuar. Coast. Shelf Sci. 1983, 16, 431–440. [Google Scholar] [CrossRef]
  48. Tremblay, L.; Gagné, J.-P. Organic matter distribution and reactivity in the waters of a large estuarine system. Mar. Chem. 2009, 116, 1–12. [Google Scholar] [CrossRef]
  49. Flores-Cervantes, D.X.; Plata, D.; MacFarlane, J.K.; Reddy, C.M.; Gschwend, P.M. Black carbon in marine particulate organic carbon: Inputs and cycling of highly recalcitrant organic carbon in the Gulf of Maine. Mar. Chem. 2009, 113, 172–181. [Google Scholar] [CrossRef]
  50. Santschi, P.H.; Xu, C.; Schwehr, K.A.; Lin, P.; Sun, L.; Chin, W.-C.; Kamalanathan, M.; Bacosa, H.P.; Quigg, A. Can the protein/carbohydrate (P/C) ratio of exopolymeric substances (EPS) be used as a proxy for their ‘stickiness’ and aggregation propensity? Mar. Chem. 2020, 218, 103734. [Google Scholar] [CrossRef]
Figure 1. Study area. The red star denotes the coastal site, while the yellow star denotes the estuarine site.
Water 13 03077 g001
Figure 2. C- and N-yields of labile organic components in the particulate phase. (a) C-yields of particulate hydrolysable neutral aldose (PHNA). Data is not available for HS1. (b) C-yields of particulate hydrolysable amino acid (PHAA). (c) N-yields of PHAA. LS and HS denote low- and high-salinity, respectively.
Water 13 03077 g002
Figure 3. Mol fractions of individual neutral aldoses. (a) Averaged mol fractions of neutral aldoses in low-salinity samples. (b) Averaged mol fractions of neutral aldoses in high-salinity samples.
Water 13 03077 g003
Figure 4. Mol fractions of individual amino acids. (a) Averaged mol fractions of amino acids in low-salinity samples. (b) Averaged mol fractions of amino acids in high-salinity samples.
Water 13 03077 g004
Figure 5. Chemical composition of POC in the field (the left column in each pair) and the treatment (the right column in each pair). (a) Concentrations. (b) C-yields. PHNA denotes particulate hydrolysable neutral aldose and PHAA denotes particulate hydrolysable amino acid. LS and HS denote low- and high-salinity, respectively.
Water 13 03077 g005
Table 1. Environmental conditions and chemical and biological parameters. Abbreviations: NOx: nitrate + nitrite; DOC: dissolved organic carbon; POC: particulate organic carbon; PON: particulate organic carbon; Part: particulate; Bact: bacteria; BBC: bacterial biomass in C; BBN: bacterial biomass in N; LS: low-salinity; HS: high-salinity. The estimate of BBC is based on the bacterial cellular C content of 20 fg and the estimate of BBN is based on a bacterial C:N ratio of 5. Treatment denotes samples after two days of rolling.
Low-Salinity SamplesHigh-Salinity Samples
ParameterUnitLS1LS2LS3HS1HS2HS3
Salinity 6.36.36.826.726.221.4
NOx, FieldμM27.027.017.10.881.901.52
PO4, FieldμM0.530.560.880.580.600.97
N/P ratio Fieldmol/mol5148191.53.21.6
DOC FieldμM310.3313.4425.0141.1141.4170.6
POC FieldμM98.389.277.527.329.924.1
POC TreatmentμM133.6124.281.329.732.126.8
ΔPOCμM35.335.03.82.42.22.7
ΔPOC%35.939.24.98.87.411.2
PON FieldμM14.813.010.74.324.993.58
PON TreatmentμM21.220.411.64.934.805.29
ΔPONμM6.47.40.90.61−0.191.71
ΔPON%43.256.98.414.1−3.847.8
Part. C/N Fieldmol/mol6.656.897.256.325.996.72
Part. C/N Treatmentmol/mol6.416.097.156.046.675.50
Bact. # Field105 cells ml−17.5211.814.69.6414.113.0
Bact. # Treatment105 cells ml−128.168.221.930.231.827.2
BBC FieldμM C1.251.972.431.612.342.17
BBC TreatmentμM C4.6911.373.655.025.314.53
ΔBBCμM C3.449.401.223.412.972.36
BBN FieldμM N0.250.400.490.320.470.43
BBN TreatmentμM N0.942.280.731.001.060.91
ΔBBNμM N0.691.880.240.680.590.47
Table 2. Results from t-tests (p < 0.05) between concentrations in the field and the treatment. A plus sign (+) denotes a significant increase in the treatment; a minus sign (−) denotes a significant decrease in the treatment; a cross sign (×) denotes no significant change between field and treatment samples. Abbreviations: POC and DOC: particulate and dissolved organic carbon, respectively; BB: bacterial biomass; C/Np: particulate C/N ratio; DHAA and PHAA: dissolved and particulate hydrolysable amino acid, respectively; DHNA and PHNA: dissolved and particulate hydrolysable neutral aldose, respectively; CY and NY: C- and N-yields, respectively; LS: low-salinity; HS: high-salinity.
Low-Salinity SamplesHigh-Salinity Samples
ParameterLS1LS2LS3HS1HS2HS3
(POC)++++++
(DOC)
BB++++++
C/Np×+
(PHNA)×n.a.
PHNA-CY×n.a.
(DHNA)××××
DHNA-CY××××
(PHAA)×××
PHAA-CY×
PHAA-NY
(DHAA)××××××
DHAA-CY××××××
DHAA-NY××××××
n.a.: not available.
Table 3. Neutral aldose concentrations in the field and treatment. LS and HS denote low- and high-salinity, respectively.
FucoseRhamnoseArabinoseGalactoseGlucoseMannoseXyloseTotal
ExpSampleGroup(nM)(nM)(nM)(nM)(nM)(nM)(nM)(nM)
LS1ParticulateField25.939.724.8141.11949.4-14.72195.7
ParticulateTreatment21.730.019.6110.1627.3-29.1837.8
DissolvedField185.6113.689.7238.9367.7184.5182.51362.4
DissolvedTreatment196.5151.1113.0238.6278.2168.8181.71328.0
LS2ParticulateField25.533.018.9110.32386.7-6.32580.7
ParticulateTreatment19.627.517.266.7510.8-23.1664.9
DissolvedField182.5225.5112.9187.0404.7116.1127.71356.5
DissolvedTreatment192.6204.5117.4178.4234.4109.1125.51162.0
LS3ParticulateField14.822.617.142.6379.4-13.4489.9
ParticulateTreatment16.926.818.160.6282.9-25.8431.0
DissolvedField203.4231.5136.4209.8311.790.8145.41328.9
DissolvedTreatment194.0219.3131.1220.2289.996.5133.61284.6
HS1ParticulateFieldn.a.n.a.n.a.n.a.n.a.n.a.n.a.n.a.
ParticulateTreatmentn.a.n.a.n.a.n.a.n.a.n.a.n.a.n.a.
DissolvedField147.0116.467.0134.8285.755.382.1888.2
DissolvedTreatment163.874.384.3125.2415.285.5100.51048.7
HS2ParticulateField17.414.27.834.5364.5-18.9457.3
ParticulateTreatment7.07.84.514.7167.7-14.7216.3
DissolvedField226.295.868.0280.13417.1-148.74236.0
DissolvedTreatment140.2102.477.6244.52227.0-134.92926.5
HS3ParticulateField14.814.814.648.01030.5-68.71191.4
ParticulateTreatment5.15.63.811.8260.0-16.1302.5
DissolvedField141.169.781.1197.3858.460.3165.61573.5
DissolvedTreatment123.057.440.0146.6407.635.477.5887.4
n.a.: not available; -: under detection limit
Table 4. Amino acid concentrations in the field and in treatment. Abbreviations: ALA: alanine; ARG: arginine; ASP: aspartic acid; GLU: glutamic acid; GLY: Glycine; HIS: histidine; ILE: isoleucine; LEU: leucine; LYS: lysine; MET: methionine; ORN: ornithine; PHE: phenylalanine; SER: serine; THR: threonine; TYR: tyrosine; VAL: valine; BALA: β-alanine; GABA: γ-aminobutyric acid; LS: low-salinity; HS: high-salinity.
. ALAARGASPGLUGLYHISILELEULYSMETORNPHESERTHRTYRVALBALAGABATotal
ExpSampleGroup(nM)(nM)(nM)(nM)(nM)(nM)(nM)(nM)(nM)(nM)(nM)(nM)(nM)(nM)(nM)(nM)(nM)(nM)(nM)
LS1ParticulateField497.0192.0387.4420.4405.255.5211.0334.1286.016.9-151.4232.2225.55.9300.0-4.73725.2
ParticulateTreatment449.6188.9366.6399.0432.445.6181.1301.8260.423.7-138.0263.8229.457.2259.515.34.93617.2
DissolvedField90.626.3183.4117.0185.7-0.5--2.0--83.922.4-82.6--794.5
DissolvedTreatment49.437.3230.7136.5228.0-26.6--26.6--101.942.7-90.9--970.7
LS2ParticulateField579.6220.3366.4407.8556.055.7213.0392.9364.113.0-184.8294.3365.180.9302.716.73.24416.3
ParticulateTreatment647.7255.3437.0504.4606.769.0254.2440.2417.739.0-207.0303.4400.371.1361.65.86.45026.8
DissolvedField--139.6108.0-----0.0--415.3280.956.7---1100.4
DissolvedTreatment--170.897.236.8----0.0--422.5336.750.3---1114.2
LS3ParticulateField277.2115.7242.7243.9245.228.5110.1178.9122.16.8-79.5141.3130.324.6156.1-3.52106.5
ParticulateTreatment272.8114.2254.3250.2253.528.1109.7172.7126.614.0-79.1145.0137.31.2156.3-4.72119.8
DissolvedField-88.5188.7113.014.1----0.0--379.1324.270.3---1177.9
DissolvedTreatment-114.5171.591.67.8----0.0--393.7303.251.1---1187.0
HS1ParticulateField307.2137.4286.1311.2362.440.8134.6217.0167.943.4-101.3207.7160.372.3181.6-3.72734.8
ParticulateTreatment113.545.4125.3123.3129.714.051.578.556.84.6-38.066.862.12.769.8-2.4984.2
DissolvedField-17.9121.9115.38.5----0.0--5.9100.215.1---384.9
DissolvedTreatment-7.086.846.0-----0.0--4.960.218.6---223.4
HS2ParticulateField381.4146.7328.3341.1364.637.9152.4245.9235.212.3-119.4179.3248.636.4211.1-4.53045.0
ParticulateTreatment54.621.356.753.262.627.023.636.934.53.2-19.129.935.413.232.43.20.6507.3
DissolvedField100.7-111.757.9220.0----84.2-----41.8--616.2
DissolvedTreatment107.5-106.848.7205.0----92.8-----33.8--594.6
HS3ParticulateField267.2109.0249.1252.5317.224.2106.8179.5164.97.5-87.8163.2183.330.1147.914.14.12308.7
ParticulateTreatment85.633.091.683.1111.49.437.760.046.43.3-29.754.051.112.951.81.61.1763.6
DissolvedField92.3-94.659.7117.1----66.5-----29.2--459.4
DissolvedTreatment80.0-77.032.398.8----53.7-----13.0--354.7
Table 5. C- and N-yields in hydrolysable neutral aldose (NA) and hydrolysable amino acid (AA) fractions. CY and NY denote C- and N-yields, respectively. LS and HS denote low- and high-salinity samples, respectively.
NA-CNA-CYAA-CAA-CYAA-NAA-NY
ExpSampleGroup(μM C)(%)(μM C)(%)(μM N)(%)
LS1ParticulateField13.1313.4%17.0417.3%4.7031.8%
ParticulateTreatment4.983.7%15.0311.3%4.1419.6%
DissolvedField7.902.5%2.890.9%0.872.6%
DissolvedTreatment7.672.9%3.661.4%1.013.9%
LS2ParticulateField15.4617.3%20.2122.7%5.5542.9%
ParticulateTreatment3.953.2%19.8416.0%5.4826.9%
DissolvedField7.902.5%3.981.3%1.003.0%
DissolvedTreatment6.732.6%4.311.7%1.114.0%
LS3ParticulateField2.733.5%9.5512.3%2.6324.7%
ParticulateTreatment2.593.2%9.4811.7%2.6522.7%
DissolvedField7.691.8%4.951.2%1.444.1%
DissolvedTreatment7.442.0%4.701.3%1.484.3%
HS1ParticulateFieldn.a.n.a.12.5045.8%3.4078.7%
ParticulateTreatmentn.a.n.a.4.3914.8%1.2124.5%
DissolvedField5.183.7%1.741.2%0.443.1%
DissolvedTreatment6.114.5%1.040.8%0.241.7%
HS2ParticulateField2.729.1%13.8746.4%3.8076.1%
ParticulateTreatment1.284.0%2.357.3%0.6613.7%
DissolvedField25.2014.8%2.111.2%0.624.5%
DissolvedTreatment17.3511.2%2.041.3%0.594.4%
HS3ParticulateField7.0729.3%10.3242.8%2.8579.6%
ParticulateTreatment1.806.7%3.4112.7%0.9317.6%
DissolvedField9.196.5%1.671.2%0.464.0%
DissolvedTreatment5.213.9%1.240.9%0.353.3%
Table 6. Enrichment factors of individual neutral aldose in the particulate phase. LS and HS denote low- and high-salinity, respectively.
LS1LS2LS3HS2HS3
Fucose0.84 ± 0.040.77 ± 0.051.14 ± 0.220.40 ± 0.120.35 ± 0.08
Rhamnose0.75 ± 0.020.83 ± 0.131.18 ± 0.190.55 ± 0.110.38 ± 0.06
Arabinose0.79 ± 0.020.91 ± 0.101.06 ± 0.130.58 ± 0.190.26 ± 0.11
Galactose0.78 ± 0.090.61 ± 0.141.42 ± 0.200.43 ± 0.060.25 ± 0.03
Glucose0.32 ± 0.010.21 ± 0.010.75 ± 0.160.46 ± 0.160.25 ± 0.11
Mannosen.a.n.a.n.a.n.a.n.a.
Xylose1.32 ± 0.051.21 ± 0.221.28 ± 0.160.78 ± 0.220.23 ± 0.07
n.a.: not available.
Publisher’s Note: MDPI stays neutral with regard to jurisdictional claims in published maps and institutional affiliations.

