1. Introduction
At present, the global ecological and hydrological processes are undergoing significant changes because of the influence of global climate change and anthropogenic activities [
1,
2,
3]; therefore, it has become one of the most popular research subjects in the field of hydrology. The Loess Plateau, located in the semi-humid and semi-arid region of China, is generally considered to be one of the most eroded areas in the world. It is also a vital agricultural area in China, and the Yellow River flows here [
4,
5]. Since the 1950s, a series of comprehensive water- and soil-conservation acts have been carried out to protect and restore ecological environment, and this has alleviated the over-utilization of arable land and increased the vegetation coverage. Due to the implementation of these measures, many significant changes have taken place in the area; moreover, it had a great influence on the biophysical conditions of streamflow and sediment regime, and played a great role in soil erosion control [
6,
7,
8,
9].
Previous studies show that, with the variation of the basin’s underlying land surface, soil texture, hydrogeological characteristics and rainfall, the hydrological process of precipitation’s recharge to river flows and groundwater has also changed [
8]. At the same time, the influence of anthropogenic activities on hydrological processes mainly occurs after rainfall falls to the ground and affects hydrological processes with the evaporation, infiltration, flow production and convection changes. Therefore, understanding the synergies between hydrological regime, climatic factors and anthropogenic activities, especially land-use/cover change, is of great importance for water resource management and ecologically sustainable development in the basin [
5,
10].
In recent years, there have been many studies on soil erosion, sediment and streamflow production, vegetation restoration, land use and climate change on the Loess Plateau [
11,
12,
13,
14,
15,
16,
17,
18], but the Beiluo river is not involved. Beiluo River is the first tributary of the Wei River and the second tributary of the Yellow River. It is one of the main areas for the project of returning farmland to forest and grassland, so it is of special significance to study this basin. He et al. (2016) [
19] analyzed the variation trend of runoff in Beiluo River on loess Plateau, and they concluded that the annual runoff showed a significant decreasing trend, in addition to the decrease of precipitation and the increase of potential evapotranspiration; the change of the two was not significant, but runoff characteristics of the Beiluo River have not been detected at a deeper level. Liu et al. (2015) [
10] studied the causes of runoff changes in the upper reaches of the Beiluo River by using a double-accumulative curve and statistical analysis, and they concluded that intense human activity was the main cause of the decrease in the runoff, as compared to climatic factors, but they did not detect the causes of runoff changes in different periods. Zhang et al. (2018) [
20] applied the Mann–Kendall test and the Budyko framework to investigate the causes of changes in runoff of the Beiluo River. They concluded that land-surface changes played a dominant role in runoff reduction, but they lacked an abrupt point year of the runoff in the Beiluo River. There are certain space–time differences in climate change in a basin, and it is necessary to make an analysis of runoff changes and their leading factors to study the response of runoff to climatic factors and non-climatic factors under the unique conditions of the Beiluo River.
The purposes of this study were to analyze the characteristics of runoff changes in the Beiluo River Basin, quantify the effects of changes in climatic factors (includes precipitation and temperature) and non-climatic factors on runoff changes and identify the causes of changes in runoff in different periods. These results can provide theoretical support for water resources planning and comprehensive management in the Beiluo River Basin.
2. Materials and Methods
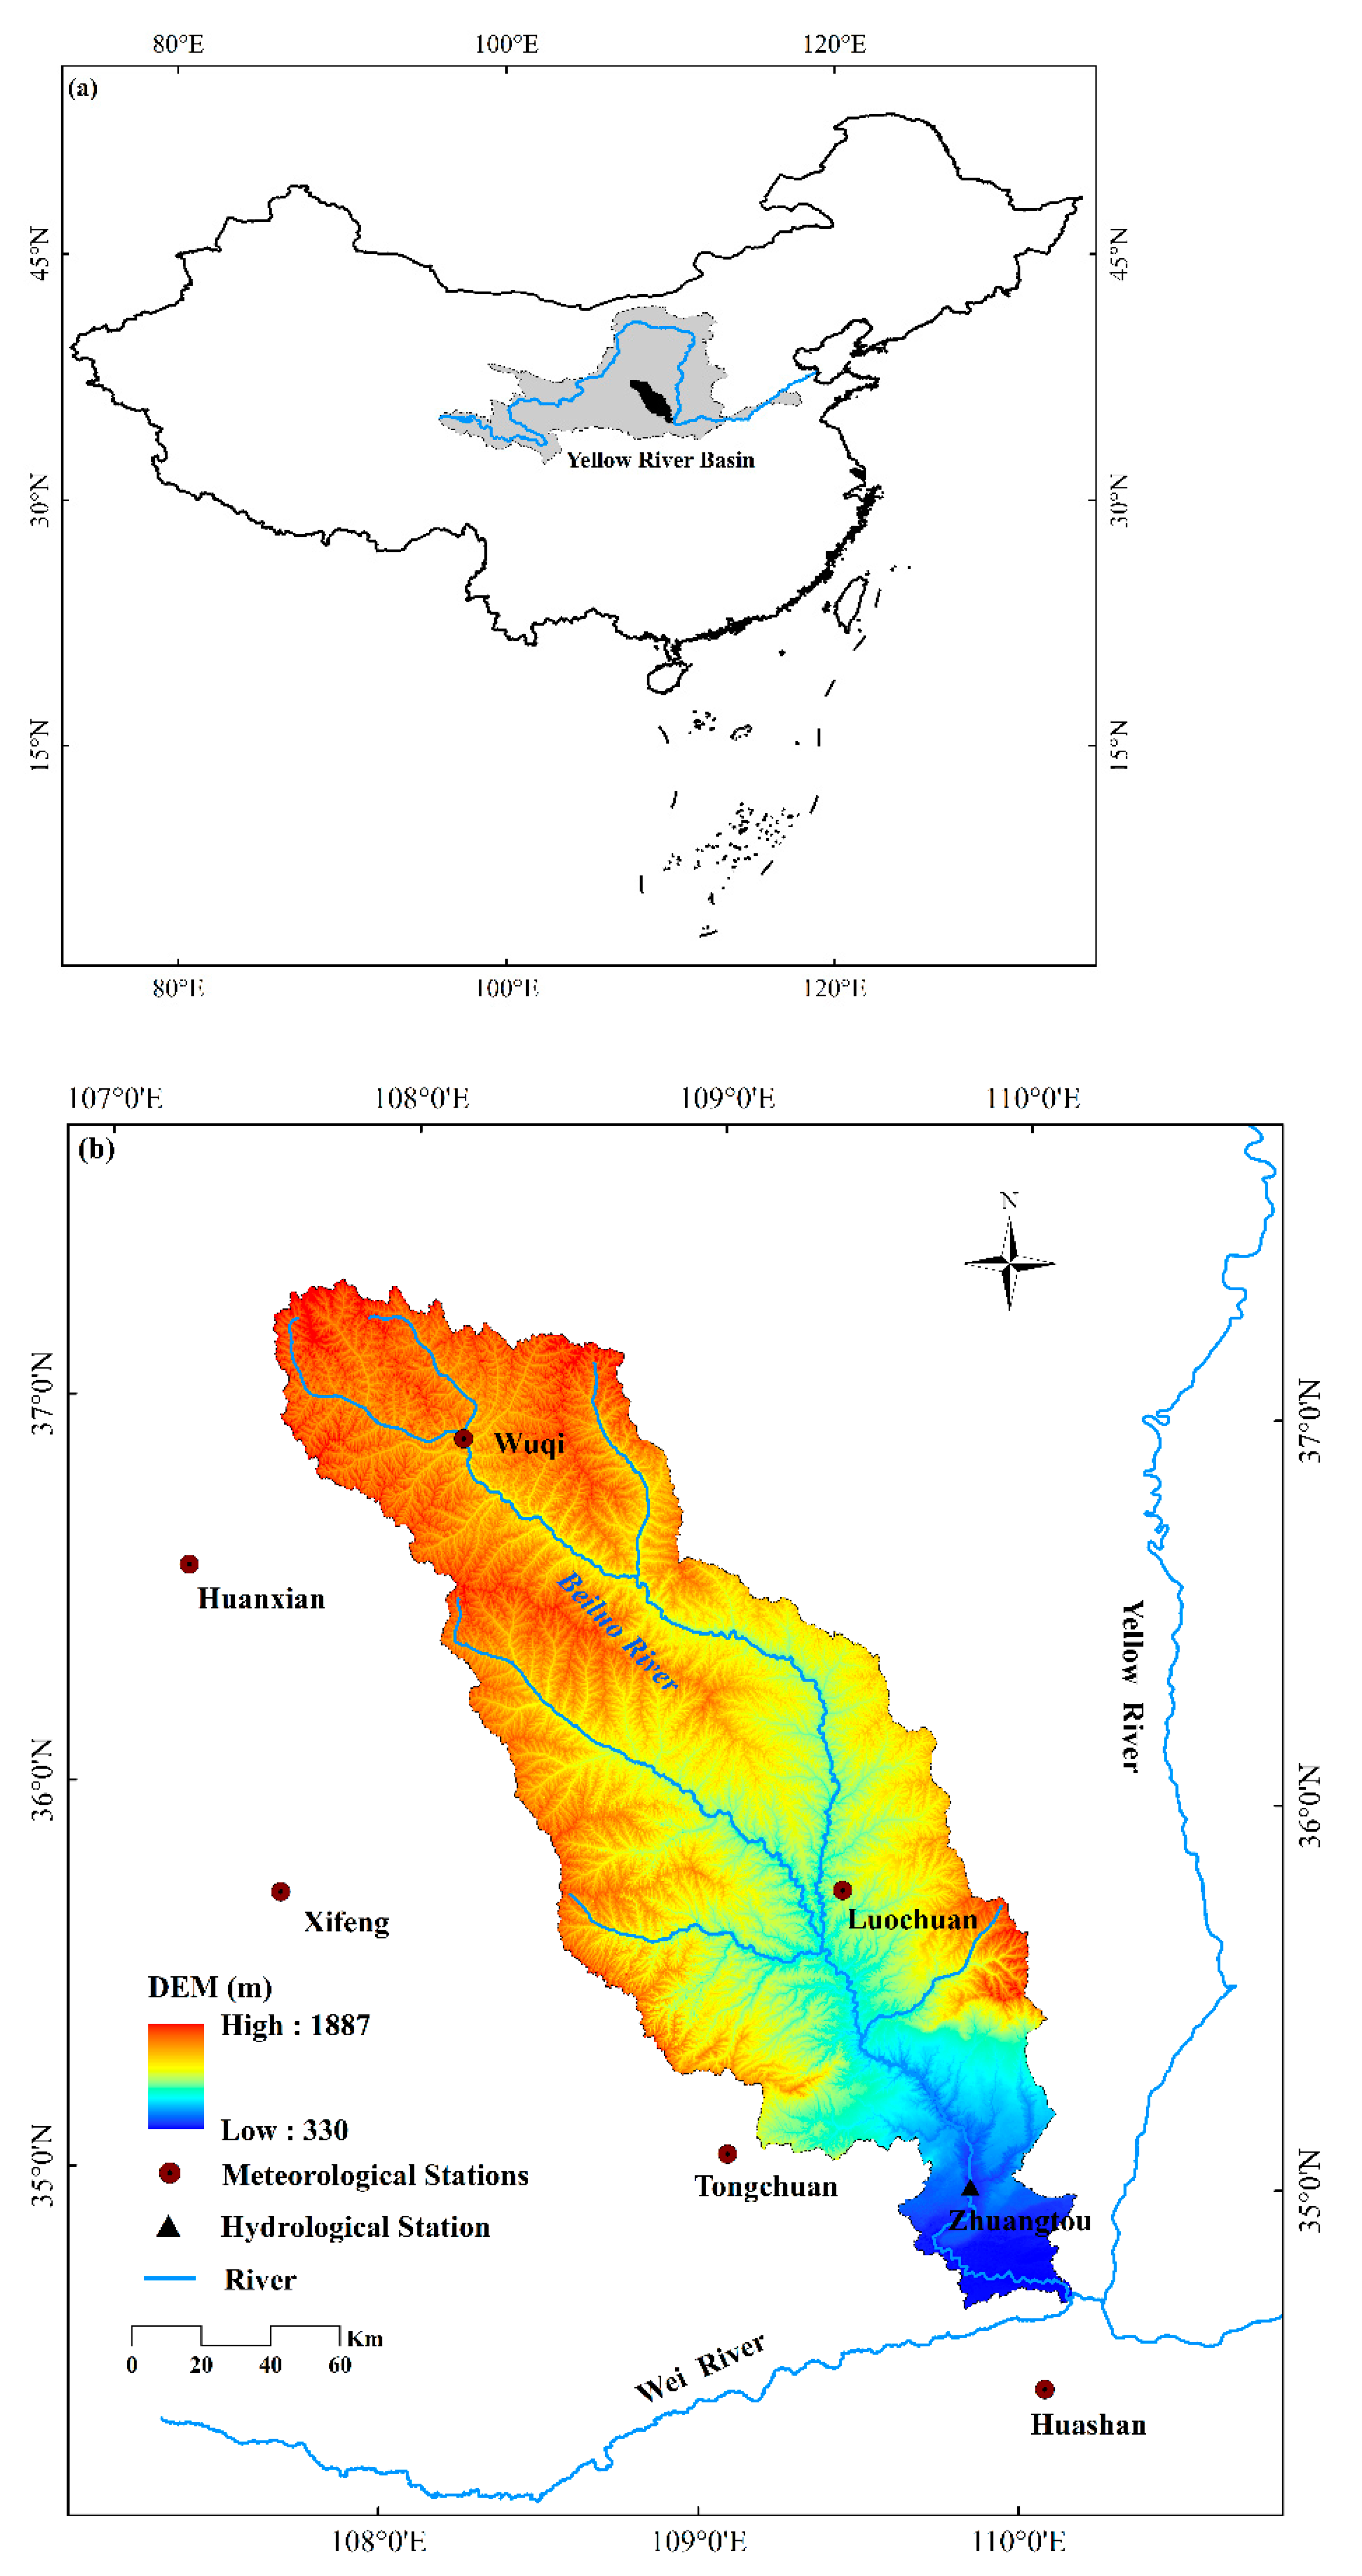
2.1. The Study Region
The Beiluo River originates from the Weiliang Mountain in Dingbian County, Shaanxi Province, and is a tributary of the Wei River, a secondary tributary of the Yellow River, with a total length of 680 km and an area of 26,900 km
2 (
Figure 1). The terrain is broken, the ravine is horizontal, belongs to the hilly ravine area of the Loess Plateau and shows obvious strip type. The Beiluo River is a continental monsoon climate with average annual temperature of 7.5 °C and an average annual precipitation of 510 to 540 mm, which decreases from south to north and from east to west. The average annual runoff is 8.17 × 10
8 m
3, and the main soil types in the upper and middle reaches are wind sand, loess and black calcium soil. Soil particle structure is porous, easy to collapse and lose. There are only black loam soil and rice soil in the downstream, and these are beneficial to agricultural production.
2.2. Data Collected
The daily average streamflow dataset at Zhuangtou hydrological station for the period 1970 to 2018 could be derived from the
Hydrological Year Book of the Yellow River Basin, which was issued by the Ministry of Water Resources of the People’s Republic of China. Daily precipitation datasets of 6 national meteorological stations for the period 1970 to 2018 within and outside the Beiluo River Basin were collected from the Yellow River Commission Committee (YRCC), and daily average air-temperature datasets of 6 national meteorological stations for the period from 1970 to 2018 were available from the National Meteorological Information Centre (Available online:
https://www.nmic.cn/ (accessed 1 July 2021) (
http://data.cma.cn (accessed 1 July 2021)). The land-use data (1980, 2015) were obtained from the Data-Sharing Network of China Earth System Science (Available online:
http://www.geodata.cn/ (accessed 1 July 2021)); furthermore, data were processed by software named ArcGIS. The quality of the data used in this study was checked by the appropriate agencies before the release.
2.3. Separation of Baseflow
In arid and semi-arid areas, the baseflow is an important part of river streamflow, and it is also an indispensable index to reflect the change of streamflow regime, which plays a significant role in maintaining the healthy and stable ecological environment of the basin. Based on the daily average measured runoff data of the Zhuangtou hydrologic station, the daily baseflow is estimated by using the two-parameter digital filter separation (F1) method [
21], and Eckhardt’s filter method can achieve relatively stable and accurate baseflow separation, which is the most suitable baseflow separation method in the Loess Plateau area [
22]. In the article, there is the “automatic baseflow separation procedure” in the “Hydrological Utility Package” (Available online:
http://www.yibaipin.com/ (accessed 1 July 2021)), which is helpful to calculate the baseflow. Eckhardt’s filter method was applied in the process of automatic baseflow separation procedure.
2.4. Streamflow Record Analysis
Twenty statistical indexes were selected to characterize the variation characteristics of annual and quarterly streamflow and baseflow for flow records; the main indicators are frequency indexes named flow-exceedance deciles (
Q10,
Q20, …,
Q90); extreme indexes (
Max1,
Max7,
Max30,
Min1,
Min7 and
Min30), 1, 7 and 30 represent the flow for consecutive days of 1, 7 and 30; low-streamflow and high-streamflow variability rates are
and
;
streamflow divided by the median annual (or quarterly) streamflow (
), which provides an overview of how the FDC (flow-duration curve) changes over time [
23]; and frequency of days with low or high streamflow (
and
).
means the number of days during the annual or quarterly when the average daily flow is less than or equal to the long-term
flow.
indicates the number of days that the average daily flow is greater than or equal to the long-term
flow. The above rates are calculated on the basis of streamflow and baseflow. These flow records can reflect overall hydrological characteristics of a basin [
24].
2.5. Trend Analysis
Mann–Kendall test analysis [
25,
26] is a nonparametric statistical test method. It can not only quantify the overall trend of hydrometeorological elements, but also greatly reduce the impact of abnormal values on the results. Therefore, it is widely used in the trend study of hydro-meteorological sequences [
27,
28,
29,
30,
31,
32,
33]. It is necessary to remove any serial correlation before using the Mann–Kendall trend test [
34]. The study used the trend-free pre-whitening (TFPW) method to make trend analysis [
35]. From the trend test results of M–K, a Z statistic could be acquired, whose value is positive, indicating an upward trend, and vice versa.
2.6. Abrupt Point Analysis
The abrupt point analysis was used to determine the year when the streamflow records of the Beiluo River were likely to be abrupt. There is a robust non-parametric method [
36], which can quickly and accurately identify abrupt points at a significant level of 5%.
2.7. Flow-Duration Curves
The flow-duration curve (FDC) represents the relationship between the occurrence frequency of the flow and the flow in a certain period of time (day, month or year) in a basin, regardless of the continuity of time. It indicates the percentage of time that is greater than or equal to a certain flow in the whole time series. Based on long time-series daily flow, the FDC is one of the most effective methods for analyzing the distribution characteristics and variation of streamflow in a basin [
37,
38,
39].
2.8. Separating Effects of Climate from Land-Use/Cover Change
The following formulas are used to calculate the change in the average annual streamflow of a basin:
where
is the total change of average annual streamflow,
is the annual streamflow in the initial period, and
is the annual streamflow after the abrupt point. At the same time, the total change in annual streamflow can also be calculated according to the following equation:
where
is the change in average annual streamflow affected by climate variability;
is the change in average annual streamflow because of land-use/cover change (LUCC).
can be expressed by Milly and Dunne [
40] as follows
where
are
are changes in precipitation,
and
; monthly potential evapotranspiration (
) was obtained by using the Blaney–Criddle method, which is recommended by FAO [
41], and then accumulated to the annual value of
; and
and
are the flow sensitivity coefficients to
and
calculated as follows [
42]:
where
is the index of dryness, which is equal to
/
, and
is a fitted model parameter related to vegetation and soil type [
43]. In the paper,
= 1.22 is computed by formula recommendation [
20,
43].
This study used a narrative method to determine with the LUCC data in the Beiluo River Basin since 1980.
2.9. Double-Mass-Curve Analysis
In recent years, the double-mass curve (DMC) [
44] method performed well in field hydrology contribution analysis [
45]. In this study, the DMC method was conducted to identify the contribution of precipitation and anthropogenic activities to streamflow variation. It is based on abrupt-point recognition in order to divide the study period into two parts: baseline period and change period [
46]. By this method, the relationship between cumulative streamflow and cumulative precipitation is established. The main procedure is listed as follows:
Among them, Formula (6) is exactly the same as Formula (1).
where
is the total change of average annual streamflow,
is the change of average annual streamflow caused by precipitation variability, and
is the change of average annual streamflow caused by human activities. The relationship between the cumulative streamflow and cumulative precipitation in the baseline period is calculated by Mu et al. (2010) [
45]:
where
and
are two coefficients, respectively.
Formula (8) is used to predict the streamflow in the change period. The difference in values of streamflow between the baseline period and change period is the same as the values of streamflow affected by human activities, and it can be expressed as follows:
where
is the annual average predicted streamflow according to the regression equation between the cumulative streamflow and cumulative precipitation in the baseline period, and
means the same as in Equation (1).
3. Results
3.1. Trend Analysis of Flow Records
3.1.1. Trend of Streamflow and Baseflow
Table 1 shows the results of the Mann–Kendall trend analysis for annual and quarterly streamflow and baseflow records in the Beiluo River basin. Of the 180 trend tests, only 33 show no significant trends, while 147 of 180, 82% for all of the flow records show statistically significant trends (
Table 1). Among them, 146 of 147 flow records show significant downward trends. Overall, the annual and quarterly mean streamflow and baseflow also show a significant downward trend.
3.1.2. The Trend of Flow-Exceedance Percentile
The high-frequency and low-frequency events of annual and quarterly streamflow or baseflow in the Beiluo River Basin overwhelmingly show a significant downward trend, and no significant downward trend in of annual and October–December streamflow, of annual baseflow, and of April–June streamflow and and of July–September streamflow, which are 7 of 90 records (8%) of flow-exceedance percentile.
3.1.3. Trend of Flow Extremum Consecutive
A vast majority of maximum and minimum average daily flows during 1, 7 and 30 consecutive day records indicate downward trends in annual and quarterly, but not significant downward trends in of July–September baseflow, and of October–December streamflow, of July–September flow and of July–September and October–December streamflow, which are all concentrated in the second half of the year. The same non-significant in minimum average daily flows during 1, 7 and 30 consecutive day records are concentrated in the first half of the year, for example, of January–March baseflow; of January–March baseflow and April–June streamflow, as well as of October–December streamflow; all of the above are 10 of 60 records (17%) of flow extremum consecutive.
3.1.4. Trend of Streamflow Variability
Records of in every quarter streamflow show non-significant downward trends; on the contrary, the annual rate shows a significant downward trend, which indicates steepening of the low-streamflow part of the FDC, corresponding to a decrease in low-streamflow variability over time. However, for the records, which indicate either a significant downward trend or a non-significant upward trend corresponding to a pattern of decreasing in high-streamflow variability over time.
3.1.5. Frequency of Days with Low or High Streamflow
There is a significant upward trend related to the in the annual record, meaning that the frequency of days with low streamflow may become higher and higher over time. Test records of indicate significant (annual, January–March and April–June seasons) or non-significant (July–September and October–December seasons) downward trends in the number of high-streamflow days.
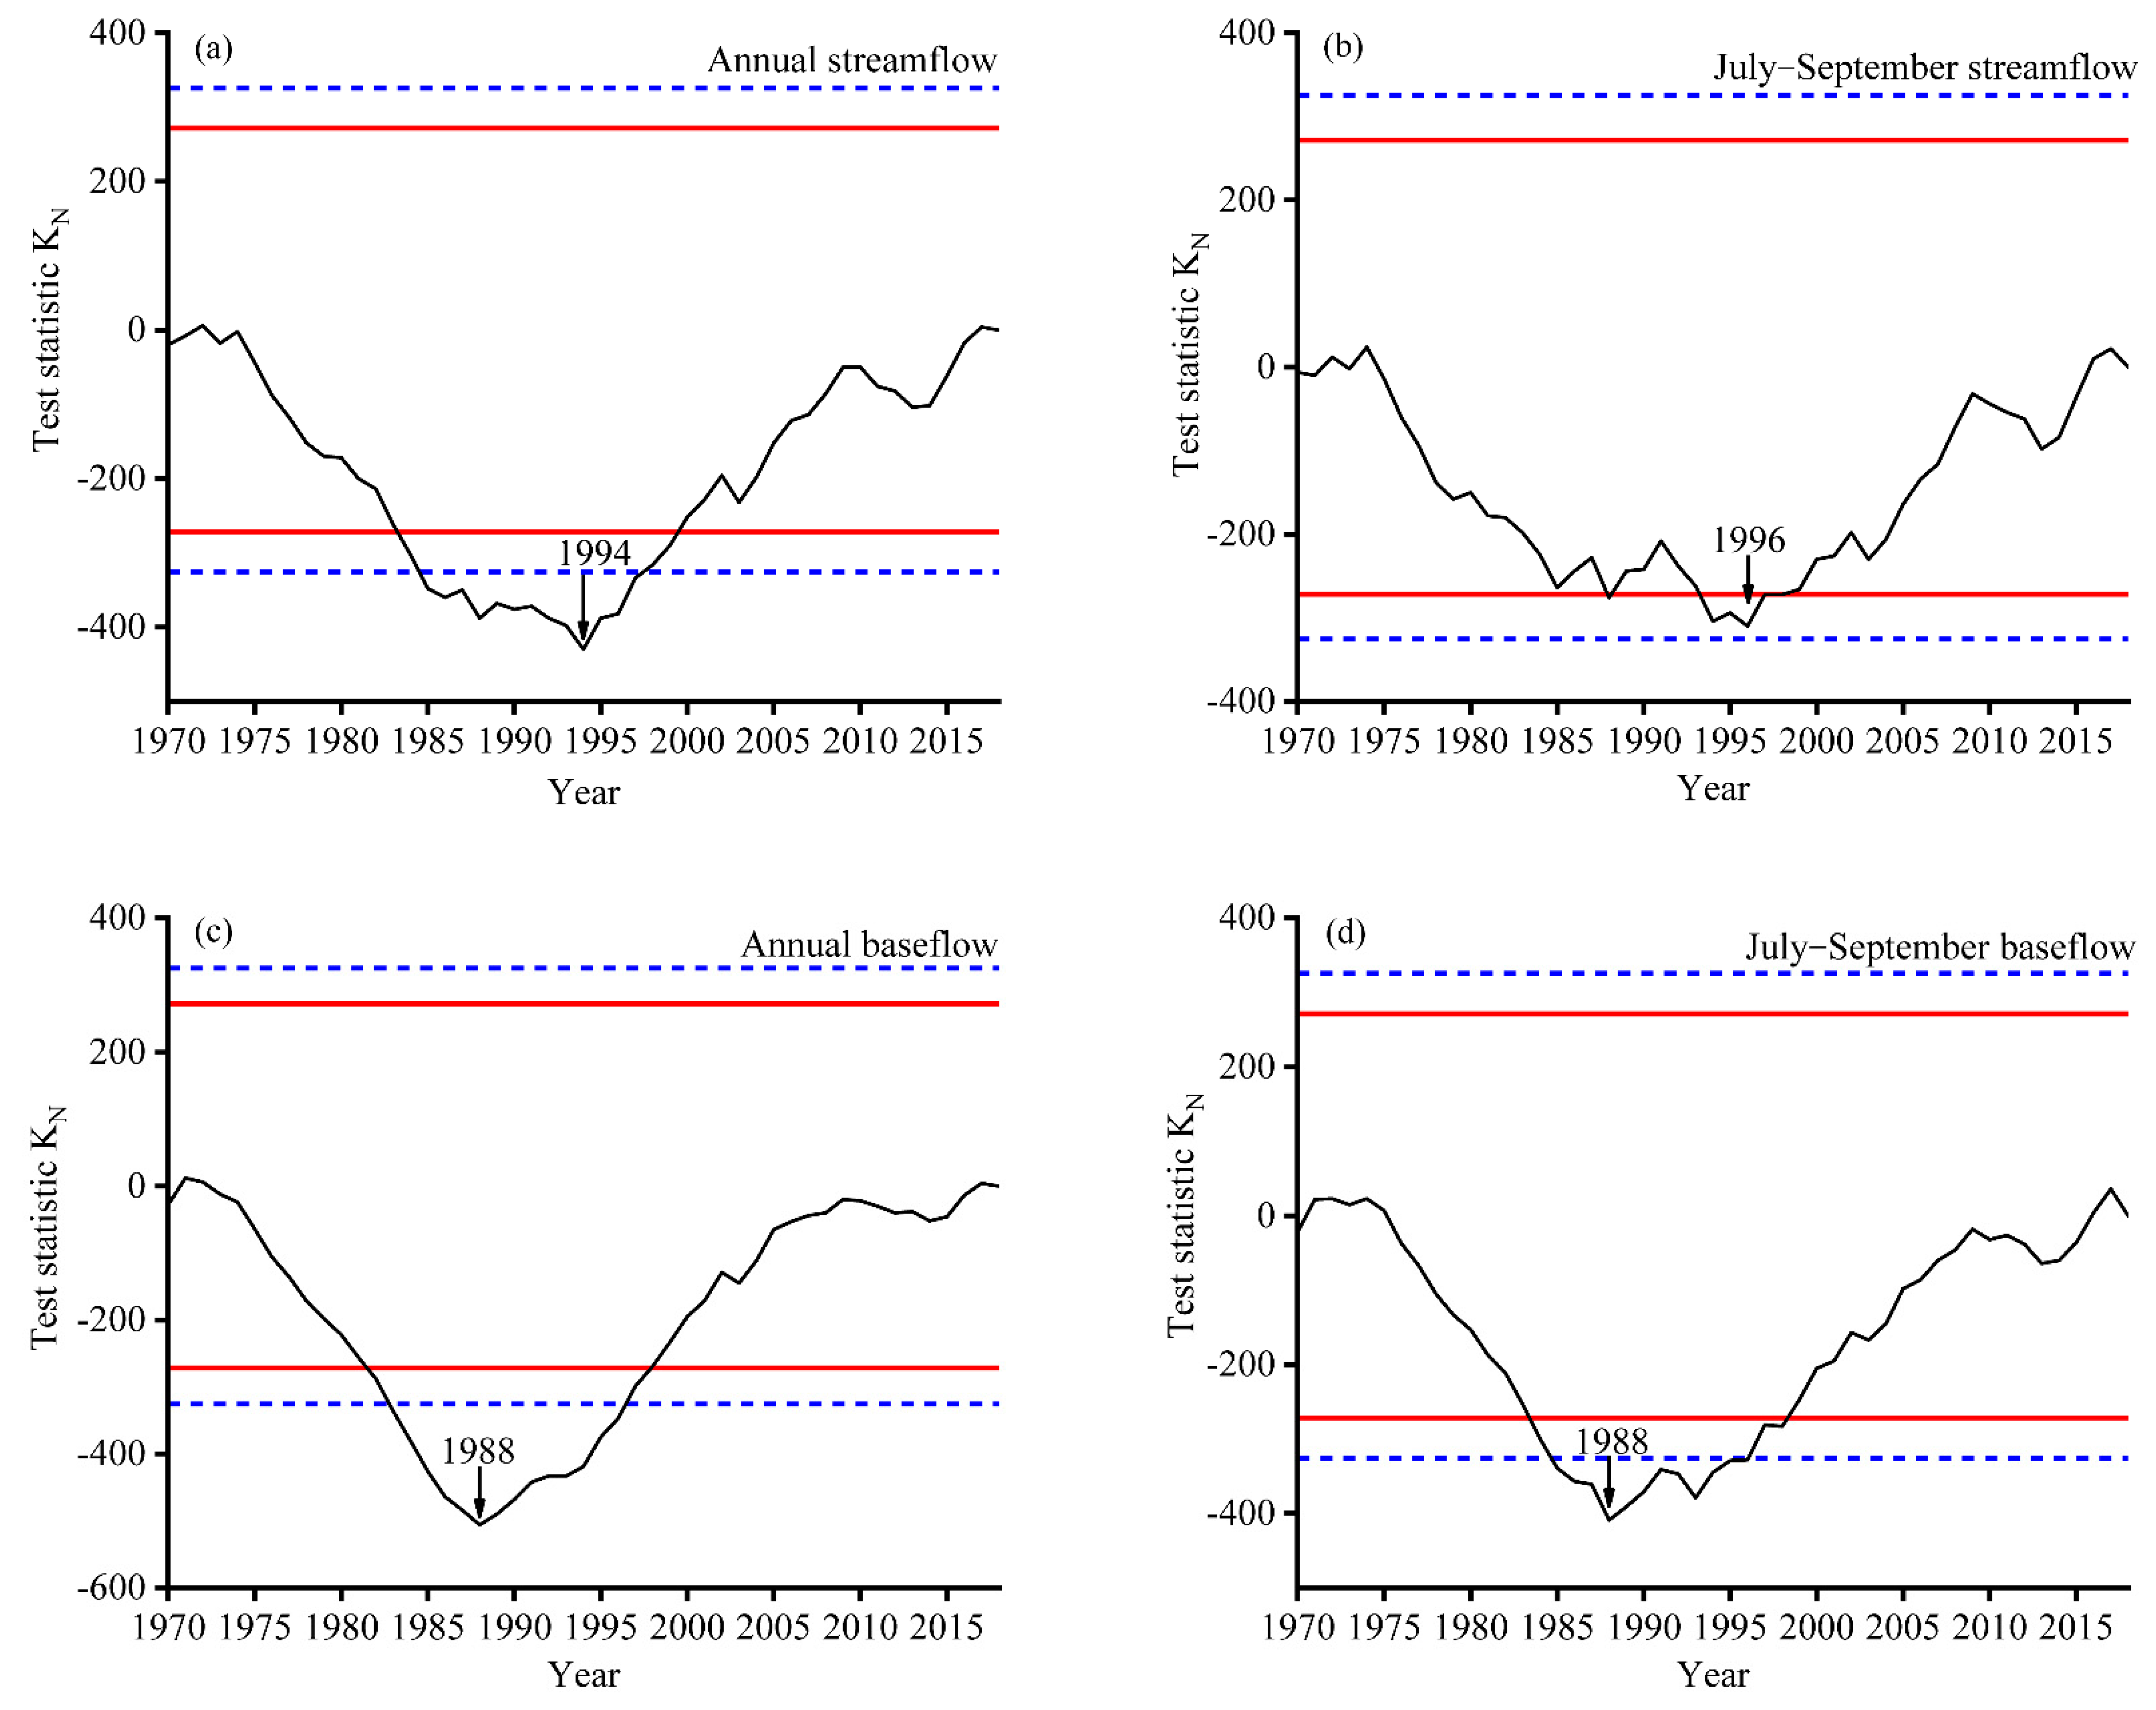
3.2. Abrupt Points Analysis of Flow Records
3.2.1. Abrupt Points in Streamflow and Baseflow
The results of the abrupt-point test for each annual and quarterly index streamflow and baseflow record are summarized in
Table 2. All of the abrupt points that were described below are statistically significant. Abrupt points in index streamflow and baseflow records were detected in 159 of 180 tests (88% of the records). Almost all of the abrupt points indicate a downward shift. The abrupt points were detected in 1994 and 1988 with downward shift of streamflow and baseflow in annual, as well as in 1996 and 1988 with downward shift of streamflow and baseflow in the July–September season (
Figure 2). Many of the abrupt points (75 of 159, or 47%) indicate a shift in 1987; 27 of 159 abrupt points records show a shift in 1988, and 14 of 159 records show a shift in 1994. An additional 43 abrupt points indicate shifts in 1986, 1990–1993, 1996, 1999 or 2003. As a result, most of the abrupt points in annual and quarterly records accumulated (112 of 159, or 70%) show a shift in streamflow and baseflow during the period 1986–1988. Abrupt points during the period 1990–1993 generally were tested in April–June quarters records of streamflow.
3.2.2. Abrupt Points in Flow-Exceedance Percentile
For the high-frequency streamflow and baseflow, all abrupt points were identified in 1987 in annual and October–December records, which showed downward changes. Similar downward changes occurred in 1987 and 1989 for the January–March records; in 1987 and 1991 for the April–June records; and in 1988, 1990 and 1993 for the July–September seasons. However, what the data from low-frequency streamflow and baseflow show is that there were abrupt points detected in 1987 for the January–March records. Moreover, there were at least three abrupt points with downward shift in the other three quarterly and annual records.
3.2.3. Extremum Consecutive
Between 1987 and 1994, the abrupt points of maximum average daily flows in consecutive records of 1, 7 and 30 days were detected, with every quarterly record moving downward. The abrupt points of annual flows records were 1988, 1996 and 2003 with downward shifts. For the abrupt points of minimum average daily flows, there was only one abrupt point identified in 1986 for the January–March flows records and in 1987 for the April–June flows records. Instead, two abrupt points were detected for the annual and October–December flow records, and four abrupt points were detected for July–September.
3.2.4. Abrupt Points in Streamflow Variability
The abrupt-point tests on the five index records of identified 4 abrupt points in either 1987 or 1988, which indicates a downward shift in low-streamflow variability, but for records, only one abrupt point was detected in 1987 in the April–June with an upward shift that corresponds to an increase in high-streamflow variability for this quarter.
3.2.5. Abrupt Points in Frequency of Days with Low or High Streamflow
The abrupt point in 1991 in the annual record indicates an increase in the number of annual days with streamflow less than the long-term . The same shift in 1992 for the April–June record and in 1988 for the July–September record. However, in the January–March and April–June records, 1991 as the abrupt point of both was identified with a downward in the two quarters, thus indicating a decrease in the yearly count of days with a streamflow greater than the long-term .
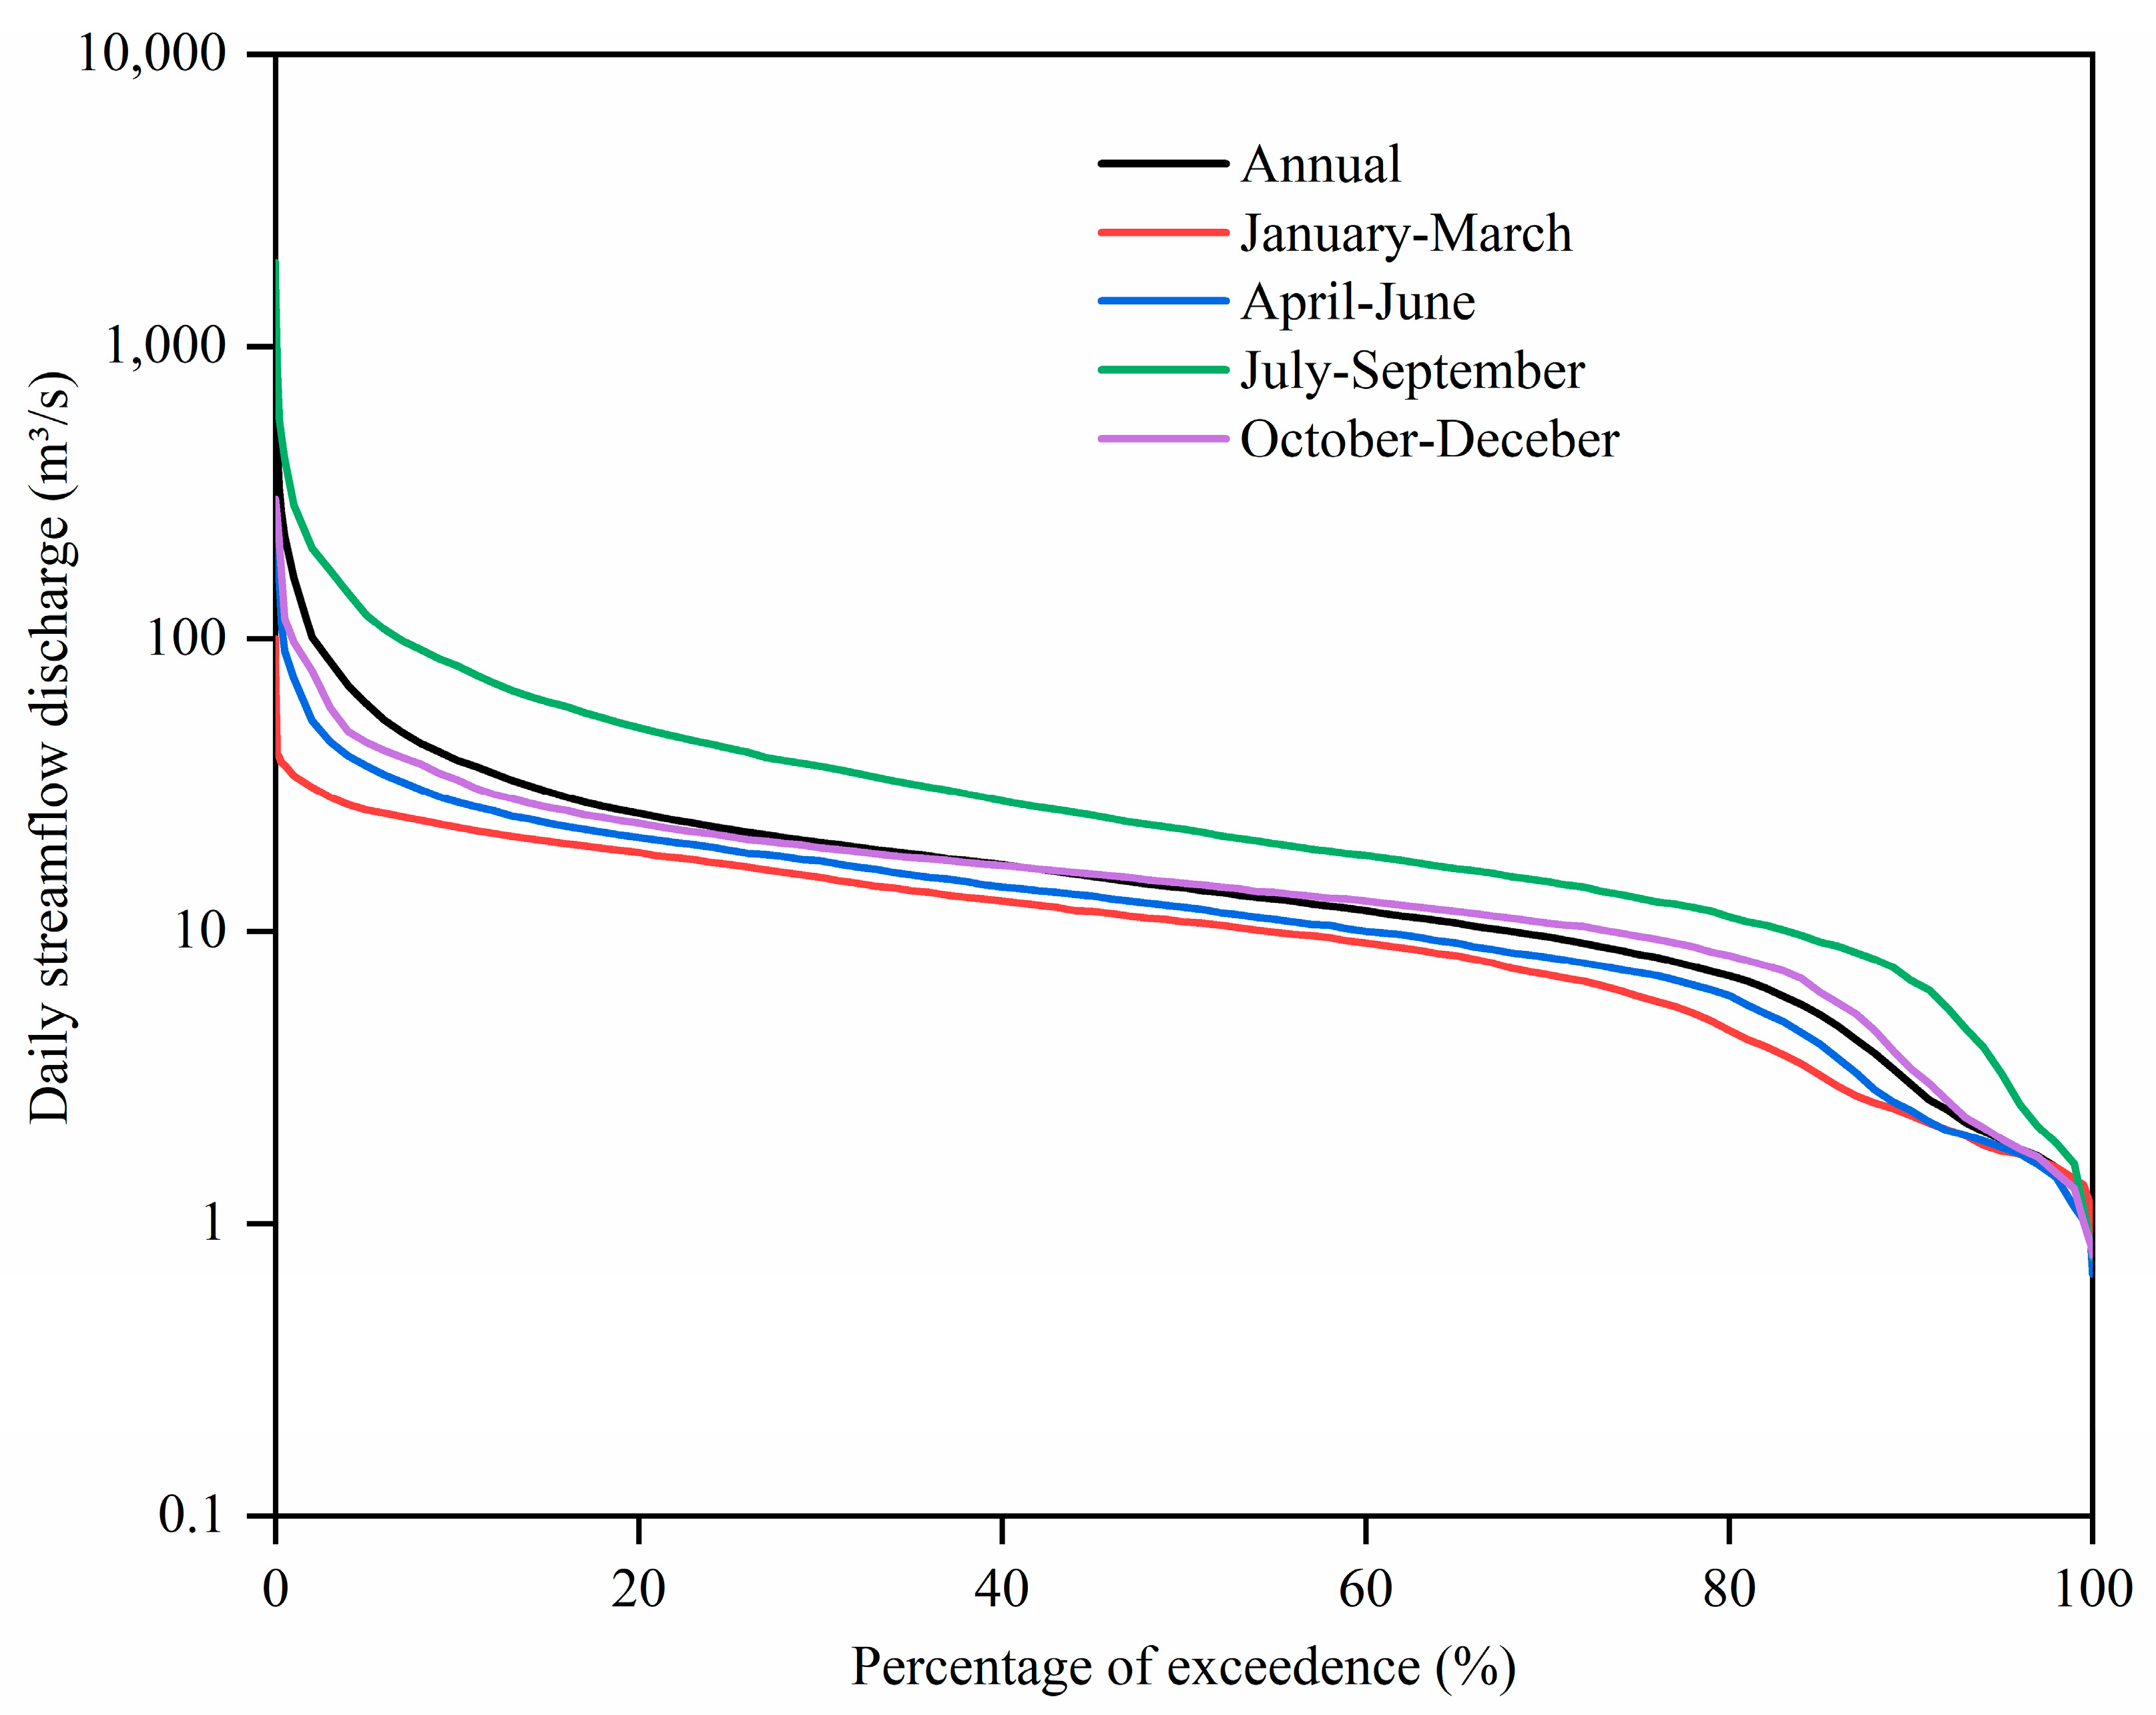
3.3. Characteristics of Streamflow-Duration Curves in the Different Quarters
It shows the FDCs of daily streamflow records for each year and season of the Beiluo River Basin from
Figure 3. On the whole, for the first, second and fourth quarters, FDCs move up gradually over time, indicating that the daily streamflow has a gradual increasing trend.
of streamflow for annual, January–March, April–June, July–September and October–December seasons are 14.10, 10.8, 12.10, 22.30 and 14.60 m
3/s, respectively.
Between
and
, the FDCs slopes are relatively gentle; the FDCs of the April–June and October–December quarters are approximately horizontal, especially in October–December quarter, which indicates in addition to high and low streamflow. During this quarter, the daily streamflow of the Beiluo River is similar in size and has less variation in most cases. For the low-streamflow, the FDC of the annual moves down over the percentage of exceedance; however, the FDC of the October–December quarter moves up gradually. To further reflect the difference in the daily streamflow variation of the basin,
Table 3 lists the low-streamflow variability rate (
) and high-streamflow variability rate (
).
The changes between 2.41 and 5.43 for different quarters, and the streamflow variability of July–September is the greatest in five records, whereas the streamflow variability of the January–March season is the least. The varies between 0.13 and 0.16, with the January–March showing much greater variability than the others, and the streamflow variability of the October–December season is the minimum.
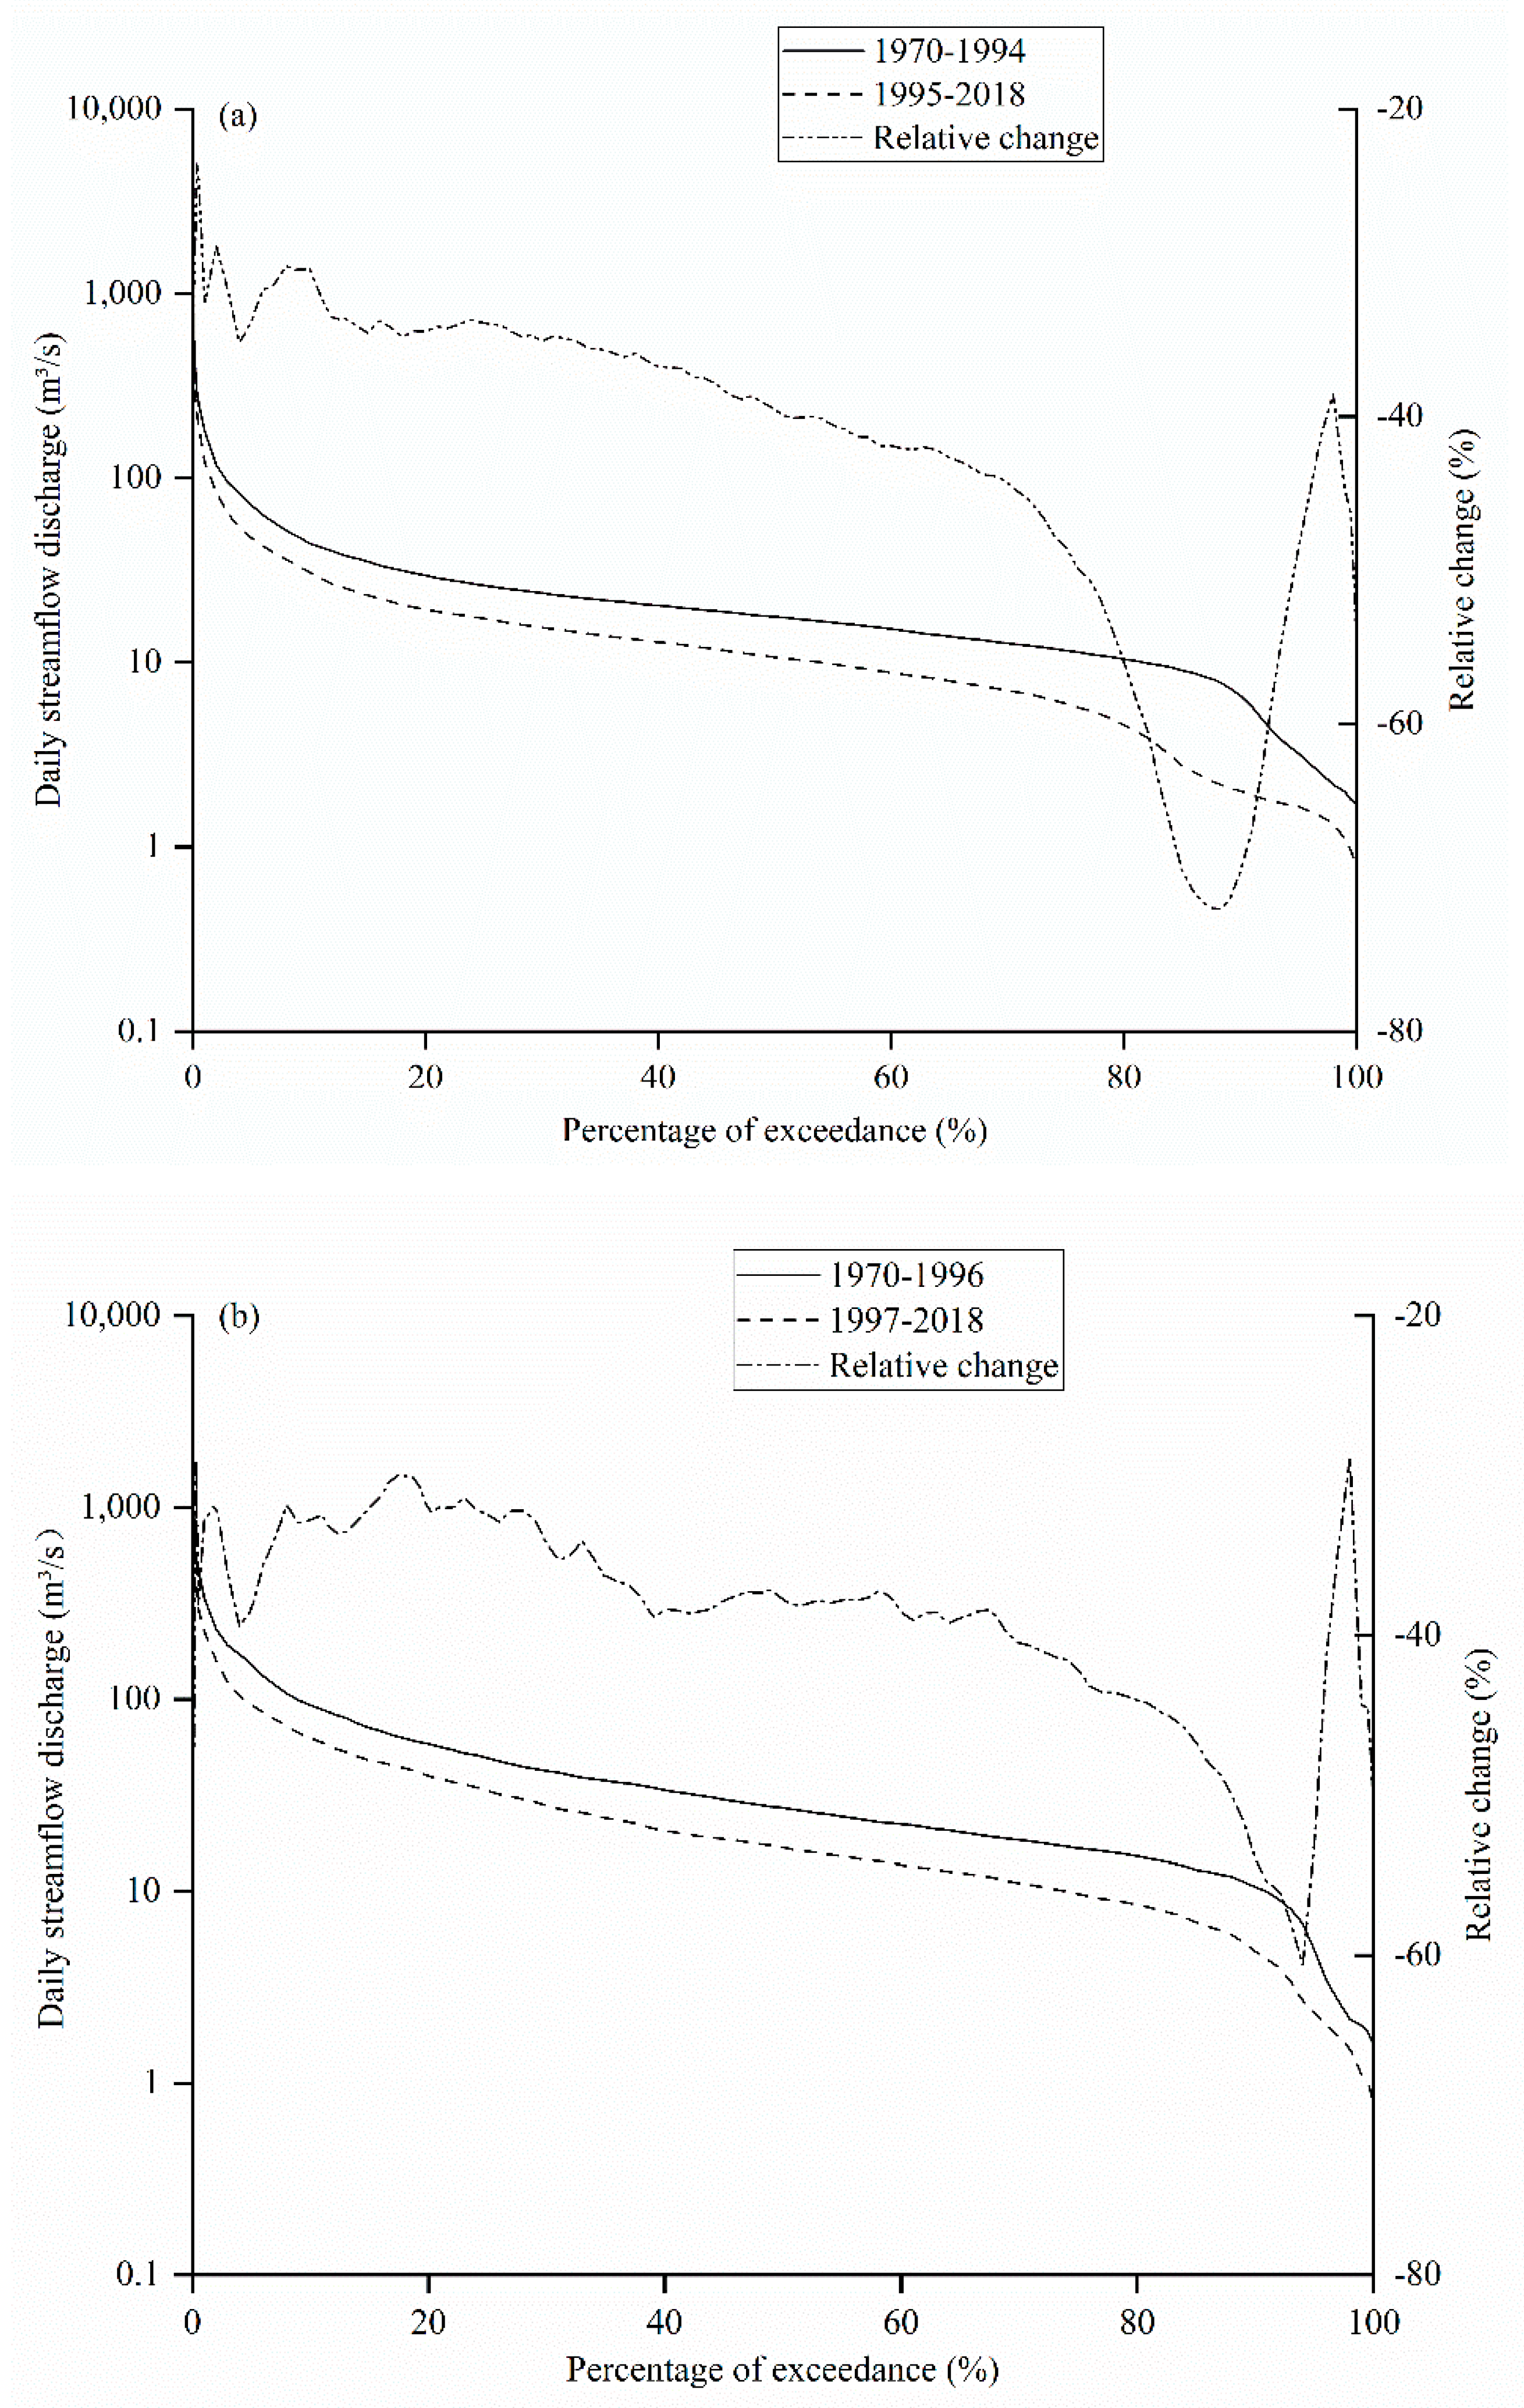
3.4. Changes in Daily FDCs before and after Abrupt Point Year
The abrupt points of streamflow were detected in 1994 for annual data and in 1996 for July–September quarter data, respectively. Therefore, according to the critical year of significant variation of streamflow in Beiluo River Basin, the daily streamflow series of the basin is divided into two periods (
Figure 4), and the various characteristics and laws of daily streamflow are compared and analyzed through the daily FDCs.
Table 4 lists the characteristics of the daily FDC of streamflow discharge.
Before and after the abrupt point year, the daily streamflow discharge of Beiluo River Basin in annual decreased more obviously than the July–September quarter; the daily streamflow discharge in annual and the July–September quarter decreased by at least 20% with the increase of percentage of exceedance, within 40% in most cases. For annual, it decreased by more than 70% at the frequency of 90%, for July–September quarter, and it decreased by more than 60% at the frequency of 95%. Overall, the variation trend of FDC of daily streamflow was basically similar to that of July–September, the daily streamflow of both decreased to different degrees and the decrease degree was relatively large in the low-flow part (refer to
Figure 4).
Compared with percentile streamflow discharges before the abrupt point year, the
of annual and July–September decreased by 40% and 38%, but for
in annual, it increased by 9%;
of annual and July–September decreased by 17% and 22%, respectively (refer to
Table 4).
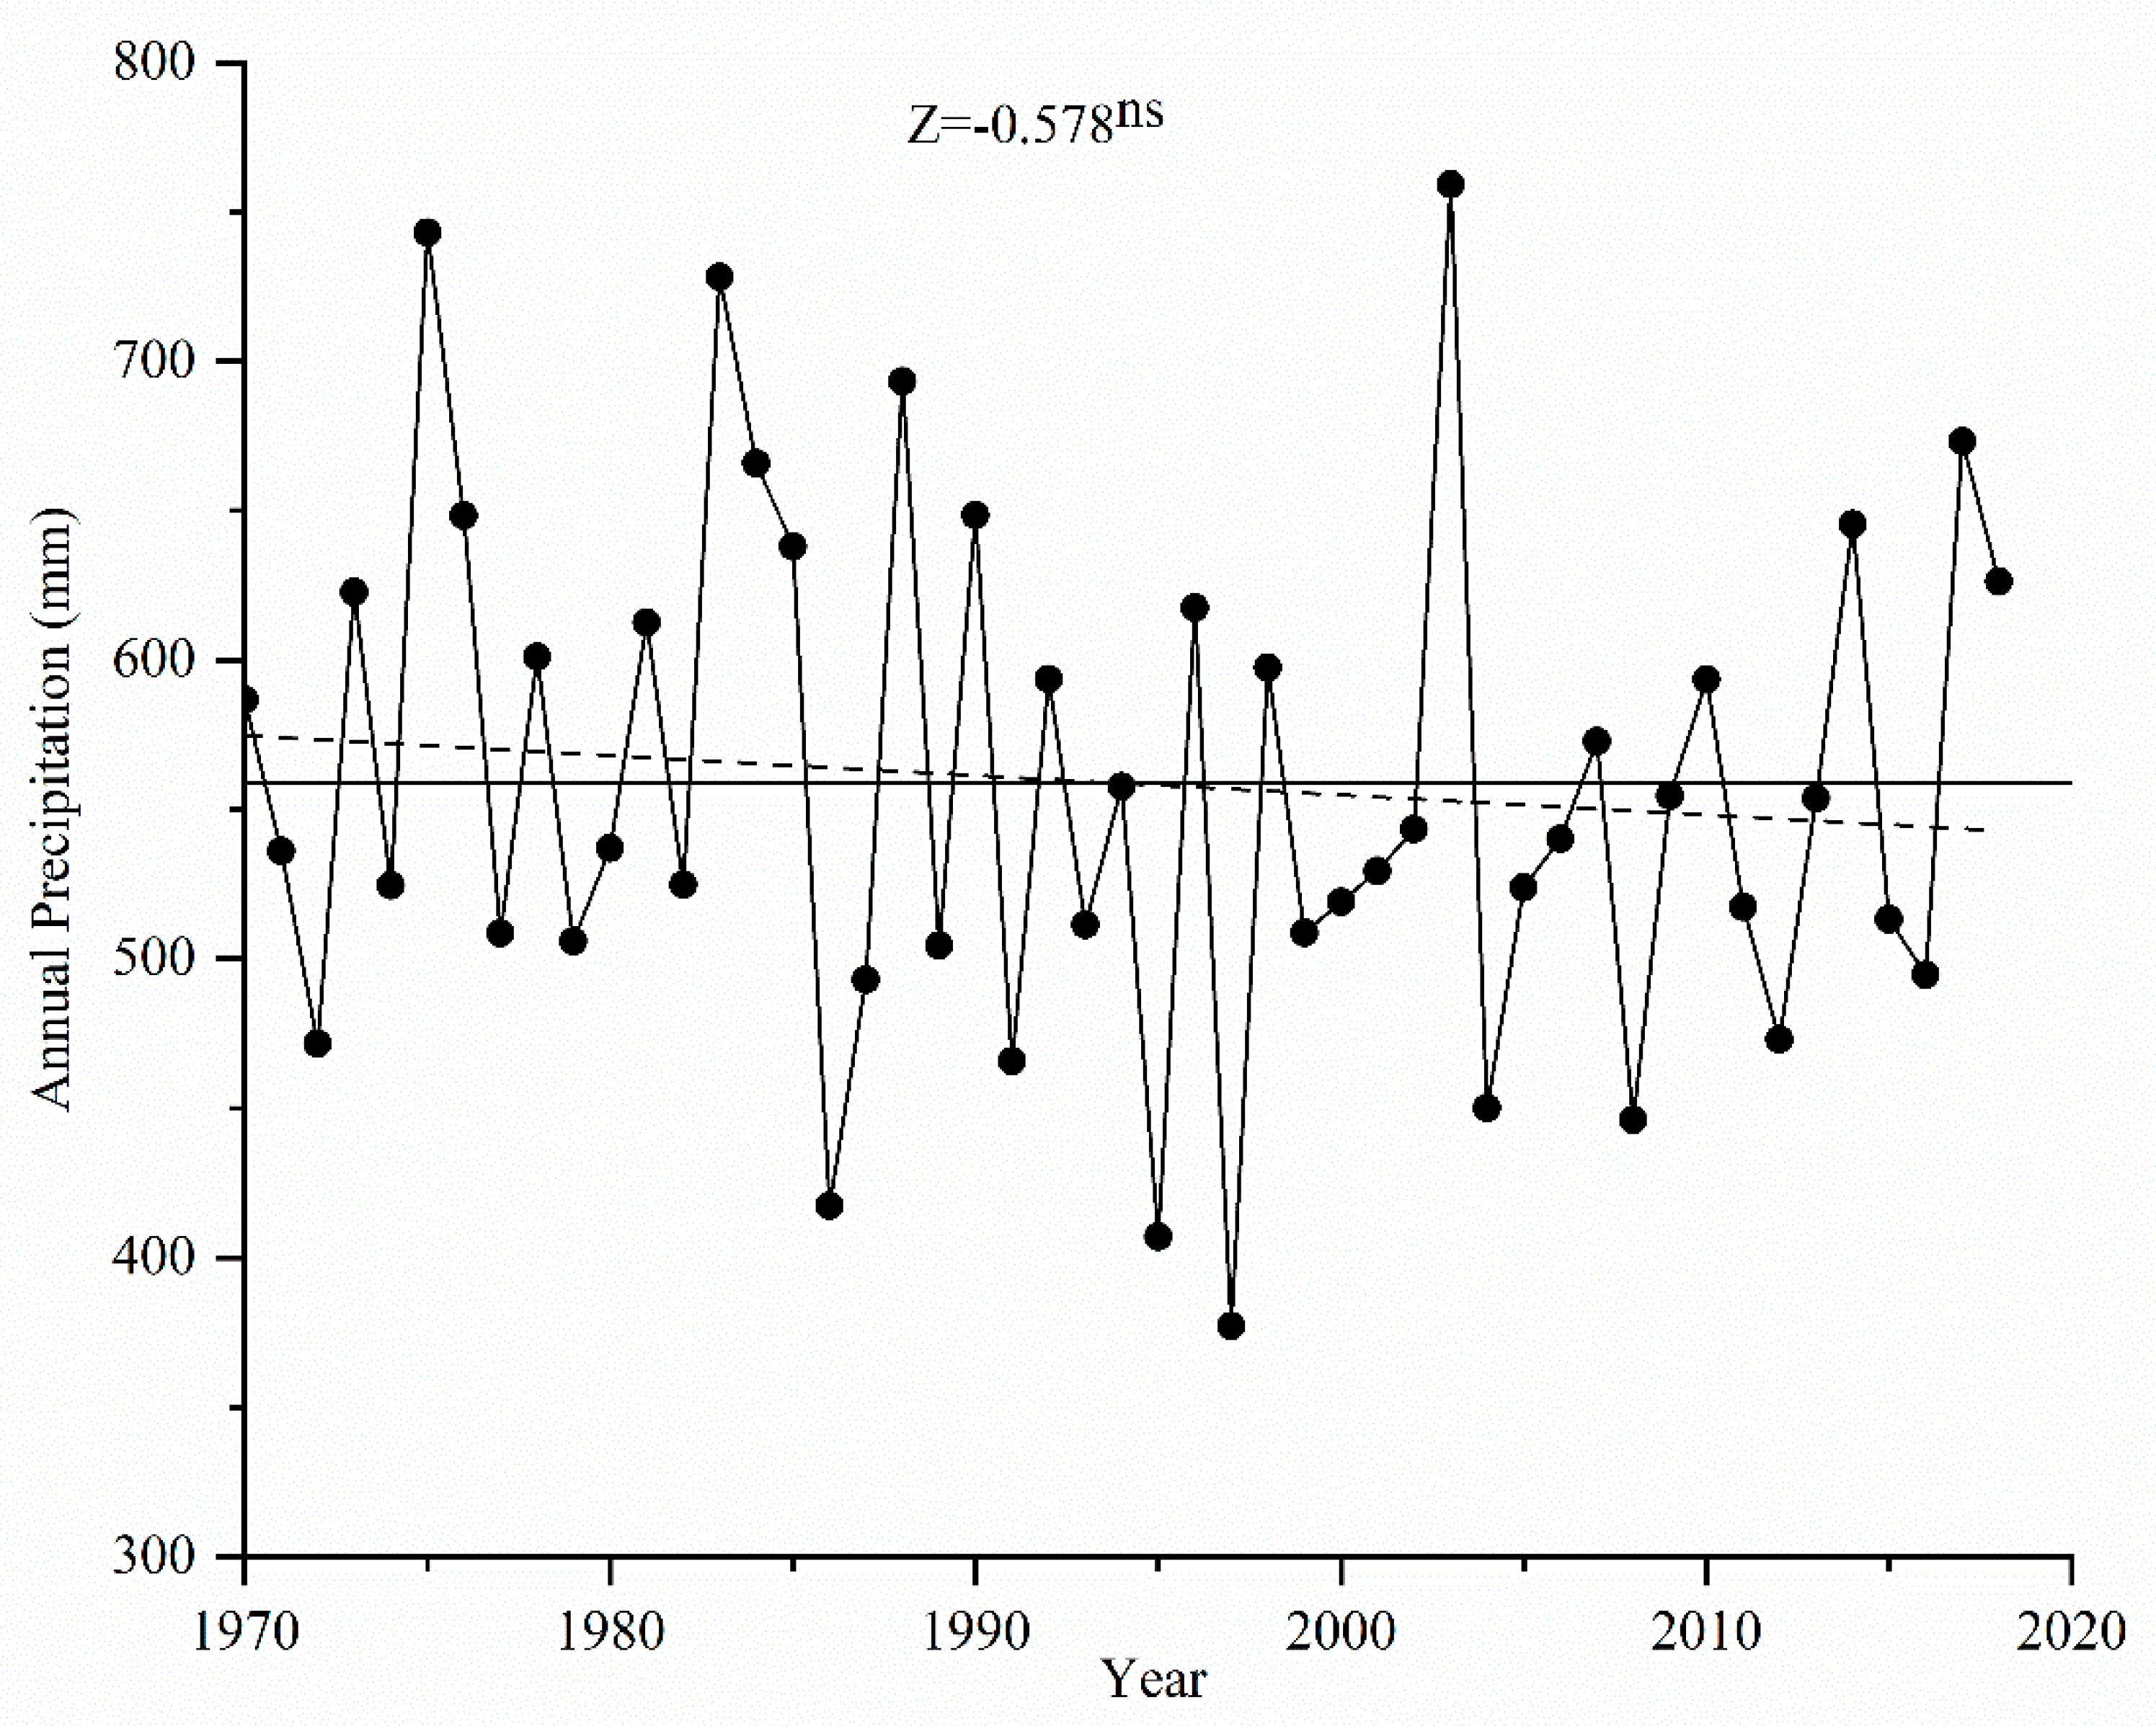
3.5. Trend and Abrupt Point of Precipitation
There was a downward but non-significant trend (
) for annual average precipitation (
Figure 5). Moreover, no abrupt point was identified in the long-term precipitation. For different seasons, the same trend and abrupt-point analysis results are in the second, third and fourth quarters. On the contrary, there was an upward but non-significant trend in January–March (
Table 5). There is no significant downward trend in the average precipitation, but the streamflow has decreased significantly at the same time. It can be seen that the variation of precipitation in some areas is not sufficient to significantly have a reduction effect on the streamflow regimes in the whole Beiluo River Basin. The above analysis shows that precipitation is not the only the factor that can affect streamflow regime change.
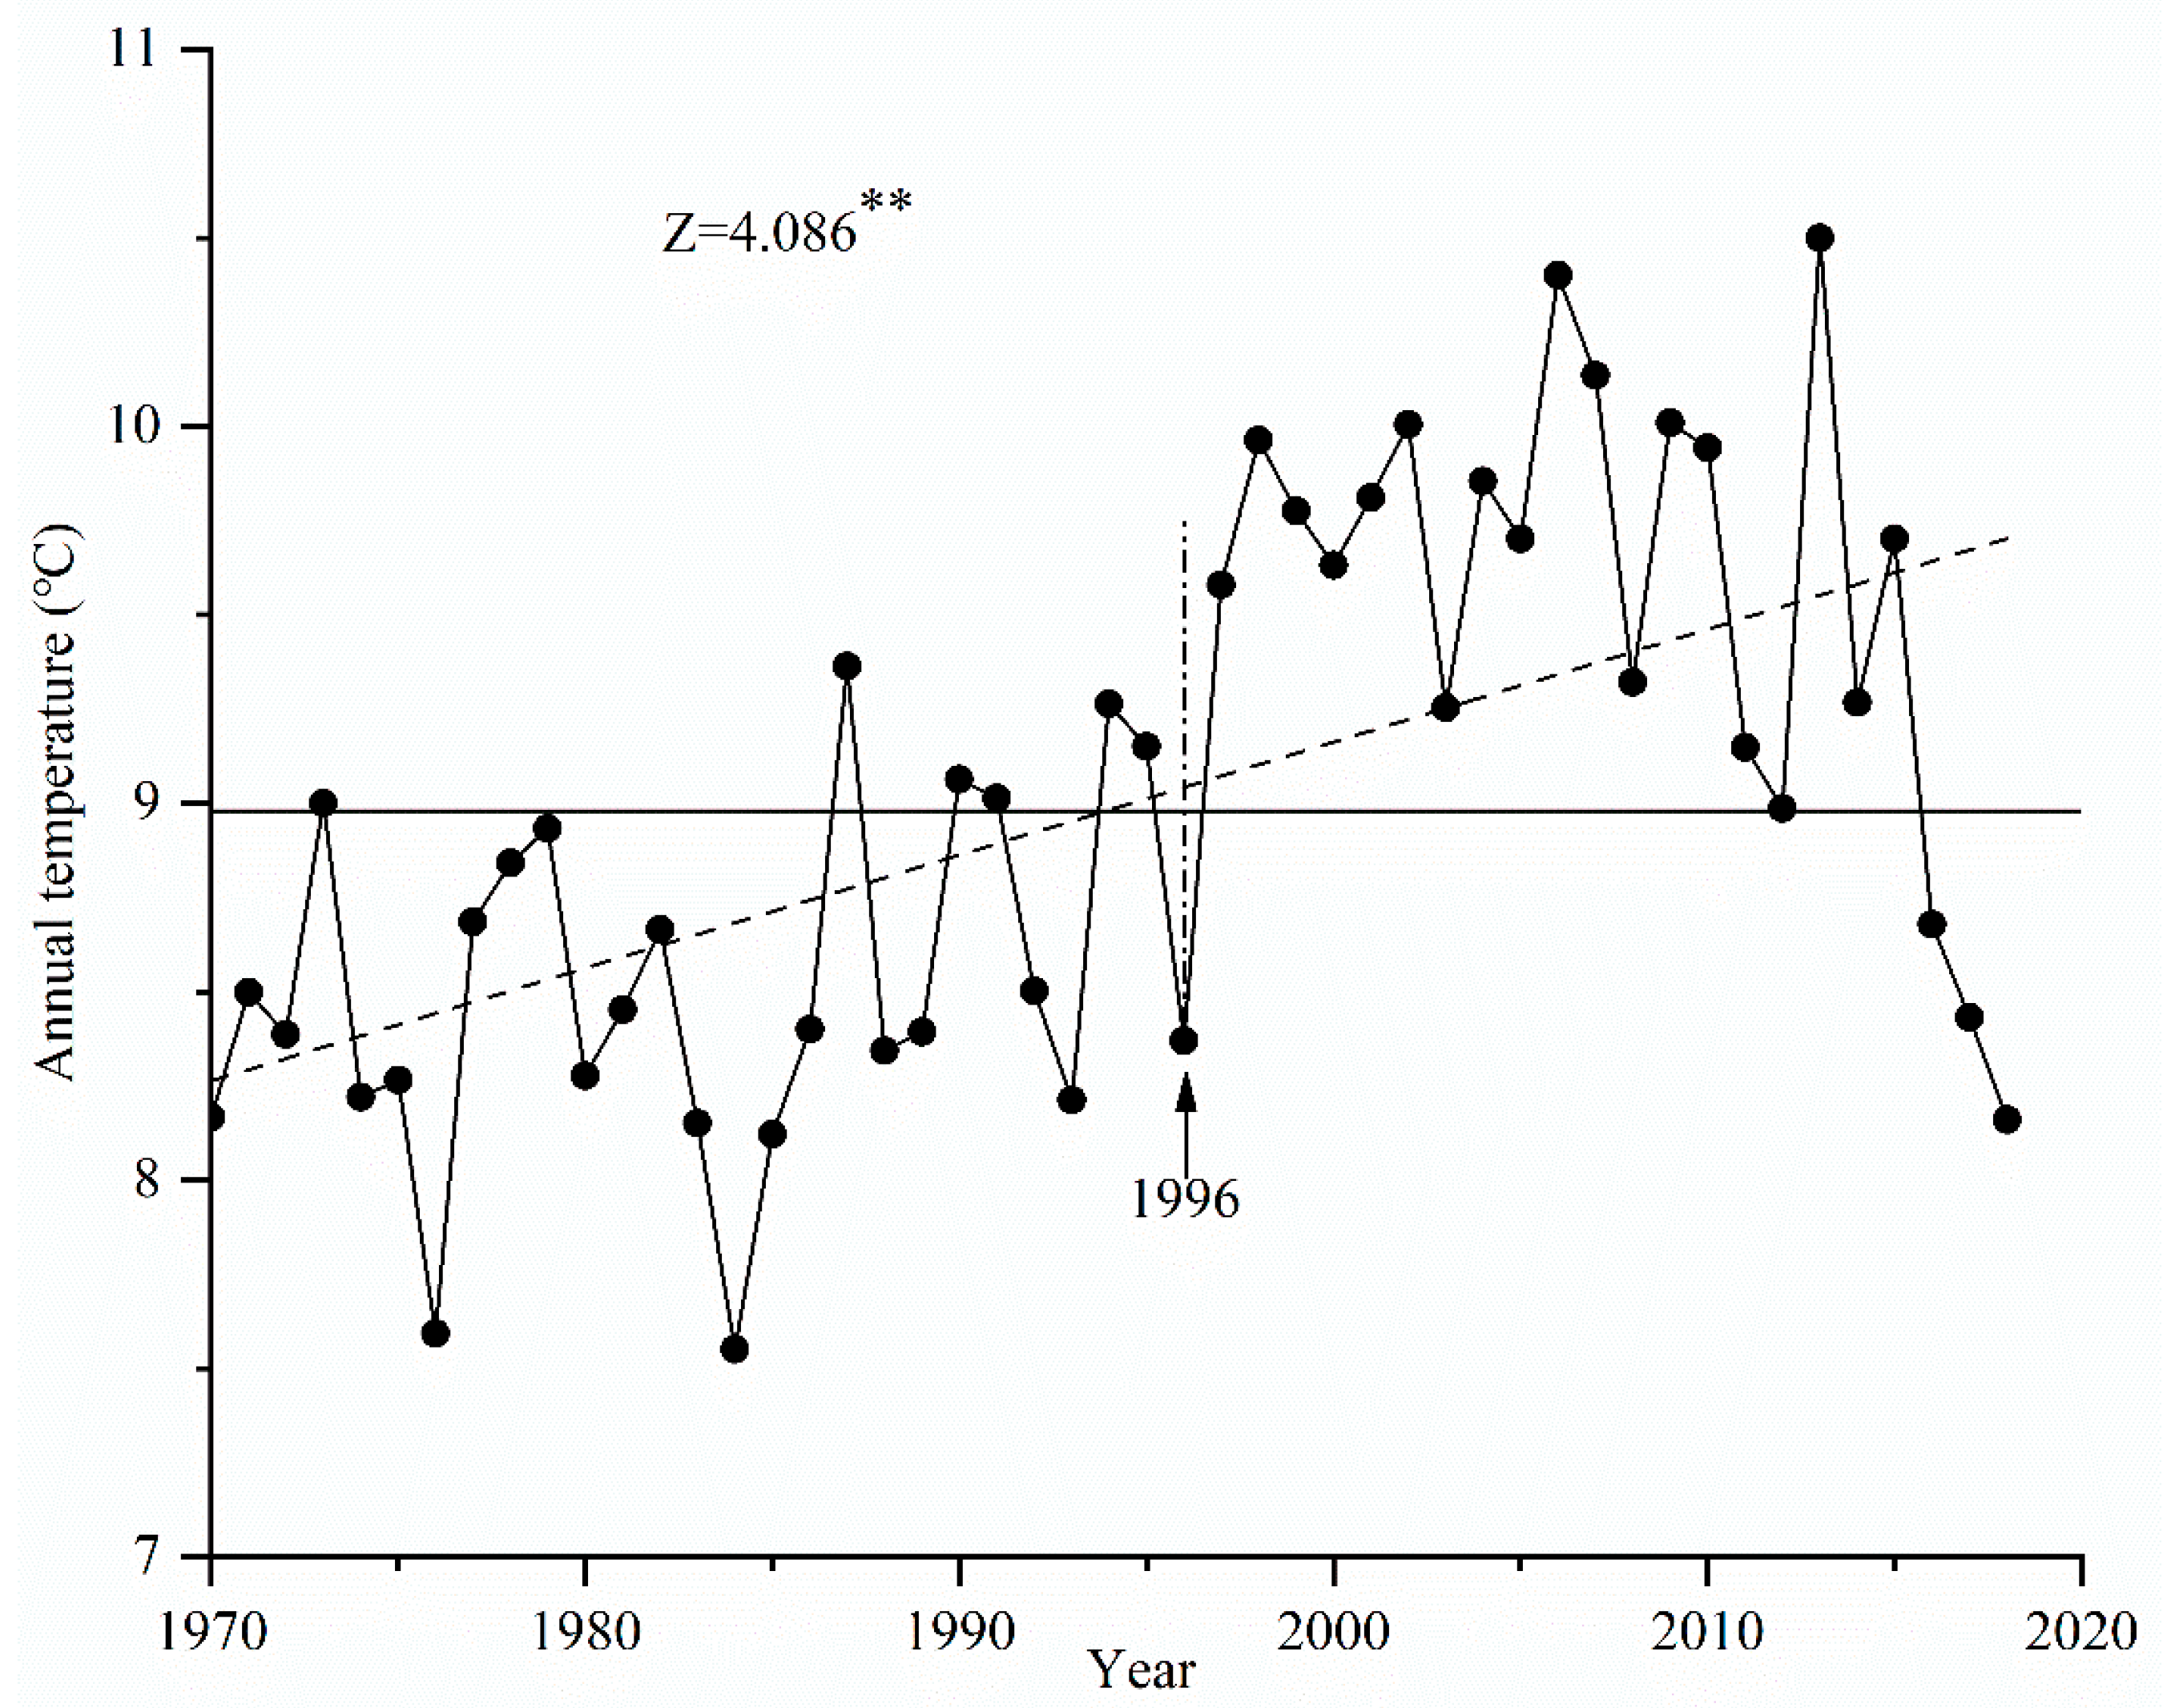
3.6. Trend and Abrupt Point of Air Temperature
The results showed a significant upward trend in the annual temperature in the Beiluo River Basin from 1970 to 2018 (
), and 1996 (
) was the abrupt-point year (refer to
Figure 6). The trends and abrupt-point analysis results of temperature in different quarters are listed in
Table 5. Over the whole study period, the streamflow decreased with the increasing temperature for some time. Generally, the temperature changes will affect evaporation/transpiration in arid regions; as the air temperature increases, so does the evaporation/transpiration of the basin [
47].
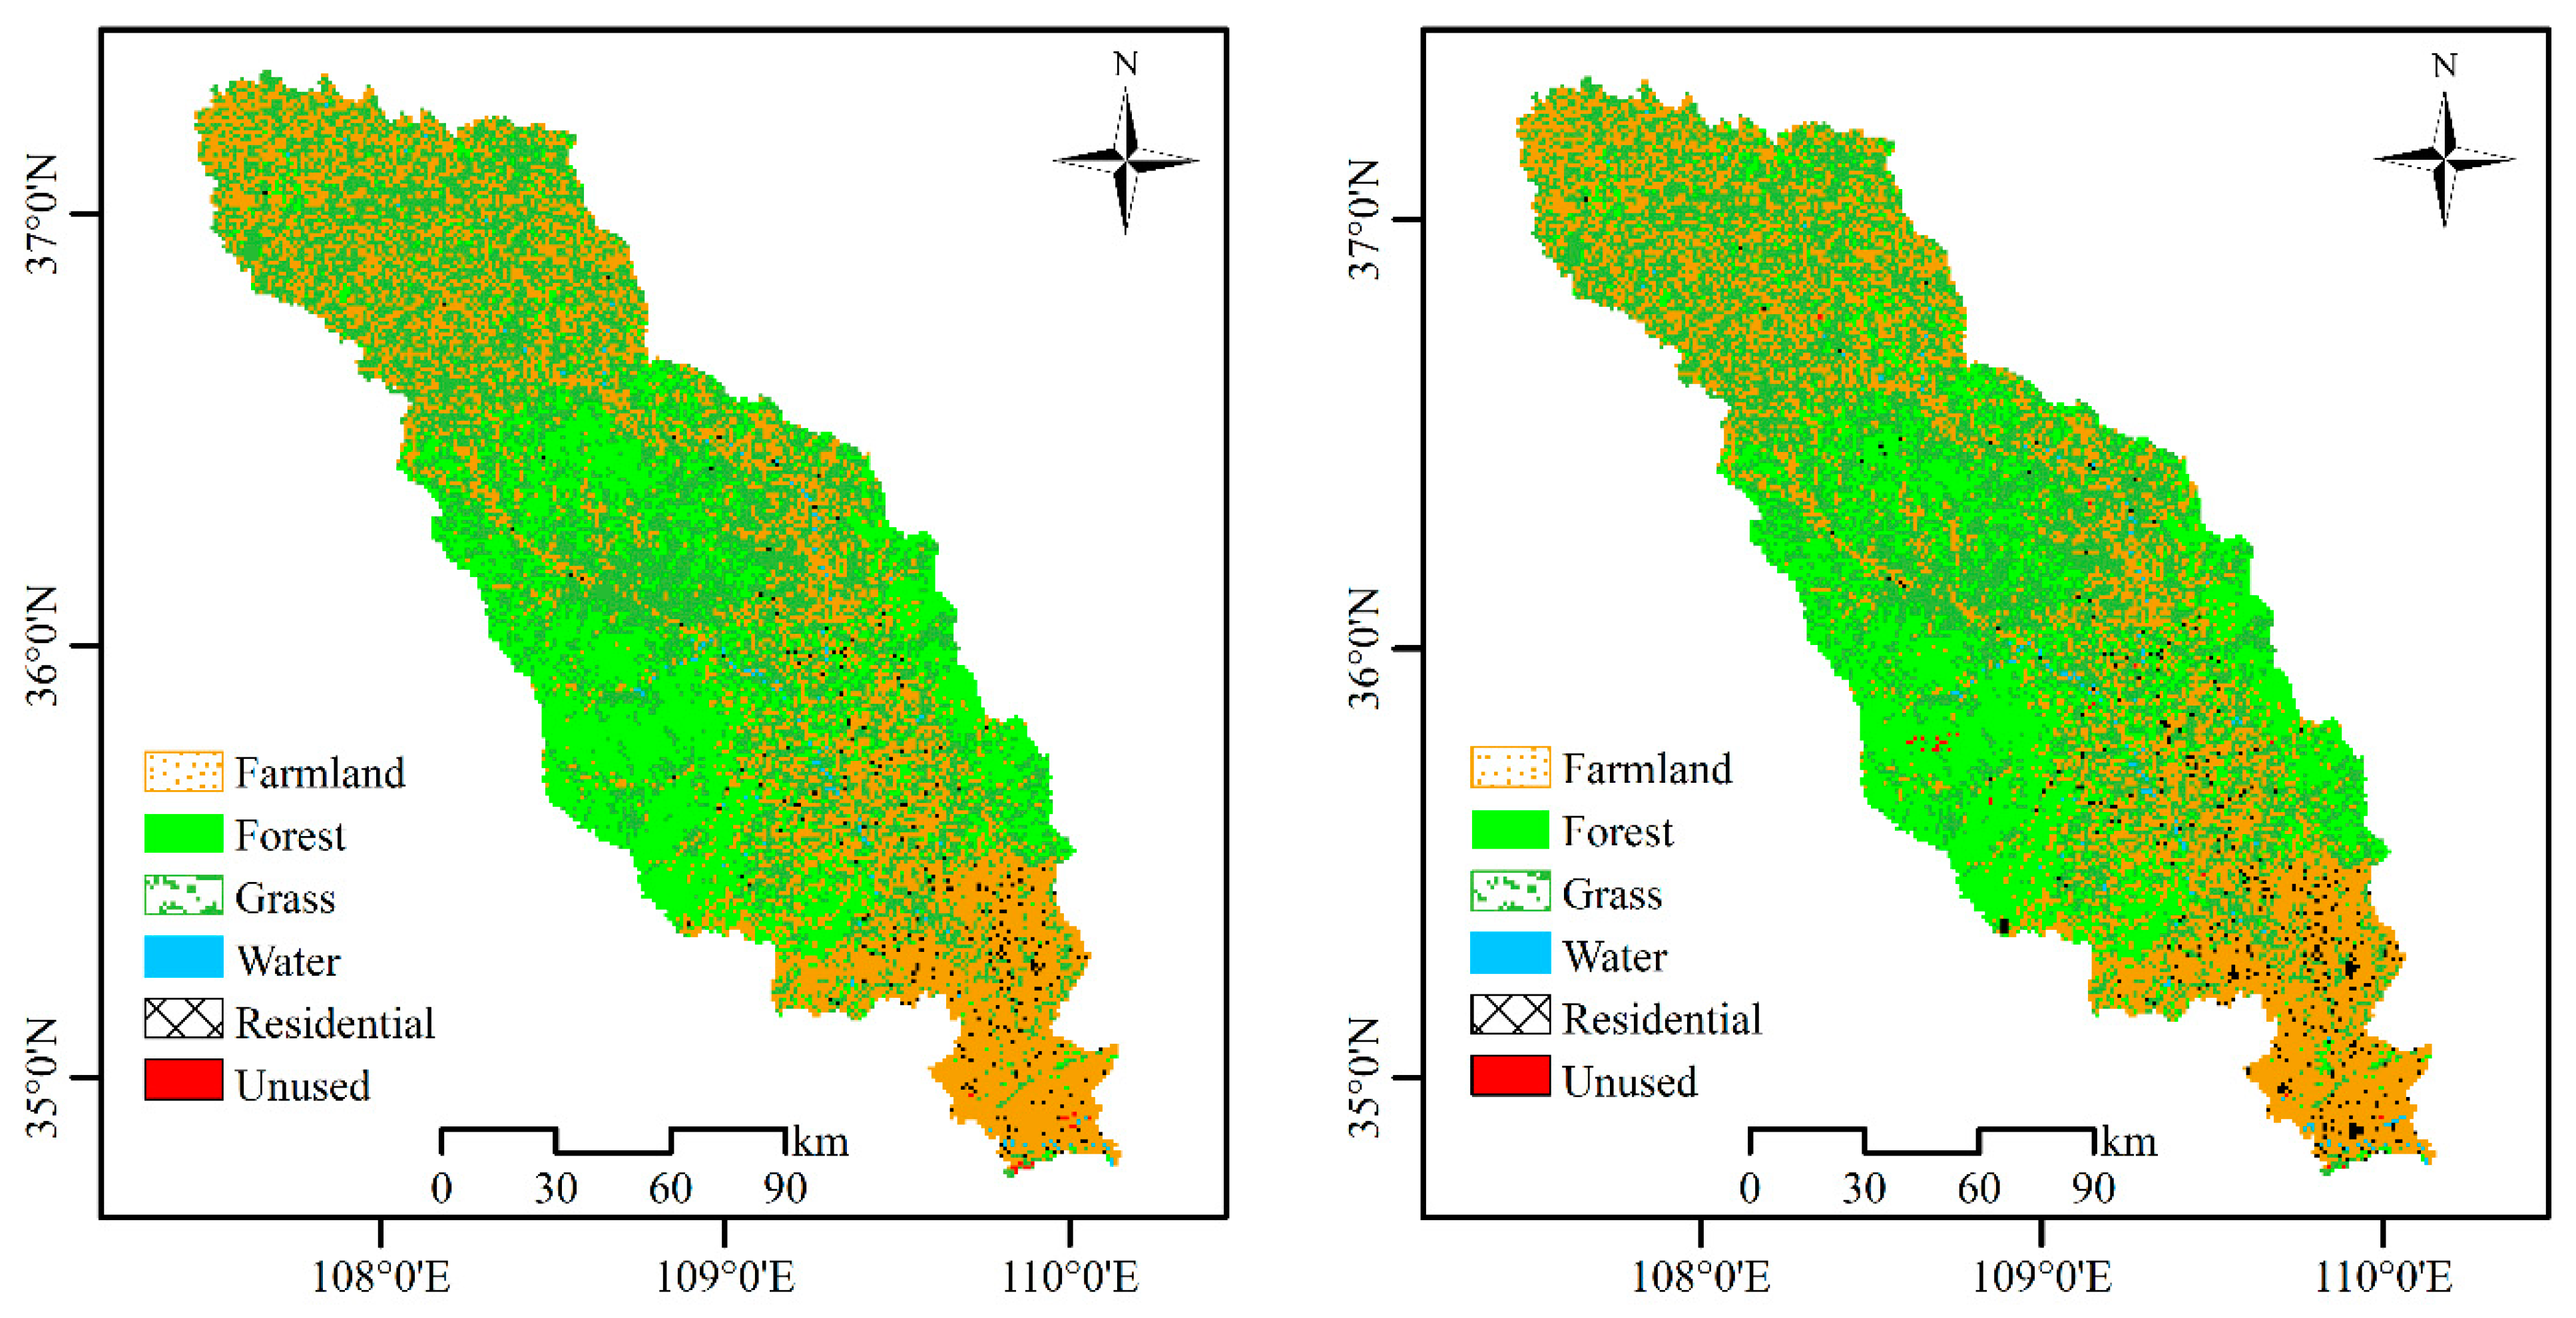
3.7. Land-Use Changes in the Beiluo River Basin
From 1980 to 2015, there were some land-use changes in the Beiluo River Basin (
Table 6 and
Figure 7). The area of farmland converted to other land types were 388.4 km
2, of which 69.7% was converted into forestland (31.4%) and the grass (38.3%), especially in the upper reaches (
Figure 8). In addition, about 26.9% was converted to residential land, while only 160.1 km
2 of forestland and grass was converted to farmland, and this ultimately led to a decrease of 222.4 km
2 of farmland in 2015. The reduction of forestland is mainly transformed into grass and a small part of unused land, but at the same time, the area developed from grass to forestland is 1.29 times that of the conversion from forestland to grass, which ultimately increases the area of forestland by 123.4 km
2. The higher the vegetation coverage rate, the stronger the ability to conserve water sources, and the slower the formation of surface runoff during heavy rains. Meanwhile, because the water consumption of vegetation transpiration accounts for a larger proportion in the water balance of the ecosystem, eventually leading to different levels of river runoff reduction.
3.8. Impacts of Climate Variability and LUCC on Streamflow Changes
According to Equation (2), climate change () contributed 43.7% (6.62 mm/a) of the annual streamflow change, and the LUCC factor () contributed 56.3% (8.53 mm/a) of the annual streamflow change. In a word, in the Beiluo River Basin, climatic factors change contributed less to streamflow decrease than the LUCC from 1970 to 2018.
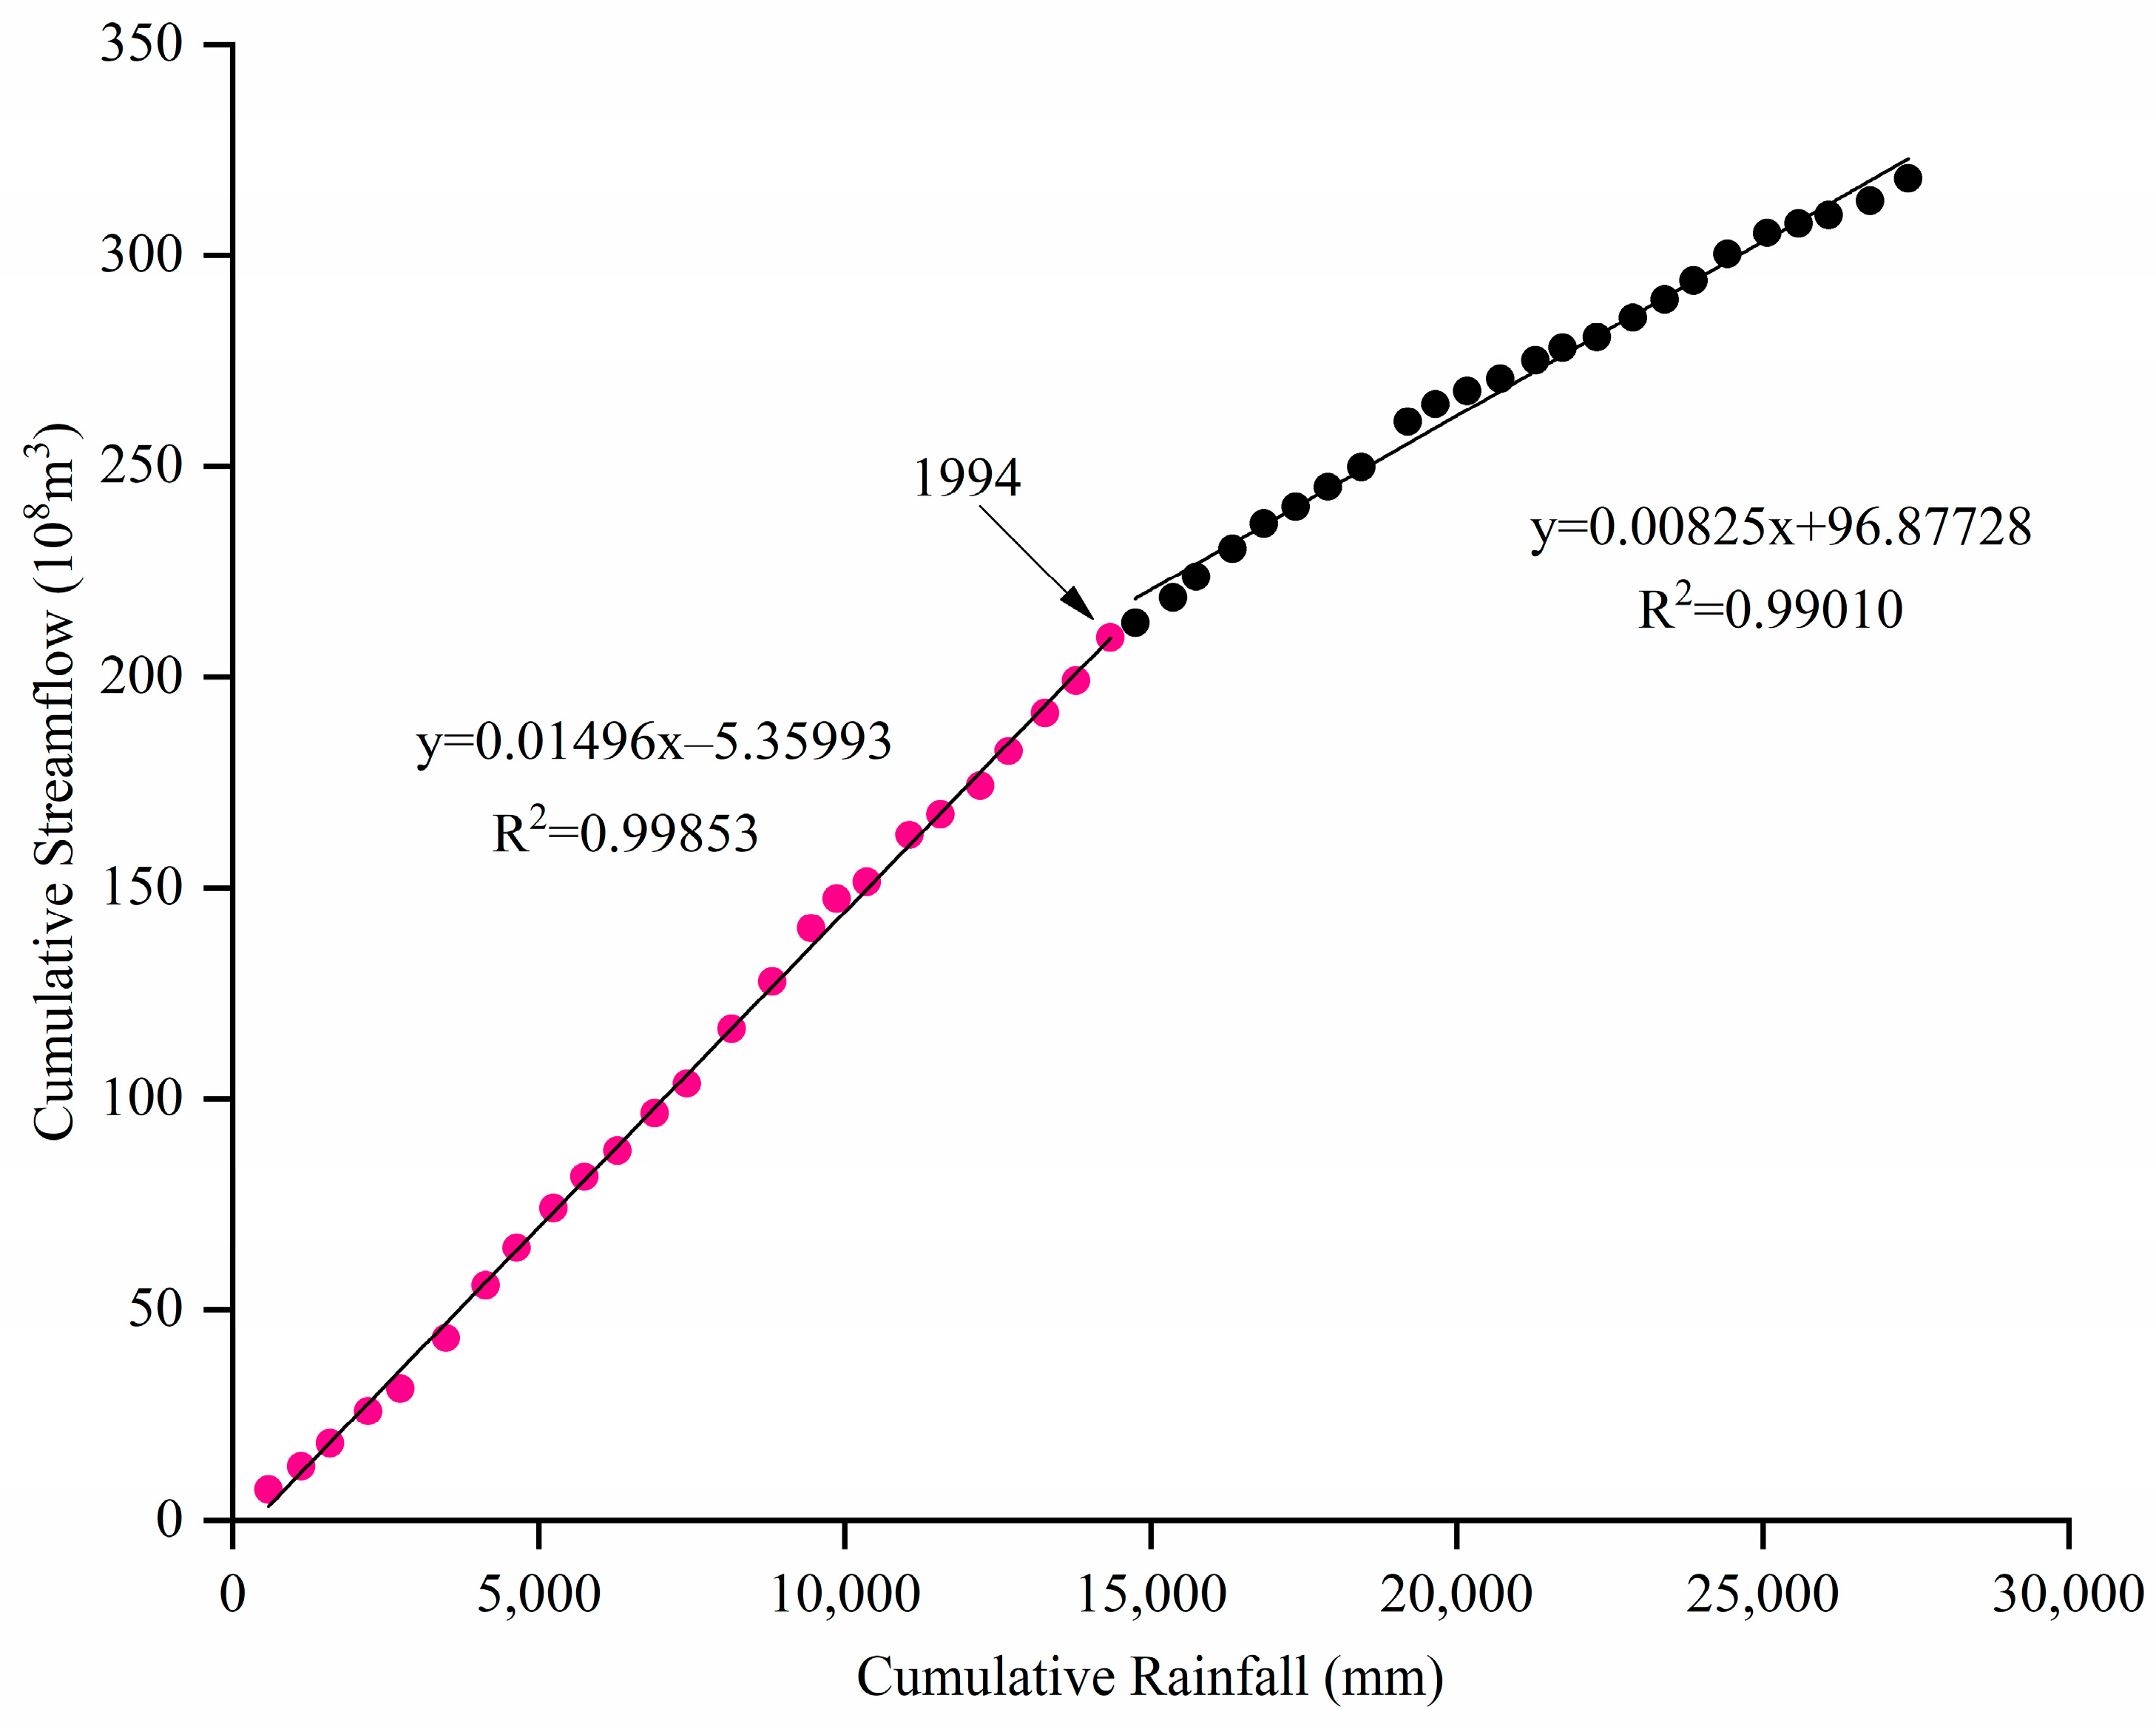
3.9. Impacts of Precipitation and Anthropogenic Activities on Streamflow Discharge by DMC
The annual streamflow after the abrupt year can be obtained from the regression equation, which was established based on the DMC of precipitation–streamflow before the abrupt year (
Figure 8). In particular, the difference between the theoretical values and the measured values after the abrupt year is caused by human activities [
46]. The baseline period is 1970–1994, and 1995–2018 is the changing period; at the same time, according to different decades, the change period is divided into three periods: 1995–1999, 2000–2009 and 2010–2018.
In
Figure 7, we can see that the slope of the DMC decreased from 0.01496 in the baseline period to 0.00825, with an attenuation rate of 44.9%, indicating that human activities had a great impact on the streamflow in the Beiluo River Basin. For streamflow reduction in the basin, the non-precipitation (mainly refers to human activities) contribution rate was 90.6% in 1995–2018, which is much higher than the contribution rate of precipitation (9.4%) in the same period (
Table 7). In the different decades, the amount of variation is on the rise, and the impact of human activities on streamflow continues to increase; it may be related to the implementation of the policy of returning farmland to forest and grass in the 1990s and some soil- and water-conservation measures. Conversely, the impact of precipitation continues to decrease. In 1995–1999, precipitation has the maximum contribution rate (29.4%) to streamflow reduction. During this period, there have been many extreme drought events, including no precipitation for several months and the reduction of reservoir water storage, which directly led to the maximum contribution rate of climate change to the streamflow variation in this basin. In summary, human activities are the main reason for the streamflow reduction in the Beiluo River Basin.
4. Discussion
Changes in streamflow regime were mainly influenced by climatic factors and human activities; the former includes precipitation, temperature and evapotranspiration, and the latter mainly includes LUCC and soil- and water-conservation measures. It can be seen that the conclusions of the two attribution analysis methods used in this paper are slightly different, which is obviously related to the different theoretical basis on which the research method itself is based. The DMC quantitatively analyzes the impact of precipitation and non-precipitation factors on streamflow changes, but for the Equations (1)–(5), it aims to separate effects of climatic factors (refer specifically to precipitation and temperature) from other factors (refer specifically to LUCC). Obviously, the non-precipitation factors include other climatic factors and LUCC. Climatic factors used in the equations similarly include precipitation; hence, the calculation results of both contribution rates intersect each other. In addition, we also concluded that, as far as the dominant contributor is concerned, the results obtained by the two methods are consistent. The change in the slope of the relationship curve between cumulative precipitation and cumulative streamflow represents the change in streamflow produced by unit precipitation, so it is equivalent to preliminarily eliminating the impact of precipitation to check whether the streamflow series has a trend change under the interference of human activities and its value. That is to say, the analysis result of the double-mass curve contains random errors that cannot be measured, which is also a problem with all statistical models. Calculations used by the Equations (1)–(5) are based on the assumption that the effects of climate variability and human activities are independent of each other. Because of complicated interactions between climate variation and anthropogenic activities, it is difficult to quantify the impact of specific anthropogenic activities on runoff variation. In order to more accurately analyze the attribution of streamflow changes in the Beiluo River Basin, the best way is to combine the two methods.
The Beiluo River Basin is one of the areas with serious water shortage in China, and the lack of water resources has become the bottleneck restricting the sustainable development of local economy, among which the water resources of river streamflow are most closely related to the development of human society. The significant decrease of runoff in the Beiluo River leads to the shortage of industrial water and agricultural irrigation water. With the increase of population, people’s production and living water is also facing severe challenges. The project named “rainwater collection” was implemented in locally to relieve the daily water pressure; about two million small cisterns were built to collect rainwater to provide drinking water and irrigation [
8,
19]. Therefore, in order to solve the above problems, we must do a good job of analysis and research on the current hydrological changes, but also actively carry out hydrological regime prediction research, which will become an important topic in the future.
5. Conclusions
In this study, the trends and variation of streamflow and baseflow records of the Beiluo River Basin over the past decades (1970–2018) were analyzed. Meanwhile, different methods were used to quantify the contribution of climatic factors and non-climatic factors to streamflow in the basin.
The annual streamflow and baseflow both show a significant downward trend, with the abrupt-points years detected in 1994 and 1988, respectively. This is mainly related to a significant decreasing trend in the flow of the July–September quarter, which accounted for the largest proportion of the annual streamflow and baseflow. The high-frequency and low-frequency events of annual and quarterly streamflow or baseflow in the Beiluo River Basin overwhelmingly show a significant downward trend; the abrupt-points years in the high-frequency flow were detected near 1987, and those in the low-frequency flow were identified near 1987 or 1993.
In this study, observed annual precipitation in the Beiluo River Basin shows a downward but not significant trend (), with no abrupt point identified. Instead, there is a significant upward trend in the annual temperature (), with the abrupt point year in 1996. Based on Equations (1)–(5), climate change (precipitation, evapotranspiration and temperature) contributed 43.7% (6.62 mm/a) of the annual streamflow change, and non-climatic factors (LUCCs) contributed 56.3% (8.53 mm/a) of the annual streamflow change. Based on the DMC of precipitation–streamflow, human activities’ contribution rate is 90.6%, which is much higher than the contribution rate of precipitation (9.4%). Moreover, we also found that human activities played a more vital part in driving streamflow reduction in different decades, with a contribution rate of more than 70%.
All results indicate that streamflow and baseflow variation characteristics in the Beiluo River Basin from 1970 to 2018 were complicated, and it would be best to study according to quarter distributions. When investigating the attribution analysis of streamflow changes in the future, more easily overlooked factors should be taken into consideration, such as different soil- and water-conservation measures, water projects and vegetation restoration.
Author Contributions
Conceptualization, Z.X., X.M. and P.G.; methodology, Z.X.; validation, P.G.; formal analysis, Z.X. and P.G.; investigation, Z.X.; resources, Z.X., C.W. and D.Q.; data curation, Z.X. and P.G.; writing—original draft preparation, Z.X. and P.G.; writing—review and editing, P.G., X.M. and Z.X.; supervision, P.G.; project administration, Z.X. All authors have read and agreed to the published version of the manuscript.
Funding
The authors are grateful for the financial support of the National Key Research and Development Program of China (2016YFC0501707).
Institutional Review Board Statement
Not applicable.
Informed Consent Statement
Not applicable.
Data Availability Statement
The study did not report any data.
Conflicts of Interest
The authors declare no conflict of interest.
References
- Bhatti, J.S.; Fleming, R.L.; Foster, N.W.; Meng, F.R.; Bourque, C.P.A.; Arp, P.A. Simulations of pre- and post-harvest soil temperature, soil moisture, and snowpack for jack pine: Comparison with field observations. For. Ecol. Manag. 2000, 138, 413–426. [Google Scholar] [CrossRef]
- Sepehri, M.; Malekinezhad, H.; Ilderomi, A.R.; Talebi, A.; Hosseini, S.Z. Studying the effect of rain water harvesting from roof surfaces on runoff and household consumption reduction. Sustain. Cities Soc. 2018, 43, 317–324. [Google Scholar] [CrossRef]
- Vollmer, D.; Pribadi, D.O.; Remondi, F.; Rustiadi, E.; Gret-Regamey, A. Prioritizing ecosystem services in rapidly urbanizing river basins: A spatial multi-criteria analytic approach. Sustain. Cities Soc. 2016, 20, 237–252. [Google Scholar] [CrossRef]
- He, Y.; Song, J.-X.; Hu, Y.-Y.; Tu, X.; Yan, Z. Impacts of different weather conditions and landuse change on runoff variations in the Beiluo River Watershed, China. Sustain. Cities Soc. 2019, 50. [Google Scholar] [CrossRef]
- Gao, P.; Jiang, G.-T.; Wei, Y.-P.; Sun, W.-Y. Streamflow regimes of the Yanhe River under climate and land use change, Loess Plateau, China. Hydrol. Process. 2015, 10, 12. [Google Scholar] [CrossRef]
- Xu, J.-X. Sediment flux to the sea as influenced by changing human activities and precipitation: Example of the Yellow River, China. Environ. Manag. 2003, 31, 328–341. [Google Scholar] [CrossRef]
- Huang, M.-B.; Zhang, L. Hydrological responses to conservation practices in a catchment of the Loess Plateau, China. Hydrol. Process. 2004, 18, 1885–1898. [Google Scholar] [CrossRef]
- Gao, P.; Geissen, V.; Ritsema, C.J.; Mu, X.-M.; Wang, F. Impact of climate change and anthropogenic activities on stream flow and sediment discharge in the Wei River basin, China. Hydrol. Earth Syst. Sci. 2013, 17, 961–972. [Google Scholar] [CrossRef] [Green Version]
- Li, J.-J.; Peng, S.-Z.; Li, Z. Detecting and attributing vegetation changes on China’s Loess Plateau. Agric. For. Meteorol. 2017, 247, 260–270. [Google Scholar] [CrossRef]
- Liu, E.-J.; Zhang, X.-P.; Xie, M.-L.; Chen, N.; Zhang, T.-T.; Guo, M.-J. Hydrologic responses to vegetation restoration and their driving forces in a catchment in the Loess hilly-gully area: A case study in the upper Beiluo River. Acta Ecol. Sin. 2015, 35, 622–629. (In Chinese) [Google Scholar]
- Lei, W.; Jun, J.; Gou, X.-L.; Ma, X.-Y. Characteristics of pulsed runoff-erosion events under typical rainstorms in a small watershed on the Loess Plateau of China. Sci. Rep. 2018, 8, 160–173. [Google Scholar] [CrossRef]
- Feng, X.-M.; Wei, C.; Fu, B.-J.; Lü, Y.-H. The role of climatic and anthropogenic stresses on long-term runoff reduction from the Loess Plateau, China. Sci. Total Environ. 2016, 571, 688–698. [Google Scholar] [CrossRef] [PubMed]
- Liu, D.-F.; Tian, F.-Q.; Hu, H.-C.; Hu, H.-P. The role of run-on for overland flow and the characteristics of runoff generation in the Loess Plateau, China. Hydrol. Sci. J. 2012, 6, 1107–1117. [Google Scholar] [CrossRef]
- Sun, W.-Y.; Shao, Q.-Q.; Liu, J.-Y.; Zhai, J. Assessing the effects of land use and topography on soil erosion on the Loess Plateau in China. Catena 2014, 121, 151–163. [Google Scholar] [CrossRef]
- Zhao, J.; Huang, S.-Z.; Huang, Q.; Wang, H.; Leng, G.-Y. Detecting the Dominant Cause of Streamflow Decline in the Loess Plateau of China Based on the Latest Budyko Equation. Water 2018, 10, 1277. [Google Scholar] [CrossRef] [Green Version]
- Zhang, B.-Q.; Tian, L.; Zhao, X.-N.; Wu, P.-T. Feedbacks between vegetation restoration and local precipitation over the Loess Plateau in China. Sci. China Earth Sci. 2021, 6. prepublish. [Google Scholar] [CrossRef]
- Li, Y.; Qin, Y.-C.; Ma, L.-Q.; Pan, Z.-W. Climate change: Vegetation and phenological phase dynamics. Int. J. Clim. Chang. Strateg. Manag. 2020, 4, 495–509. [Google Scholar] [CrossRef]
- Li, Y.-Y.; Chang, J.-X.; Wang, Y.-M.; Jin, W.-T.; Guo, A.-J.; Li, H.-Y. Spatiotemporal Impacts of Climate, Land Cover Change and Direct Human Activities on Runoff Variations in the Wei River Basin, China. Water 2016, 8, 220. [Google Scholar] [CrossRef] [Green Version]
- He, Y.; Wang, F.; Tian, P.; Mu, X.-M.; Gao, P.; Zhao, G.-J.; Wu, Y.-P. Impact assessment of human activities on runoff and sediment of Beiluo River in the Yellow River based on paired years of similar climate. Ecol. Environ. Conserv. 2016, 25, 121–135. [Google Scholar] [CrossRef]
- Zhang, L.-M.; Zhao, G.-J.; Mu, X.-M.; Gao, P.; Sun, W.-Y. Attribution of runoff variation in the Wei River basin based on the Budyko hypothesis (in Chinse). Acta Ecol. Sin. 2018, 38, 7607–7617. [Google Scholar]
- Eckhardt, K. How to Construct Recursive Digital Filters for Baseflow Separation. Hydrol. Process. 2010, 19, 507–515. [Google Scholar] [CrossRef]
- Lei, Y.-N.; Zhang, X.-P.; Zhang, J.-J.; Liu, E.-J.; Zhang, Q.-Y.; Chen, N. Suitability analysis of automatic baseflow separation methods in typical watersheds of water-wind erosion crisscross region on the Loess Plateau, China. Sci. Soil Water Conserv. 2011, 9, 57–64. (In Chinese) [Google Scholar]
- Searcy, J.K. Flow-Duration Curves, Manual of Hydrology: Part 2; Water-Supply Paper; US Geological Survey: Washington, DC, USA, 1959; p. 1542-A.
- Bassiouni, M.; Oki, D.S. Trends and shifts in streamflow in Hawai’i, 1913–2008. Hydrol. Process. 2013, 27, 1484–1500. [Google Scholar] [CrossRef]
- Mann, H.B. Nonparametric tests against trend. Econometrica 1945, 13, 245–259. [Google Scholar] [CrossRef]
- Kendall, M.G. Rank Correlation Measures; Charles Griffin: London, UK, 1975. [Google Scholar]
- Hirsch, R.M.; Slack, J.R.; Smith, R.A. Techniques of trend analysis for monthly water quality data. Water Resour. Res. 1982, 18, 107–121. [Google Scholar] [CrossRef] [Green Version]
- Burn, D.H.; Elnur, M.A. Detection of hydrologic trends and variability. J. Hydrol. 2002, 255, 107–122. [Google Scholar] [CrossRef]
- Yang, Y.-H.; Tian, F. Abrupt change of runoff and its major driving factors in Haihe River Catchment, China. J. Hydrol. 2009, 3, 373–383. [Google Scholar] [CrossRef]
- Tian, F.; Yang, Y.-H.; Han, S.-M.; Juana, P.M.; Qiu, G.-Y. Determination of the period of major runoff decline and related driving factors in Ye River Basin, North China. J. Water Clim. Chang. 2010, 2, 154–163. [Google Scholar] [CrossRef]
- Huang, Q.; Fan, J.-J.; Huang, G.-H. Detecting Runoff Variation of the Mainstream in Weihe River. J. Appl. Math. 2013, 2013, 468–475. [Google Scholar] [CrossRef]
- Sui, Y.; Shi, H.-Y.; You, Z.-J.; Qiao, S.-W.; Sun, J.-C. Long-term Trend and Change Point Analysis on Runoff and Sediment Flux into the Sea from the Yellow River during the Period of 1950-2018. J. Coast. Res. 2020, 99, 203–207. [Google Scholar] [CrossRef]
- Mo, S.-H.; Li, Z.-L.; Gou, K.; Qin, L.; Shen, B. Quantifying the Effects of Climate Variability and Direct Human Activities on the Change in Mean Annual Runoff for the Bahe River (Northwest China). J. Coast. Res. 2018, 1, 81–89. [Google Scholar] [CrossRef]
- Gao, P.; Zhang, X.-C.; Mu, X.-M.; Wang, F.; Li, R.; Zhang, X.-P. Trend and change-point analyses of streamflow and sediment discharge in Yellow River mainstream during 1950–2005. Hydrol. Sci. J. 2010, 55, 275–285. [Google Scholar] [CrossRef]
- Yue, S.; Pilon, P.; Phinney, B. Canadian stream flow trend detection: Impacts of serial and cross-correlation. Hydrol. Sci. J. 2003, 48, 51–63. [Google Scholar] [CrossRef]
- Pettitt, A.N. A non-parametric approach to the change-point problem. Appl. Stat. 1979, 28, 126–135. [Google Scholar] [CrossRef]
- Smakhtin, V.Y. Generation of natural daily flow time-series in regulated rivers using a non-linear spatial interpolation technique. Regul. Rivers Res. Manag. 1999, 15, 311–323. [Google Scholar] [CrossRef]
- Kim, J.-C.; Kim, S.-D. Flow Duration Curve Analysis for Nakdong River Basin using TMDL Flow Data. J. Korean Soc. Water Environ. 2007, 23, 332–338. [Google Scholar]
- Salaudeen, A.R.; Shamsuddin, S.; Tarmizi, I.; Chung, E.-S.; Morteza, M. Prediction of Flow Duration Curve in Ungauged Catchments Using Genetic Expression Programming. Procedia Eng. 2016, 154, 1431–1438. [Google Scholar]
- Milly, P.C.D.; Dunne, K.A. Macroscale water fluxes: 2. Water and energy supply control of their inter-annual variability. Water Resour. Res. 2002, 38, 1206. [Google Scholar] [CrossRef] [Green Version]
- Allen, R.G.; Pruitt, W.O. Rational use of the FAO Blaney-Criddle formula. Irrig. Drain. Eng. 1986, 2, 139–155. [Google Scholar] [CrossRef]
- Li, L.-J.; Zhang, L.; Wang, H.; Wang, J.; Yang, J.-W.; Jiang, D.-J.; Li, J.-Y.; Qin, D.-Y. Assessing the impact of climate variability and human activities on streamflow from the Wuding River basin in China. Hydrol. Process 2007, 21, 3485–3491. [Google Scholar] [CrossRef]
- Zhang, L.; Dawes, W.R.; Walker, G.R. Response of mean annual evapotranspiration to vegetation changes at catchment scale. Water Resour. Res. 2001, 37, 701–708. [Google Scholar] [CrossRef]
- Searcy, J.K.; Hardison, C.H. Double-Mass Curves; Geological Survey Water-Supply Paper; US Government Printing Office: Washington, DC, USA, 1960; p. 1541-B.
- Mu, X.-M.; Zhang, X.-Q.; Gao, P.; Wang, F. Theory of double mass curves and its applications in hydrology and meteorology. China Hydrol. 2010, 30, 47–51. [Google Scholar]
- Gao, P.; Li, P.-F.; Zhao, B.-L.; Xu, R.-R.; Zhao, G.-J.; Sun, W.-Y.; Mu, X.-M. Use of double mass curves in hydrologic benefit evaluations. Hydrol. Process. 2017, 31, 4639–4646. [Google Scholar] [CrossRef]
- Wang, G.-Q.; Zhang, J.-Y.; He, R.-M.; Jing, X.-A. Trends of temperature change in middle of Yellow River and its impact to the evaporation potential. Water Resour. Water Eng. 2007, 18, 32–36. (In Chinese) [Google Scholar]
Figure 1.
(a) Location of the study region in the Yellow River Basin; (b) Hydrological and meteorological stations in the Beiluo River Basin.
Figure 1.
(a) Location of the study region in the Yellow River Basin; (b) Hydrological and meteorological stations in the Beiluo River Basin.
Figure 2.
Abrupt points identified by Pettitt’s test KN statistic in (a) annual streamflow, (b) July–September streamflow, (c) annual baseflow and (d) July–September baseflow in the Beiluo River Basin. Horizontal lines in every graphic indicate the significance levels of 1% (dotted) and 5% (solid). When a minimum or maximum value of KN statistic exceeds out of the two lines, it means the timing of a statistically significant abrupt point.
Figure 3.
Daily FDCs of the annual and different quarter streamflow records at the Beiluo River Basin.
Figure 3.
Daily FDCs of the annual and different quarter streamflow records at the Beiluo River Basin.
Figure 4.
Comparison for (a) daily streamflow-duration curves of annual and (b) July–September in the Beiluo River Basin.
Figure 4.
Comparison for (a) daily streamflow-duration curves of annual and (b) July–September in the Beiluo River Basin.
Figure 5.
Observed annual average precipitation in the Beiluo River Basin. Horizontal solid line indicates the mean values, and dotted line represents the trend line. Z statistic could be acquired from the M–K trend test (ns, not significant at ).
Figure 5.
Observed annual average precipitation in the Beiluo River Basin. Horizontal solid line indicates the mean values, and dotted line represents the trend line. Z statistic could be acquired from the M–K trend test (ns, not significant at ).
Figure 6.
Observed annual average temperature in the Beiluo River Basin. Horizontal solid line indicates the mean values, dotted line represents the trend line and vertical long dotted line presents the abrupt point year. Z statistic could be derived from the M–K trend test (** ).
Figure 6.
Observed annual average temperature in the Beiluo River Basin. Horizontal solid line indicates the mean values, dotted line represents the trend line and vertical long dotted line presents the abrupt point year. Z statistic could be derived from the M–K trend test (** ).
Figure 7.
Land-use/cover changes of Beiluo River Basin in 1980 and 2015.
Figure 7.
Land-use/cover changes of Beiluo River Basin in 1980 and 2015.
Figure 8.
Double-mass curve of precipitation–streamflow in the Beiluo River Basin. The straight lines are the regression lines for the cumulative data before and after the abrupt point year.
Figure 8.
Double-mass curve of precipitation–streamflow in the Beiluo River Basin. The straight lines are the regression lines for the cumulative data before and after the abrupt point year.
Table 1.
Results of trend analysis for flow record in the Beiluo River Basin during.
Table 1.
Results of trend analysis for flow record in the Beiluo River Basin during.
| Z Statistic of Indicated Flow Records with Significant Level |
|---|
| Flow Record | Annual | January–March | April–June | July–September | October–December |
|---|
| Streamflow | Baseflow | Streamflow | Baseflow | Streamflow | Baseflow | Streamflow | Baseflow | Streamflow | Baseflow |
|---|
| Q90 | −2.698 ** | −0.824 NS | −2.638 ** | −2.293 * | −1.836 NS | −3.008 ** | −2.526 * | −3.612 ** | −2.121 * | −2.465 * |
| Q80 | −2.345 * | −2.655 ** | −2.750 ** | −2.345 * | −2.043 NS | −2.646 ** | −2.629 ** | −3.086 ** | −2.000 * | −2.560 * |
| Q70 | −2.552 * | −2.612 ** | −2.620 ** | −2.457 * | −2.146 * | −2.345 * | −3.155 ** | −2.629 ** | −1.965 * | −2.371 * |
| Q60 | −3.138 ** | −2.422 * | −2.767 ** | −2.784 ** | −2.534 * | −2.405 * | −3.258 ** | −2.103 * | −2.189 * | −2.465 * |
| Q50 | −3.801 ** | −2.508 * | −3.069 ** | −2.965 ** | −2.836 ** | −2.379 * | −3.112 ** | −2.284 * | −2.362 * | −2.560 * |
| Q40 | −4.319 ** | −2.396 * | −3.164 ** | −2.870 ** | −2.879 ** | −2.164 * | −2.491 * | −2.233 * | −2.465 * | −3.043 ** |
| Q30 | −3.663 ** | −2.922 ** | −3.198 ** | −2.939 ** | −2.801 ** | −2.371 * | −1.905 NS | −2.681 ** | −2.371 * | −3.112 ** |
| Q20 | −3.241 ** | −2.870 ** | −3.655 ** | −3.026 ** | −2.664 ** | −2.491 * | −1.681 NS | −2.439 * | −2.293 * | −2.974 ** |
| Q10 | −1.776 NS | −2.931 ** | −3.801 ** | −2.939 ** | −2.965 ** | −3.077 ** | −2.267 * | −2.129 * | −1.845 NS | −2.896 ** |
| Mean | −3.319 ** | −2.931 ** | −3.224 ** | −2.733 ** | −3.060 ** | −2.612 ** | −2.646 ** | −2.629 ** | −1.948 NS | −2.965 ** |
| Max1 | −2.189 * | −2.026 * | −4.086 ** | −2.974 ** | −2.870 ** | −3.577 ** | −2.086 * | −1.767 NS | −0.948 NS | −3.043 ** |
| Max7 | −2.026 * | −2.095 * | −4.163 ** | −2.939 ** | −3.293 ** | −3.569 ** | −1.922 NS | −1.784 NS | −1.155 NS | −3.250 ** |
| Max30 | −5.162 ** | −2.396 * | −3.931 ** | −2.853 ** | −3.362 ** | −3.189 ** | −1.931 NS | −2.017 * | −1.457 NS | −3.448 ** |
| Min1 | −7.796 ** | −3.172 ** | −2.801 ** | −1.862 NS | −2.896 ** | −3.353 ** | −3.327 ** | −3.414 ** | −2.439 * | −2.801 ** |
| Min7 | −7.158 ** | −3.232 ** | −2.396 * | −1.940 NS | −1.948 NS | −3.189 ** | −2.405 * | −3.370 ** | −2.077 * | −2.750 ** |
| Min30 | −7.167 ** | −3.301 ** | −2.646 ** | −2.172 * | −2.500 * | −3.008 ** | −2.845 ** | −2.914 ** | −1.845 NS | −2.595 ** |
| −6.277 ** | X | −1.224 NS | X | −0.250 NS | X | −1.112 NS | X | −0.957 NS | X |
| −5.043 ** | X | −0.164 NS | X | 1.129 NS | X | 0.224 NS | X | 1.379 NS | X |
| N95 | 3.148 ** | X | 1.000 NS | X | 1.577 NS | X | 1.465 NS | X | 0.810 NS | X |
| N5 | −5.039 ** | X | −3.603 ** | X | −2.620 ** | X | −1.836 NS | X | −0.172 NS | X |
Table 2.
Abrupt points detected in flow records of streamflow and baseflow.
Table 2.
Abrupt points detected in flow records of streamflow and baseflow.
| Year of Statistically Significant Abrupt Point for Indicated Flow Record |
|---|
| Flow Record | Annual | January–March | April–June | July–September | October–December |
|---|
| Streamflow | Baseflow | Streamflow | Baseflow | Streamflow | Baseflow | Streamflow | Baseflow | Streamflow | Baseflow |
|---|
| 1987 | 1987 | 1987 | 1987 | 1987 | 1987 | 1988 | 1988 | 1987 | 1987 |
| 1987 | 1987 | 1987 | 1987 | 1987 | 1987 | 1988 | 1988 | 1987 | 1987 |
| 1987 | 1987 | 1989 | 1987 | 1987 | 1987 | 1990 | 1988 | 1987 | 1987 |
| 1987 | 1987 | 1989 | 1987 | 1991 | 1987 | 1993 | 1988 | 1987 | 1987 |
| 1989 | 1987 | 1987 | 1987 | 1991 | 1987 | 1993 | 1988 | 1988 | 1987 |
| 1994 | 1987 | 1987 | 1987 | 1991 | 1987 | 1996 | 1988 | 1988 | 1988 |
| 1994 | 1988 | 1987 | 1987 | 1994 | 1987 | NS | 1993 | 1994 | 1988 |
| 1994 | 1988 | 1987 | 1987 | 1994 | 1987 | NS | 1993 | 1994 | 1994 |
| 1994 | 1993 | 1987 | 1987 | 1994 | 1987 | NS | 1993 | NS | 1994 |
| 1994 | 1988 | 1987 | 1987 | 1991 | 1987 | 1996 | 1988 | 1988 | 1988 |
| 2003 | 1988 | 1991 | 1987 | 1991 | 1987 | NS | 1993 | NS | 1993 |
| NS | 1988 | 1992 | 1987 | 1994 | 1987 | NS | 1993 | NS | 1993 |
| 1996 | 1988 | 1992 | 1987 | 1994 | 1987 | NS | 1993 | NS | 1988 |
| 1990 | 1987 | 1986 | 1986 | 1987 | 1987 | 1988 | 1986 | 1987 | 1986 |
| 1987 | 1987 | 1986 | 1986 | 1987 | 1987 | 1987 | 1989 | 1987 | 1986 |
| 1987 | 1987 | 1986 | 1986 | 1987 | 1987 | 1987 | 1988 | 1987 | 1986 |
| 1987 | X | 1988 | X | 1987 | X | 1988 | X | NS | X |
| NS | X | NS | X | 1987 | X | NS | X | NS | X |
| 1991 | X | NS | X | 1992 | X | 1988 | X | NS | X |
| NS | X | 1991 | X | 1991 | X | NS | X | NS | X |
Table 3.
Characteristics of daily FDCs of streamflow in the Beiluo River Basin.
Table 3.
Characteristics of daily FDCs of streamflow in the Beiluo River Basin.
| Item | Annual | January–March | April–June | July–September | October–December |
|---|
| (m3/s) | 14.10 | 10.80 | 12.10 | 22.30 | 14.60 |
| ) | 4.26 | 2.41 | 3.05 | 5.43 | 3.04 |
| ) | 0.14 | 0.16 | 0.15 | 0.15 | 0.13 |
Table 4.
Comparison for daily streamflow discharge characteristics before and after the abrupt point year in Beiluo River Basin.
Table 4.
Comparison for daily streamflow discharge characteristics before and after the abrupt point year in Beiluo River Basin.
| Item | Annual | July–September |
|---|
| 1970–1994 | 1995–2018 | 1970–1996 | 1997–2018 |
|---|
| (m3/s) | 17.70 | 10.70 | 27.10 | 16.85 |
| ) | 4.04 | 4.42 | 5.60 | 5.55 |
| ) | 0.18 | 0.15 | 0.18 | 0.14 |
Table 5.
Results of trend and abrupt-point analysis for precipitation and temperature in different quarters.
Table 5.
Results of trend and abrupt-point analysis for precipitation and temperature in different quarters.
| Season | Z Statistic with Sig. Level | Abrupt Point Year with Sig. Level |
|---|
| Precipitation | Temperature | Precipitation | Temperature |
|---|
| January–Mar | 0.095 ns | 4.431 ** | — | 1996 ** |
| April–June | −0.442 ns | 4.120 ** | — | 1996 ** |
| July–September | −0.009 ns | 3.431 ** | — | 1993 ** |
| October–December | −0.750 ns | 3.569 ** | — | 1997 ** |
Table 6.
Transition matrix of land-use change and total area of different land use from 1980 to 2015 in the Beiluo River Basin (km2).
Table 6.
Transition matrix of land-use change and total area of different land use from 1980 to 2015 in the Beiluo River Basin (km2).
| 1980 to 2015 | Grassland | Residential | Farmland | Forestland | Water | Unused Land | Total in 2015 |
|---|
| Grassland | 10,299.7 | 6.4 | 149.5 | 144.2 | 4.1 | 2.5 | 10,606.4 |
| Residential | 0.0 | 255.2 | 0.0 | 0.0 | 0.0 | 0.0 | 255.2 |
| Farmland | 148.9 | 104.6 | 8520.3 | 122.1 | 9.5 | 3.3 | 8908.7 |
| Forestland | 111.4 | 4.3 | 10.6 | 6882.5 | 1.6 | 18.4 | 7028.8 |
| Water | 4.2 | 0.0 | 3.7 | 1.0 | 108.4 | 0.0 | 117.3 |
| Unused land | 3.5 | 0.0 | 2.2 | 2.4 | 3.3 | 4.0 | 15.4 |
| Total in 1980 | 10,567.7 | 370.5 | 8686.3 | 7152.2 | 126.9 | 28.2 | 26,931.8 |
Table 7.
Contribution rates of precipitation and human activities to different periods before and after abrupt point year in the Beiluo River Basin.
Table 7.
Contribution rates of precipitation and human activities to different periods before and after abrupt point year in the Beiluo River Basin.
| Period | Measured Value (108 m3) | Theoretical Value (108 m3) | Variation of Measured Streamflow | Impact of Rainfall | Impact of Human Activities |
|---|
| Amount of Variation | Percent (%) | Amount of Impact | Percent (%) | Amount of Impact | Percent (%) |
|---|
| 1970–1994 | 8.38 | 8.38 | | | | | | |
| 1995–2018 | 4.53 | 8.02 | 3.85 | 45.9 | 0.36 | 9.4 | 3.49 | 90.6 |
| 1995–1999 | 5.39 | 7.50 | 2.99 | 35.7 | 0.88 | 29.4 | 2.11 | 70.6 |
| 2000–2009 | 4.42 | 8.14 | 3.96 | 47.3 | 0.24 | 6.1 | 3.72 | 93.9 |
| 2010–2018 | 4.19 | 8.46 | 4.19 | 50.0 | −0.08 | −1.91 | 4.27 | 101.91 |
| Publisher’s Note: MDPI stays neutral with regard to jurisdictional claims in published maps and institutional affiliations. |
© 2021 by the authors. Licensee MDPI, Basel, Switzerland. This article is an open access article distributed under the terms and conditions of the Creative Commons Attribution (CC BY) license (https://creativecommons.org/licenses/by/4.0/).


