Article

Evaluation and Optimization of Low Impact Development Designs for Sustainable Stormwater Management in a Changing Climate

1
Department of Civil and Environmental Engineering, Washington State University, Richland, WA 99354, USA
2
Surface Water Utility, Public Works Department, City of Renton, Renton, WA 98057, USA
*
Author to whom correspondence should be addressed.
Water 2021, 13(20), 2889; https://doi.org/10.3390/w13202889
Submission received: 28 August 2021 / Revised: 3 October 2021 / Accepted: 11 October 2021 / Published: 15 October 2021
(This article belongs to the Section Urban Water Management)

Abstract

:
The increasing intensity and frequency of extreme storms pose a growing challenge to stormwater management in highly urbanized areas. Without an adequate and appropriate stormwater system, the storms and associated floods will continue to cause significant damage to infrastructure and loss of life. Low Impact Development (LID) has become an emerging alternative to the traditional stormwater system for stormwater management. This study evaluates and optimizes applications of different combinations of LIDs to minimize flows from a catchment under past and future storm conditions. The Storm Water Management Model (SWMM), forced by observed and downscaled precipitation from Coupled Model Intercomparison Project phase 6 (CMIP6), was used to simulate the runoff and apply the LIDs in the Renton City, WA. The final results show that the performance of LIDs in reducing total runoff volume varies with the types and combinations of LIDs utilized. A 30% to 75% runoff reduction was achieved for the past and future 50 year and 100 year storms. The study demonstrates the effectiveness of LID combinations with conventional stormwater systems to manage the future runoff in the study area, which is expected to increase by 26.3% in 2050.

1. Introduction

The changes in land use associated with urbanization affect flooding in many ways. Urban development alters the natural landscapes by modifying the surface topography, replacing the vegetated and pervious areas with impervious surfaces, and compacting the soil, which ultimately leads to the increase in direct conversion of rainfall to runoff [1,2,3,4,5]. Despite the use of a dense stormwater drainage system, major flooding is often associated with urbanized areas [6,7]. The warming climate further intensifies this problem by increasing the frequency and intensity of extreme precipitation [6,7,8,9,10,11,12] and severe floods [8,11]. With the continuous growth in urbanization and rising global temperatures, effective management of the stormwater has become increasingly challenging [12,13,14]. The challenge is further exacerbated by the use of conventional and aging stormwater infrastructure, making communities across the globe vulnerable to increasing flood risk [15,16]. The existing stormwater systems are already beeing overwhelmed by the present-day storm conditions in many areas [17]. Appropriate modifications of existing stormwater systems, including revision and updating the design practices and standards, retrofit of the existing infrastructure, and construction of additional ones, are required to mitigate the increasingly frequent occurrence of urban flooding [18].
Traditionally, stormwater is managed by collecting storm runoff through a network of conveyance systems made of gutters, concrete channels, and pipes that help drain the excess water into nearby rivers and lakes [19]. This system of stormwater management is also known as end-of-pipe practices involving centralized management [20]. In most older cities, this traditional system has shown limited ability to handle the increased flow volume, quicker time of concentration, and high peak flow [21]. Consequently, the system is susceptible to causing frequent flooding in the future [22]. In the early 1990s, environmental managers, architects, and civil engineers proposed an alternative design approach, also known as Low Impact Development (LID), to improve the efficiency of traditional stormwater management. The LID practices are considered to provide better functioning of the hydrological and environmental systems in urban areas [23]. The approach was proven to significantly control the discharge and peak flow compared to the traditional counterparts [3,24]. The LID practices are environmentally sustainable as they shift the focus of urban stormwater management systems from using drainage pipes to designing runoff storage, increasing infiltration, reducing runoff quantity, and improving runoff quality [25]. The most common LID practices include preamble pavements, bio-retention ponds, rain gardens, infiltration trenches, vegetated bio-swales, and rain barrels that foster retention, infiltration, evaporation, transpiration, groundwater recharge and discharge, and storage [26]. However, despite their significant environmental and hydrological benefits, implementation and maintenance of LIDs are costly [27,28]. Furthermore, little is known about their effectiveness under climate-driven extreme flood conditions [27,29].
Several studies have compared LIDs with traditional methods of stormwater management. Gilroy and McCuen [29] evaluated two LIDs (cisterns and bioretention pits) versus the traditional stormwater system in Maryland, USA. They pointed out that the conventional off-site stormwater management system is not effective for small watersheds. They also found that the size and spatial location of the LIDs affect their effectiveness in reducing peak flows and total runoff volume. Dietz and Clausen [3] found the LIDs outperformed the traditional practices for sustainable stormwater management at the watershed scale. A similar study by Hood et al. [23] in Connecticut, USA, found that LIDs effectively decrease runoff volume and peak flow rate by more than 1000% compared to the traditional stormwater system. The time of concentrations of the hydrographs from the LIDs are also significantly longer for intense storms with short durations and low soil moisture conditions [23].
Although several studies have been conducted to evaluate the hydrological and environmental benefits of LIDs, very few have assessed the LIDs under future precipitation [30]). Zahmatkesh et al. [31] evaluated LIDs under climate change scenarios in New York City using SWMM and storm data from Coupled Model Intercomparison Project Phase 5 (CMIP5). Their results indicated an overall increase of 48% in annual runoff volume due to climate change, and the LIDs provide nearly 41% and 8–13% reduction of the volume and peak flow, respectively. Zhou et al. [32] assessed the impact of climate change on urban flood volumes under Representative Concentration Pathway (RCP 2.6 and RCP 8.5) scenarios and the effectiveness of LIDs to reduce the flood volume in the city of Hohhot in northern China. Their findings revealed that flood volume is due to increase by as much as 52% in the future and that the LIDs were more effective in tackling the flood than the climate change mitigation measures through reduction of carbon emission.
Earlier studies were mainly focused on the modeling of LIDs in small areas within the watersheds [33,34,35], providing little understanding about their effects on the overall watershed hydrology [36]. Large scale hydrologic and hydraulic modelling and optimization of LIDs with conventional stormwater systems remain challenging. Most studies generally consider single types of LIDs, for example, permeable pavements [37], bioretention ponds/rain gardens [38,39], rain barrels [40], rainwater harvesting/permeable pavement [41], and bio-swales [42]. This is mainly due to the modeling difficulties and lack of data to simultaneously simulate and optimize combinations of several LIDs. In some cases, LIDs failed to achieve desired expectations of reducing stormwater runoff and flooding problems since most of the models did not accurately incorporate the physical characteristics of LIDs, such as the size and location [43,44,45]. To gain the full benefit from the combined LID and conventional stormwater systems, optimized implementation, in terms of size, location, and type, plays an important role [19,46,47].
Therefore, to fill these research gaps, comprehensive hydrologic and hydraulic modeling is required that simulates and optimizes several LIDs under current and future extreme storm events [27,48]. There are several hydrologic-hydraulic models, including Storm Water Management Model (SWMM), Western Washington Hydrology Model (WWHM2012), System for Urban Stormwater Treatment and Analysis Integration (SUSTAIN), Urban Drainage and Sewer Model (MOUSE), Distributed Routing Rainfall-Runoff Model (DR3M), Storage, Treatment, Overflow, Runoff Model (STORM), and Long-Term Hydrologic Impact Assessment-Low Impact Development (L-THEA-LID), which are commonly used to simulate the effects of LID on hydrology and water quality [49,50,51]. Among them, the SWMM model has been extensively used in the U.S. and many other countries worldwide [27,46,52,53,54]. For the present study, SWMM was selected due to its ability to model dynamic rainfall-runoff properties in urban environment, easy to use graphic user interface (GUI) and its wide applicability for planning, analysis and design related to drainage systems in urban areas. SWMM can simulate the peak discharge, runoff volume, and water quality for short- and long-term rainfall events, making it suitable for designing and implementing several LIDs [46,52,53,54].
Different LIDs (e.g., bioretention cells, bioswales, infiltration trenches, rain gardens, and permeable pavements) are incorporated into the model to evaluate their effectiveness in reducing the runoff characteristics (e.g., total flow and peak flow). The efficacy of each LID was evaluated by the ability to turn-on and turn-off specific LIDs and assess the changes in flood level. The study also incorporates the change in storms into the stormwater system design based on different climate change scenarios and models. While design storms derived from historical observations are often used in stormwater management design and planning, they may not represent the potential change in future precipitation. Given that most stormwater systems are designed to last for multiple decades into the future, consideration of future extreme storms is essential. Non-stationary IDF curves are developed using both the observed precipitation and downscaled future precipitation data obtained from the CMIP6 climate models under Sharted Socioeconomic Pathways (SSP585) scenarios. Furthermore, the LIDs implementation requires optimization of their types, sizes, and spatial distributions. The study determines suitable sizes and locations of the LIDs by comparing them with the existing stormwater system for both the historical and future 50 year and 100 year storm events.

2. Materials and Methods

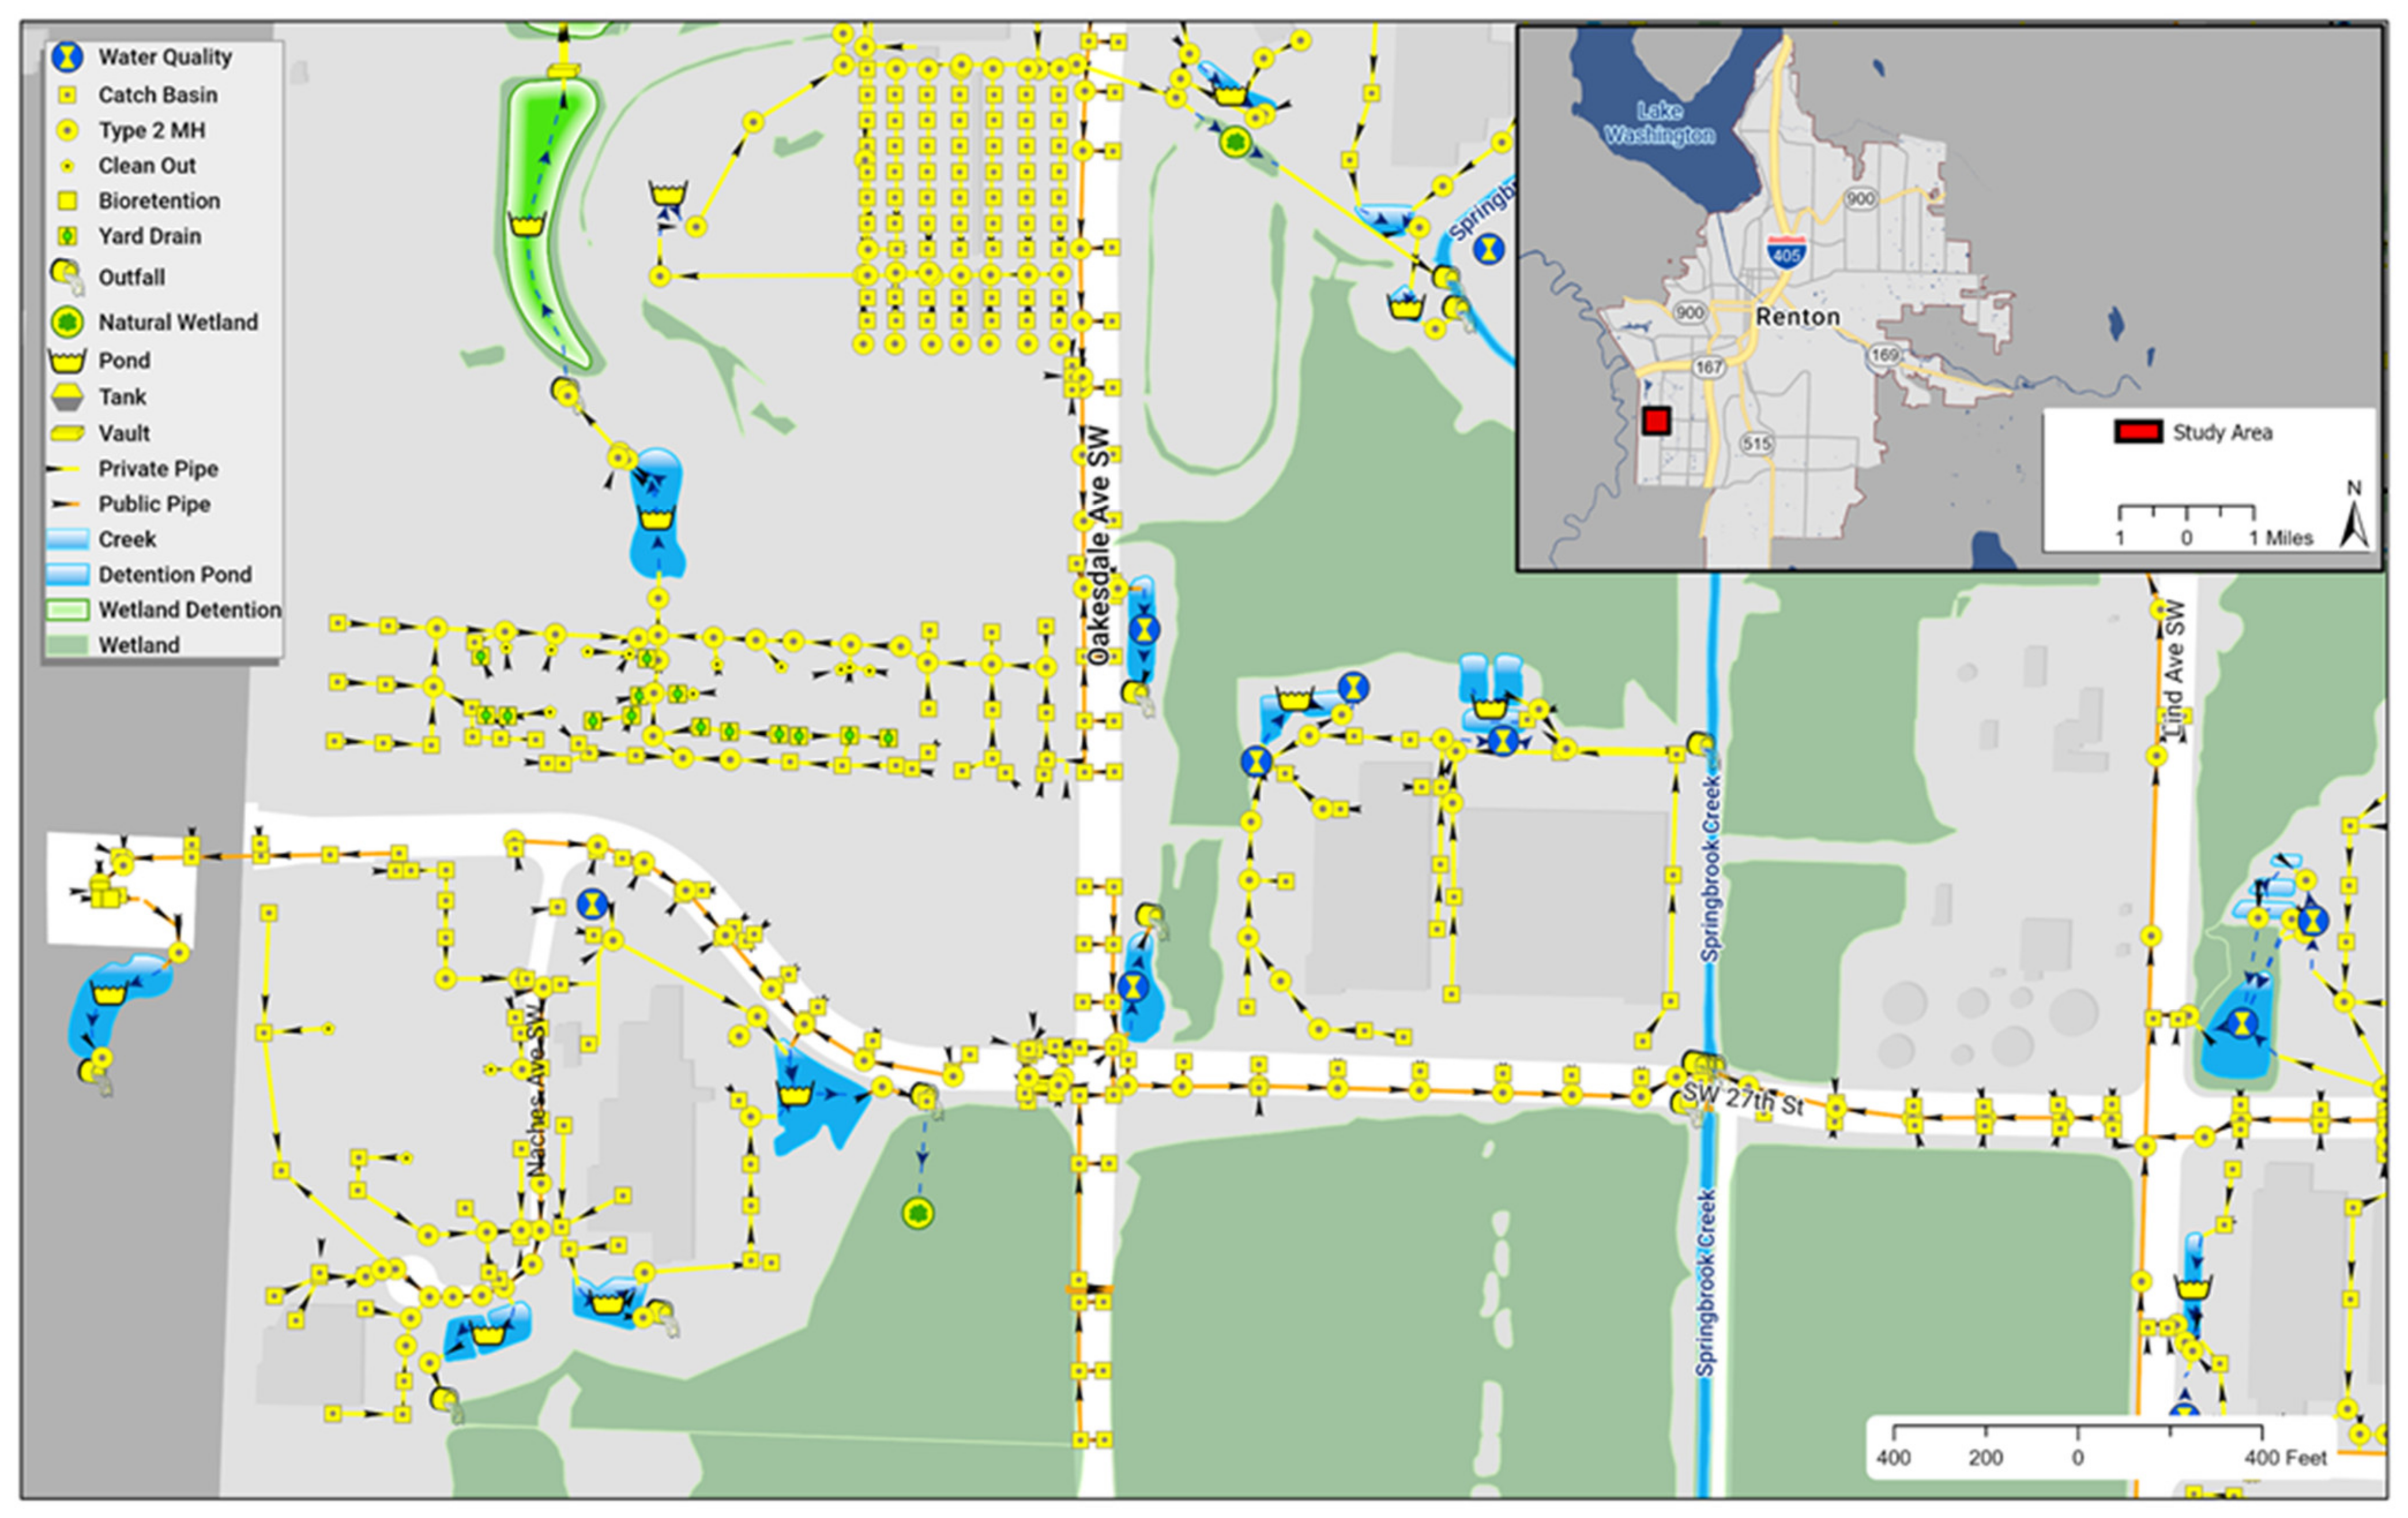
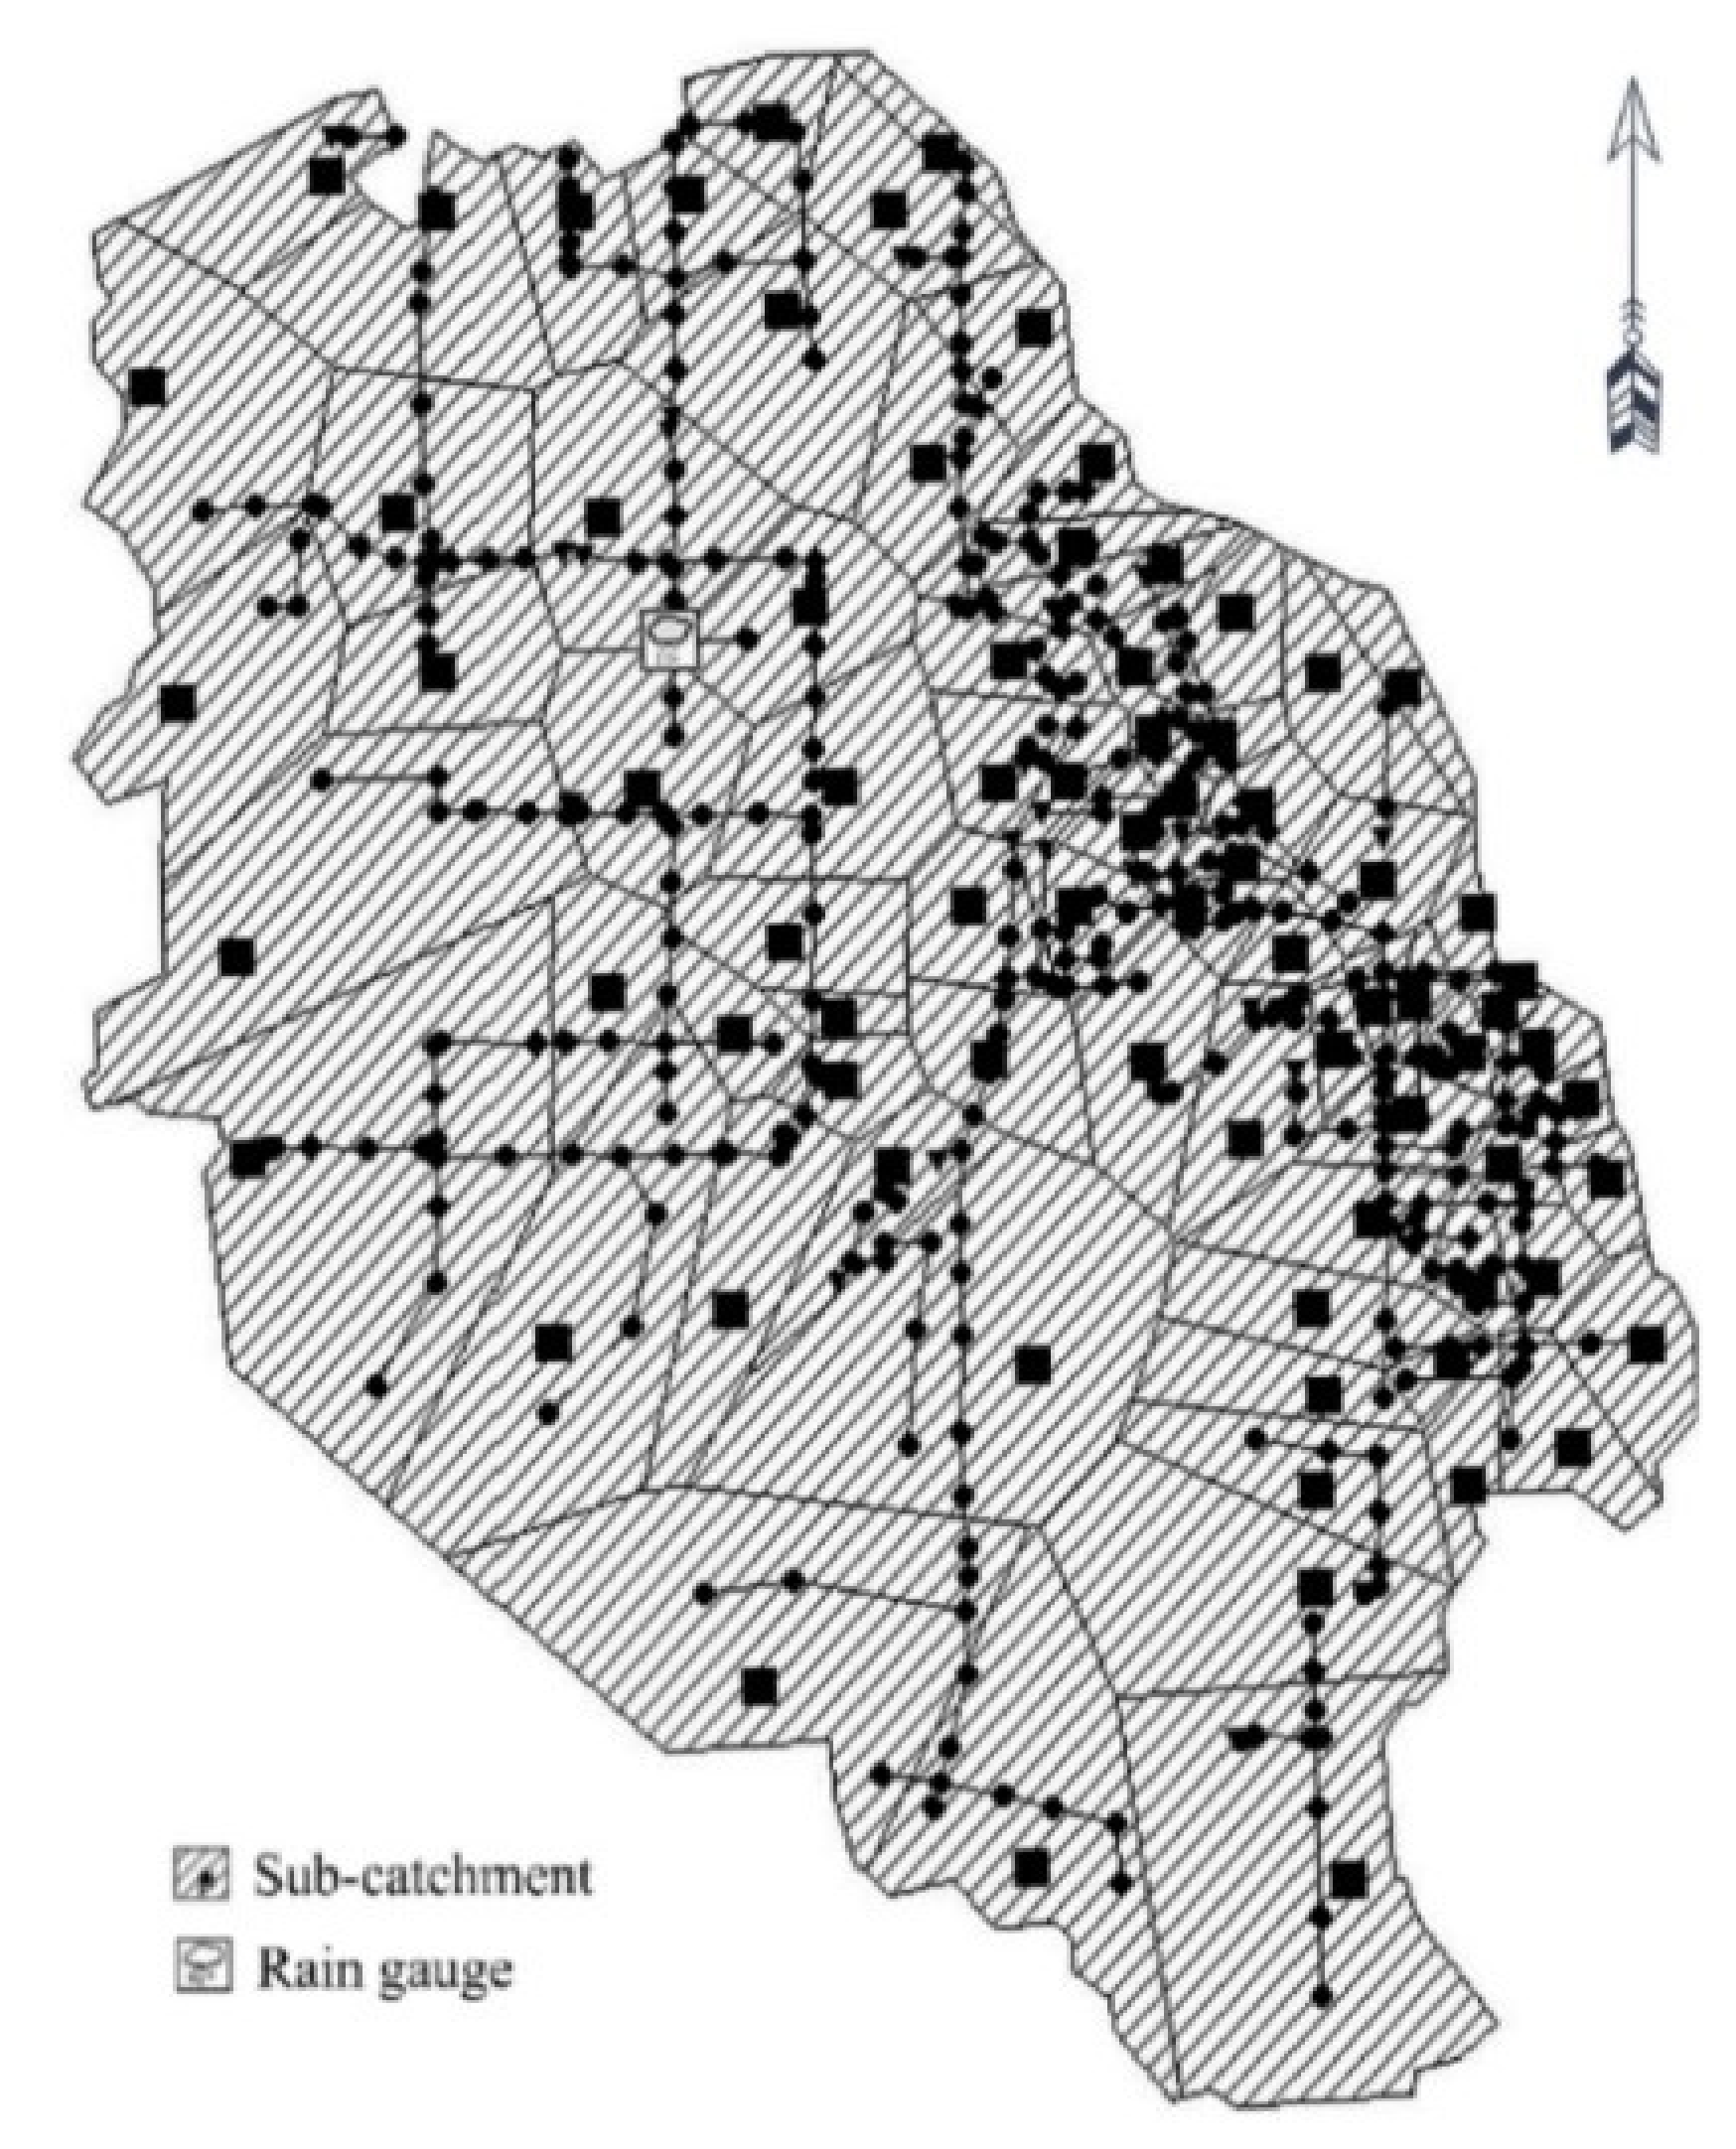
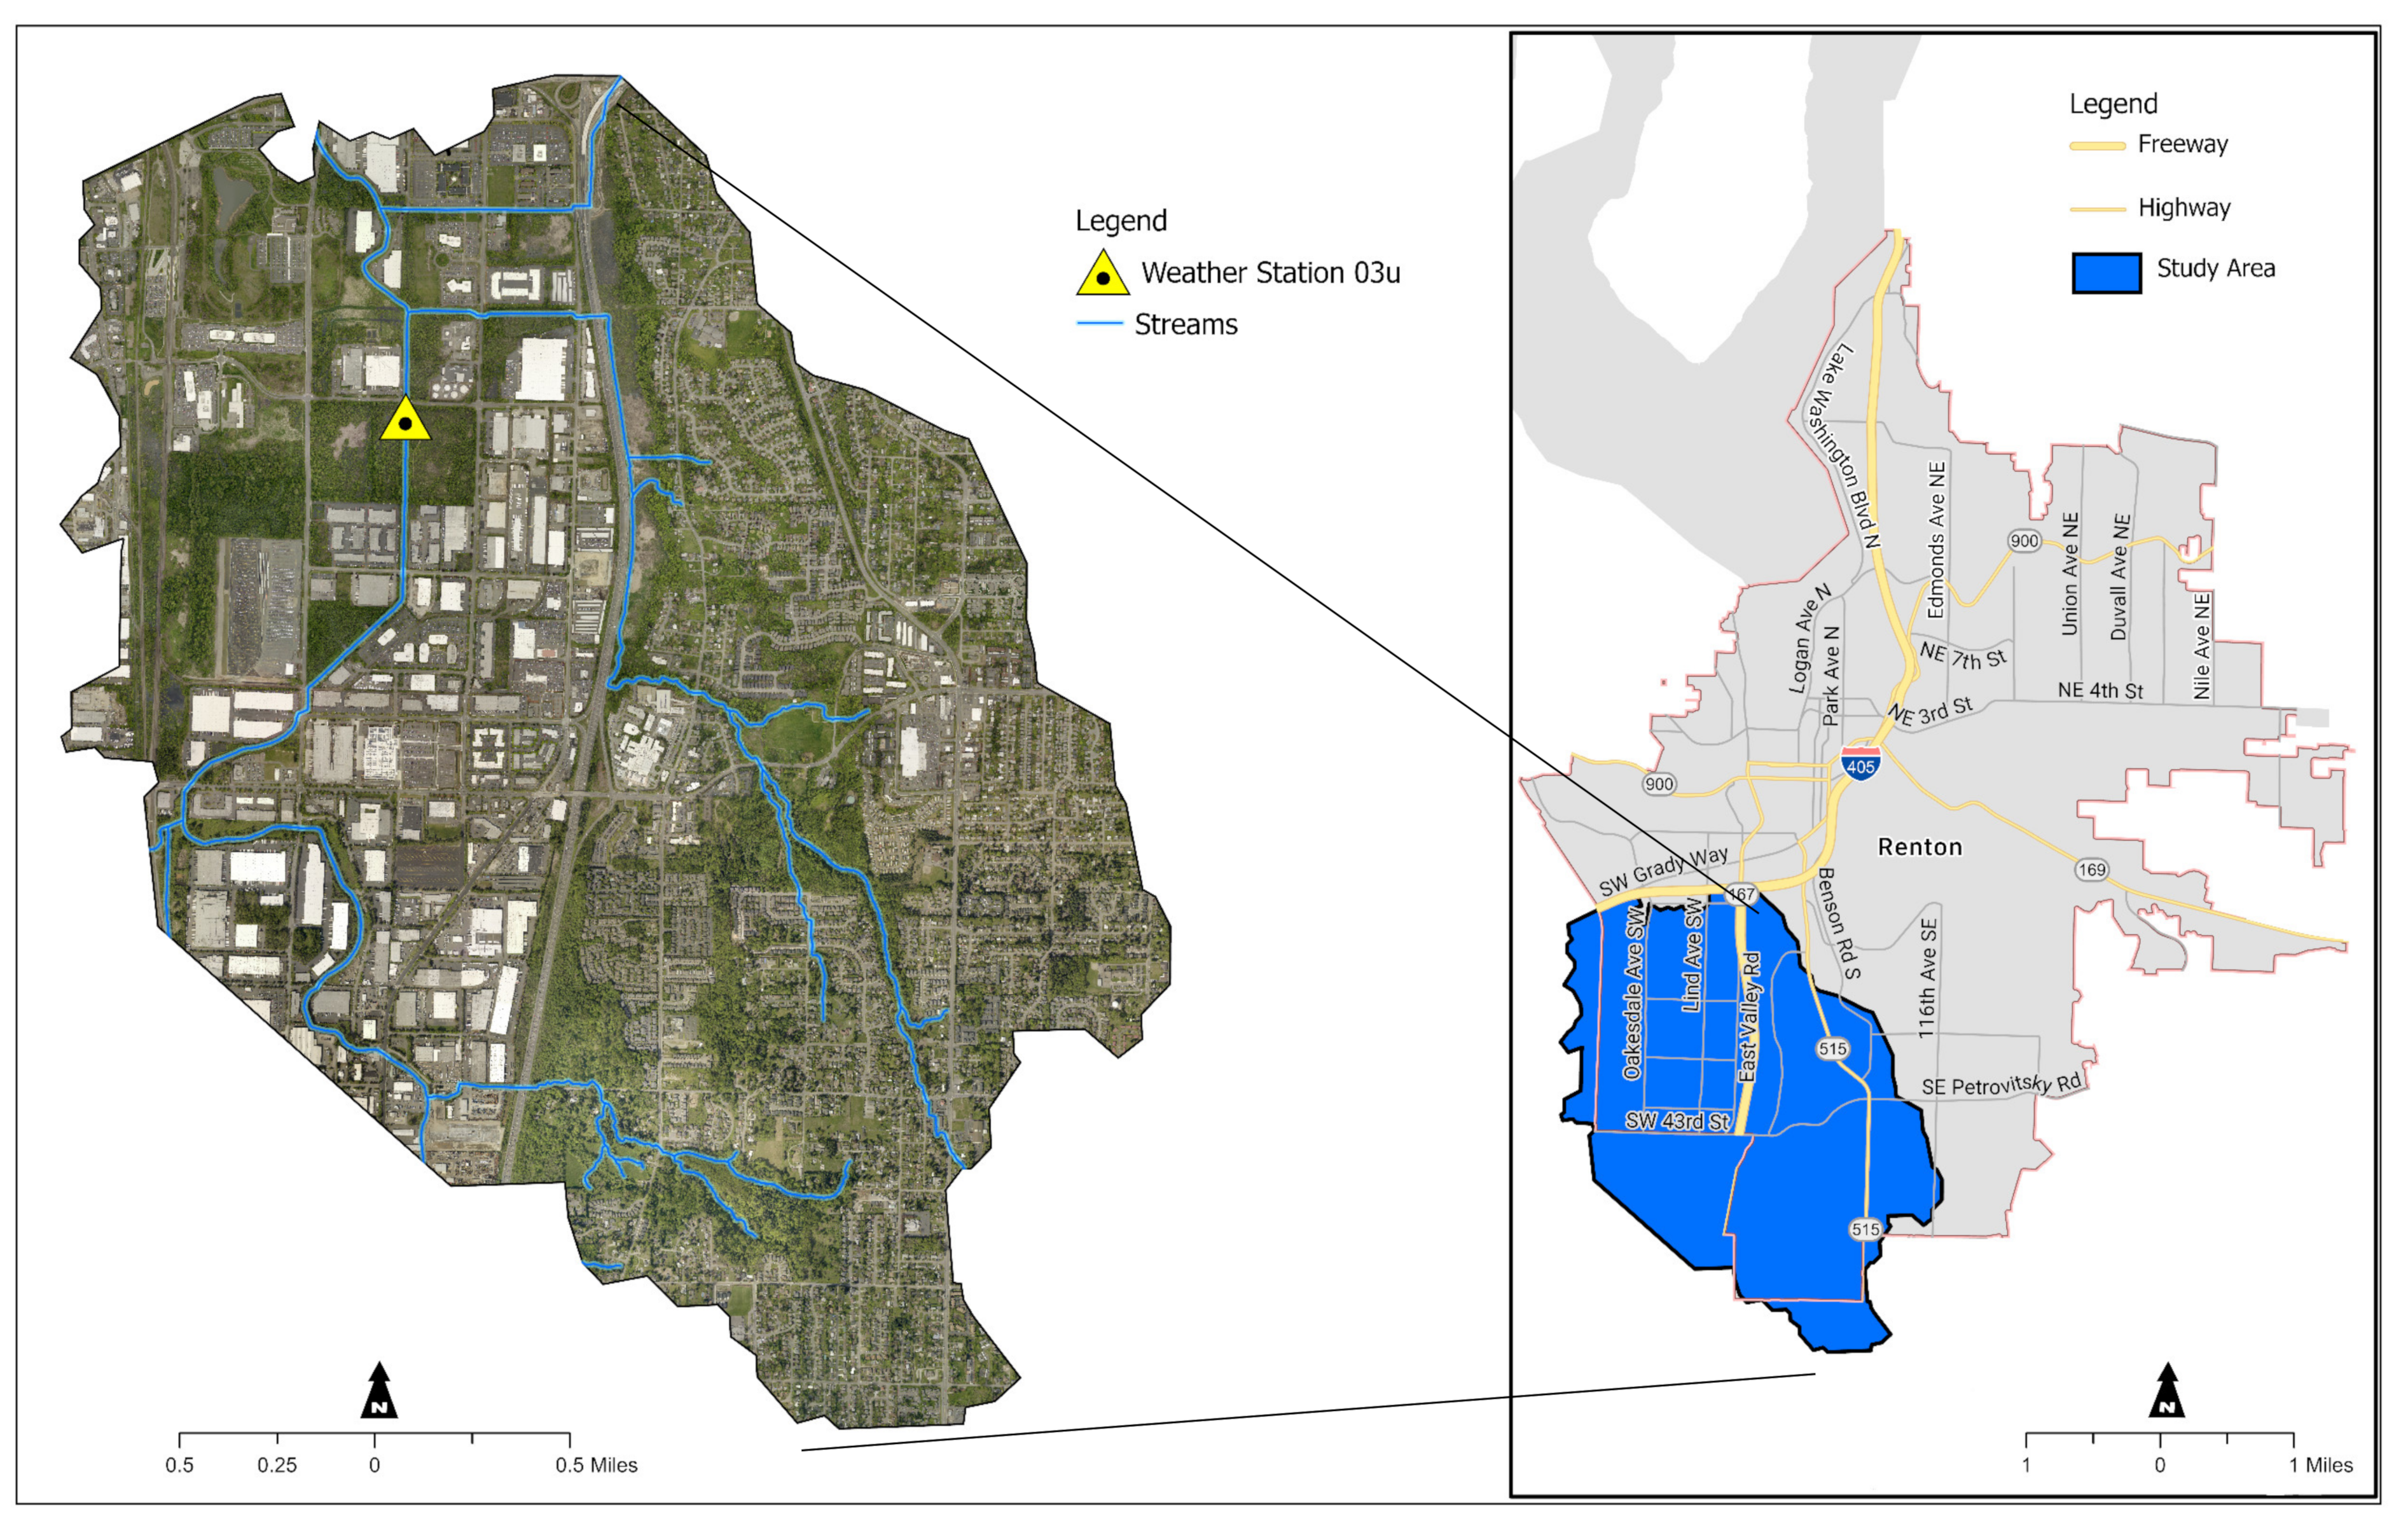
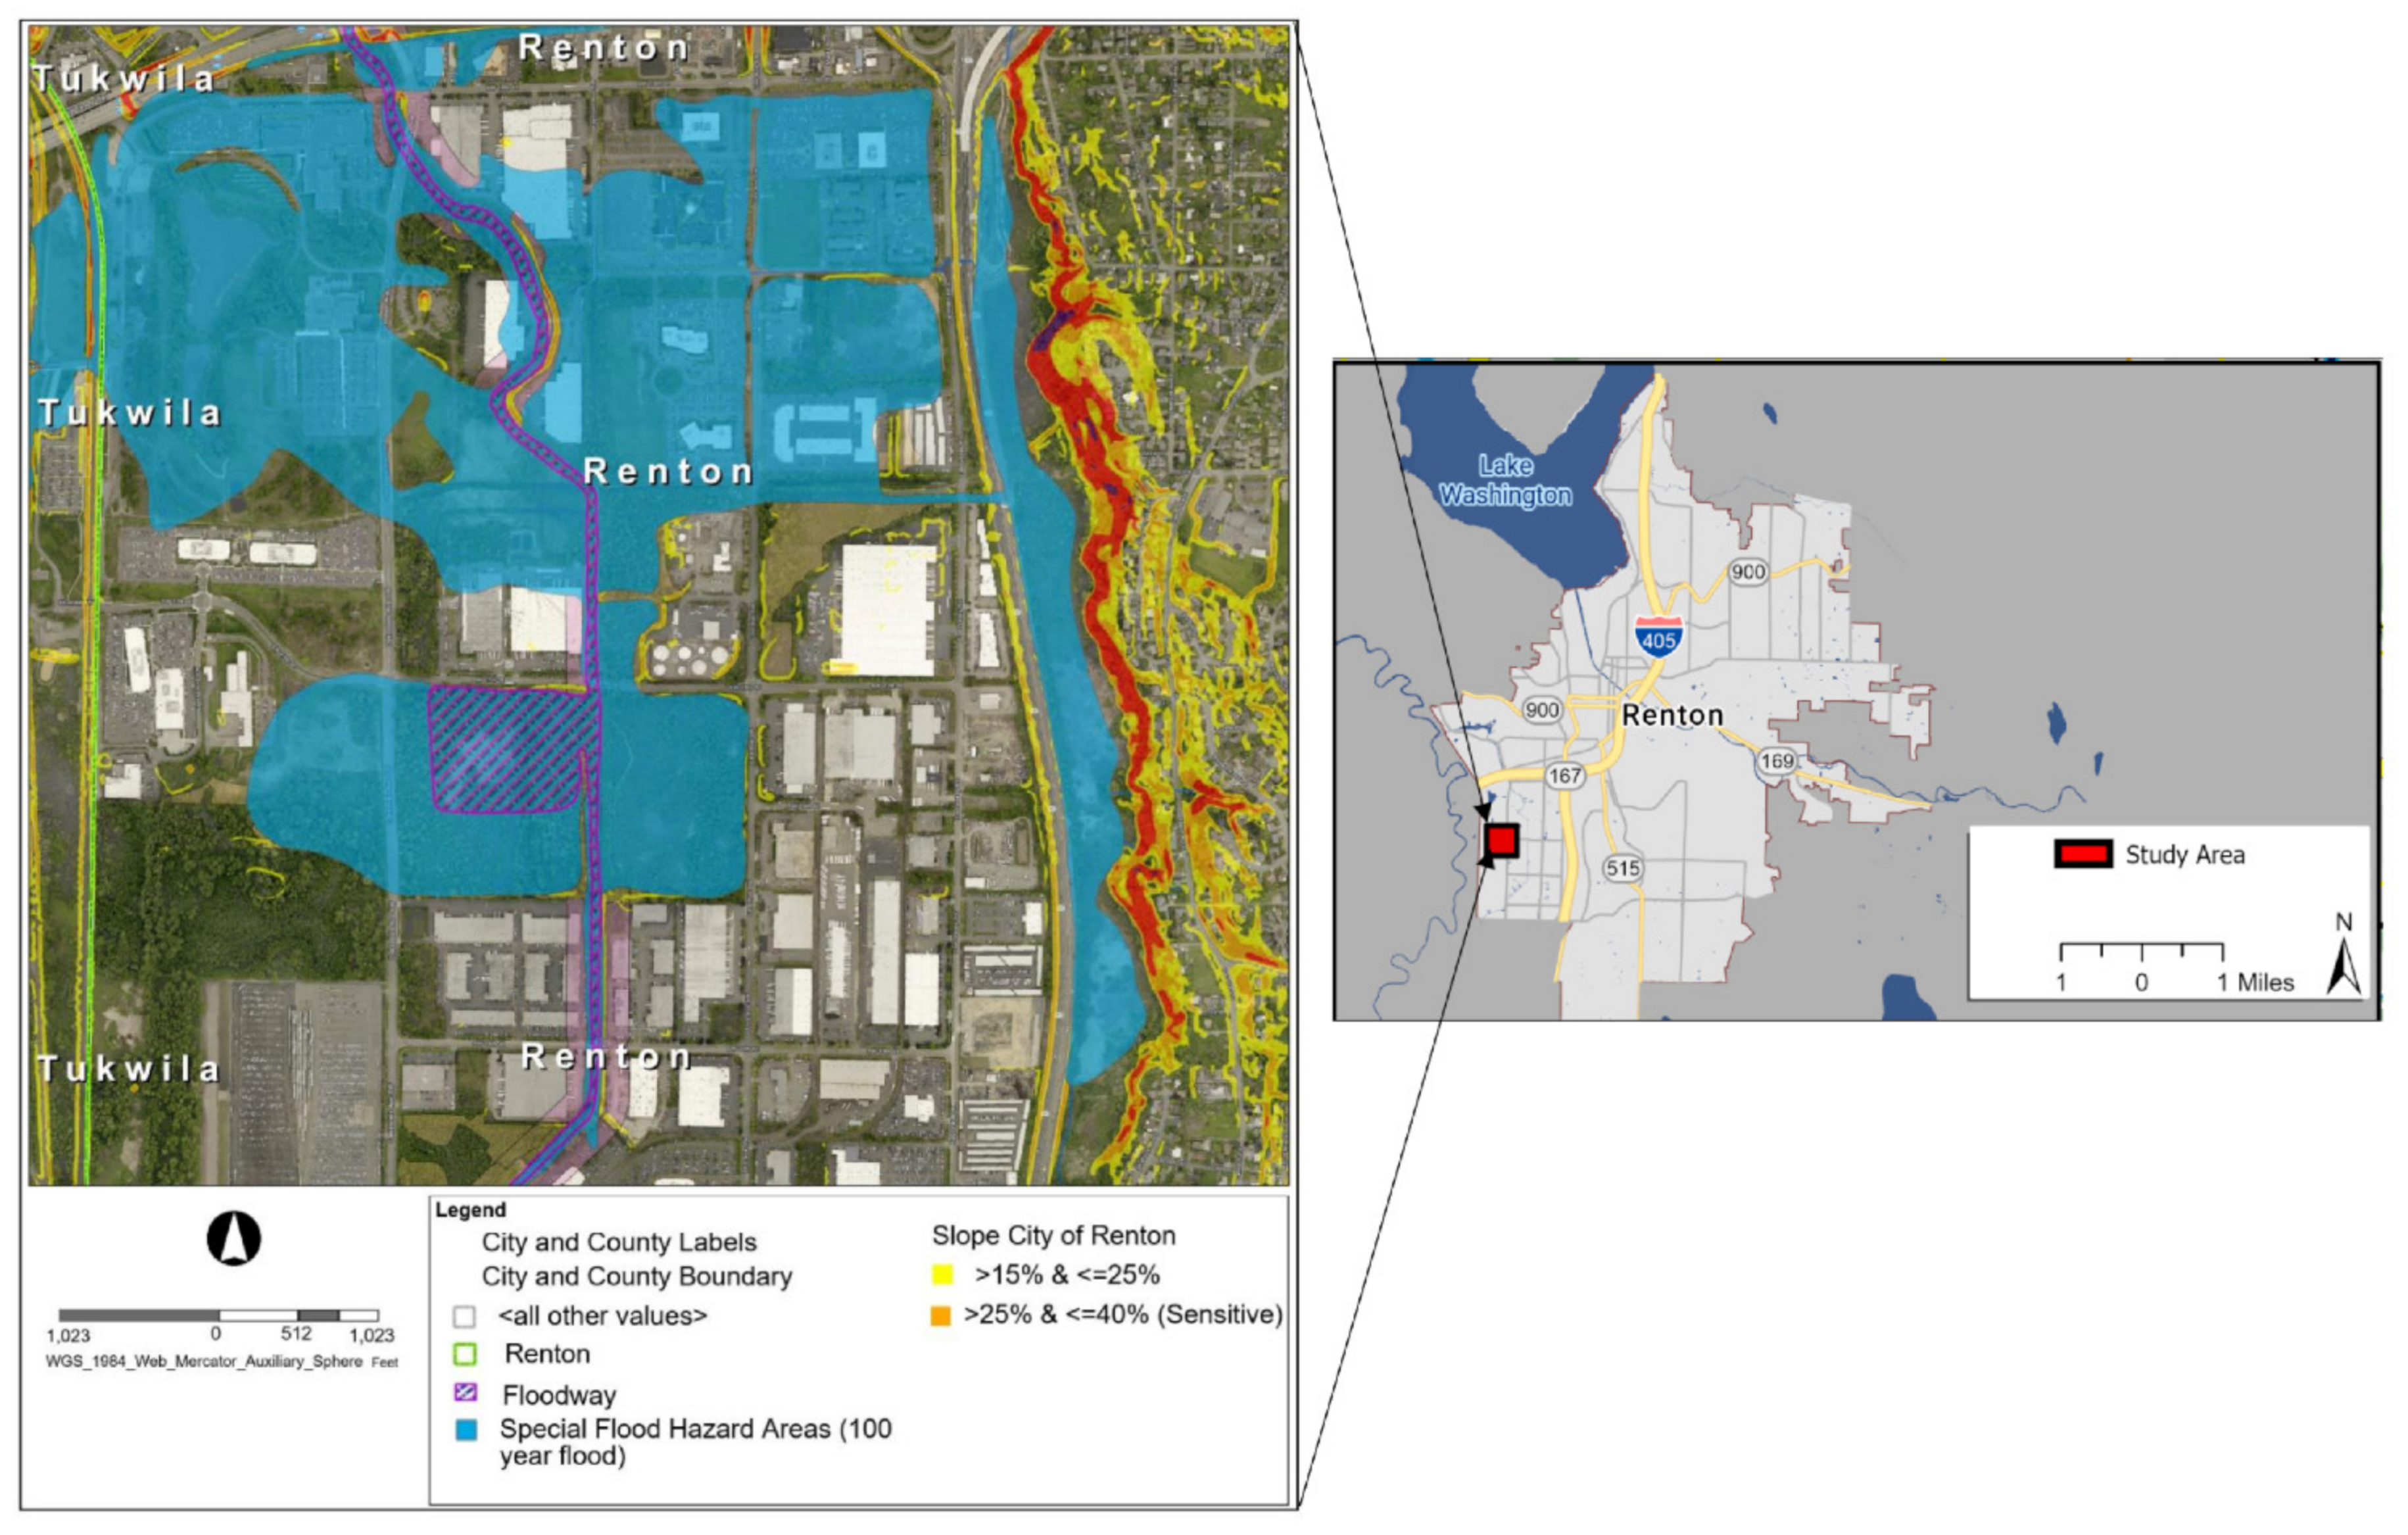
2.1. Study Area and Data

The case study area lies in the Springbrook Creek drainage basin, located in the southwest part of Renton City, Washington State (WA), USA. The city of Renton is a fast-growing city in WA that is also currently suffering from frequent stormwater-related flooding, making it an appropriate testbed for this study. The selected urban watershed, shown in blue shade in Figure 1, covers 15 km2 area that comprises mostly warehouse styles buildings. Along the drainage boundaries of the study area, there are wooded areas, limited parking lots, and other paved areas. The majority of the impervious areas are connected to the drainage system, including underground pipes and catch basins that direct surface runoff from the streets, parking lots, and buildings towards a detention wetland for natural water quality treatment and retention.
The primary cause of floods in the city is heavy precipitation during the late fall and winter seasons. Parts of the city have already experienced many challenges to manage stormwater adequately and effectively. For example, the city has experienced significant flooding in 2009, 2019 and 2020 [55]. In December 2019, 114 mm (4.46 in) of rainfall was recorded in 24 h, causing major basement and street flooding [56]. The city’s climate change adaptation plan suggested that this type of extreme event would be more frequent and intense in the future. A comprehensive study conducted by Kitsap County in western WA using global climate models (GCMs) projected an increase of 15% and 24% in the maximum daily precipitation by 2080 under RCP4.5 and RCP8.5, respectively [57]. The projected increase in winter precipitation and streamflow in the western part of WA are expected to increase the flood risks in the Puget Sound region and the Cedar River Watershed, where the Renton City is located [58]. The increasing precipitation trends will influence the ability of the existing conveyance system to convey stormwater and can be a trigger for the occurrence of major floods [59].
The historical precipitation data were obtained from a King County weather station (known as 03u-Panther Creek Station, https://green2.kingcounty.gov/hydrology/GaugeMap.aspx) (accessed on 6 August 2020). The station is located within the study area (Figure 1) and has 60 years of hourly rainfall records. In addition to historical data, we have considered the precipitation projections from 2020 to 2050 under different scenarios from the Model for Interdisciplinary Research on Climate (MIROC6) and Centro Euro-Mediterraneo sui Cambiamenti Climatici (CMCC) models, which are part of CMIP6 and known to perform better in the region [60]. The historical data from 1994 to 2014 were used as a baseline to downscale the precipitation projections.
10 m resolution land use data were obtained from the City of Renton database [56]. The city comprises mostly commercial buildings with 2030 m2–12,140 m2 areas, wooded areas, limited parking lots, and paved areas. 48% of the area is impervious, 12% is woodland with dense growths of trees, and the rest are vegetation areas, which mainly consist of grasses, small deciduous trees, and shrubs. In recent years, some of the wooded areas have been converted into residential areas to accommodate the city’s growth. The newly developed areas, which were not marked on the original city map, were delineated in this study based on on-site inspection.
A 0.5 m resolution digital elevation model (DEM) was obtained from the City of Renton database (CORMAP). The topography is relatively flat, with an approximately 3 m change (from 6 m to 9 m) in the elevation across the study area. It slopes slightly (0.5%) to the northeast towards the wetland. The elevation difference is used to design the stormwater conveyance system (Emerson et al., 2005). A 10 m soil data obtained from Soil Survey Geographical Database (SSURGO 2.2) was used with the USDA’s hydromorphic classifications [61]. The dominant soil type in the study area is Woodinville Silty Loam (Wo), with traces of Newberg Silty Loam (Ng) and Puget Silty Clay Loam (Pu). The Wo and Pu soil types have relatively slower permeability rate with higher runoff potential, whereas Ng soil type has a moderate to rapid permeability rates with relatively lower runoff potential.
Part of the existing stormwater system in the study area is shown in Figure 2. The system generally consists of curbs, gutters, channels, and ditches to carry runoff from the roadways and drains to Springbrook Creek, which heads toward the northeast. The outfalls of existing surface water conveyance system are illustrated in Figure 2. The creek drains approximately 25 square miles of highly urbanized areas in the western King County, WA [62]. For this study, the watershed area was divided into 120 lots. Most of the drainage pipes were designed in 1997, making several areas (for example, eastern part of study area, SW 27th Street, Lind Avenue SW and Springbrook Creek crossing of Oakesdale Avenue) to be flood prone. Daily flow data obtained from the USGS flow monitoring station, which is located at the outfall of the Springbrook Creek (gage id 12113346), the watershed was used for calibration and validation of the SWMM model.
In 2000, the city began working with FEMA to develop a methodology for flood control improvements [63] and to solve existing flooding problems. Consequently, a comprehensive stormwater system improvement project was implemented to solve existing and anticipated future street floods. However, the target water surface elevations in some areas were not achieved the desired level of protection as shown in Figure 3 [64]. The flood zone designation for the study is primarily Zone X (areas outside the 500 year floods inundation) and Zone AE (areas subject to inundation by the 100 year floods). The 100 year floodplain is located at an approximate elevation of 4.8 m in Zone AE [55]. The embankment slopes along Springbrook Creek range from 40% to 60%, which are considered flood-sensitive slopes [65]. The 100 year peak flow to existing systems will cause severe flooding and erosion in the area [63]. Therefore, using the existing conveyance system without appropriate modifications will aggravate the flooding problems with the anticipated increase in storm events in the future.

2.2. Methodologies

Nonstationary IDF curves, the SWMM model, various LID scenarios in combination with the existing stormwater system were used to evaluate and improve the stormwater system under both current and future storm conditions. Figure 4 shows the schematic representation of the different methodologies involved.

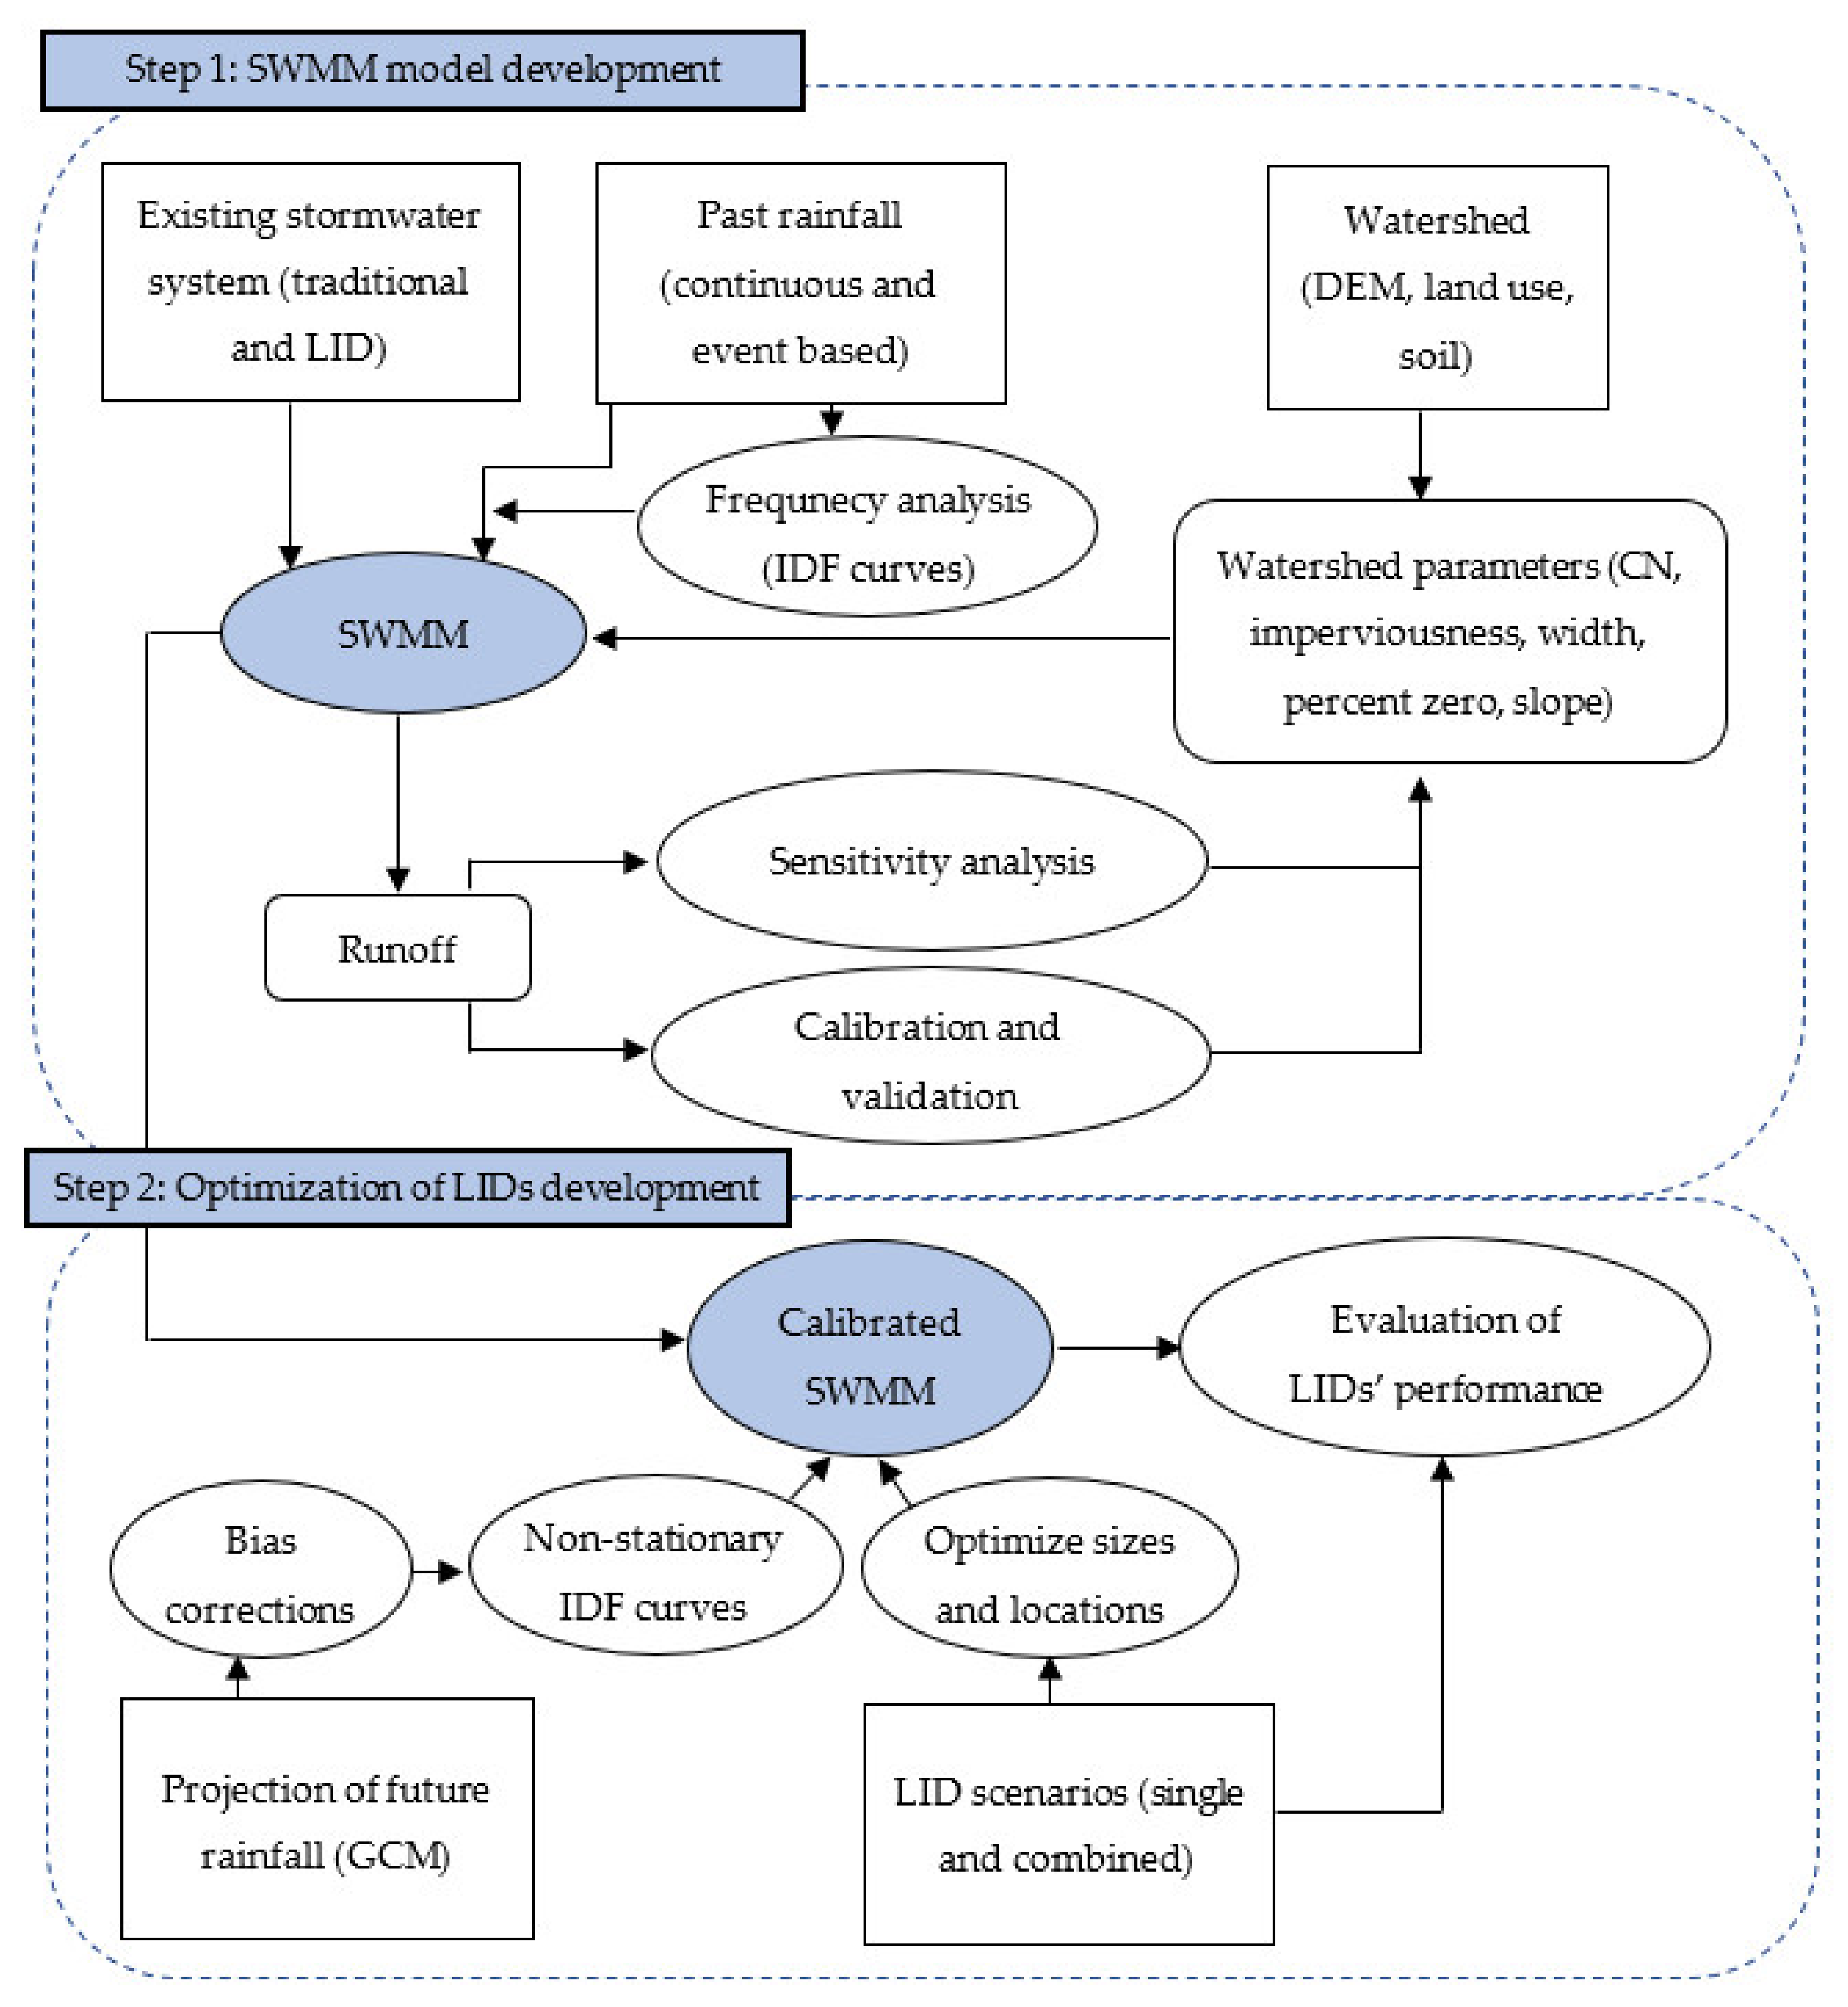
2.2.1. SWMM-Model Development

SWMM-5 was used to simulate the stormwater runoff and flow in the open channels, pipes, and other drainage systems across the study area. It simulates the rainfall-runoff process by considering the existing and proposed LIDs. The surface runoff was simulated using dynamic wave routing and Manning’s equation [66]. Precipitation data, SCS CN values for different land uses, and hydromorphic characteristics of sub-catchments are the primary inputs to the SWMM model. The catchment was delineated using a 0.5 m resolution DEM into 79 sub-catchments with 120 lots. Figure 5 shows the sub-catchments and conduit map of the study area. Different sub-catchment level parameters, including sub-catchment area, slope, CN, depression storage depth for impervious and pervious surfaces, Manning’s n values for impervious and pervious surfaces, percent zero (percentage of impervious area that has no depression storage), and internal routing variables were considered to calibrate the SWMM model (Table 1).
The SWMM model was calibrated and validated using four major storm events and flow data obtained from the outfall detention pond of Springbrook Creek. After validation, the model was used to simulate runoff from 50 and 100 year storms under historical and downscaled future storm events. It was run with and without LIDs while considering the conventional storm system as a baseline to quantify the percent reduction of total and peak flows when LIDs are considered. This allows quantifying the effectiveness of the existing and proposed LIDs to minimize flood risks.

2.2.2. Sensitivity Analysis

SWMM model outputs can be sensitive to several input data and parameters, making sensitivity analysis an important step in the model development [69]. In this study, hydrological and catchment-related parameters, namely Manning’s n for impervious surface, impervious percentage with no depression, curve number, and width, were considered for the sensitivity analysis (Table 2). The slope was not considered for the sensitivity analysis because of the negligible slope of the study area. Manual sensitivity analysis by changing each parameter independently by 5%, 10%, and 15% from the base values is used to assess the simulated runoff volume and peak flow changes.

2.2.3. Downscaling of Precipitation

Downscaled precipitation from climate models is required for the SWMM model to simulate storm runoff in the future. Two climate models, namely MIROC6 and CMCC-ESM2, were selected from the CMIP6 for the future precipitation projections under SSP 585 (highest emission) scenario. The two models were selected because of their ability to reproduce the mean climate and variability at different time scales in the study area [69]. The projected precipitations were downscaled using statistical relationships with observed precipitation at the selected weather station in the watershed. In general, many statistical techniques, including the Quantile-Quantile Mapping (QM) and Delta Change (DC) methods, are commonly used to bias correct and downscale the precipitation [70]. The DC method was used in this study to downscale the precipitation projections because of its simplicity and its reasonable accuracy. It uses a transfer function that depends on the means of the observed and projected precipitation to correct the bias as shown below [71]:
P SD Delta =   P GCMSSP × P ¯ Obs P ¯ GCMhist .
where P SD Delta is the bias-corrected precipitation, P GCMSSP is the raw GCM precipitation, P ¯ Obs and P ¯ GCMhist are the means of the observed and GCM precipitations, respectively. The precipitation data from 1994 to 2014, which was obtained from the 03u meteorological station in the King County database, was used for the bias correction. The performance of the downscaling was evaluated using the Nash-Sutcliffe efficiency (NSE) and degree of agreement (R) shown below.
NSE = 1 i = 1 n O i   S i 2 i = 1 n O i O ¯ 2
where, Oi represents the observed precipitation and O ¯ is the mean of the observed precipitation, S is the simulated precipitation, and N is the number of observations. The range of NSE lies between 1.0 to −∞, with a value of 1 indicating perfect agreement between observed and modeled values. Similarly, the degree of agreement, R, ranges from 0 to 1, with a value of 1 indicating a perfect agreement. For the IDF curves and stormwater analysis, precipitation data at sub-daily (or sub-hourly) are generally required. The 15-min precipitation data obtained from the City of Renton was used as the base data to develop the historical IDF curves. For the future (2020–2050), the downscaled daily precipitation projection was transferred to 15 min precipitation using the SCS Type IA distribution.

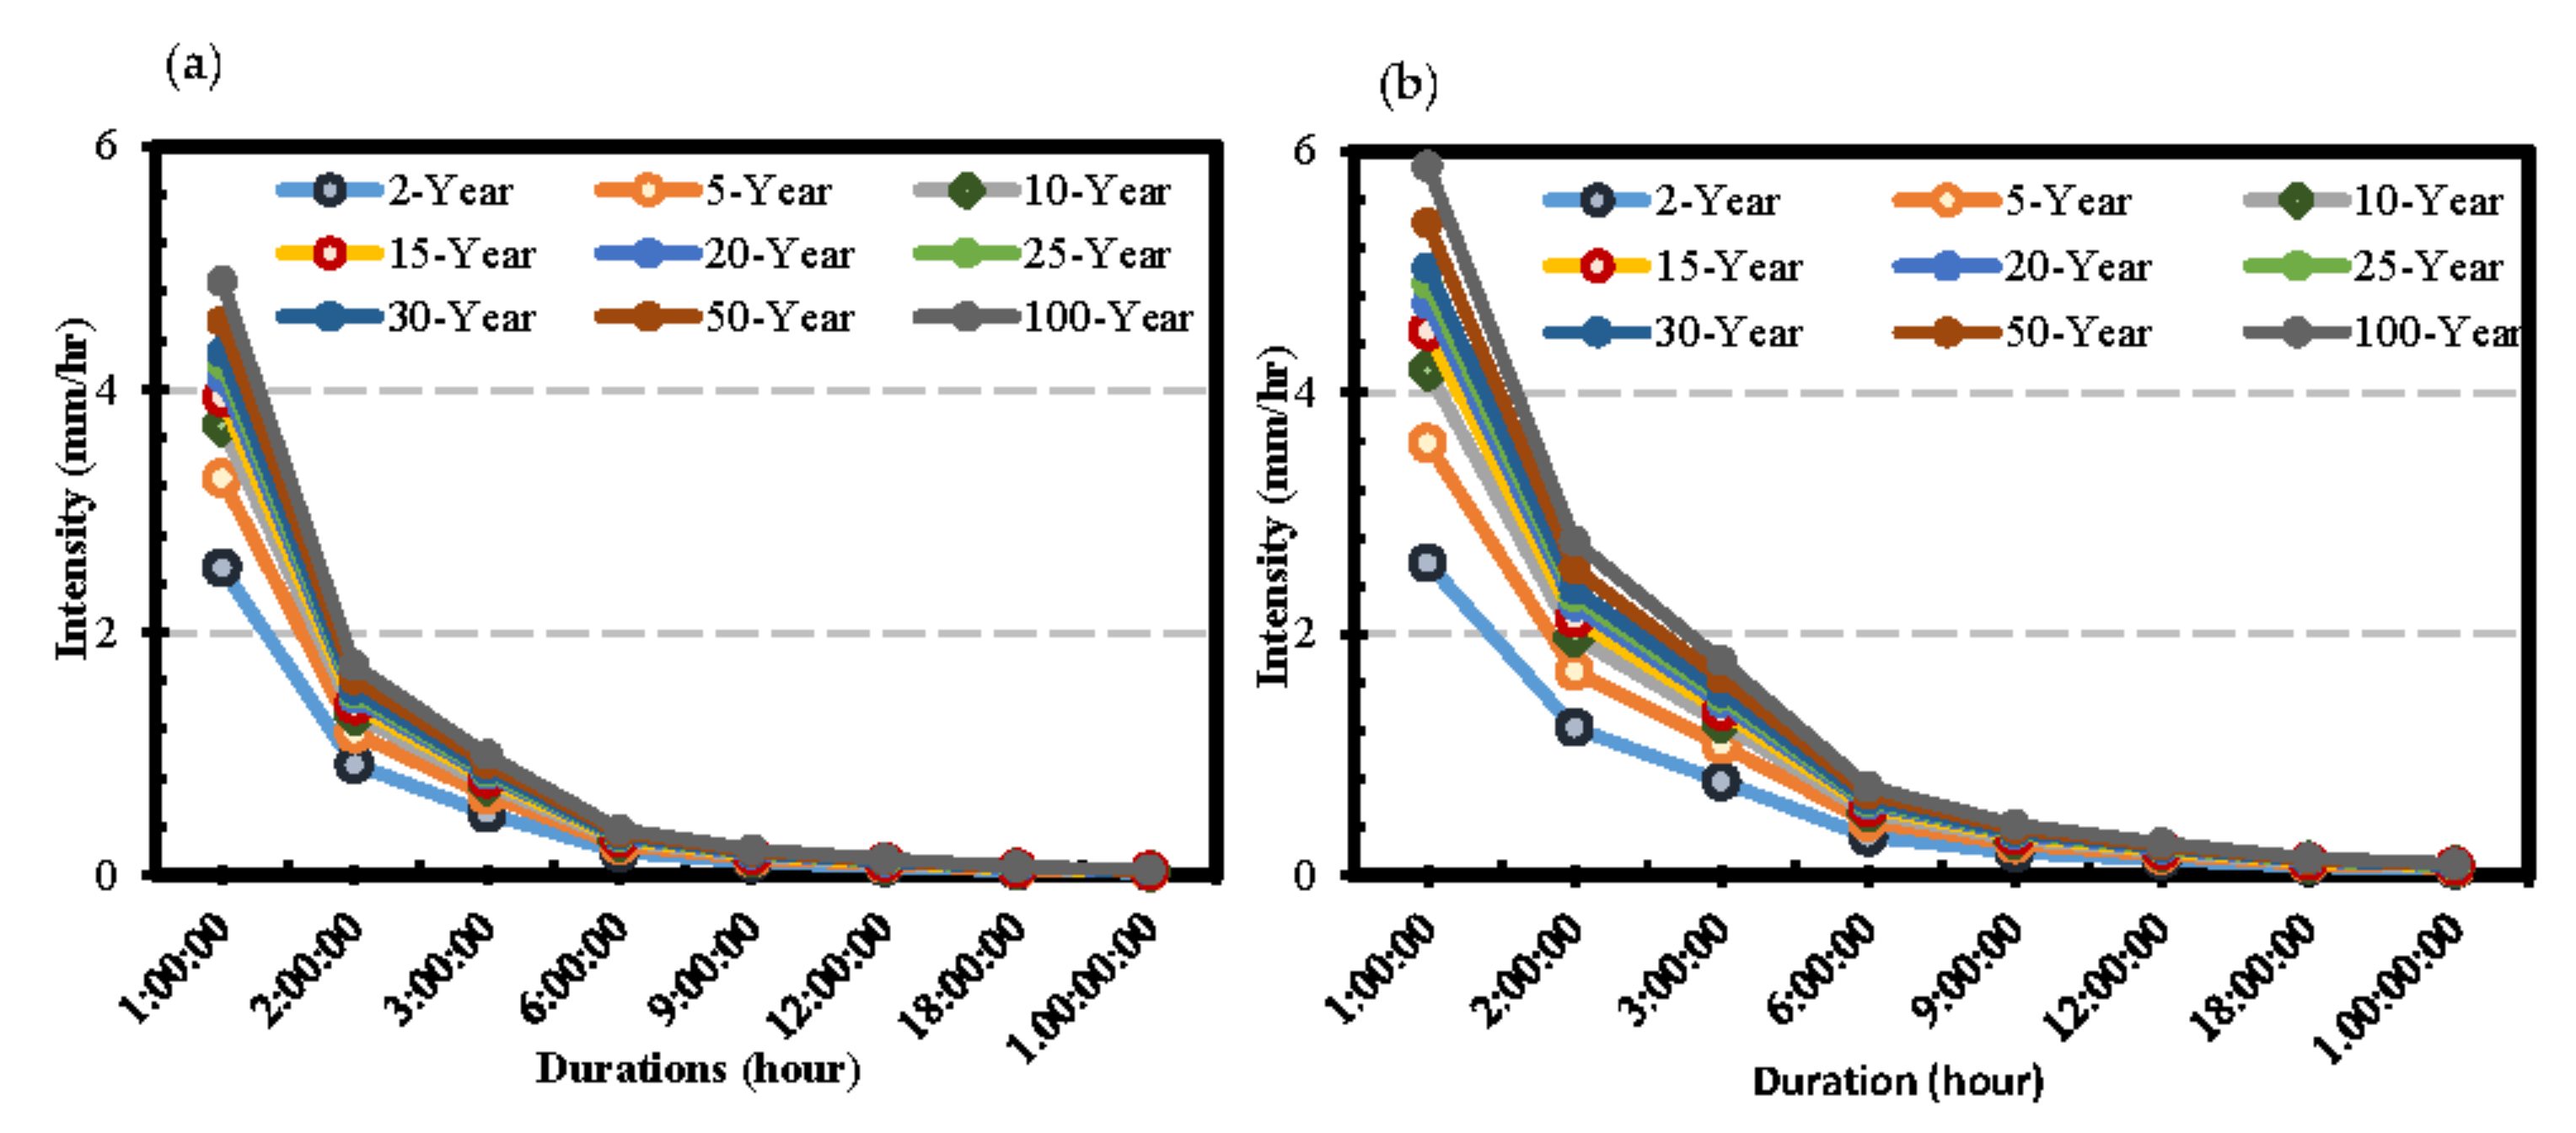
2.2.4. Development of Precipitation IDF Curves

Design storms obtained from the IDF curves are required to design the conventional and LID stormwater management system. This study developed the IDF curves for both historical and future periods using the California empirical method [71]. Precipitation data measured at 15 min intervals from 1995 to 2019 was used to develop the historical IDF curves. The daily precipitation projection from 2020 to 2050 under the SSP 585 emission scenario was downscaled using DC statistical method and then disaggregated to 15 min precipitation data using the SCS Type IA distribution. The disaggregated data were then used to develop the IDF curves for the future period.

2.2.5. LID Scenarios

The existing stormwater system in the study area includes mainly a network of underground pipes, catch basins, curbs, and gutter that collect runoff throughout the watershed and direct it to a detention wetland for retention and natural treatment. After incorporating the existing drainage system in the SWMM model, different LID scenarios, comprised of a single type of LID or combination of different types of LIDs, were considered to investigate their comparative benefits to reduce the runoff across the watershed. The scenarios were formulated on two groups of flood regions based on primary land covers and runoff coefficients of the sub-catchments. Group 1 covers 34 sub-catchments containing a total of 27 commercial developments, while Group 2 covers 45 sub-catchments with a total of 56 private properties
In order to optimize the LID implementation strategy, two scenarios were simulated using the SWMM. The first scenario incorporated the conventional stormwater system without LIDs while the second scenario considered the existing LID practices as shown in Figure 6. This analysis helps us evaluate the efficacy of the existing LIDs to control the flooding event against the conventional stormwater system in the study area. Furthermore, the performance of individual LIDs was evaluated to quantify their effectiveness in reducing the total and peak flow during flooding events. Based on their performance, five types of LIDs, namely, the infiltration trench (IT), rain barrel (RB), rain garden (RG), bioretention (BR), and permeable pavement (PP) were selected. Comparison among individual LIDs helps in establishing the scenarios where the maximum number of LIDs can be implemented at each applicable adoption level. While many scenarios could be developed and considered for a complete analysis of various LIDs, in this study we have selected six plausible scenarios that are summarized in Table 3. The SWMM model was run separately for each scenario and compared the associated results with the results from the baseline run that considers only the existing stormwater system.
The number of LIDs associated with a given house depends on the type of the LIDs. Zero to four rain barrels per house are used. For raingardens, bioretention, or permeable pavement, zero to one unit per house is used. The numbers of the different LID types in each sub-catchment are entered into the SWMM input file by multiplying the numbers with the number of houses in the sub-catchment.
The Infiltration trenches parameters are optimized according to the sub catchment properties, with the area of each unit per sub catchment ranging from 3 m2 to 80 m2 (or 20% to 50% of the impervious area) [72]. The Infiltration trenches can take 50% of the front yard (the driveway) of private properties. For the raingarden, the width is considered between 0.5 m–1 m and take 50% of impervious runoff (driveway) and 25% of the roof. The other 25% of runoff from the roof will be routed to rain barrel. The runoff is calculated based on the houses in each sub catchment and the runoff capacity, and then routed through impervious surfaces. The depth of the raingarden is considered to be between 8 cm to 12 cm based on the topography of the surface [73]. Another factor that may influences the size of the raingarden is soil conditions. A poorly drained soil will require raingarden with a larger surface area and shallow depth, while a well-drained soil will require a raingarden with small surface area but deeper depth [73]. For bioretention, the design suggested for the parking lots is to have at least 15–20 cm deep and implemented in areas with underlying clay or sandy soil [74].
Due to the moderately fine content of the topsoil, the soil in our study area is considered to be moisture sensitive. During wet season (typically between October and May), the increase in soil moisture can cause significant reduction in the infiltration capabilities. In addition, once the soil is wet, the time required to dry it will be long and significantly affect the functioning of the infiltration system. Hence, the bio-retention may need underdrain at the bottom to allow for more infiltration.
The surface of private paths (garage) and parking lots are considered to be permeable, porous concrete and porous asphalt, respectfully. The porous asphalt is typically ranged from 7 to 18 cm depending on vehicle types and runoff volume [75].

3. Results and Discussions

3.1. Rainfall-Runoff Modeling

Comparison of the observed and downscaled daily precipitation for the MIROC6 and CMCC-ESM2 GCMs are shown in Figure 7a,b, respectively. Results shows that the downscaled precipitation match the observed daily precipitation reasonably well. Overall, the MIROC6 model performed better (R2 = 0.82 and NSE = 0.81) than the CMCC-ESM2 model (R2 = 0.69 and NSE = 0.64). Based on this performance the MIROC6 model predictions under SSP 585 scenario were used to evaluate the LIDs performance under the future design storms.
Figure 8 shows the historical and future IDF curves for the study area. The precipitation intensities are expected to increase in the future for almost all durations and return periods. For example, the historical 100 year precipitation intensity event will be a 25 year event in the future under the SSP585 climate change scenario. On average, the observed 100 year precipitation intensity will increase by 2.5% to 30% by the mid-century, with the increase in short-duration precipitation being more prominent. The stormwater system is highly vulnerable to short-duration extreme precipitation, indicating that climate change will significantly impact the stormwater systems in the future.

3.2. Sensitivity Analysis

The SWMM sensitivity analysis results are presented in Table 4. The 5% to 15% increase in the sub-catchment’s width, CN, percent Zero impervious (impervious area with no depression storage), and Manning’s n value for impervious surfaces results in the peak flow reduction of 10.75% to 22.44%, 17.29% to 24.74%; 13.89% to 22.44%, and 15.25% to 23.51%, respectively. This indicates the model is equally sensitive to the four parameters we have considered.

3.3. Calibration and Validation of SWMM

Four storm events were used to calibrate and validate the model. Figure 8 illustrates the observed and simulated flow rate for the four precipitation events. Overall, the model captures the hydrographs reasonably well, particularly the rising and recession of the hydrograph. The peak flows are slightly underestimated for the calibration period, whereas they are overestimated for the validation period (Figure 9). The model underestimates the low flows in the validation period, but these low flows are not important in terms of stormwater system design [72]. The NSE values for the calibration storms are 0.81 and 0.79, while R2 values are 0.83 and 0.81 (Table 5). The NSE values for validation storms are 0.80 and 0.84, and R2 values are 0.82 and 0.87. Overall, the results indicate that the SWMM model reasonably reproduces the flow hydrograph for the historical period with the existing stormwater system, land use, and hydromorphic conditions of the watershed. The calibrated SWMM model is then used to simulate storm runoff for different past and future storm events and LID scenarios.

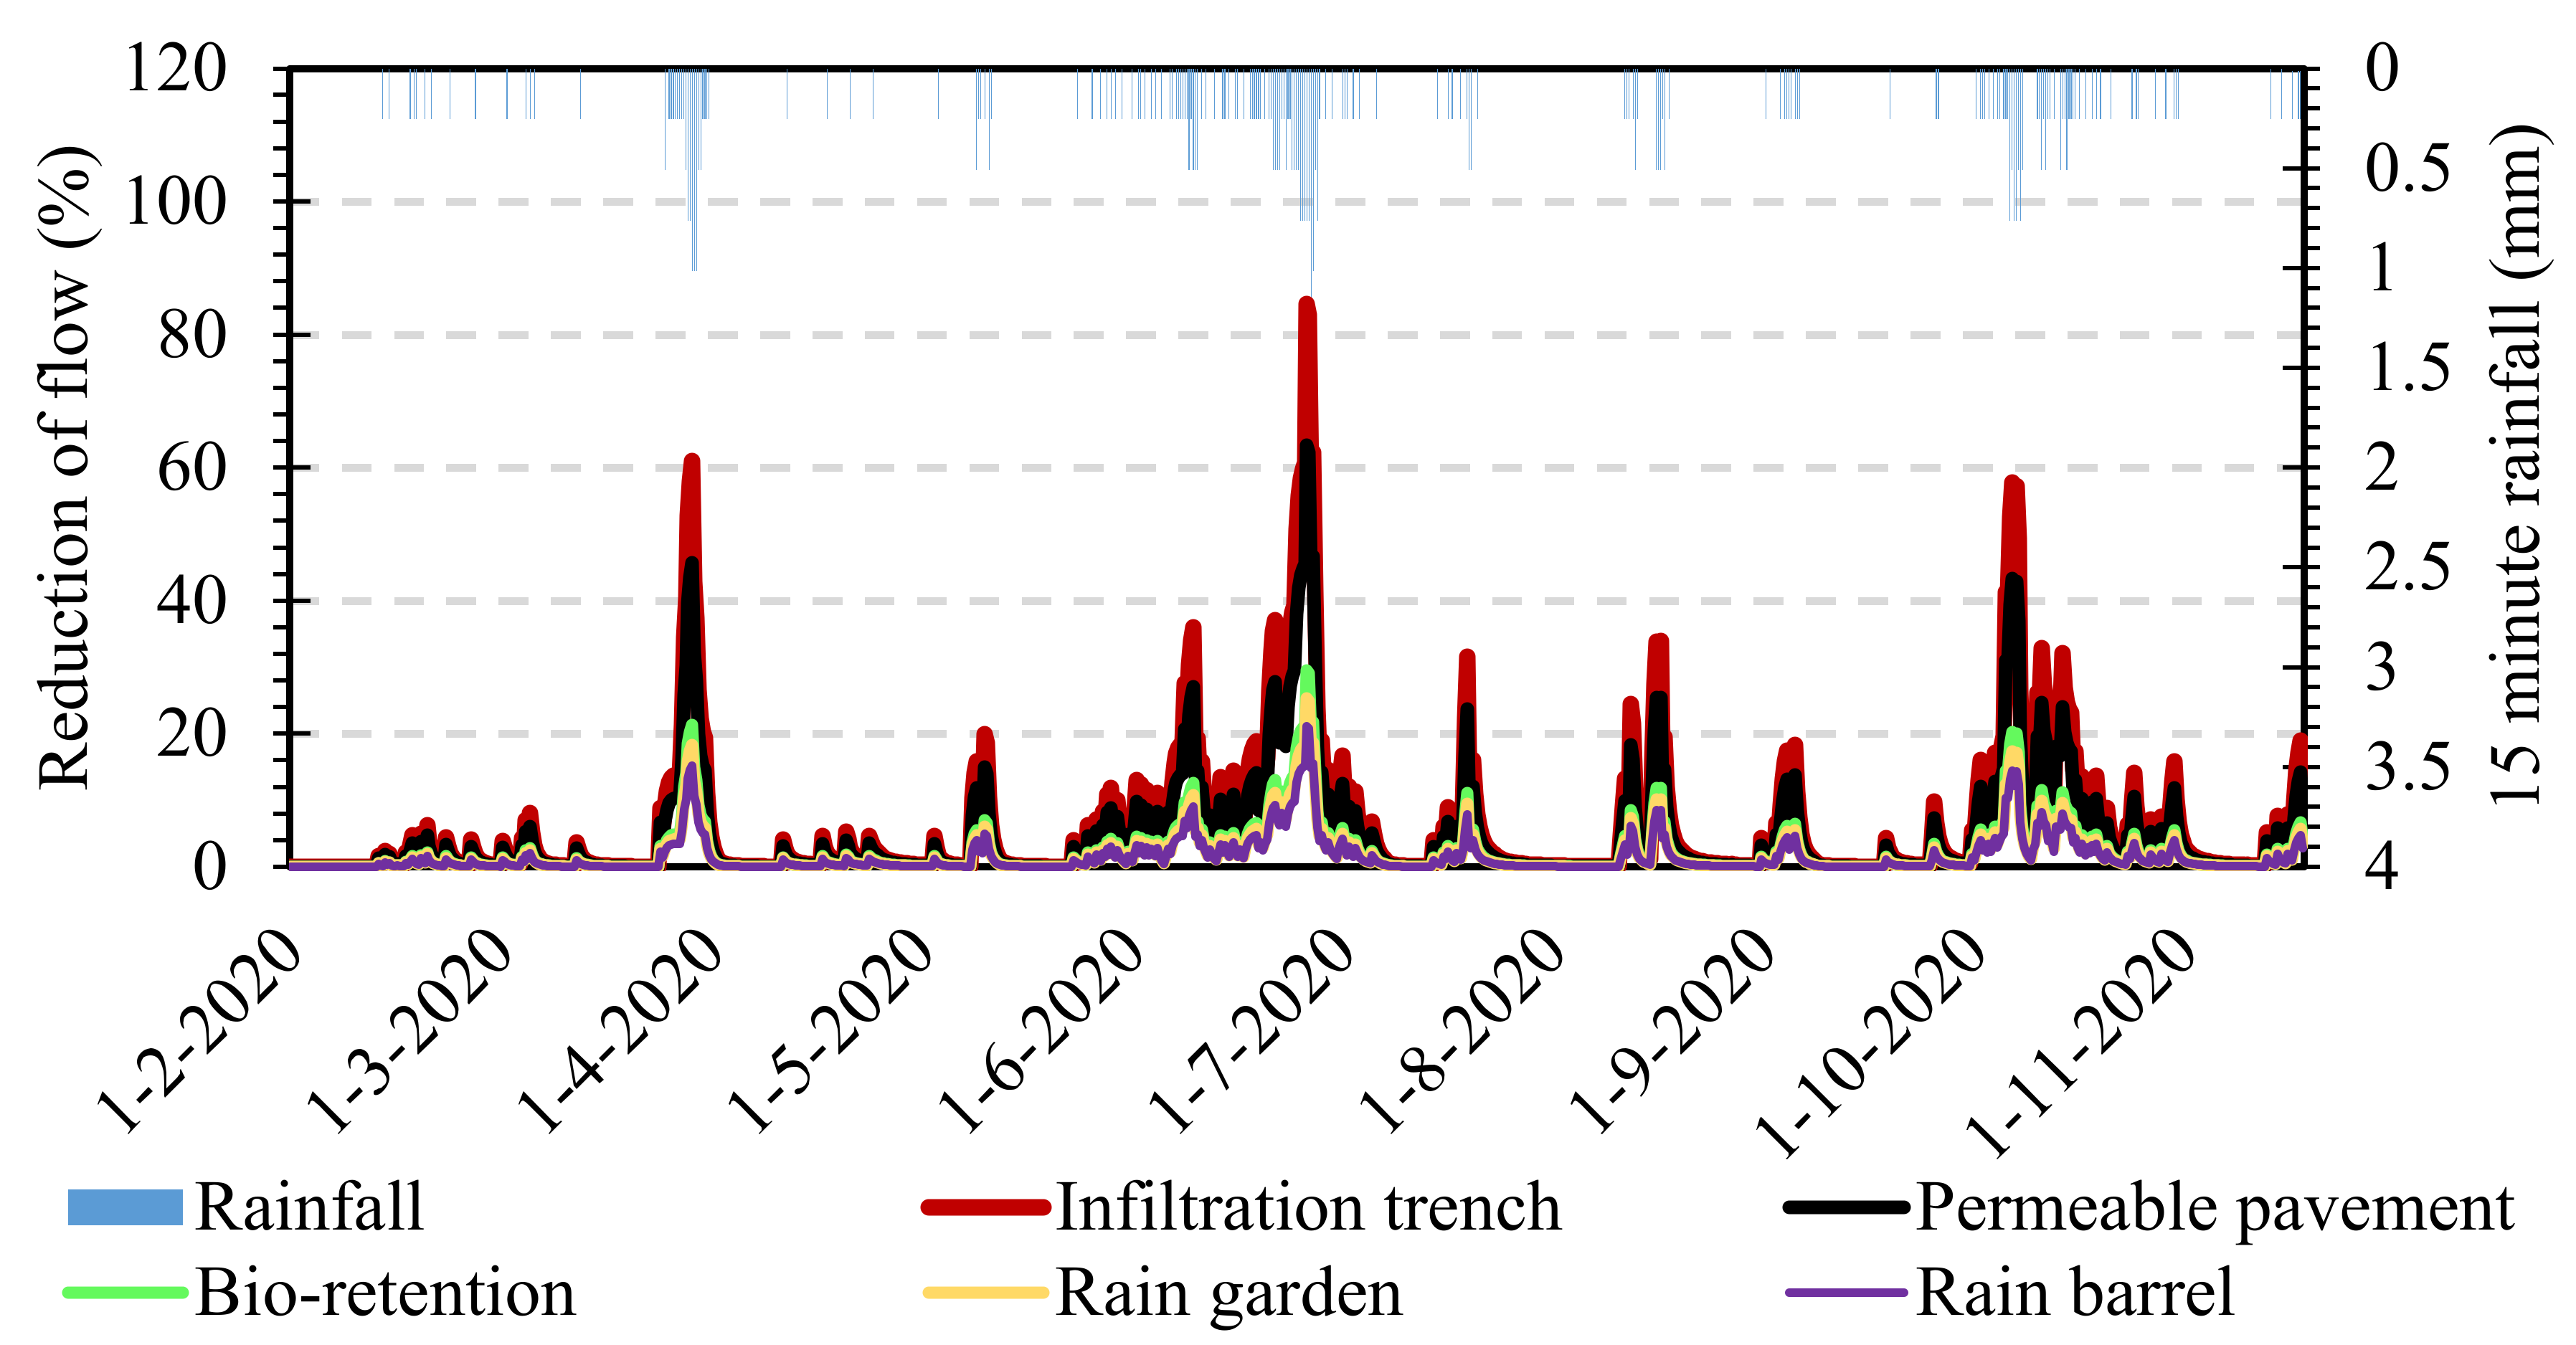
3.4. Effects of Existing LIDs on Runoff

The effectiveness of the existing LIDs to reduce flow rate at the drainage outlet was assessed by turning on and off the specific LIDs (i.e., infiltration trench (IT), permeable pavement (PP), bio-retention (BR), rain garden (RG), and rain barrel (RB)). Figure 10 shows the flow rate at the outlet with and without considering the existing LIDs in addition to the conventional stormwater system. The result shows that the existing LIDs play an important role in reducing runoff from the drainage area. Additionally, the effectiveness of the individual LIDs are assessed by replacing all the existing LIDs with a specific LID. Figure 11 shows the percentage reduction of flow rate when a single type of LID replaced all the existing LIDs in the stormwater system. As expected, the flow reduction varies depending on the types of LIDs.
The maximum flow rate reduction achieved compared to the baseline scenario with IT, PP, RG, BR, and RB were 84%, 63%, 36%, 33%, 29%, and 21%, respectively.
The baseline scenario considers the existing stormwater system, which include both the conventional stormwater and LIDs. The results indicated that infiltration facilities namely IT and PP have greater potential to reduce the surface runoff and peak flow than the storage facilities. The outcomes of single type LIDs in reducing surface runoff were consistent with the studies conducted by Xie et al. [76] and Bai et al. [77].

3.5. Effects of Proposed LIDs on Runoff

In addition to the existing stormwater system, we considered additional LIDs to further reduce the runoff. Six LID scenarios, based on the types of property and runoff coefficients of the sub-catchments, were considered to find the optimal combination of LIDs in the study area. Figure 12 shows the percent reduction in total flow by the different LID scenarios for 50 and 100 year storms events in the past and future periods. All the scenarios reduced the flood risk but with different magnitudes.
The average reduction of total flow for the historical (HIST 50 and 100) and future (CC 50 and 100) storm events are 29.8%, 34.3%, 52.5%, 62.0% 15.8% and 65% for LID scenarios S1, S2, S3, S4, S5 and S6, respectively.
The combination of RB+ BR+ IT (S6) offered maximum reduction in total flow (80% for 50 year and 70% for 100 year event), while IT + BR (S2) provides only 45% and 34% flow reduction for 50 and 100 year historical events, respectively. When single type of LIDs is considered, PP only (S3) reduces the flow by 65% and 57% for 50 and 100 year historical events, respectively. In contrast, BR only (S5) has the least effectiveness in reducing the total flow.
The different LID scenarios considered also performed well in minimizing the peak flows, but at lower percentage compared to the reduction in the total flow (Figure 13). The comparison results among the six scenarios are similar to that of the total flow. For example, the RB+ BR+ IT (S6) provides maximum reduction in peak flows for all conditions (50 and 100 year historical and future storm events), whereas the BR only (S5) has lowest reduction in peak flow. On an average the overall reduction of peak flow for the S6 and S2 scenarios are 51.25% and 7%, respectively. For the single type of LIDs, S3 (PP) showed best performance in reducing peak flow (50% and 43% for the 50 year and 100 year historical storm events). For all the scenarios, the percentage reduction of total and peak flows for the future period are lower compared to the historical period. This indicates a better implementation of the LID mixes using a full optimization approach to improve their effectiveness under increased future storm and flood events.
Among the single LIDs, infiltration-based facilities (IT and PP) were better in reducing the surface runoff while the combined LID model S6 (RB+ BR+ IT) and S4 (PP + BR) performed better compared to any other combination under historical and future climate change scenario. Amalgamation of filtration and storage-based LID facilities provide a greater control over the surface runoff and peak flow. Hence, optimal combination of LIDs is necessary for obtaining full benefits from the green infrastructure development for stormwater management. Overall, the appropriate implementation of LIDs can help reducing the likelihood of flooding from increased extreme precipitation, and thus, assist tackling the urban stormwater flooding issues in the future with additional benefit to the region water quality, ecology, and socioeconomic. Therefore, this study will help the water managers and urban developers to better understand the effectiveness of different LIDs in tackling future storm events and flooding problems in the city of Renton and other identical areas.

4. Conclusions

Hydrodynamic modeling was performed for Renton City in WA using the SWMM model to assess the performance of existing and proposed LIDs to reduce total and peak flows associated with 50 and 100 year past and future storm events. After calibrating the SWMM model using event-based simulations, it was used to simulate the runoff from past and future storm events with and without LIDs. We used downscaled daily rainfall projection from CMIP6′s MIROC6 model under the SSP-585 climate change scenario, which is then transferred to hourly precipitation based on the SCS Type 1A distribution to develop the IDF curves for the future period. Overall, the storm intensity and frequency in the city are expected to increase in the future, leading to an upward shift in the future IDF curves compared to the historical curves. The effectiveness of the existing LIDs in the city was evaluated by comparing the SWMM simulation results with and without LIDs. The performance of each LID was evaluated to reduce the past and future flow rates. An additional six different LID scenarios were investigated to identify the best LID mixes for effective management of the stormwater under past and future storm conditions. The main conclusions derived from this study are:
(a)
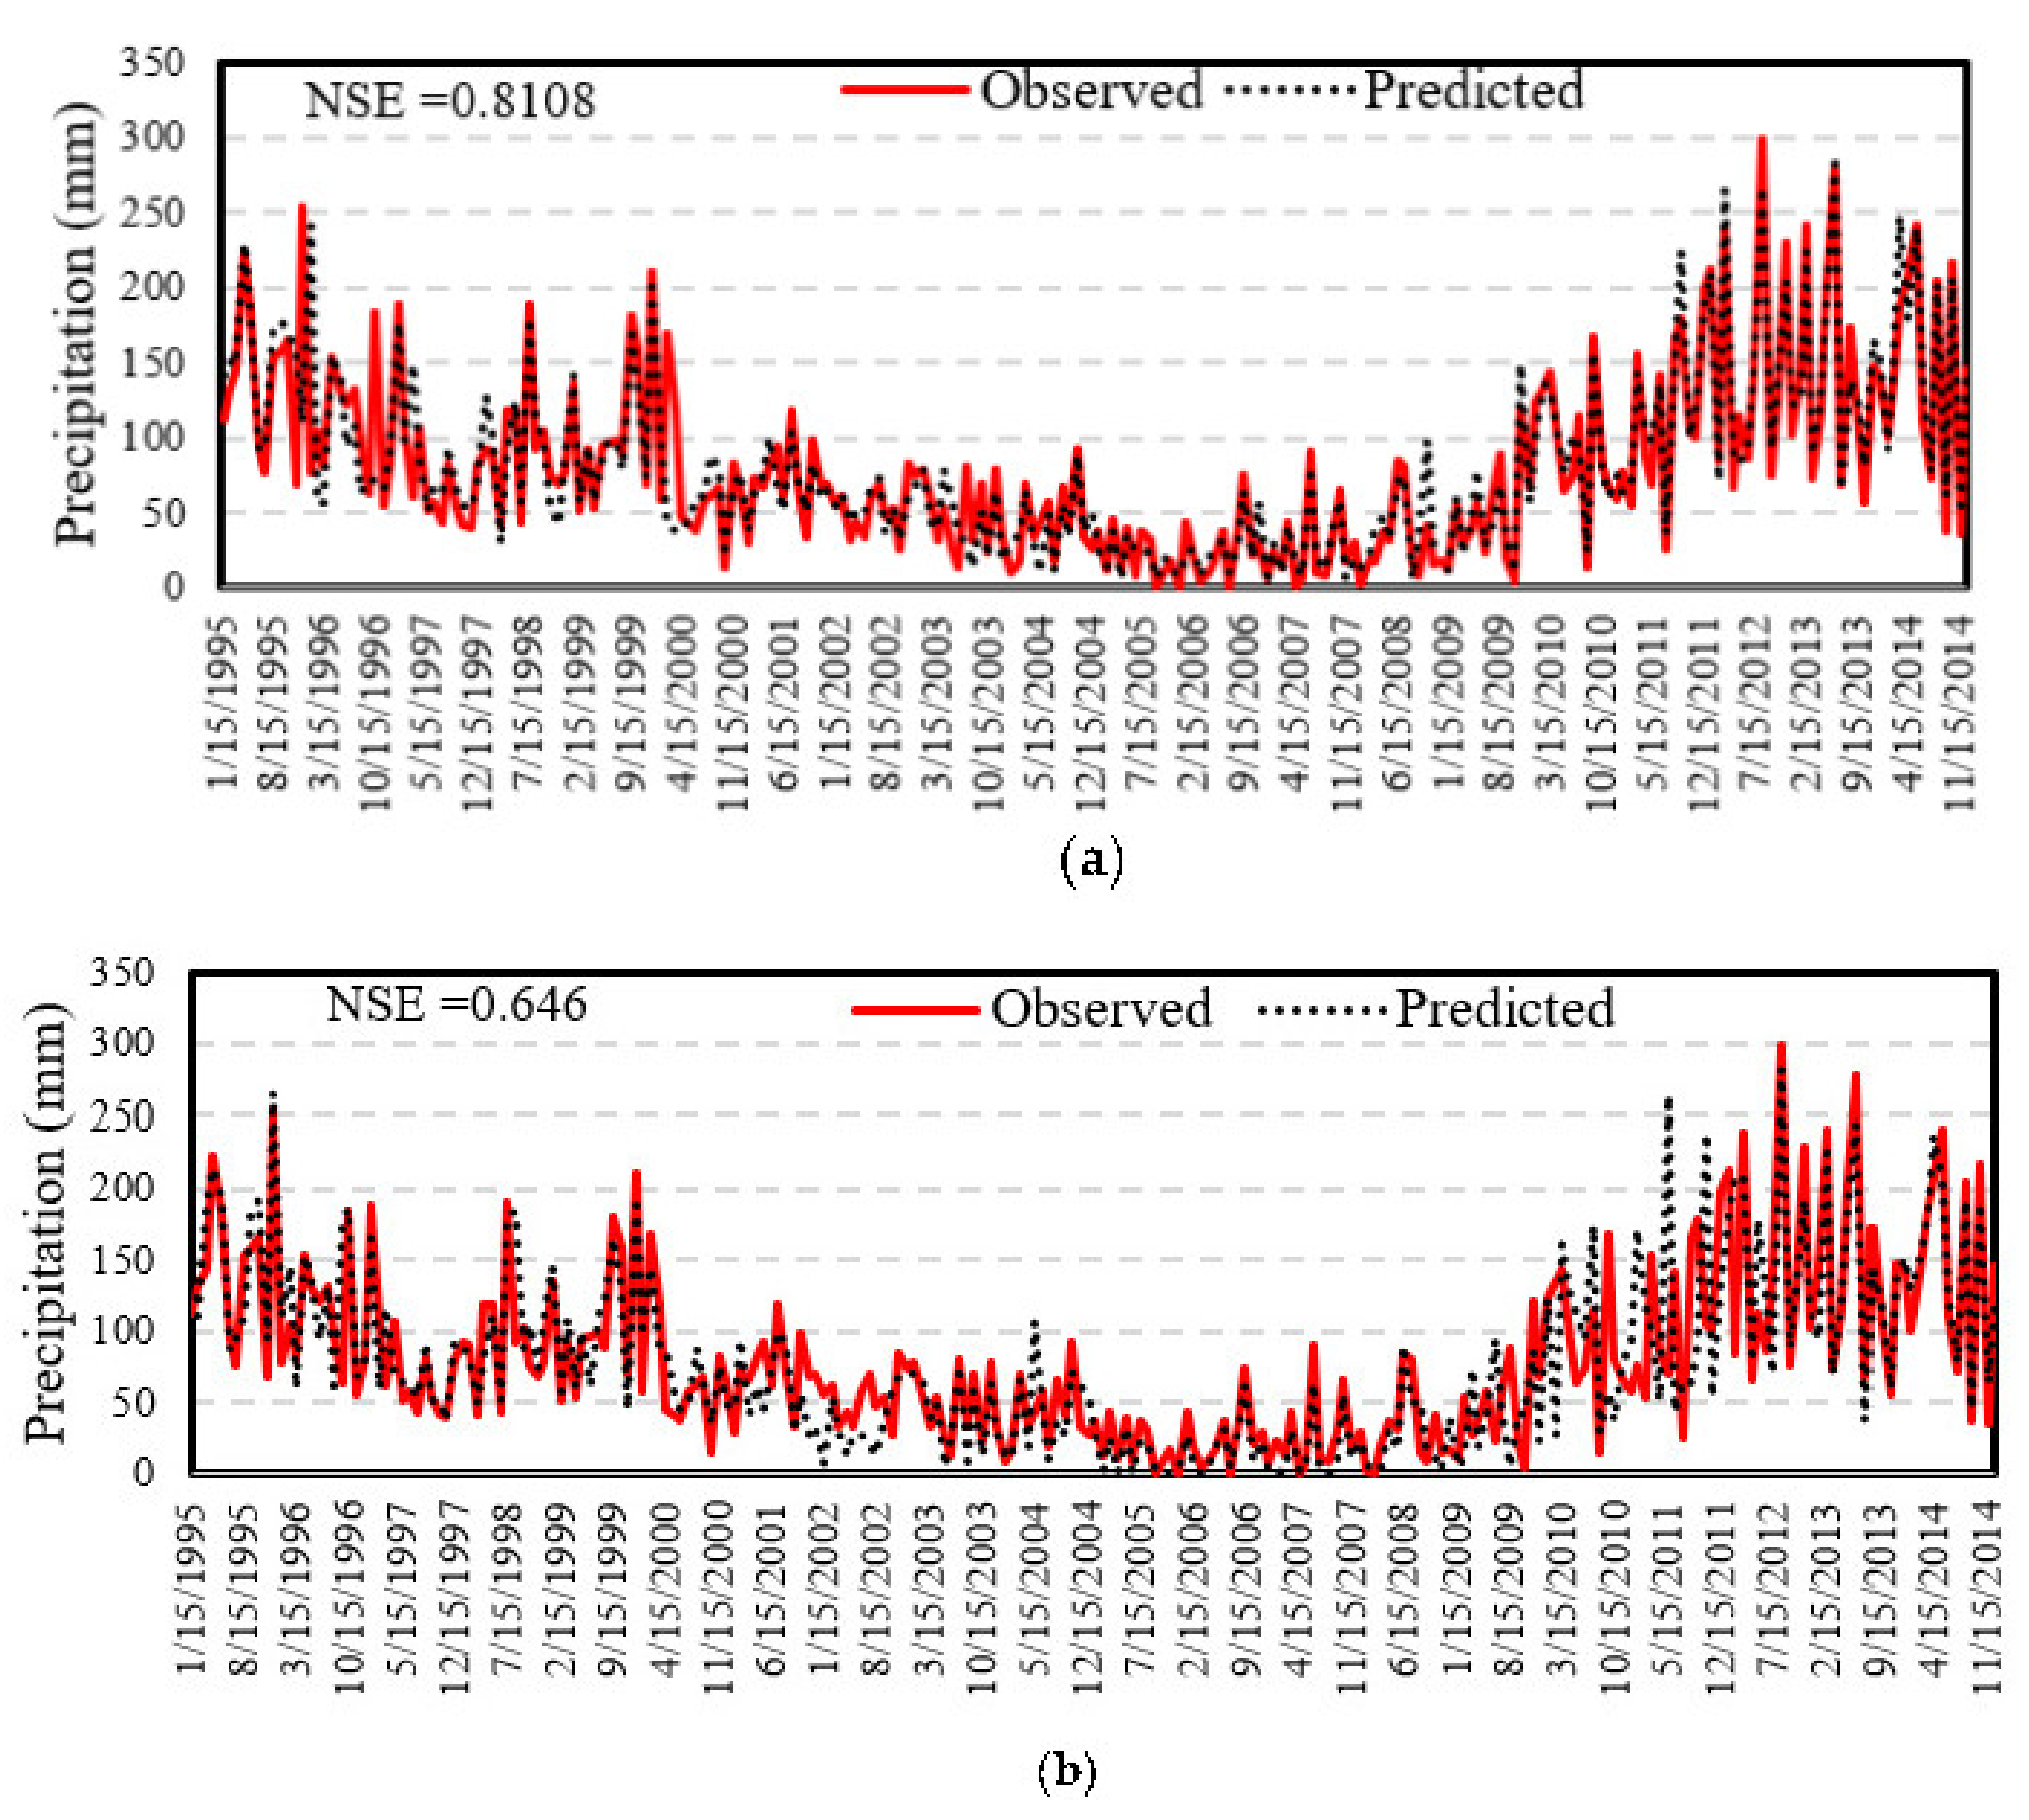
Statistical comparison of observed and downscaled precipitation data derived from the MIROC6 and CMCC-ESM2 confirmed that the MIROC6 is a better climate model to reproduce the observed precipitation in the study area. Precipitation is expected to increase under the highest emission scenario, which further aggravates the problem of stormwater management in the study area. The precipitation intensity for the 100 year return period will increase by 2.5% to 30% in 2020–2050 under the SSP585 compared to the historical observations.
(b)
Sensitivity analysis revealed that the percent imperviousness is the most sensitive parameter in the SWMM hydrological model for the study area. High variations in curve number magnitudes also have a relatively higher impact on the runoff. Percent changes in the width parameter cause an increase in overland flow length and overland flow travel time.
(c)
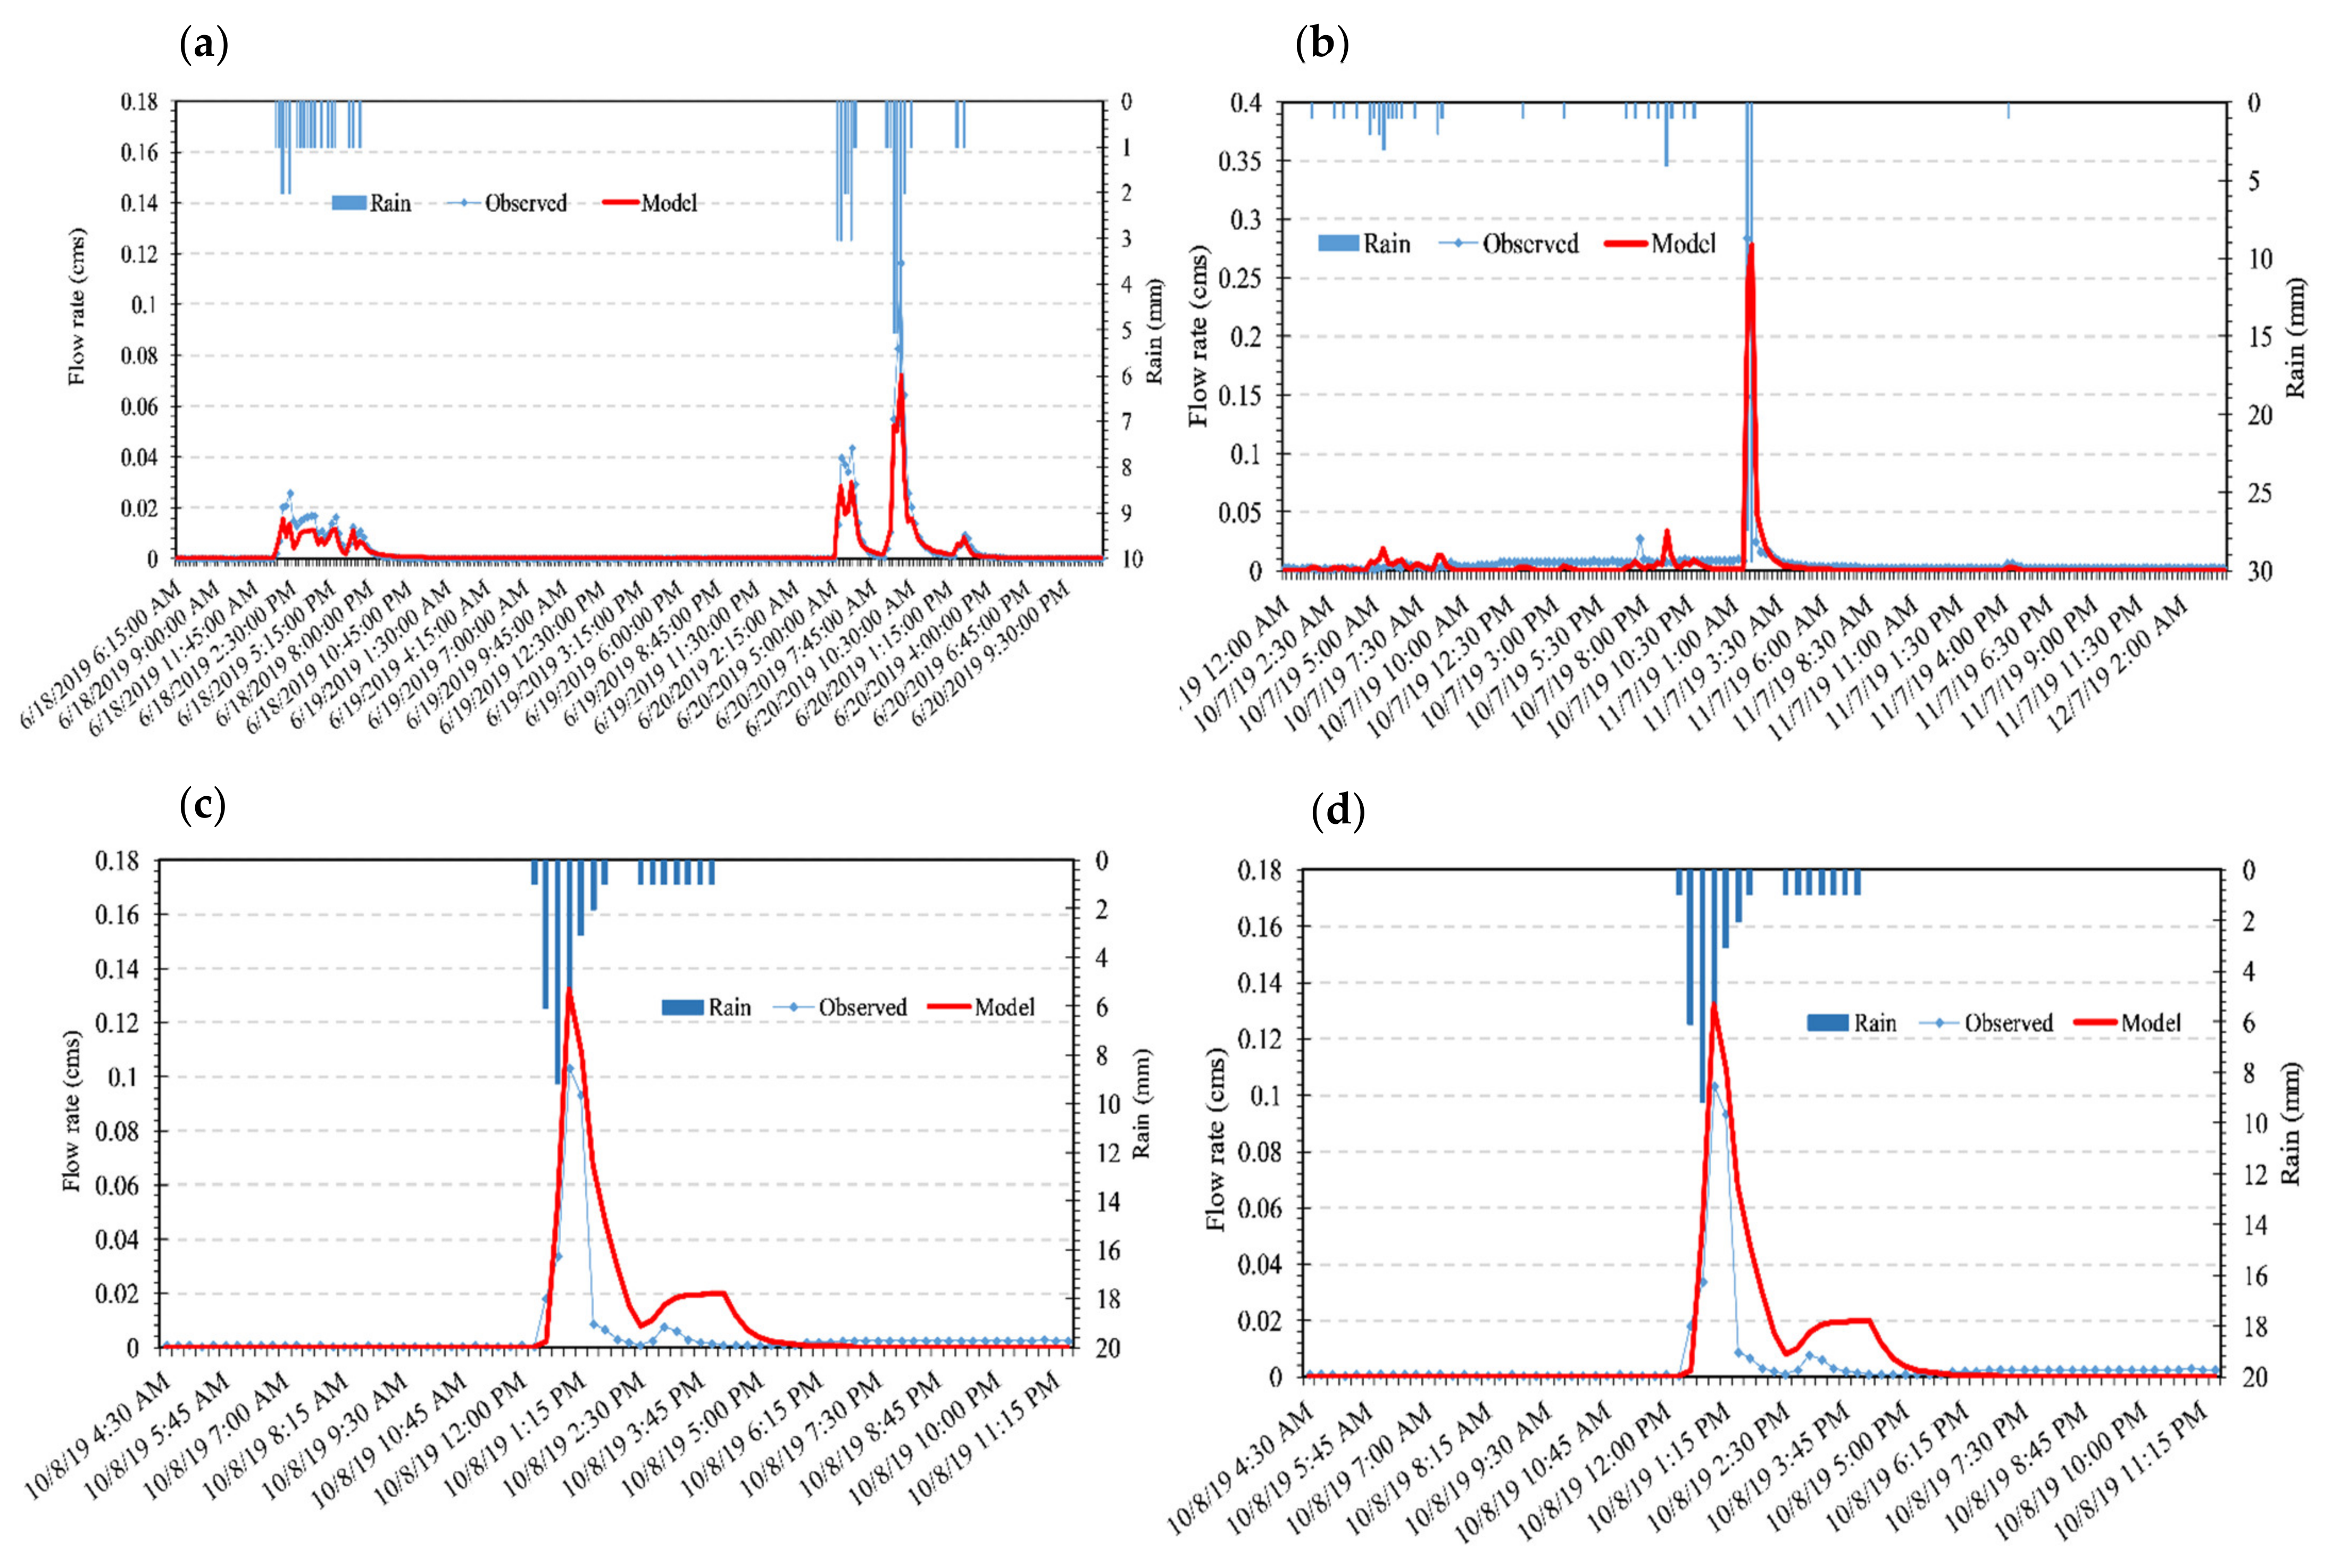
Higher values of NSE (>0.8) and R2 (>0.79) for the calibration and validation periods confirm that the SWMM model captured the rainfall-runoff relationships across the watershed well.
The model has the ability to simulate stormwater and runoff by considering the traditional and LID stormwater system under past and future storm conditions.
(d)
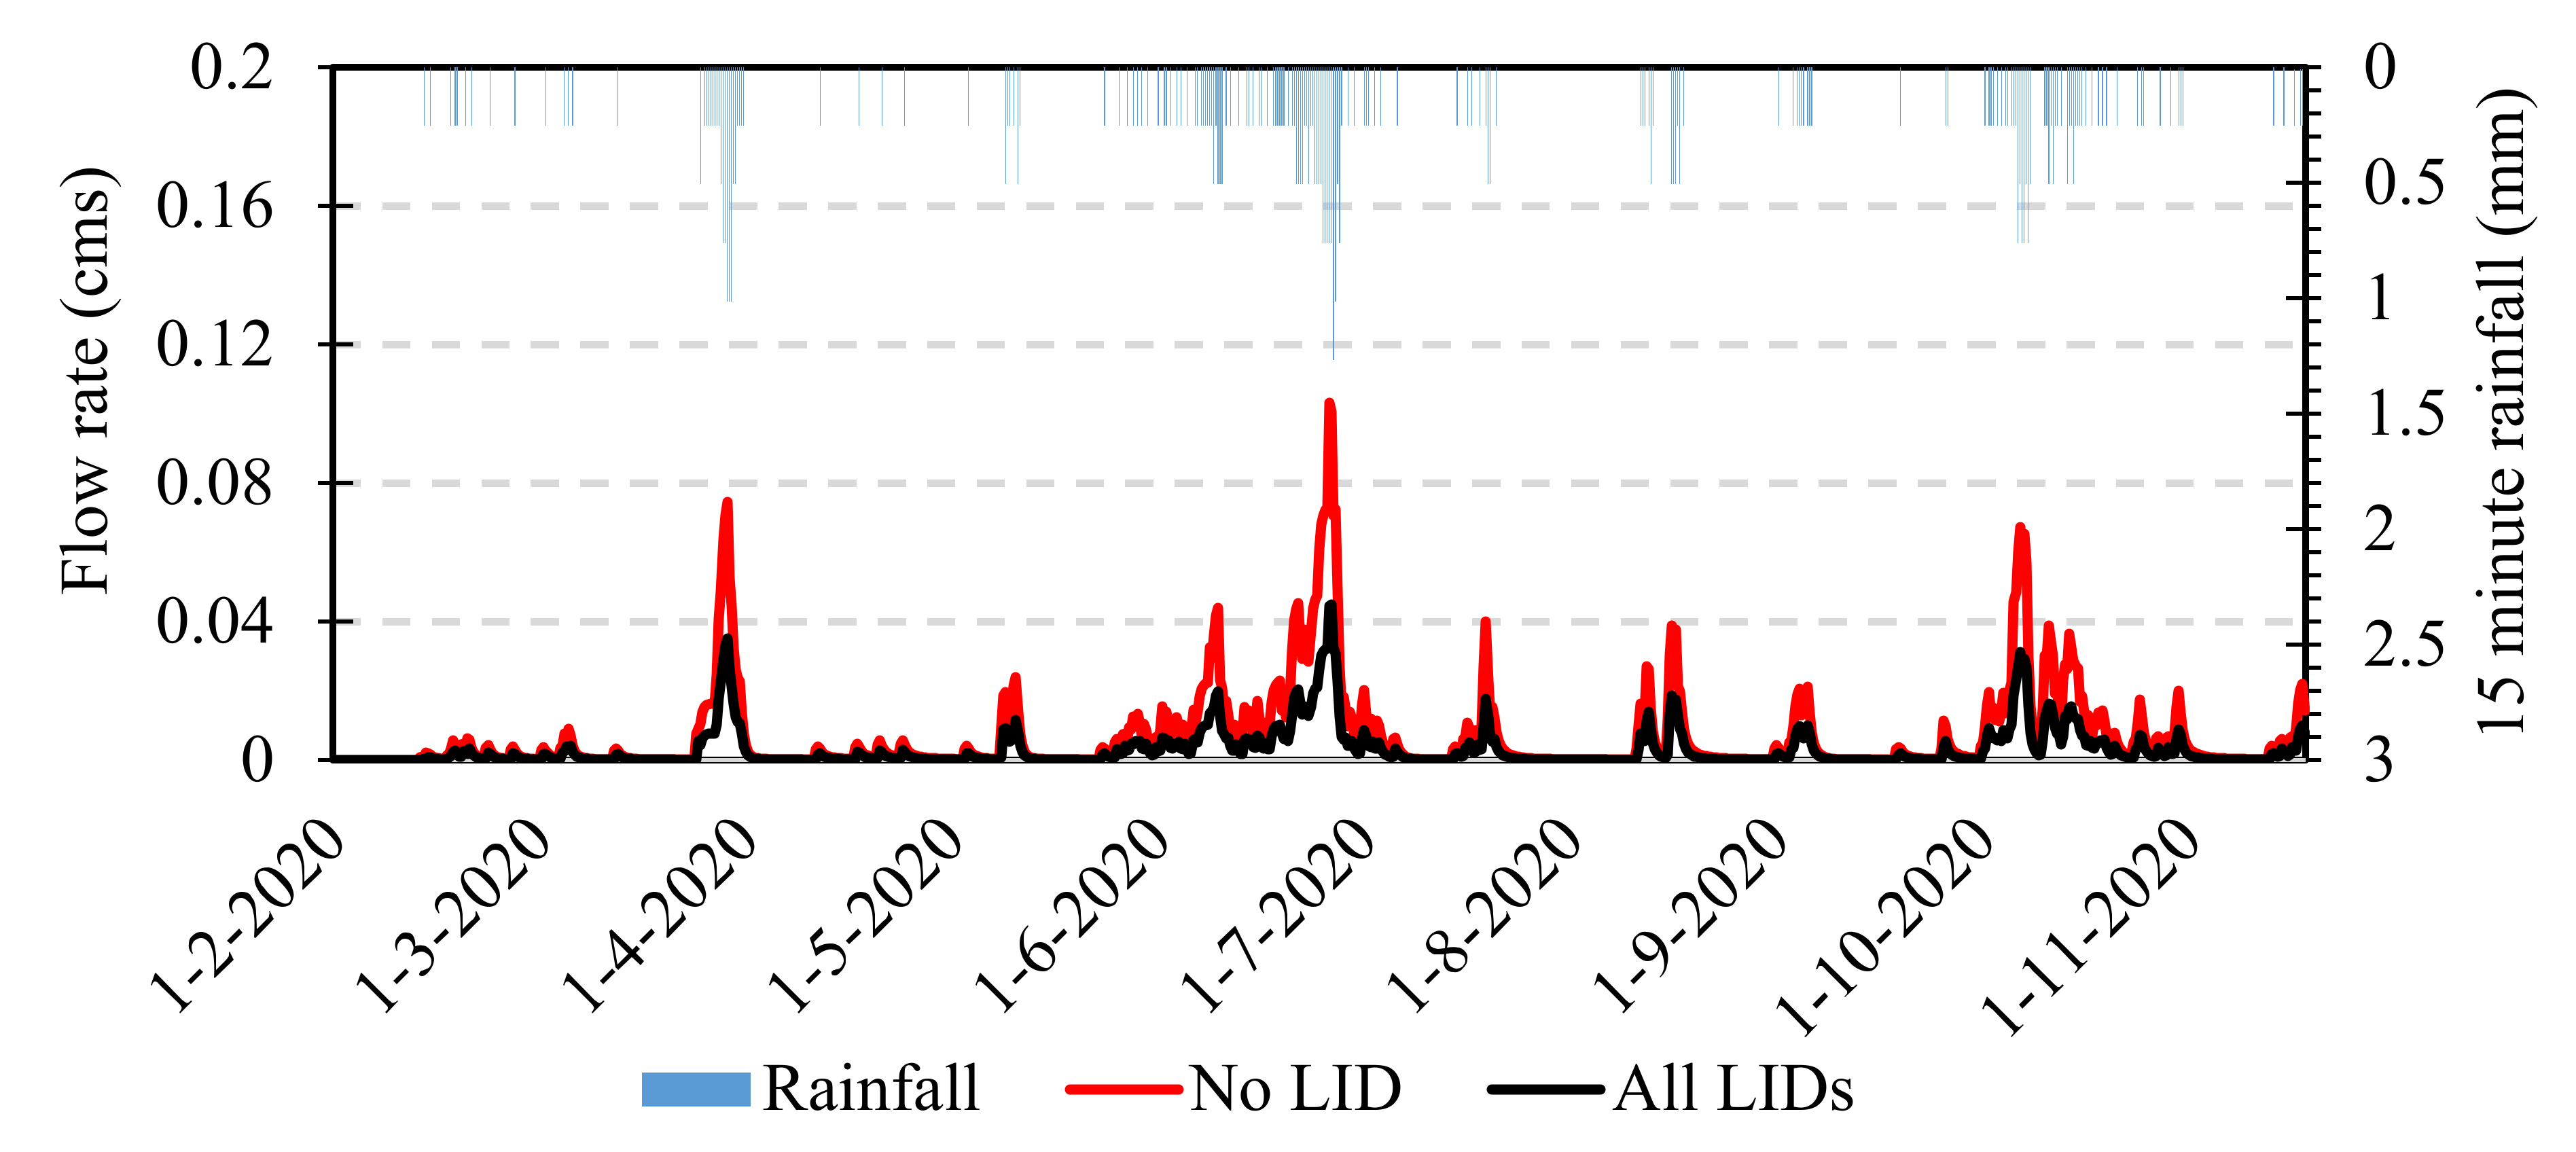
Incorporating LIDs into the traditional stormwater system helps to reduce the stormwater and runoff. Compared to other commonly used LIDs, incorporating the infiltration trench was found to be more efficient in controlling the peak flows, while the rain barrel provided the lowest reduction in peak flows.
(e)
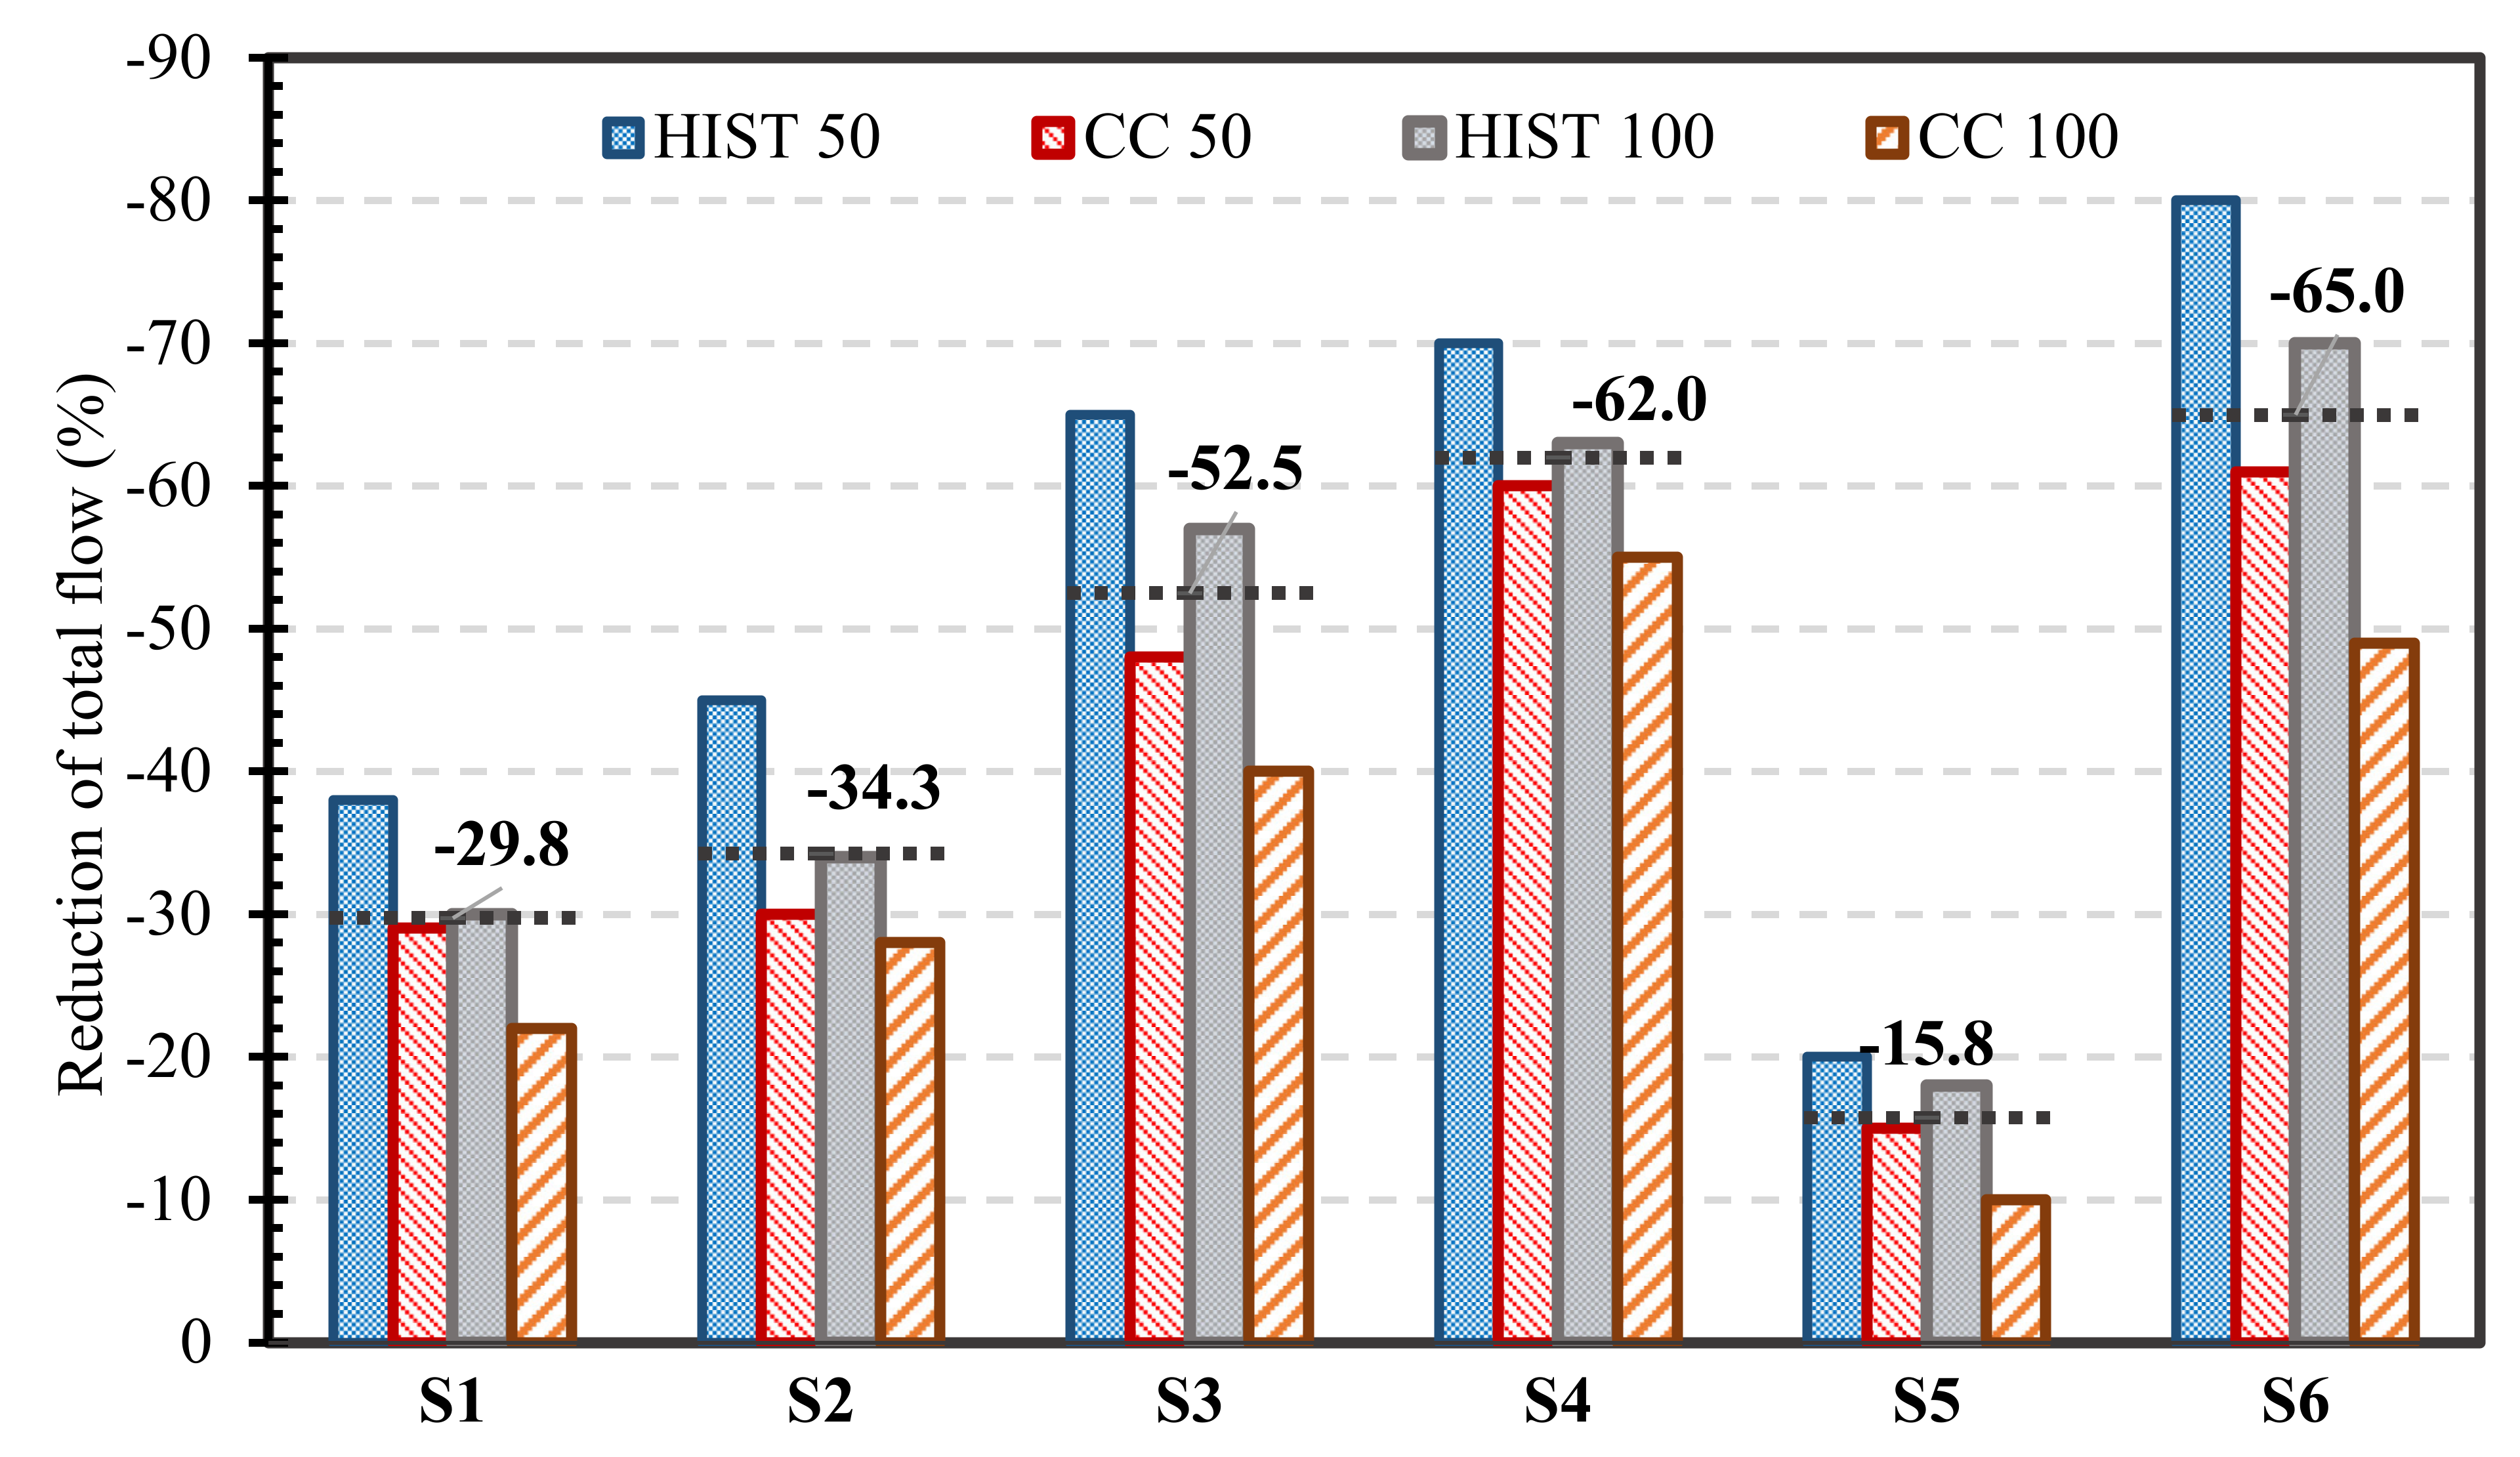
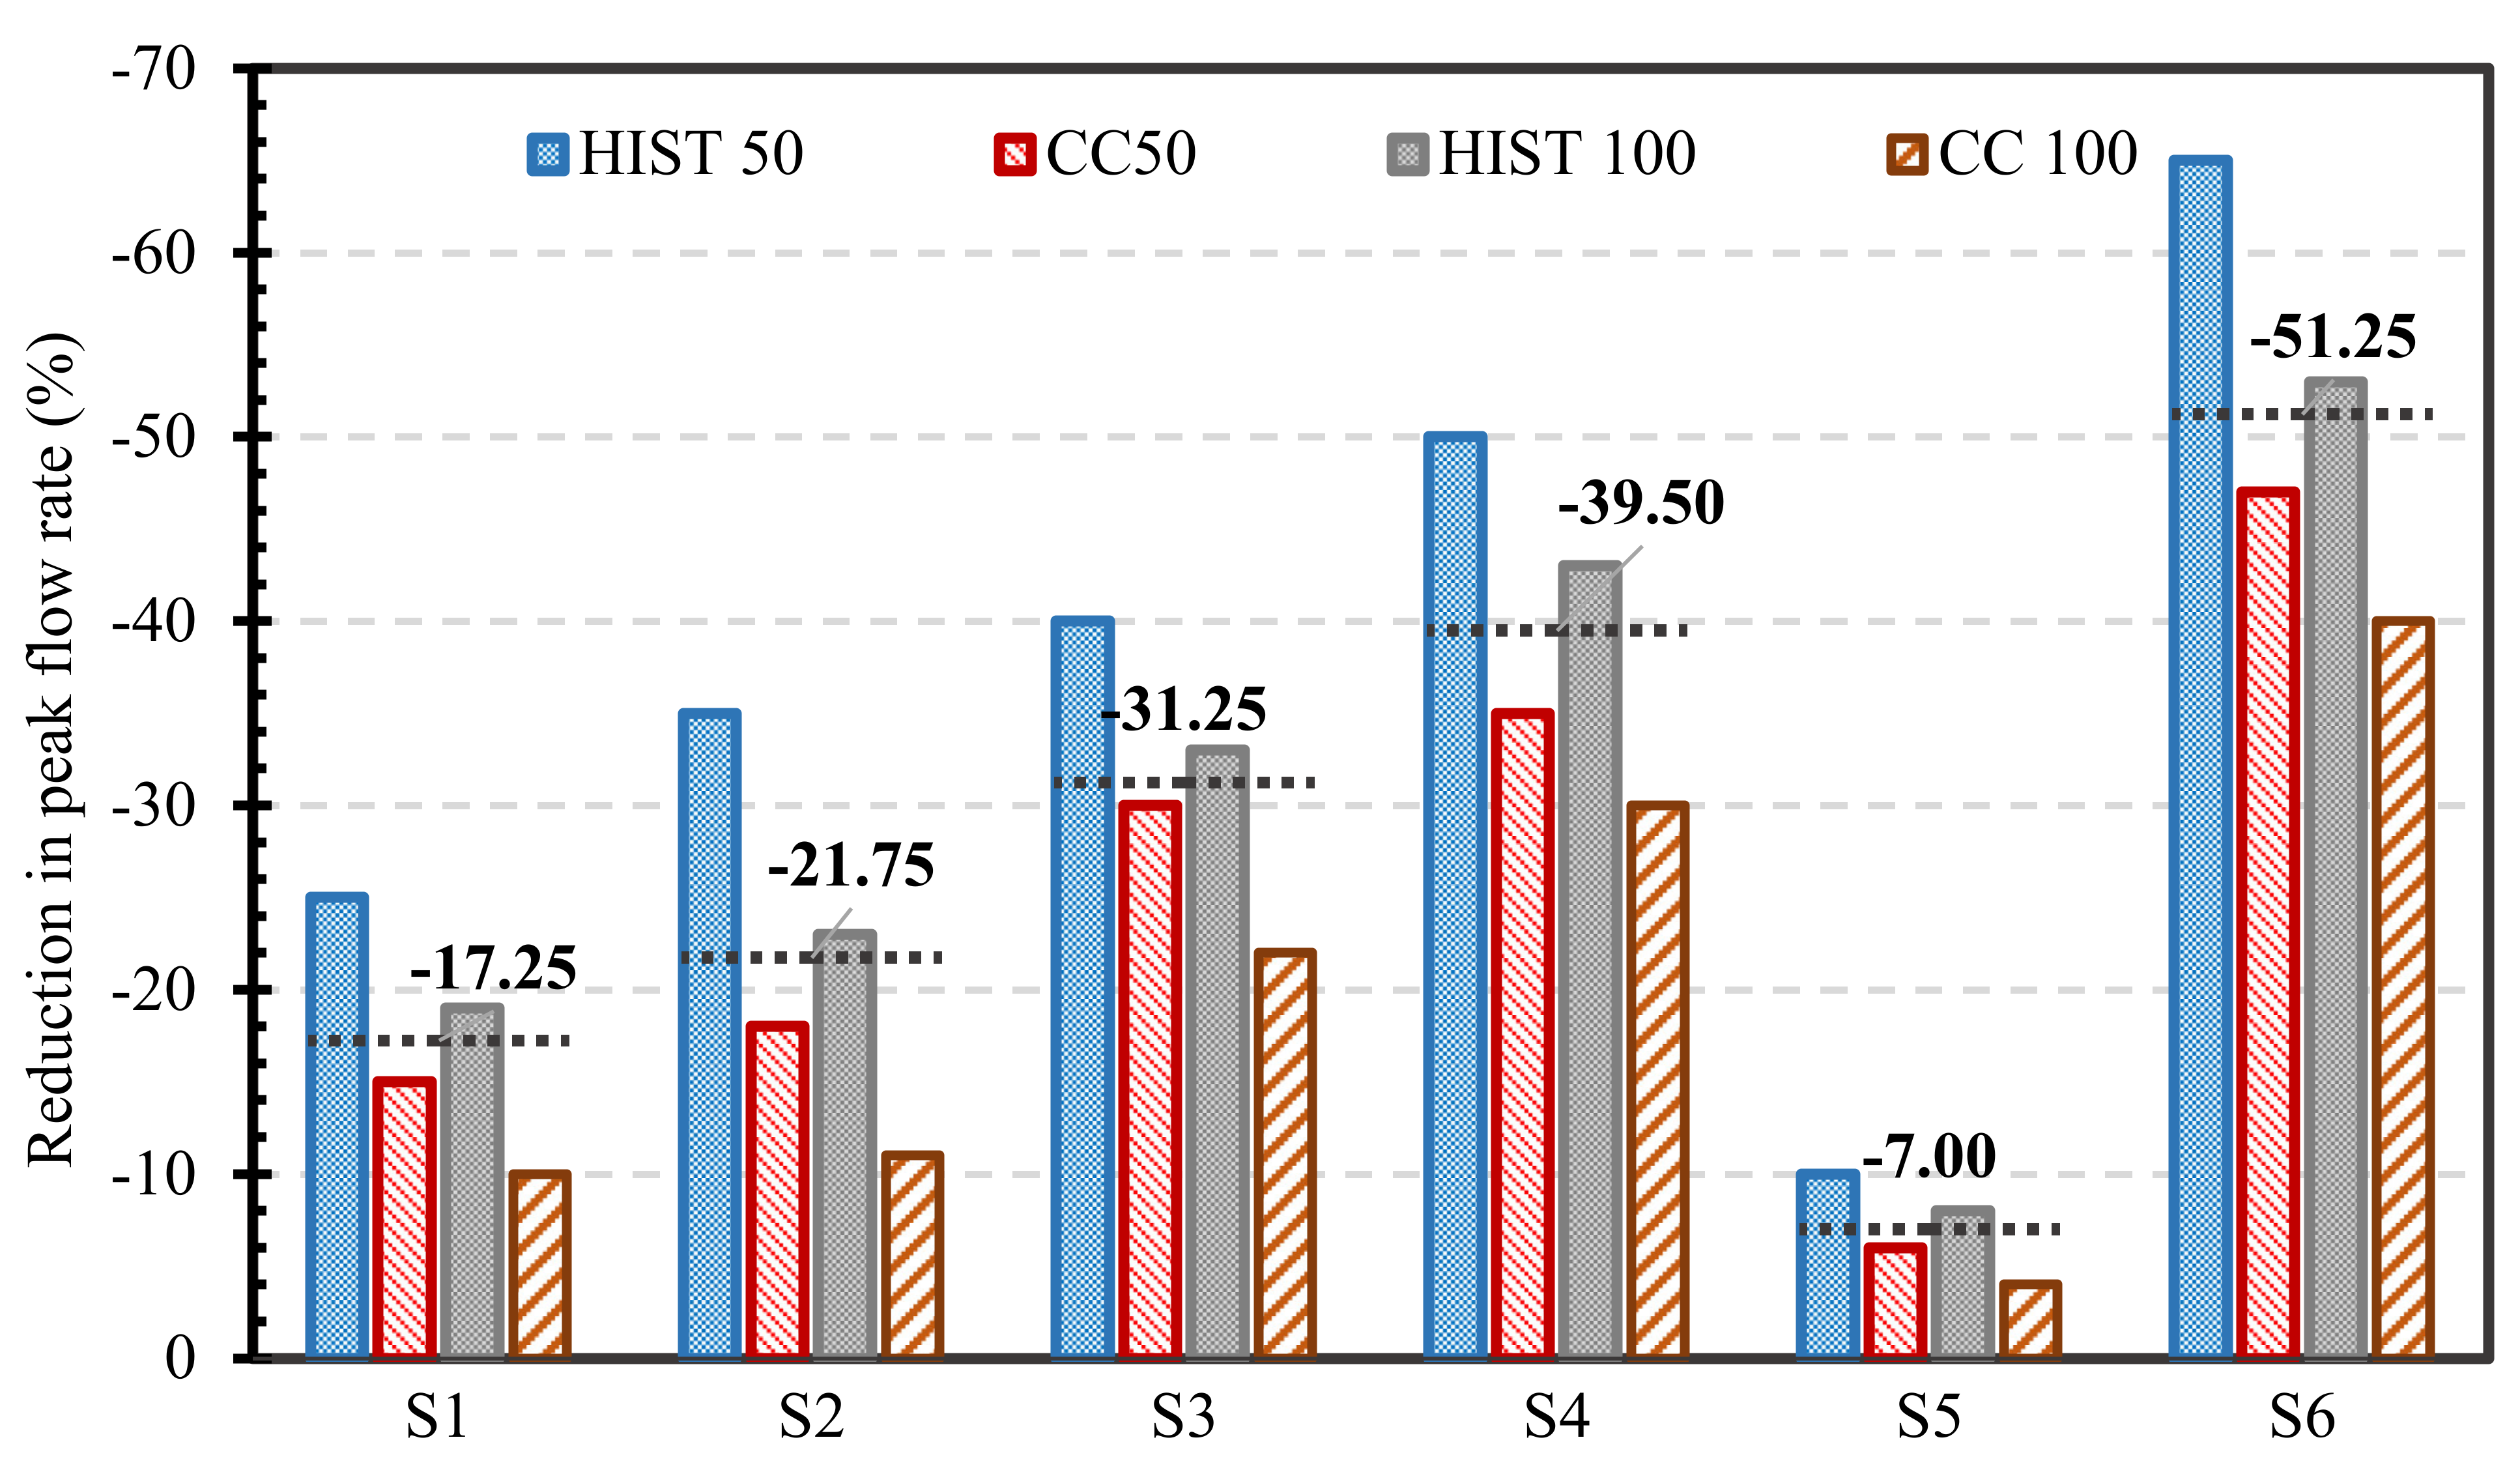
In order to minimize the increasing flood risk in the study area, six LID scenarios were considered to extend the existing stormwater system, which consists of both conventional and LID stormwater. The combined implementation of the rain barrel collecting the rooftop runoff, bio-retention, and infiltration trench provides the most effective control to stormwater and runoff from the study area under both past and future storm conditions. The added LIDs are relatively more effective in reducing the flow volume than the peak flow. It was also found that the volume and peak flow reduction by the selected LID scenarios are relatively lower for the future storms compared to the historical ones because of the higher precipitation intensity in the future. A full optimization of the LIDs implementation is needed to further improve their performance. The optimization should include several other practically feasible LIDs, the size, and locations of the LIDs.
Finally, the presented study showed the potential effectiveness of LIDs to minimize the increasing flood risk due to climate changes that most major cities faced in the United States. The study can be extended by including more LIDs, conducting rigorous optimization of the LID implementations, applying to other cities, and considering several climate change projections of storms. The study highlighted the effectiveness of green development (LIDs) for reducing urban stormwater runoff and peak flow under climate change scenarios but lacks impact on the water quality and groundwater level and societal and financial parameters. These limitations present important directions for the future work.

Author Contributions

The two authors planned and designed the methods to study and optimize of Low Impact Development for sustainable stormwater management in a changing climate in the City of Renton, WA. Y.A. developed the model, calibrated and performed scenario analysis using SWMM model with included the climate change scenarios and analyzed the spatial scenario output data. Y.A. also prepared the tables and figures for the publication, wrote the text and formatted the paper. Y.D. guided and supervised the whole process, discussed results during the modeling study, and edited the manuscript. All authors have read and agreed to the published version of the manuscript.

Funding

This research received no external funding.

Institutional Review Board Statement

Not applicable.

Informed Consent Statement

Not applicable.

Data Availability Statement

Data analyzed in this study are supported by King County and City of Renton WA. Which are openly available in the following public domain resources: https://green2.kingcounty.gov/hydrology/GaugeMap.aspx (accessed on 26 August 2020).

Acknowledgments

This study was partly supported by the Department of Defense’s Strategic Environmental Research and Development Program (SERDP) under contact W912HQ15C0023. The authors would also like to thank the King County and City of Renton for all the data and material provided for this research.

Conflicts of Interest

The authors declare no conflict of interest.

Abbreviations

AbbreviationMeaning
LIDLow Impact Development
SWMMStorm Water Management Model
CMIP6Coupled Model Intercomparison Project Phase 6
RCPRepresentative Concentration Pathways
SSPShared Socio-economic Pathway
GCMsglobal climate models
MIROCModel for Interdisciplinary Research on Climate
CMCC-ESMEuro-Mediterranean Centre on Climate Change coupled climate model-Earth System Model
SSURGOSoil Survey Geographical Database
USDAUnited States Department of Agriculture
HISTHistorical
CCClimate Change (future)
FEMAFederal Emergency Management Agency
NSENash-Sutcliffe efficiency
IDFIntensity-Duration-Frequency
SCS-CNSoil Conservation Service-Curve Number
CNCurve Number
DEMDigital Elevation Model
NRCSNatural Resources Conservation Service
ITInfiltration Trench
RBRain Barrel
RGRain Garden
BRBioretention
PPPermeable Pavement

References

  1. Rhea, L.; Jarnagin, T.; Hogan, D.; Loperfido, J.V.; Shuster, W. Effects of urbanization and stormwater control measures on streamflows in the vicinity of Clarksburg, Maryland, USA. Hydrol. Process. 2015, 29, 4413–4426. [Google Scholar] [CrossRef]
  2. Su, Q.; Chang, H.-S. Exploring the Spatial Development of Watersheds and the Allocation of Responsibility for Stormwater Runoff from the Perspective of Ecological Efficiency Based on the DEA Method. Nat. Hazards Rev. 2021, 22, 4021041. [Google Scholar] [CrossRef]
  3. Dietz, M.E.; Clausen, J.C. Stormwater runoff and export changes with development in a traditional and low impact subdivision. J. Environ. Manag. 2008, 87, 560–566. [Google Scholar] [CrossRef] [PubMed]
  4. Jacobson, C.R. Identification and quantification of the hydrological impacts of imperviousness in urban catchments: A review. J. Environ. Manag. 2011, 92, 1438–1448. [Google Scholar] [CrossRef]
  5. Rezaei, A.R.; Ismail, Z.B.; Niksokhan, M.H.; Ramli, A.H.; Sidek, L.M.; Dayarian, M.A. Investigating the effective factors influencing surface runoff generation in urban catchments—A review. Desalinat. Water Treat. 2019, 164, 276–292. [Google Scholar] [CrossRef]
  6. Konrad, C.P. Effects of Urban Development on Floods; United States Geological Survey Fact Sheet 076–03; United States Geological Survey: Tacoma, WA, USA, 2003. [Google Scholar]
  7. Sheng, J.; Wilson, J.P. Watershed urbanization and changing flood behavior across the Los Angeles metropolitan region. Nat. Hazards 2009, 48, 41–57. [Google Scholar] [CrossRef]
  8. Douglas, E.M.; Fairbank, C.A. Is Precipitation in Northern New England Becoming More Extreme? Statistical Analysis of Extreme Rainfall in Massachusetts, New Hampshire, and Maine and Updated Estimates of the 100-Year Storm. J. Hydrol. Eng. 2011, 16, 203–217. [Google Scholar] [CrossRef] [Green Version]
  9. Papalexiou, S.M.; Montanari, A. Global and regional increase of precipitation extremes under global warming. Water Resour. Res. 2019, 55, 4901–4914. [Google Scholar] [CrossRef]
  10. Janssen, E.; Wuebbles, D.J.; Kunkel, K.E.; Olsen, S.C.; Goodman, A. Observational- and model-based trends and projections of extreme precipitation over the contiguous United States. Earth’s Futur. 2014, 2, 99–113. [Google Scholar] [CrossRef]
  11. Jung, M.; Kim, H.; Mallari, K.J.B.; Pak, G.; Yoon, J. Analysis of effects of climate change on runoff in an urban drainage system: A case study from Seoul, Korea. Water Sci. Technol. 2015, 71, 653–660. [Google Scholar] [CrossRef]
  12. Min, S.-K.; Zhang, X.; Zwiers, F.W.; Hegerl, G.C. Human contribution to more-intense precipitation extremes. Nature 2011, 470, 378–381. [Google Scholar] [CrossRef]
  13. Rosenberg, S.; Vedlitz, A.; Cowman, D.F.; Zahran, S. Climate change: A profile of US climate scientists’ perspectives. Clim. Chang. 2009, 101, 311–329. [Google Scholar] [CrossRef]
  14. Booth, D.B.; Hartley, D.; Jackson, R. Forest cover, impervious-surface area, and the mitigation of stormwater impacts. JAWRA J. Am. Water Resour. Assoc. 2002, 38, 835–845. [Google Scholar] [CrossRef]
  15. Gebreegziabher, M.; Demissie, Y. Modeling Urban Flood Inundation and Recession Impacted by Manholes. Water 2020, 12, 1160. [Google Scholar] [CrossRef] [Green Version]
  16. Moglen, G.E.; Vidal, G.E.R. Climate Change and Storm Water Infrastructure in the Mid-Atlantic Region: Design Mismatch Coming? J. Hydrol. Eng. 2014, 19, 4014026. [Google Scholar] [CrossRef]
  17. Moore, T.L.; Gulliver, J.S.; Stack, L.; Simpson, M.H. Stormwater management and climate change: Vulnerability and capacity for adaptation in urban and suburban contexts. Clim. Chang. 2016, 138, 491–504. [Google Scholar] [CrossRef]
  18. Burns, M.J.; Fletcher, T.D.; Walsh, C.J.; Ladson, A.R.; Hatt, B.E. Hydrologic shortcomings of conventional urban stormwater management and opportunities for reform. Landsc. Urban Plan. 2012, 105, 230–240. [Google Scholar] [CrossRef]
  19. Ahiablame, L.M.; Engel, B.A.; Chaubey, I. Effectiveness of Low Impact Development Practices: Literature Review and Suggestions for Future Research. Water Air Soil Pollut. 2012, 223, 4253–4273. [Google Scholar] [CrossRef]
  20. Eckart, K.; McPhee, Z.; Bolisetti, T. Performance and implementation of low impact development—A review. Sci. Total. Environ. 2017, 607–608, 413–432. [Google Scholar] [CrossRef]
  21. Rose, S.; Peters, N.E. Effects of urbanization on streamflow in the Atlanta area (Georgia, USA): A comparative hydrological approach. Hydrol. Process. 2001, 15, 1441–1457. [Google Scholar] [CrossRef]
  22. Hunt, W.F.; Smith, J.T.; Jadlocki, S.J.; Hathaway, J.M.; Eubanks, P.R. Pollutant Removal and Peak Flow Mitigation by a Bioretention Cell in Urban Charlotte, N.C. J. Environ. Eng. 2008, 134, 403–408. [Google Scholar] [CrossRef]
  23. Hood, M.J.; Clausen, J.C.; Warner, G.S. Comparison of Stormwater Lag Times for Low Impact and Traditional Residential Development. JAWRA J. Am. Water Resour. Assoc. 2007, 43, 1036–1046. [Google Scholar] [CrossRef]
  24. United States Environmental Protection Agency (USEPA). Low Impact Development (LID), A Literature Review; EPA841-B-00-005; USEPA Office of Water: Washington, DC, USA, 2000.
  25. Bachmann, N.J. Hydrologic Monitoring of an Integrated Low Impact Development (LID) Underdrained Stormwater Management System. Master’s Thesis, Michigan Technological University, Houghton, MI, USA, 2007. [Google Scholar]
  26. Perez-Pedini, C.; Limbrunner, J.F.; Vogel, R.M. Optimal Location of Infiltration-Based Best Management Practices for Storm Water Management. J. Water Resour. Plan. Manag. 2005, 131, 441–448. [Google Scholar] [CrossRef]
  27. Elliott, A.; Trowsdale, S. A review of models for low impact urban stormwater drainage. Environ. Model. Softw. 2007, 22, 394–405. [Google Scholar] [CrossRef]
  28. Kabisch, N.; Frantzeskaki, N.; Pauleit, S.; Naumann, S.; Davis, M.; Artmann, M.; Haase, D.; Knapp, S.; Korn, H.; Stadler, J.; et al. Nature-based solutions to climate change mitigation and adaptation in urban areas: Perspectives on indicators, knowledge gaps, barriers, and opportunities for action. Ecol. Soc. 2016, 21, 39. [Google Scholar] [CrossRef] [Green Version]
  29. Gilroy, K.L.; McCuen, R.H. Spatio-temporal effects of low impact development practices. J. Hydrol. 2009, 367, 228–236. [Google Scholar] [CrossRef]
  30. Hadi, M.P.; Syamsiyyah, N.J.L.; Annisa, L. Unit hydrograph method for curve number validation in hydrological modeling: Case study of Welaran Watershed, Karangsambung, Kebumen. IOP Conf. Ser. Earth Environ. Sci. 2020, 451, 12077. [Google Scholar] [CrossRef]
  31. Zahmatkesh, Z.; Karamouz, M.; Goharian, E.; Burian, S. Analysis of the Effects of Climate Change on Urban Storm Water Runoff Using Statistically Downscaled Precipitation Data and a Change Factor Approach. J. Hydrol. Eng. 2015, 20, 5014022. [Google Scholar] [CrossRef]
  32. Zhou, Q.; Leng, G.; Huang, M. Impacts of future climate change on urban flood volumes in Hohhot in northern China: Benefits of climate change mitigation and adaptations. Hydrol. Earth Syst. Sci. 2018, 22, 305–316. [Google Scholar] [CrossRef] [Green Version]
  33. Martin-Mikle, C.J.; de Beurs, K.M.; Julian, J.P.; Mayer, P.M. Identifying priority sites for low impact development (LID) in a mixed-use watershed. Landsc. Urban Plan. 2015, 140, 29–41. [Google Scholar] [CrossRef] [Green Version]
  34. Sparkman, S.A.; Hogan, D.M.; Hopkins, K.G.; Loperfido, J. Modeling Watershed-Scale Impacts of Stormwater Management with Traditional versus Low Impact Development Design. JAWRA J. Am. Water Resour. Assoc. 2017, 53, 1081–1094. [Google Scholar] [CrossRef]
  35. Gu, C.; Cockerill, K.; Anderson, W.P.; Shepherd, F.; Groothuis, P.A.; Mohr, T.M.; Whitehead, J.C.; Russo, A.A.; Zhang, C. Modeling effects of low impact development on road salt transport at watershed scale. J. Hydrol. 2019, 574, 1164–1175. [Google Scholar] [CrossRef]
  36. Hoghooghi, N.; Golden, H.E.; Bledsoe, B.P.; Barnhart, B.L.; Brookes, A.F.; Djang, K.S.; Halama, J.J.; McKane, R.B.; Nietch, C.T.; Pettus, P.P. Cumulative Effects of Low Impact Development on Watershed Hydrology in a Mixed Land-Cover System. Water 2018, 10, 991. [Google Scholar] [CrossRef] [PubMed] [Green Version]
  37. Zhu, H.; Yu, M.; Zhu, J.; Lu, H.; Cao, R. Simulation study on effect of permeable pavement on reducing flood risk of urban runoff. Int. J. Transp. Sci. Technol. 2019, 8, 373–382. [Google Scholar] [CrossRef]
  38. Davis, A. Field Performance of Bioretention: Hydrology Impacts. J. Hydrol. Eng. 2008, 13, 90–95. [Google Scholar] [CrossRef] [Green Version]
  39. Lago, C.A.F.D.; de Macedo, M.B.; Mendiondo, E.M.; Giacomoni, M.H. The Effects of Climate Change on Low Impact Development (LID) Performance—A Case of Study in Sao Carlos, Brazil. In Proceedings of the International Low Impact Development Conference 2018, Nashville, TN, USA, 12–15 August 2018; pp. 40–45. [Google Scholar]
  40. Oberascher, M.; Zischg, J.; Palermo, S.A.; Kinzel, C.; Rauch, W.; Sitzenfrei, R. Smart Rain Barrels: Advanced LID Management Through Measurement and Control. In Green Energy and Technology; Springer: Cham, Switzerland, 2019; pp. 777–782. ISBN 9783319998664. [Google Scholar]
  41. Hu, M.; Sayama, T.; Zhang, X.Q.; Tanaka, K.; Takara, K.; Yang, H. Evaluation of low impact development approach for mitigating flood inundation at a watershed scale in China. J. Environ. Manag. 2017, 193, 430–438. [Google Scholar] [CrossRef]
  42. Stagge, J.H.; Davis, A.P.; Jamil, E.; Kim, H. Performance of grass swales for improving water quality from highway runoff. Water Res. 2012, 46, 6731–6742. [Google Scholar] [CrossRef]
  43. Xiao, Q.; McPherson, E.G.; Simpson, J.R.; Ustin, S.L. Hydrologic processes at the urban residential scale. Hydrol. Process. 2007, 21, 2174–2188. [Google Scholar] [CrossRef]
  44. Shuster, W.D.; Morrison, M.A.; Webb, R. Front-loading urban stormwater management for success–a perspective incorporating current studies on the implementation of retrofit low-impact development. Cities Environ. 2008, 1, 8. [Google Scholar] [CrossRef]
  45. Zhou, Q. A Review of Sustainable Urban Drainage Systems Considering the Climate Change and Urbanization Impacts. Water 2014, 6, 976–992. [Google Scholar] [CrossRef]
  46. Wang, M.; Zhang, D.Q.; Su, J.; Trzcinski, A.; Dong, J.W.; Tan, S.K. Future Scenarios Modeling of Urban Stormwater Management Response to Impacts of Climate Change and Urbanization. CLEAN—Soil Air Water 2017, 45, 1700111. [Google Scholar] [CrossRef] [Green Version]
  47. Qin, H.-P.; Li, Z.-X.; Fu, G. The effects of low impact development on urban flooding under different rainfall characteristics. J. Environ. Manag. 2013, 129, 577–585. [Google Scholar] [CrossRef] [Green Version]
  48. Beecham, S. Water sensitive urban design and the role of computer modelling. In Proceedings of the International Conference on Urban Hydrology for the 21st Century, WMO/UNESCO, Kuala Lumpur, Malaysia, 14–18 October 2002; pp. 21–45. [Google Scholar]
  49. Ackerman, D.; Stein, E.D. Evaluating the Effectiveness of Best Management Practices Using Dynamic Modeling. J. Environ. Eng. 2008, 134, 628–639. [Google Scholar] [CrossRef]
  50. Elliott, A.H.; Trowsdale, S.A.; Wadhwa, S. Effect of Aggregation of On-Site Storm-Water Control Devices in an Urban Catchment Model. J. Hydrol. Eng. 2009, 14, 975–983. [Google Scholar] [CrossRef]
  51. Li, Q.; Wang, F.; Yu, Y.; Huang, Z.C.; Li, M.T.; Guan, Y.T. Comprehensive performance evaluation of LID practices for the sponge city construction: A case study in Guangxi, China. J. Environ. Manag. 2019, 231, 10–20. [Google Scholar] [CrossRef]
  52. Jang, S.; Cho, M.; Yoon, J.; Yoon, Y.; Kim, S.; Kim, G.; Kim, L.; Aksoy, H. Using SWMM as a tool for hydrologic impact assessment. Desalination 2007, 212, 344–356. [Google Scholar] [CrossRef]
  53. Park, S.; Lee, K.; Park, I.; Ha, S. Effect of the aggregation level of surface runoff fields and sewer network for a SWMM simulation. Desalination 2008, 226, 328–337. [Google Scholar] [CrossRef]
  54. Soleimani-Alyar, M.; Ghaffari-Hadigheh, A.; Sadeghi, F. Controlling Floods by Optimization Methods. Water Resour. Manag. 2016, 30, 4053–4062. [Google Scholar] [CrossRef]
  55. King County. 2020. Available online: https://your.kingcounty.gov/dnrp/library/water-andland/flooding/Flood-Brochures/2020-2021-flood-brochures/20-21-be-flood-ready-brochure-countywide.pdf (accessed on 10 December 2020).
  56. The City of Renton. 2019. Available online: https://kingcounty.gov/~/media/depts/emergency/management/documents/plans/hazard-mitigation/City_of_Renton_Annex.ashx?la=en (accessed on 1 November 2020).
  57. Kitsap County, June 2020. “Climate Change Resiliency Assessment”.|Final Report. Available online: https://www.kitsapgov.com/dcd/Kitsap_climate_assessment/KitsapCountyClimateAssessment_June2020%20-%202%20Full%20Assessment%20LowRes.pdf (accessed on 2 June 2020).
  58. Elsner, M.M.; Cuo, L.; Voisin, N.; Deems, J.; Hamlet, A.F.; Vano, J.A.; Mickelson, K.E.B.; Lee, S.-Y.; Lettenmaier, D.P. Implications of 21st century climate change for the hydrology of Washington State. Clim. Chang. 2010, 102, 225–260. [Google Scholar] [CrossRef] [Green Version]
  59. Mauger, G.; Whitely Binder, L.; Morse, J. Climate Resilient Floodplains: Bringing climate science into project design. In Proceedings of the Salish Sea Ecosystem Conference, Vancouver, BC, Canada, 1–17 April 2016. [Google Scholar]
  60. Roussel, M.-L.; Lemonnier, F.; Genthon, C.; Krinner, G. Brief communication: Evaluating Antarctic precipitation in ERA5 and CMIP6 against CloudSat observations. Cryosphere 2020, 14, 2715–2727. [Google Scholar] [CrossRef]
  61. Soil Survey Staff. Soil Taxonomy: A Basic System of Soil Classification for Making and Interpreting Soil Surveys; USDA Natural Resource Conservation Service Agriculture Handbook # 436; U.S. Government Printing Office: Washington, DC, USA, 1999. [Google Scholar]
  62. NHC. Hydrologic Analysis for Floodplain Mapping Study for Springbrook Creek, King County, Washington; Report Prepared for City of Renton by Northwest Hydraulic Consultants, Inc.: Washington, WA, USA, 2005. [Google Scholar]
  63. NHC. Proposed Methodology for Hydrologic and Hydraulic Analysis of Lower Springbrook Creek Pursuant to 2002 Floodplain Re-Mapping; Report Prepared for City of Renton by Northwest Hydraulic Consultants, Inc.: Washington, WA, USA, 2002. [Google Scholar]
  64. Beck, R.W. City of Renton Springbrook Creek FEMA Remapping Study, Activity 1-Field Surveys and Reconnaissance; Report prepared for City of Renton by R. W. Beck, Inc.; R. W. Beck, Inc.: Washington, WA, USA, 2003. [Google Scholar]
  65. SWDM. 2017. Available online: https://rentonwa.gov/UserFiles/Servers/Server_7922657/File/City%20Hall/Public%20Works/Utility%20Systems/Surface%20Water%20Design%20Standards/2017RentonSWDM_Complete_Final_Final.pdf (accessed on 10 October 2020).
  66. Rossman, L.A.; Epa, U. Modeling Low Impact Development Alternatives with SWMM. J. Water Manag. Model. 2010, 11, 167–182. [Google Scholar] [CrossRef] [Green Version]
  67. Rossman, L.A. Stormwater Management Model User’s Manual Version 5.0; National Risk Management Research Laboratory; Office of a Research and Development; U.S. Environmental Protection Agency: Cincinnati, OH, USA, 2010.
  68. Gironás, J.; Roesner, L.A.; Davis, J.; Rossman, L.A. Storm Water Management Model App Jang Cations Manual; National Risk Management Research Laboratory; Office of Research and Development; U.S. Environmental Protection Agency: Cincinnati, OH, USA, 2009; p. 45268.
  69. Lemaître, P.; Sergienko, E.; Arnaud, A.; Bousquet, N.; Gamboa, F.; Iooss, B. Density modification-based reliability sensitivity analysis. J. Stat. Comput. Simul. 2015, 85, 1200–1223. [Google Scholar] [CrossRef] [Green Version]
  70. Qian, W.; Chang, H.H. Projecting Health Impacts of Future Temperature: A Comparison of Quantile-Mapping Bias-Correction Methods. Int. J. Environ. Res. Publ. Health 2021, 18, 1992. [Google Scholar] [CrossRef]
  71. Gámez-Balmaceda, E.; López-Ramos, A.; Martínez-Acosta, L.; Medrano-Barboza, J.P.; Remolina López, J.F.; Seingier, G.; López-Lambraño, A.A. Rainfall Intensity-Duration-Frequency Relationship. Case Study: Depth-Duration Ratio in a Semi-Arid Zone in Mexico. Hydrology 2020, 7, 78. [Google Scholar] [CrossRef]
  72. Eckart, K.; McPhee, Z.; Bolisetti, T. Multiobjective optimization of low impact development stormwater controls. J. Hydrol. 2018, 562, 564–576. [Google Scholar] [CrossRef]
  73. Tarpey, E.; Su, S.; Svenson, P.; Ye, Y. Designing a Rain Garden on Campus at the University of Illinois. 2017. Available online: https://icap.sustainability.illinois.edu/files/projectupdate/4207/Rain%20Garden%20design.pdf (accessed on 10 October 2020).
  74. Ontario Ministry of the Environment (MOE). Stormwater Management Planning and Design Manual; Queen’s Printer: Whitehorse, ON, Canada, 2003. [Google Scholar]
  75. David, R.S. Permeable Interlocking Concrete Pavements; Selection, Design, Construction, and Maintenance; Interlocking Concrete Pavement Institute: Herndon, VA, USA, 2006. [Google Scholar]
  76. Xie, J.; Wu, C.; Li, H.; Chen, G. Study on storm-water management of grassed swales and permeable pavement based on SWMM. Water 2017, 9, 840. [Google Scholar] [CrossRef] [Green Version]
  77. Bai, Y.; Zhao, N.; Zhang, R.; Zeng, X. Storm water management of low impact development in urban areas based on SWMM. Water 2019, 11, 33. [Google Scholar] [CrossRef] [Green Version]
Figure 1. The study area (or City of Renton) with the weather station and Springbrook Creek that collects the stormwater from streets drainages.
Water 13 02889 g001
Figure 2. Parts of the stormwater network and existing LIDs in the study area.
Water 13 02889 g002
Figure 3. FEMA floodplain zones in part of the study area modified after CORMAP 2020.
Water 13 02889 g003
Figure 4. Schematic diagram outlining the steps and methodologies involved in developing the SWMM model and assess effectiveness of the LIDs.
Water 13 02889 g004
Figure 5. The sub-catchments and stormwater system of the study area.
Water 13 02889 g005
Figure 6. Spatial distribution of LID in part of the City of Renton with existing urban storm system modified after CORMAP 2020.
Water 13 02889 g006
Figure 7. (a). Observed and downscaled daily precipitation from the MIROC6 Model. (b). Observed and downscaled daily precipitation from the CMCC-ESM2 Model.
Water 13 02889 g007
Figure 8. IDF curves for the historical (a) and future (b) periods for the selected station (3u).
Water 13 02889 g008
Figure 9. Calibration results for the storm events in (a) 18–20 June 2019, (b) 7 October–7 December 2019; validation results for the storm events in (c) 21 August 2019, (d) 8 October 2019.
Water 13 02889 g009
Figure 10. Comparison of simulated flow rates (cfs) at the drainage outlet with and without considering the existing LIDs in the stormwater system.
Water 13 02889 g010
Figure 11. Reduction of flow (in %) for different LID types compared to the existing stormwater system.
Water 13 02889 g011
Figure 12. Reduction of total flows (%) by different LIDs scenarios for the 50- and 100-year historical (HIST) and future (CC) storm events. Dotted lines represent the reduction of flow over selected historical and future design storms.
Water 13 02889 g012
Figure 13. Reduction of peak flows (%) for different LIDs scenarios for 50- and 100-year storm events of the historical (HIST) and future periods (CC). Dotted lines represent the reduction of flow averaged over selected historical and future design storms.
Water 13 02889 g013
Table 1. List of main variables used for the SWMM model development.
Variables/
Simulation Options
DescriptionSource
Curve Number Infiltration MethodDescribes how rainfall infiltrates to the upper zone of soil in a catchmentCalibrated
N ImperviousRoughness of overland flow (Manning’s n) for impervious sub-catchmentCalibrated
Zero ImperviousPercentage of impervious area with zero depressionCalibrated
Width of Sub catchmentWidth of sub catchment area for overland flow length of imperviousSWMM User Manual
[67]
Dynamic Wave Routing Methodconveyance routesClassified by user
Storm event-type IANRCS Type 1A rainfall distributionSWMM User Manual [67]
Surface slope (%)The slope of each sub catchmentDEM
Surface layerVegetation volume(fraction), % of a storage depth’s volume that is taken up by vegetation.SWMM User Manual [68]
Table 2. SWMM parameters used for the sensitivity analysis.
ParametersValuesInitial Values Source
Sub-catchment widthVariableGeometry
Manning’s n for impervious surface0.05–0.15SWMM Manual
Impervious Percentage with no depression (%)5–15SWMM Manual
Curve NumberVariableDEM, land use & soil data
Table 3. Description of the six LID scenarios.
ScenarioRemark
(S1) Only RGRaingarden (RG) collecting the rainwater from land surface and roofs.
(S2) Combination IT+ BRRain barrel (BR) collecting runoff from the roofs, while infiltration trench (IT) capturing the runoff from
driveways.
(S3) Only PPPermeable pavement (PP) collecting the runoff from parking lots.
(S4) Combination PP + BRPermeable pavement collects the rainwater in parking lot and driveway, while bio-retention (BR) collects the runoff from roof and 10% runoff from parking lots.
(S5) Only BRBio-retention capturing the driveway runoff in the public properties.
(S6) Combination RB + BR + ITRain barrel collecting the runoff from roofs, Bio-retention and Infiltration trench capturing the runoff from the entire driveway.
Table 4. Sensitivity analysis of SWMM parameters on peak flow.
Parameter TestPercentage Change (%)Reduction in Peak Flow (%)Percentage Change (%)Reduction in Peak FlowPercetage
Change (%)
Reduction in Peak Flow (%)
Zero Impervious5−13.89%10−16.9%15−22.44%
Width5−10.75%10−14.60%15−18.31%
Manning n5−15.20%10−19.86%15−23.51%
CN5−17.29%10−20.69%15−24.74%
Table 5. Performance evaluation for the calibration and validation storms.
PeriodNSER2
Calibration (7 October 2019–7 December 2019)0.810.83
Calibration (18 June 2019–20 June 2019)0.790.81
Validation (21 August 2019 for 23 h)0.800.82
Validation (8 October 2019 for 21 h)0.840.87
Publisher’s Note: MDPI stays neutral with regard to jurisdictional claims in published maps and institutional affiliations.

