1. Introduction
Water safety is essential in today’s societies [
1]. From this perspective, the monitoring of this resource is essential to avoid exposure to pathogenic agents [
2,
3,
4], whose presence in drinking water production and distribution systems can have a high impact on public health; not only health may be affected but also the consumers’ confidence in the water that is provided [
2]. Water can be contaminated by bacteria, protozoa, and viruses [
2,
4,
5]. Of the several pathogens, it is worth highlighting enteric viruses, classified by the World Health Organization (WHO) as having a moderate to high impact on human health [
1].
In the 21st century, enteric viruses still one of the main causes of mortality and morbidity worldwide [
1,
5]. In nature, there are more than 200, distributed across different families such as, for example,
Adenoviridae,
Astroviridae,
Caliciviridae,
Hepeviridae,
Reoviridae, and
Picornaviridae. They replicate in the gastrointestinal tract and are transmitted mainly through the fecal-oral route [
5], where contaminated water and food are the main transmission vehicles. Water contamination can occur in different ways, namely through disruptions in sewerage networks, untreated wastewater discharges, industrial waste discharges, open defecation, ship discharges in ports and surface runoff [
2,
3,
4,
5,
6]. These pathogens are released in large numbers in the feces of carriers during infection, being more resistant than bacteria to changing environmental conditions (e.g., temperature and pH) [
4,
5,
6]. They can maintain the ability to infect living organisms for long periods of time in water. The presence of robust capsids and the absence of lipid envelopes make them highly resistant to water disinfection treatments [
5,
7]. Their elimination is thus complex in water matrices [
8]. When entering the bodies of humans or other animals, they can cause a diverse range of symptoms such as gastroenteritis, fever and, in extreme cases, death [
6].
Over the years, enteric viruses have been detected both in developing and developed countries such as Portugal, France, the United States, the Netherlands, and Germany, in various water matrices, namely natural water (surface water and groundwater), drinking water, and wastewater [
4,
5,
8].
The methodologies for the monitoring of these viruses are complex, in most cases with low recovery rates [
9,
10,
11]. Two of the most commonly applied methodologies are the Method 1615 of the United States Environmental Protection Agency (EPA) [
12] and the European methodology ISO 15216-1: 2017 [
13]. Method 1615 allows the analysis of large volumes of water (from some milliliters to more than 1500 L), which results in greater security for the analysis and for the water consumers, and which was therefore followed in this study [
12]. The high complexity of the method, consisting of different steps (filtration/primary concentration, secondary concentration, tertiary concentration, extraction of nucleic acids, molecular detection and quantification) may take advantage of the utilization of a process control virus, to allow estimating the recovery rate of the viruses present in the sampled water, usually quantified by reverse transcription coupled to quantitative polymerase chain reaction (RT-qPCR) [
9,
14,
15].
Currently, there are several process control viruses on the market to assess the efficiency of other viruses’ recovery during sample processing and the possible inhibition of RT-PCR reactions [
9,
14]. Among the various available controls, the most common are mengovirus, murine norovirus, feline calicivirus, MS2 coliphage, Tulane virus, and turnip crinkle virus [
14].
One of the most commercialized is the vMC0 strain of mengovirus (Cardiovirus A, according to the ICTV 2019 Release), which is a member of the
Picornaviridae [
16]. The non-virulent mutant vMC0 strain of mengovirus was patented in 2007 by Barcelona University as control of the nucleic acids’ extraction step (PCT/EP2007/055407) [
17]. This virus has structural and physical-chemical properties similar to those of hepatitis A virus (an enteric virus), and resistance in the environment similar to most enteric viruses, which make it a current morphological, physical-chemical, and genetic model for virus’ monitoring [
15,
18,
19,
20].
Mengovirus is also referenced in the European standard ISO 15216-1: 2017 as the process control virus of the method for detection of hepatitis A virus and noroviruses by quantitative RT-qPCR [
13]. In recent years, mengovirus has been used not only as control of the RNA extraction step but also in other phases of the sampling processes prior to RNA extraction, in studies involving a diversity of samples (berries, lettuce, and bivalves), in addition to water (drinking water and wastewater) [
15,
21,
22,
23]. In the study of Hennechart-Collette et al. [
24] comprising water and food samples, mengovirus was considered the most appropriate control for the detection of
Norovirus Genogroup I in bottled water and semi-dried tomatoes; on the other hand, murine norovirus type 1 was considered the most suitable for the detection of hepatitis A virus and
Norovirus Genogroup II in lettuce. Similar conclusions were reached in the study of Gentry-Shields and Jaykus [
14], where five process control viruses (mengovirus, murine norovirus, MS2 coliphage, Tulane virus, and turnip crinkle virus) were evaluated, and mengovirus showed recovery rates closer to those of human
Norovirus in food samples. In 2020, mengovirus was used as a process control virus for the detection of genomic RNA of
Enterovirus, hepatitis A virus, hepatitis E virus and
Norovirus, in diverse water matrices: groundwater and surface water intended for drinking water production, drinking water, and wastewater [
8,
15,
18]. More recently, mengovirus was also used as a process control virus in the monitoring of SARS-CoV-2 (an enveloped RNA virus) in drinking water and wastewater [
22,
25,
26].
The recovery rates of mengovirus were very variable, from 48.75% and 36.3% in bottled water (Coudray-Meunier et al. [
21] and Hennechart-Collette et al. [
24], respectively), to lower values in residual water, as in the study by Randazzo et al. [
22] where the recoveries varied between 3.3 ± 1.6% in influent water and 6.2 ± 1.0% in effluent water [
21,
22,
24].
The present study, involving two water matrices (surface and drinking water) surveyed for the presence of enteric viruses, aimed to evaluate the suitability of mengovirus as process control virus in the water sampling process carried out in these surveys. The recovery of mengovirus was evaluated for its addition before and after the filtration/primary concentration, i.e., the presence of the control virus during the whole sampling process or only in the final stages after filtration. The final step was viral RNA detection and quantification (for all samples) and evaluation of viral infectivity (only for some samples).
This study also addressed the suitability of mengovirus as control virus in surveys targeting viral infectivity, by making use of Vero E6 cell cultures where the virus was produced and titrated. A consequence of this approach was the assessment of mengovirus infectivity carried out in some samples.
2. Materials and Methods
2.1. Collection, Filtration, and Concentration of Water Samples
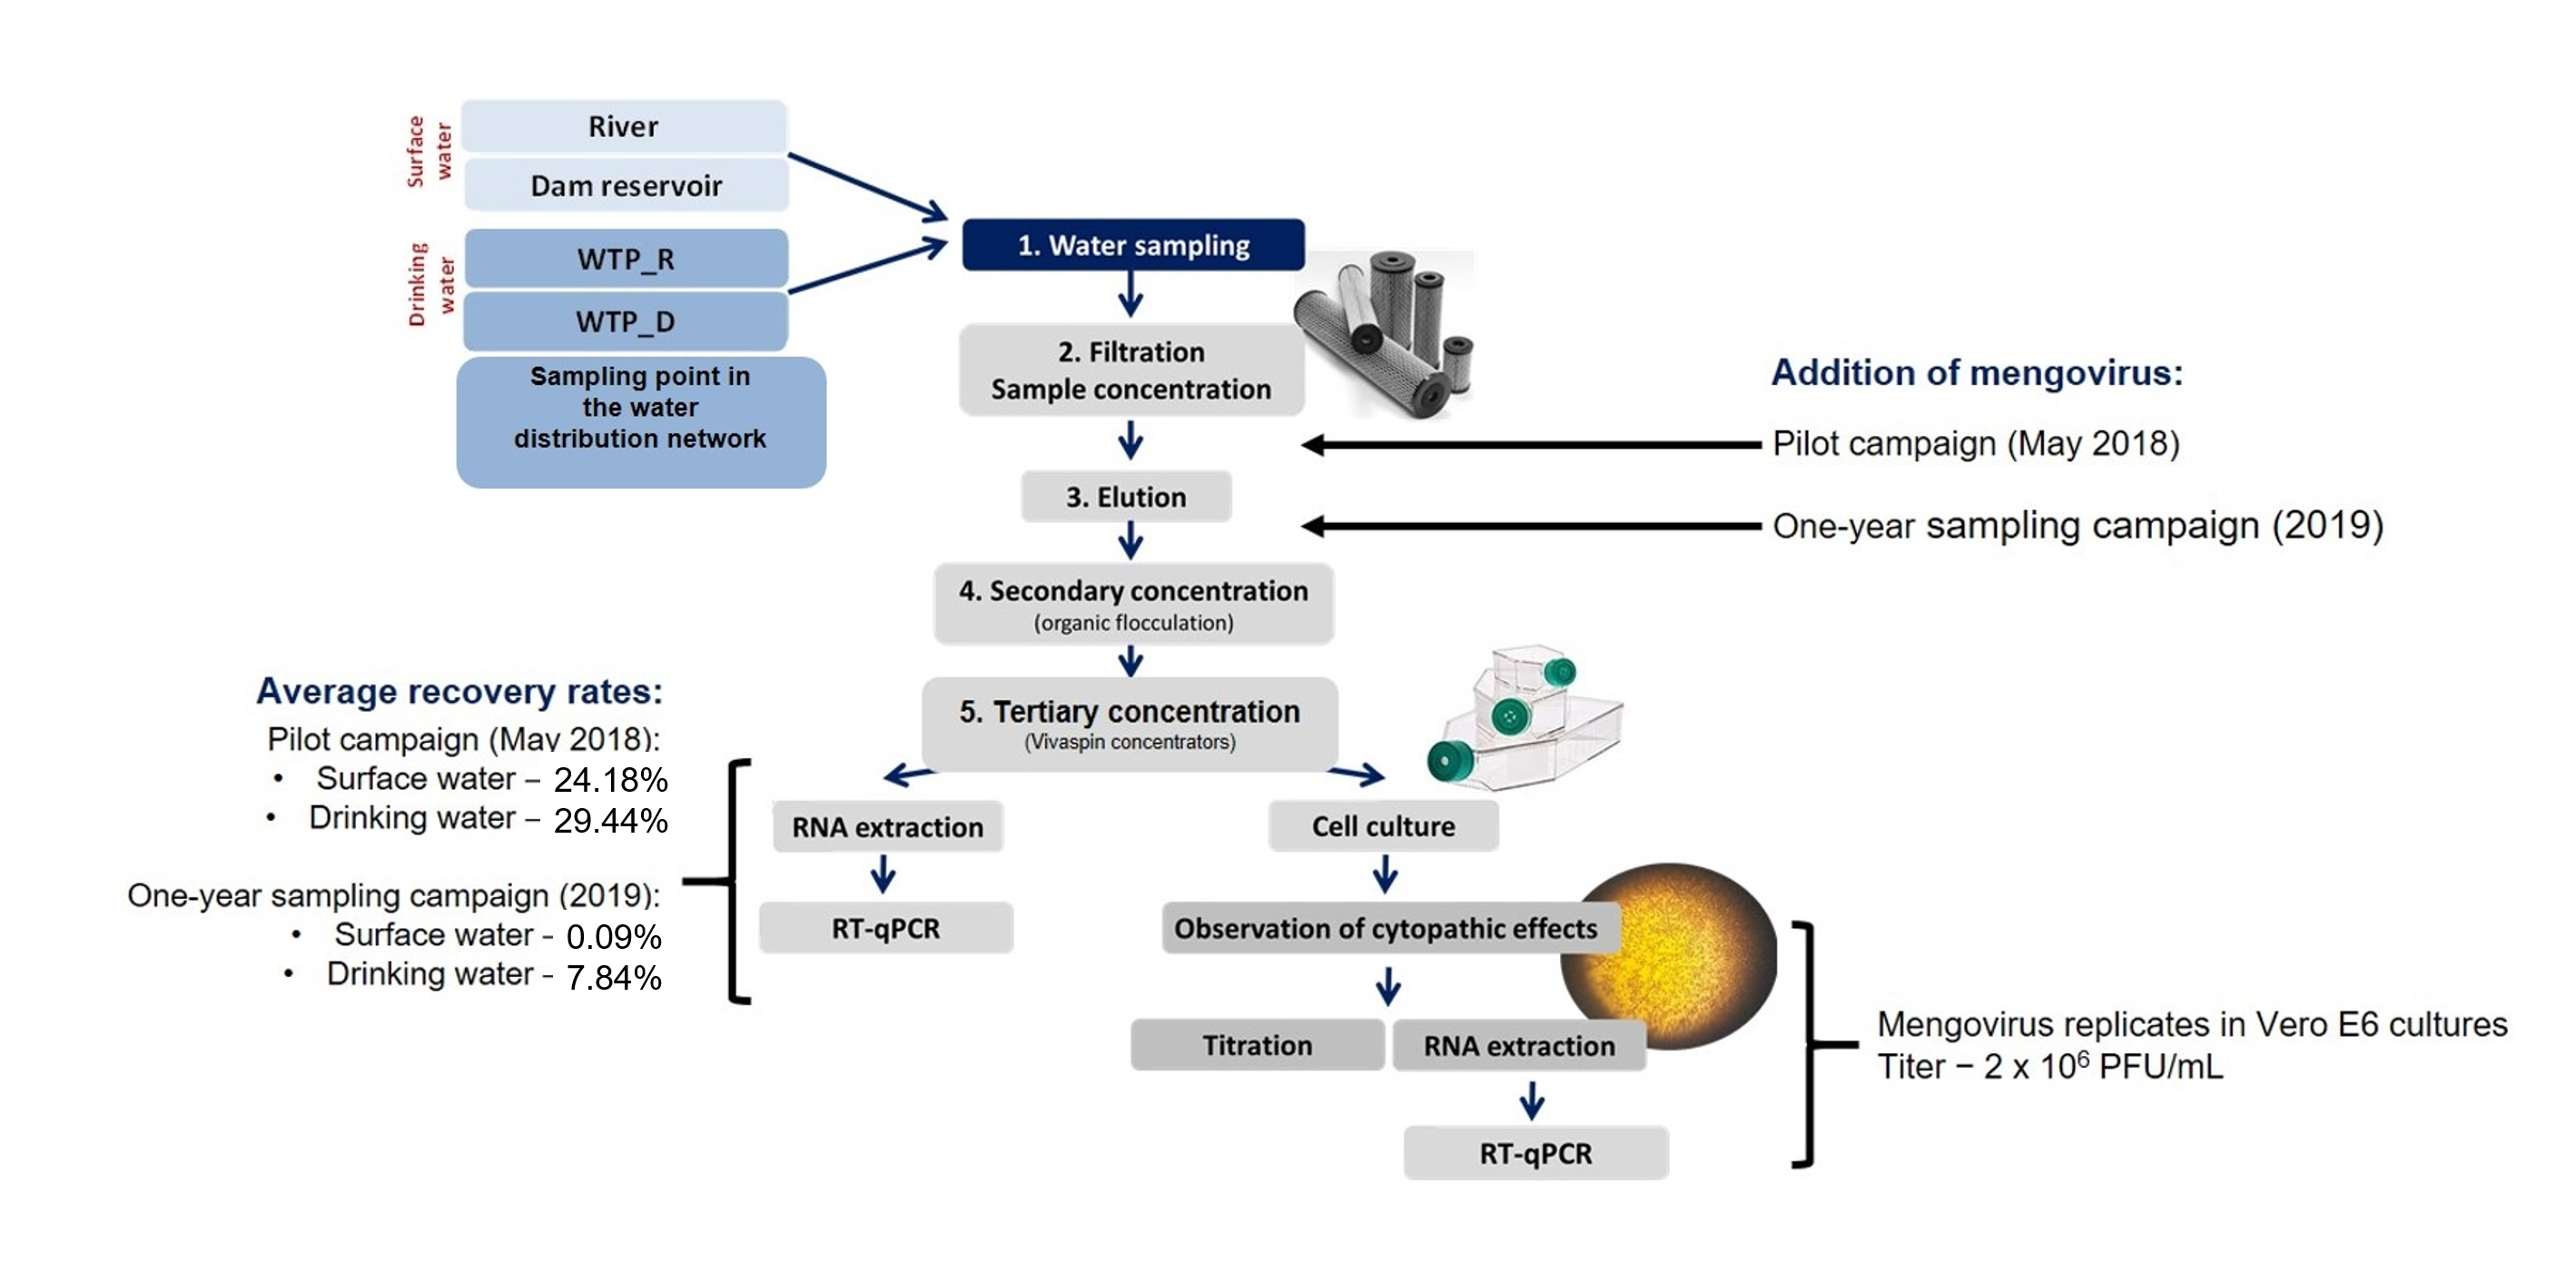
In two sampling campaigns, carried out in May 2018 and January–December 2019, surface water and drinking water were surveyed for a group of enteric viruses (
Enterovirus, HAV, HEV and
Norovirus), by the application of Method 1615 [
12]. The surface water was collected in a river and in a dam reservoir. Drinking water was collected at the outlet of two Water Treatment Plants (WTPs) and at a point in the distribution network. WTP_R treats natural water from the river (R) and WTP_D treats natural water from the dam reservoir (D). In the distribution network, there is a mixture of water coming from the two WTPs. The characteristics of the sampling sites and the filtration and concentration procedures were described in Salvador et al. [
23]. In short, 10 to 1500 L of surface water and 600 to 1900 L of drinking water were collected by filtration/concentration at the sampling sites, using Nanoceram
® filters (Argonite; Sanford, FL, USA), at a maximum filtration flow of 10 L/minute. For surface water, the filtration/primary concentration occurred until the filter clogged, or the sampled volume was greater than 100 L (not exceeding five hours). For drinking water, the filtration/primary concentration was carried out until the sampled volume was greater than 500 L (not exceeding seven hours). The filters were then transported in refrigerated chests to the laboratory, inside glass housings filled with 500 mL of water. This volume of water was filtered in the laboratory, just before eluting the filter concentrates with 3% beef extract (BD Bioscience; Franklin Lakes, NJ, USA). Then, the eluted samples went through an organic flocculation process involving centrifugations (secondary concentration) and followed by filtration through 0.22 µm pore-size Acrodisc Syringe filters (PALL Corporation; Ann Arbor, MI, USA) to remove bacteria and fungi [
21]. After these procedures, the resulting samples of about 35 mL were aliquoted and frozen at −70 °C. A subsample of 10 mL was reserved for infectivity assays in Vero E6 cultures as described in Salvador et al. [
23]. A subsample of 20 mL reserved for RNA extraction undergone a tertiary concentration in Vivaspin
® concentrators (Sartorius; Goettingen, Germany) by centrifugation at 8000×
g and 4 °C for 6 h or until a volume of about 1 mL was achieved. RNA was then extracted from this concentrated [
10,
23].
Mengovirus Addition
In the pilot samplings of May 2018, 10 μL (corresponding to 106 genomic copies) of a mengovirus solution (bioMérieux; Marcy-l’Etoile, France) was added to the 3% beef extract before the starting of the organic flocculation (secondary concentration) referred at previous point.
In the 2019 campaign, aiming to cover all of the experimental procedures, 10 μL of a mengovirus solution (106 genomic copies) (bioMérieux; Marcy-l’Etoile, France) was added to the lasting volume of water (500 mL transported in the housing with the filter) that was filtered just before the elution of the filter concentrates (secondary concentration step) as referred above.
2.2. RNA Extraction, Mengovirus RNA Detection and Quantification by RT-qPCR
RNA extractions from the concentrated water samples (
Section 2.1) were performed with the QIAamp viral RNA Mini kit (Qiagen; Hilden, Germany), following the manufacturer’s instructions. RT-qPCR reactions targeting the detection and quantification of mengovirus genomic RNA were performed on a StepOnePlus thermocycler (Applied Biosystems; Foster City, CA, USA), according to the conditions described in Salvador et al. [
10,
23]. In short, Mengovirus Extraction Control kit (bioMérieux; Marcyl’Etoile, France), was used in 25 μL reaction mixtures consisting of 20 μL of MasterMix and 5 μL of extracted RNA. Reverse transcription and amplification conditions were 45 °C for 10 min, 95 °C for 10 min, followed by 45 cycles of 95 °C for 15 s and at 60 °C for 45 s. The quantitation curve for mengovirus RNA was achieved with four points (0.1%, 1%, 10%, and 100%) established with RNA extracted from 10 μL (10
6 genomic copies) of a mengovirus solution (bioMérieux; Marcyl’Etoile, France), with the QIAamp viral RNA Mini kit (Qiagen; Hilden, Germany), according to the manufacturer’s instructions. Values given are average results of two independent RT-qPCR amplifications. Whenever absence of amplification was observed, potential inhibitory effects of the RNA sample were checked by 1:5 and/or 1:10 dilutions, which were then subjected to new RT-qPCR amplifications. Positive and negative controls were always included in each RT-qPCR experiment, and the reactions only were validated when the quantification curves had the following characteristics: R
2 greater than 0.98, slope between −3.1 and −3.6, and efficiency between 90 and 115%. Only samples with Cq values below 40 were considered positive. The results were expressed as percentage of recovery, according to the quantitation curve.
2.3. Mengovirus Production in Cultured Cells and Infectivity Assays Performed at the End of the Water Sampling Process
The replication of mengovirus for production of viral progeny and the evaluation of the infectivity recovered from the mengovirus solution applied in the water sampling processes, were performed in sub-confluent Vero E6 cultures (Vero C 1008, ATCC CRL-1586) grown in T25 flasks at 37 °C. Vero E6 cultures were routinely sub-cultured in maintenance-medium (CO2 Independent Medium (Gibco, Thermo Fisher Scientific; Waltham, MA, USA) supplemented with 2 mM GlutaMAX (Gibco, Thermo Fisher Scientific; Waltham, MA, USA), and 0.5 mg/mL gentamicin (Gibco, Thermo Fisher Scientific; Waltham, MA, USA)) that was supplemented with 10% inactivated fetal bovine serum (FBS) (Gibco, Thermo Fisher Scientific; Waltham, MA, USA).
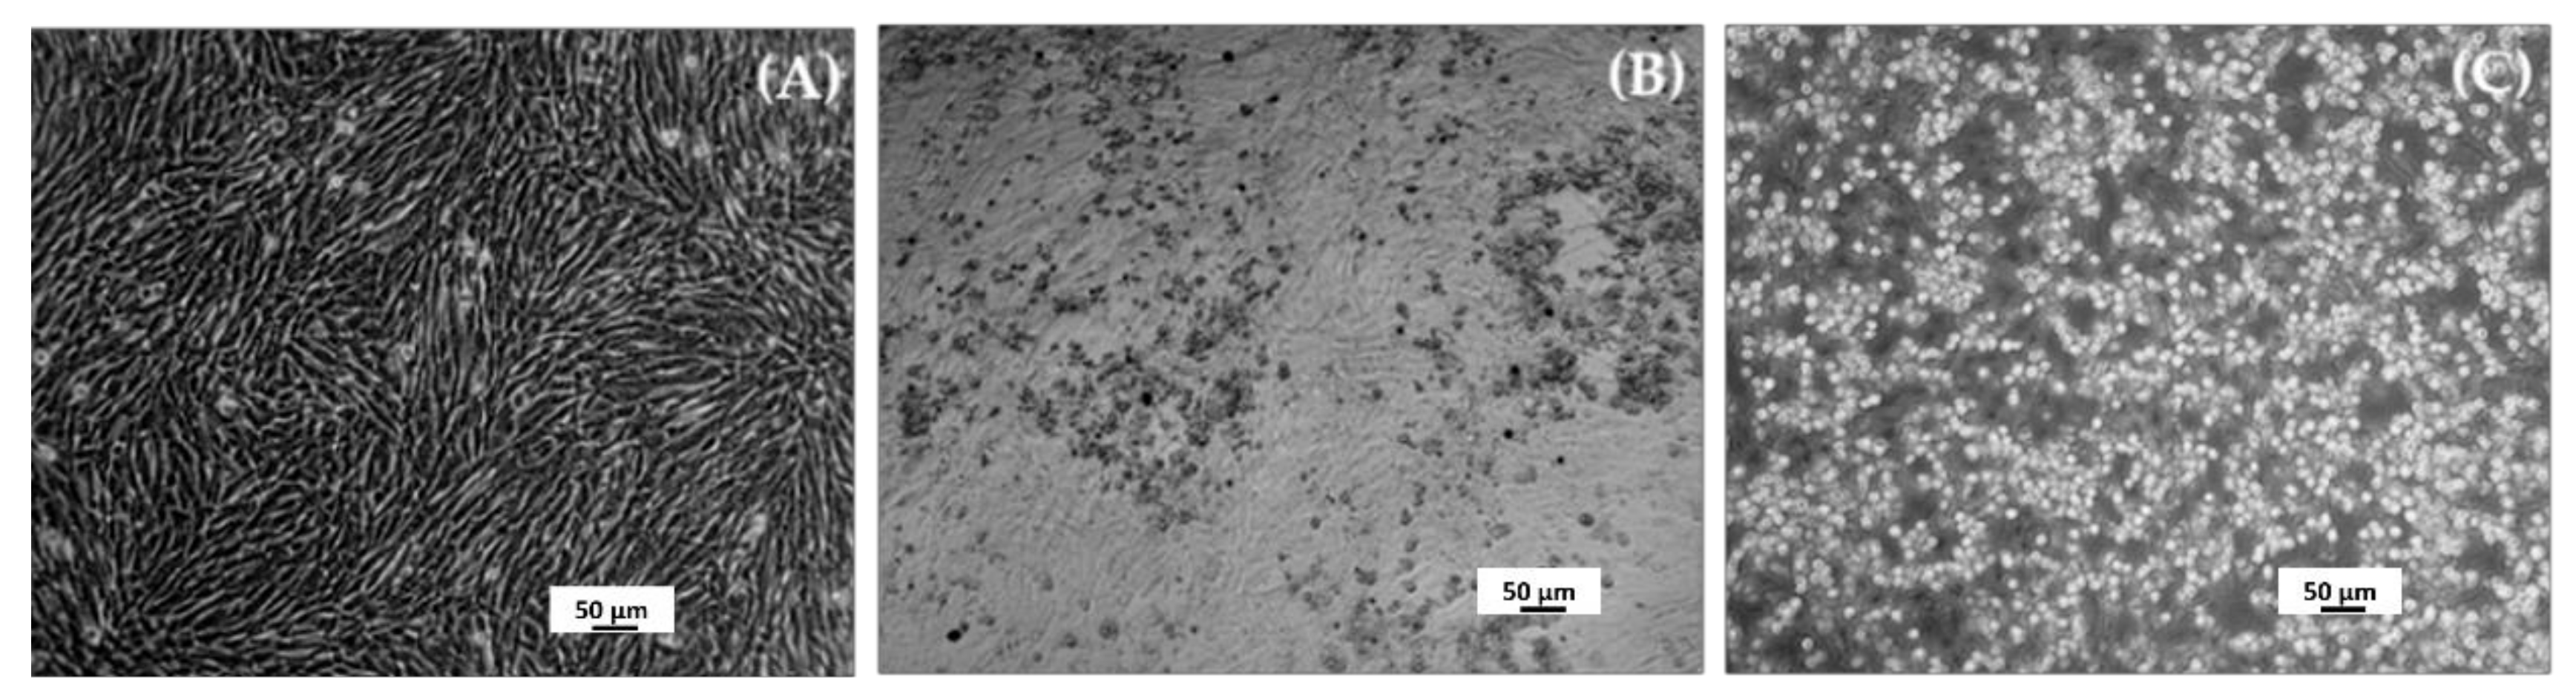
For mengovirus production, a volume of 10 μL (corresponding to 106 genomic copies) previously thawed from a frozen (−20 °C) mengovirus solution (bioMérieux; Marcyl’Etoile, France) was incubated with the cells, after having been diluted in 1 mL of virus-production medium (maintenance medium supplemented with 2% FBS). After an incubation of the virus with the cells for two hours, 3 mL of virus-production medium was added, and the infected culture was maintained at 37 °C and checked daily under a microscope Zeiss Axiovert 200 (Göttingen, Germany), until the appearance of cytopathic effect (CPE); images were recorded with a Zeiss AxioCam HRc digital camera and Axiovision program (München-Hallbergmoos, Germany). Then, the culture medium with detached cells was collected and clarified by low-speed centrifugation (3000× g for 5 min); the supernatant (mainly extracellular virions in suspension) was recovered, aliquoted and frozen at −70 °C.
For the detection of infectious mengovirus recovered at the end of the water sampling process, aliquots (1 mL) of the subsamples reserved for the infectivity assays (see
Section 2.1) were evaluated in cultured cells as described above and in Salvador et al. [
23]. After four serial passages, the putative viral particles recovered in the clarified supernatants (about 4 mL) of the infected cultures (mainly comprising extracellular virions of the 4th progeny) were frozen at −70 °C or immediately processed as described in 2.5, for further RNA extraction.
2.4. Mengovirus Titration
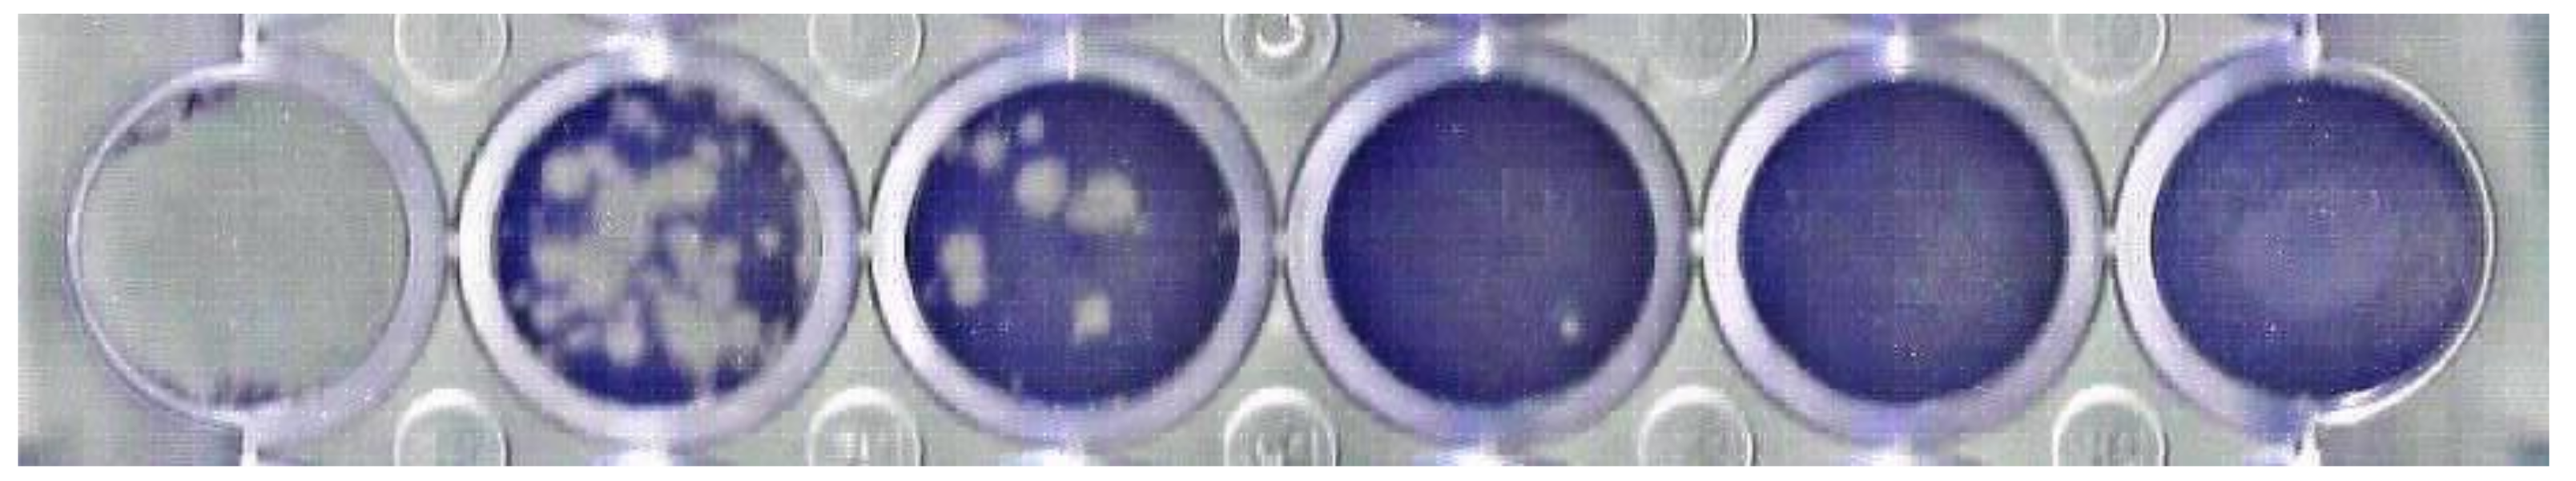
Mengovirus was titrated by inoculating serial 10-fold dilutions (made in virus production medium) of the virus suspension, into sub confluent Vero E6 cultures cultivated in 24-well plates (P24). After 2 h of incubation with the viral inoculum (100 μL), 500 μL of virus-titration medium was added to each well, and the plates were incubated (avoiding any agitation) at 37 °C, for 36 h. The virus-titration medium is the virus-production medium supplemented with 2% Sephadex G50 fine (Merck KgaA, Darmstadt, Germany), sterilized before being added to the medium. The titration was stopped (targeting virus inactivation and fixation of viable cells) by addition of 500 μL of 10% (v/v) formaldehyde, for 30 min. The mixture culture medium/formaldehyde was properly discarded, the fixed cells were water washed and subsequently stained for 15 min with 0.1% (w/v) crystal violet in water; after discharge of the dye and washing with water, the plates were air dried. Viral plaques were counted, and the virus titers, expressed in PFU/mL (plaque forming units per mL), were calculated according to the following: PFU/mL = Average number of plaques/D × V (D = dilution where the viral plaques were counted; V = volume of the inoculum (0.1 mL in the present situation)).
2.5. Extraction of Viral RNA from the Supernatants of Infected Cultures
Aliquots of 4 mL from clarified suspensions of mengovirus as well as from the putative viruses produced from infectious mengovirus eventually recovered in the water sampling process (
Section 2.3) were concentrated by centrifugation for 6 h at 17,000×
g and 4 °C to pellet the viral particles. The pellets were suspended in 140 μL of PBS (Sigma-Aldrich, Merck; Darmstadt, Germany) and subjected to RNA extraction and to RT-qPCR evaluation, as described above in
Section 2.2.
2.6. Statistical Analysis
Microsoft Excel 2017 (Microsoft Inc., Redmond, WS, USA) and IBM SPSS Statistics Version 27 (SPSS Inc., Chicago, IL, USA) were used to calculate the means, standard deviations, and Student’s t-test. Student’s t-test was applied to compare differences in the recovery of mengovirus, between the water matrices; differences were significant for p-values less than 0.05.
4. Discussion
In a complex and multistep procedure, it is important to understand whether and how deeply the procedures involved in each step influence the recovery rate. Thus, our analyses considered the addition of mengovirus at two steps of the sample processing. In a pilot sampling in 2018, the virus was added after the primary concentration, more precisely in the beef extract added just prior to the flocculation procedure. In the 2019 sampling campaign, it was considered more appropriate and informative to add mengovirus at a point involving the whole sample processing (i.e., at the filtration/primary concentration step) [
23]. Comparing the two approaches tested, it was found that the procedure applied in the 2018 pilot sampling allowed higher recoveries (greater than 18%) and produced identical results for the two water matrices, thus signifying that the greatest losses reflected in the recovery of virus’ nucleic acids occur before the secondary concentration step, i.e., during the filtration/primary concentration step, and mainly in the sampling of surface water, as discussed below for the 2019 sampling campaign.
Recovery rates of 1% or more are recommended in ISO 15216-1: 2017 [
13] for bottled water and for much smaller volumes (about 5 L) than the volumes sampled in the present study. Although there are no guidelines on the acceptable recovery values for surface water, the recovery rates registered for both water matrices in the 2018 pilot sampling may be considered acceptable.
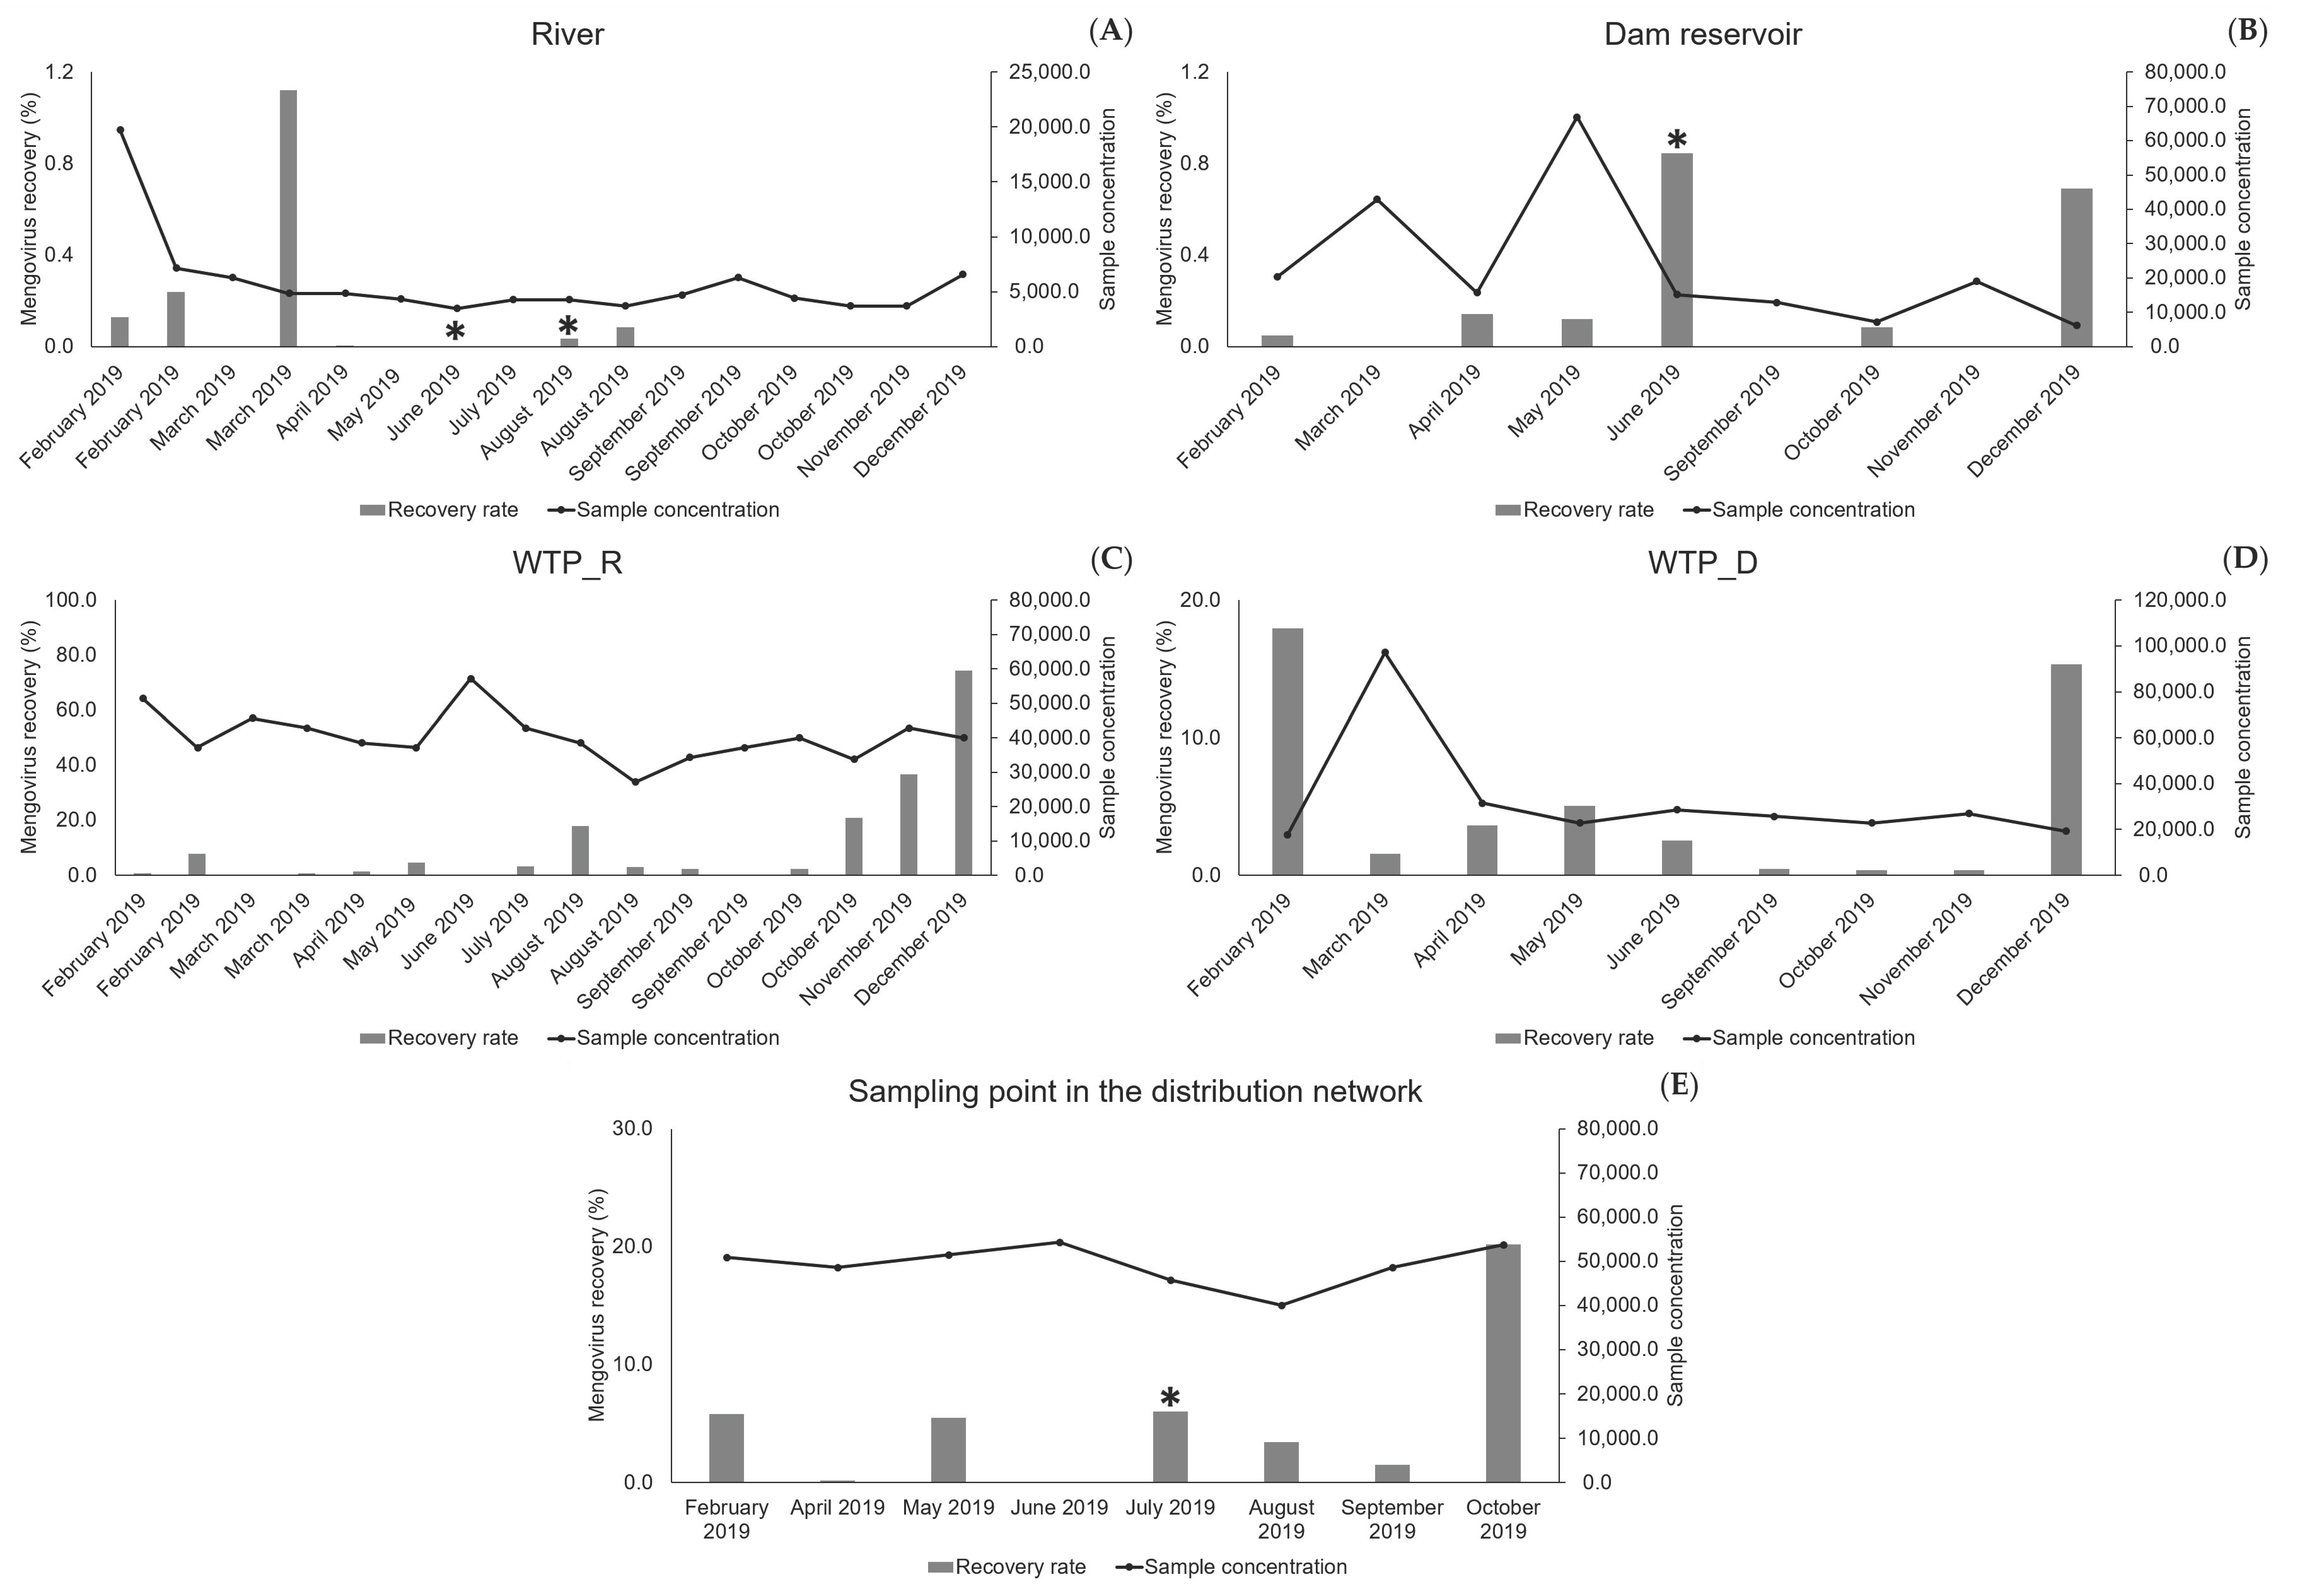
In the 2019 sampling campaign mengovirus was not detected by RT-qPCR in 14 samples of surface water and, when detected and quantified (11), its recovery rate was usually under 1%. These results can be explained by the large number of particles/contaminants found in the surface water of the two natural sources, which may interfere with the virus recovery by avoiding its binding to the filter. Moreover, the filtration/concentration of surface water was performed until the clogging of the filter membrane. This may have affected the filter properties, with implications for the adsorption of the control virus, whose addition only occurred in the final period of the filtration procedure when the contaminants were already highly concentrated in the filter, even in less contaminated water samples (
Figure 1). This may explain why the “cleaner” water (allowing larger sampled volumes until filter clogging) did not evidence higher recovery rates of mengovirus, while the three highest values (>0.7, <1.12) were found in less concentrated samples (<20,000-fold): two samples from the dam reservoir and one from the river (
Figure 1). It is plausible that these values resulted from the existence of still some binding capacity of the filters, when mengovirus was added for filtration.
Concerning the samples from drinking water, mengovirus was detected in the large majority (32 out of 34), either collected at the outlet of the two WTPs or collected at the sampling point in the distribution network. With an average recovery rate of 7.84%, and most samples (23 in 34) presenting recovery rates greater than 1%, the implemented method and particularly the whole sampling process, provided acceptable recoveries, in accordance with ISO 15216-1: 2017 [
13]. The 14 results showing recoveries under 1% corresponded to higher volumes of filtered water (≥600 L, i.e., samples concentrated more than 17,000-fold) (
Figure 1), which may have affected the electropositive characteristics of the filter, eventually reducing its binding capacity in the final period of the filtration step (time of mengovirus addition). Although further studies will be necessary to test this hypothesis, taken together, these results allow proposing a limitation in the volumes when sampling water, particularly for natural surface water.
A few comparisons may be made with studies where mengovirus was added before/during the filtration step: Ishii et al. [
27], based on samples of one liter of natural water, reported average recovery rates (9.4%) higher than in the present study (under 1%); however, ranging from more extreme values (0.04% to 69.5%); in Petterson et al. [
28], the average recovery rate in drinking water collected at the outlet of a WTP was 1.2%, lower than in the present study (7.84%); in Teixeira et al. [
15], the recovery rates reported for a diversity of water matrices, drinking water included, were less than 10%. These three studies involved sampling volumes far from those contemplated in our surveys and support the suggestion of using narrow sample volumes.
The significant differences between the recovery rates in the two water matrices, found in the present study (confirmed by the application of the Student’s
t-test), may be due to their very diverse characteristics. The surface water, having not undergone any treatment, contains a higher number of suspended particles and other agents that will be concentrated in the filter, while the drinking water was previously treated by processes that allowed the removal of suspended particles [
10]. Consequently, the conditions for mengovirus adhesion to the filter will be different in the two situations, less efficient when surface water is collected. Hennechart-Collette et al. [
24] also reported that the recovery rate of mengovirus is strongly influenced by the matrix under analysis (food or water).
In addition, RNA degradation of the process control virus and/or inhibition of the RT-qPCR reaction, might also influence the recovery rates evaluated through this molecular approach; these situations are strongly influenced by the contaminants co-concentrated with the sampled water along the sampling procedures and natural surface waters are most frequently associated with such contaminants ([
9,
29]. Our results strongly support this statement because: (i) RT-qPCR inhibition was associated with many samples (12 from a total of 59), most of them from surface water (11 from 25); (ii) absence of mengovirus detection was closely associated with RT-qPCR inhibition, since this relationship only was not verified for four samples: three from surface water and one from drinking water. Moreover, it is worth noting that our results concerning the detection of mengovirus infectivity in the sampled water, although only reported in four samples, allowed us to find infectious mengovirus (able to replicate in Vero E6 cultures) in all of them, even in one sample where viral RNA could not be detected; this result is in accordance with the previous findings and suggests that the monitoring of viral infectivity has great potential that should be taken into account.
Although a process control virus is highly recommended for the validation and interpretation of water monitoring processes [
10,
18,
30], the low RNA recovery rates obtained for surface water in the present study recommend considering the addition of mengovirus only at the stages following the primary concentration step, where it will still be very useful, namely as control of RNA extraction (as initially proposed in the PCT/EP2007/055407 patent [
17]). Furthermore, knowing that mengovirus induces cytopathic effects on Vero E6 cells (this study) and HeLa cells [
24,
28], its addition at the beginning of the process can make it difficult to interpret assays aiming the evaluation of the infectivity potential (for other virus) of the samples under survey, since the appearance of CPE may be exclusively due to the presence of mengovirus.
On the other end, the achievement of accurate replication and titration of mengovirus in Vero E6 cultures, which recently allowed researchers to show the recovery of infectious hepatitis E virus (HEV) from both water matrices targeted in the present study, was one of the main points of relevance [
23]. No less relevant was the mengovirus recovery in an infectious state from the four samples so far evaluated for that purpose, associated with the fact that those samples were already found to be positive for infectious HEV [
23], which was confirmed again (except for the drinking water sample) in the present study (Cq values below 36) (data not shown).
Taken together, these results allow anticipating the reliability of infectivity assays in future virus surveys where mengovirus and Vero E6 cultures may work together in the control of the processes to be implemented, particularly when the targets are enteric viruses (e.g., HEV, Norovirus) and other viruses able to replicate in this cell line (e.g., SARS-CoV2).


