
Mobility of nZVI in a Reconstructed Porous Media Monitored by an Image Analysis Procedure

 ,
,  ,
,  ,
, 

Abstract
:1. Introduction
- -
- To define distribution curves in time and the “concentration” evolution;
- -
- To assess the nZVI mobility, studying velocities and barycenter paths in 2D;
- -
- To realize a statistical description of the characteristics of the nZVI plume in time;
- -
- To verify the suitability of the theoretical basis of the current methodologies for the simulation of nZVI application in remediation procedures.
2. Experimental Material and Methods
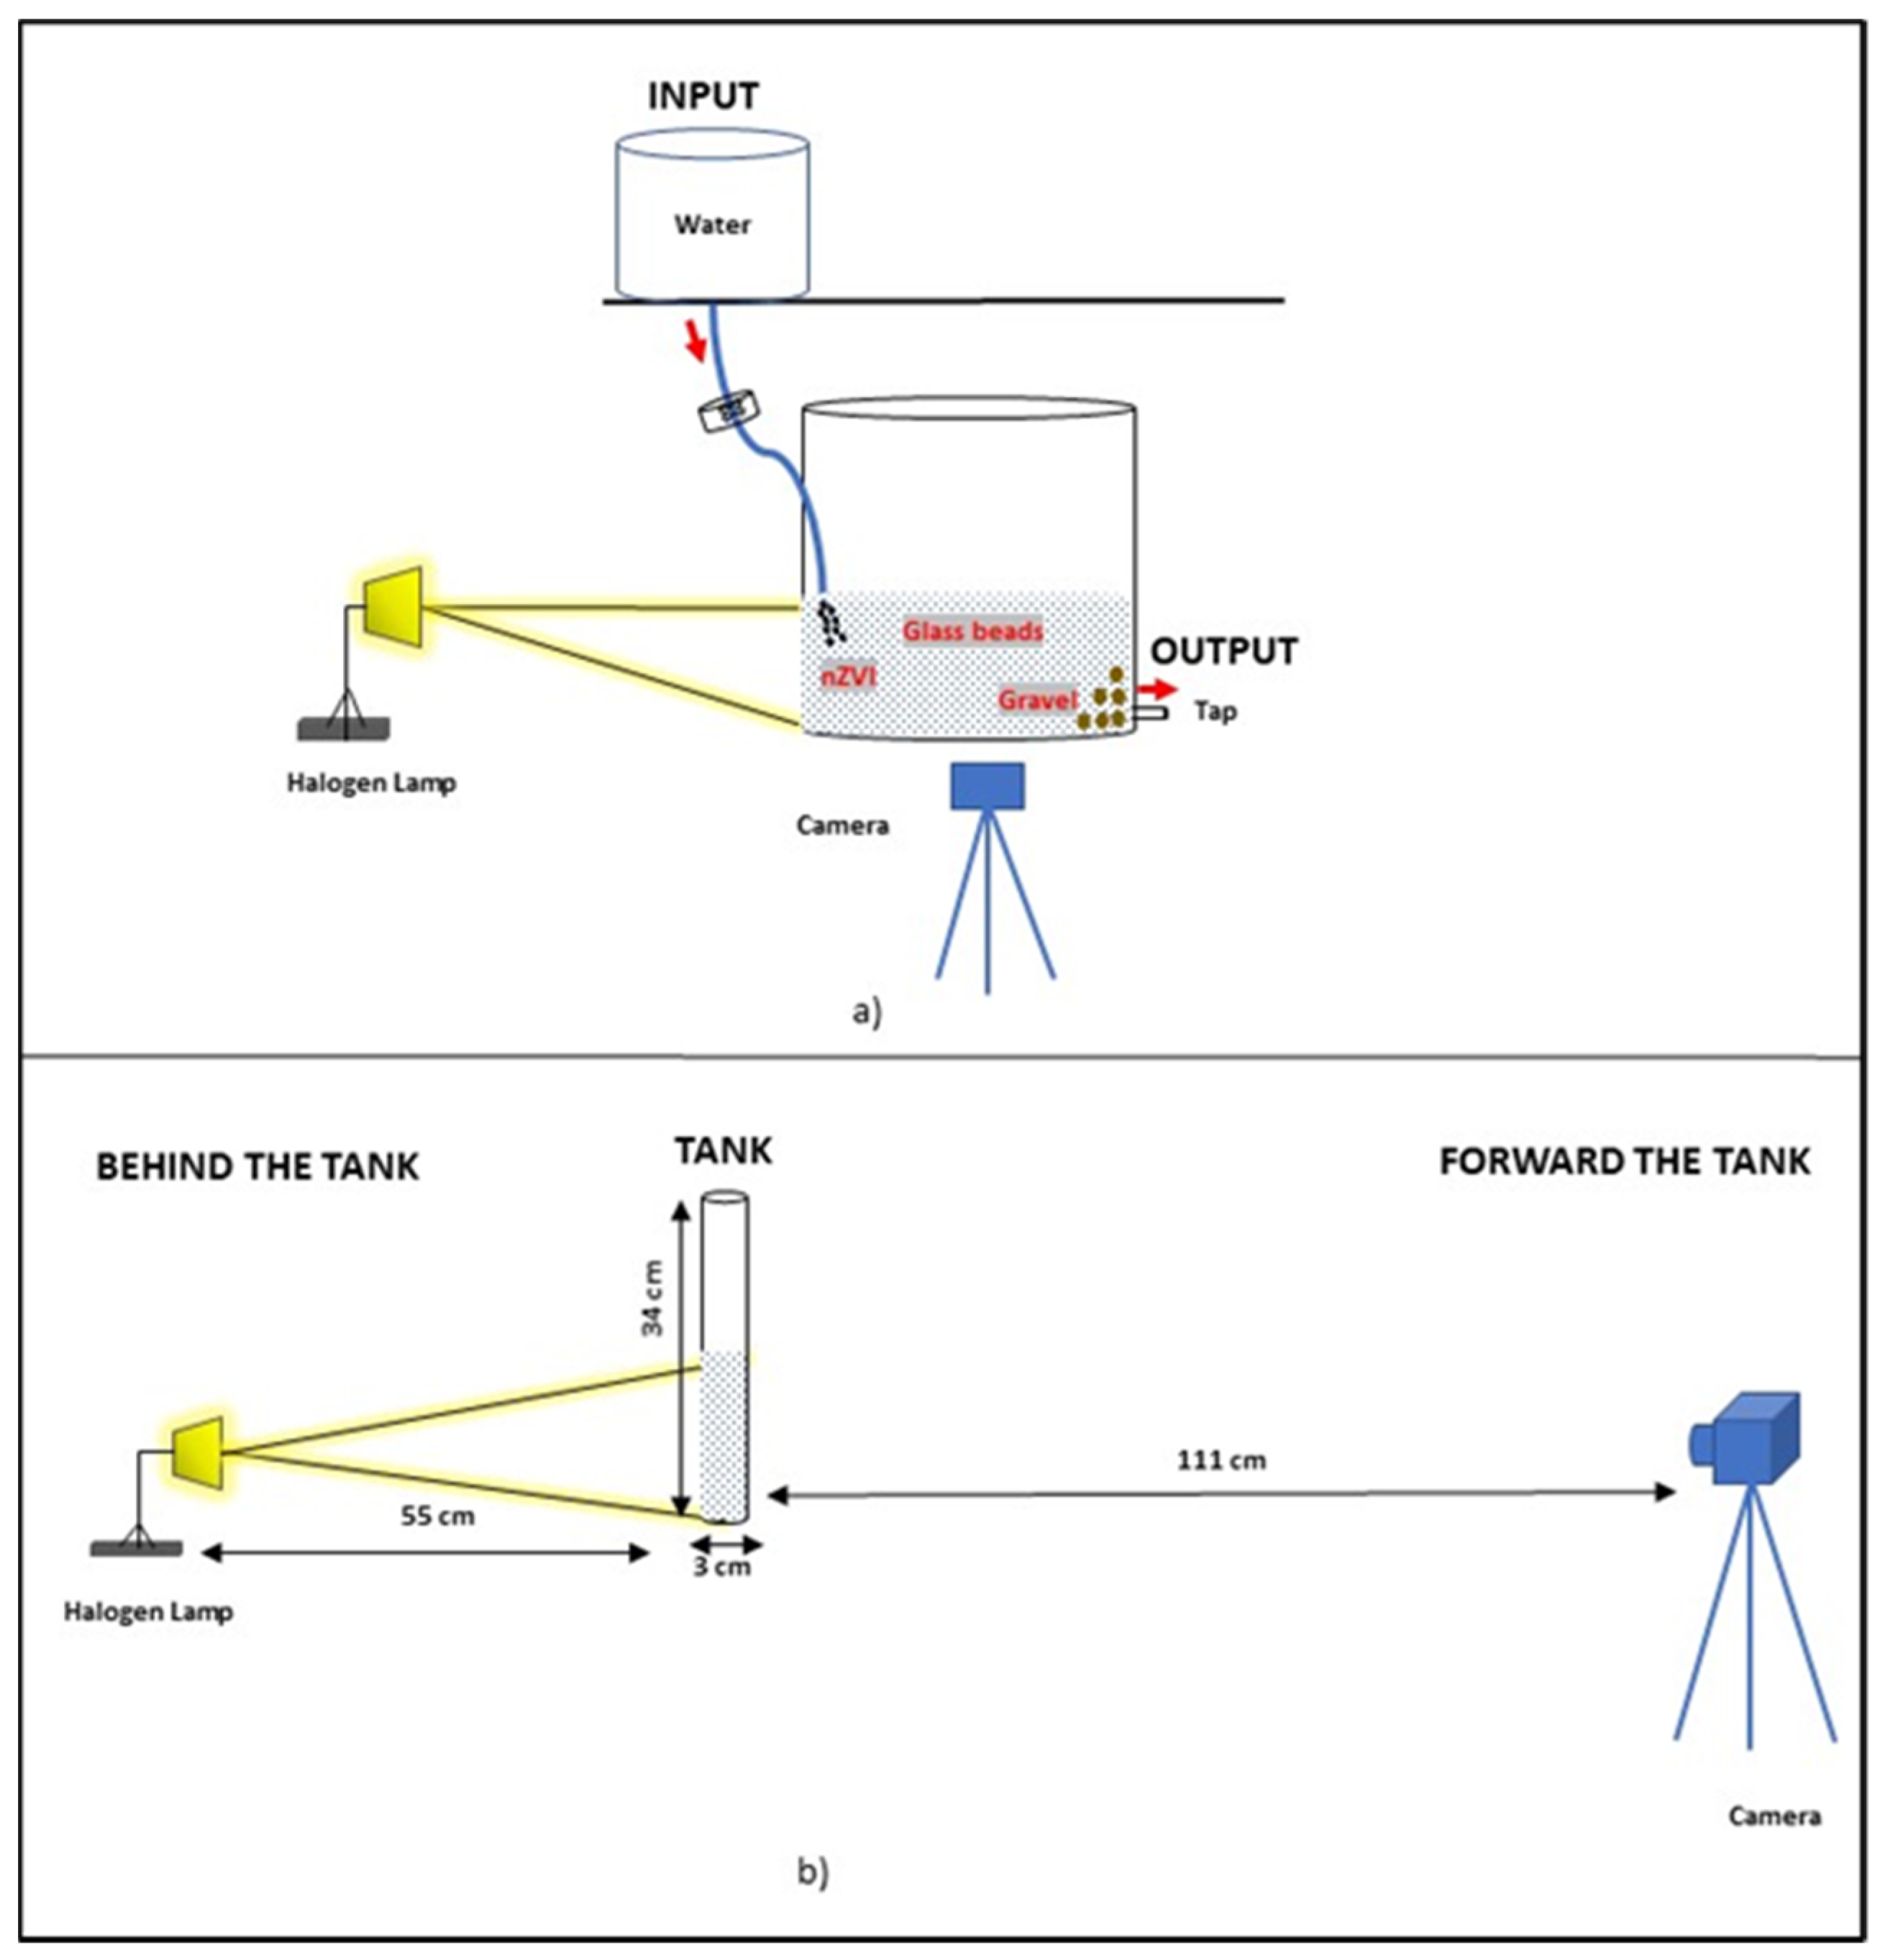
2.1. Experimental Setup
2.2. Image Analysis Procedure
2.2.1. nZVI Plume Distribution
- (a)
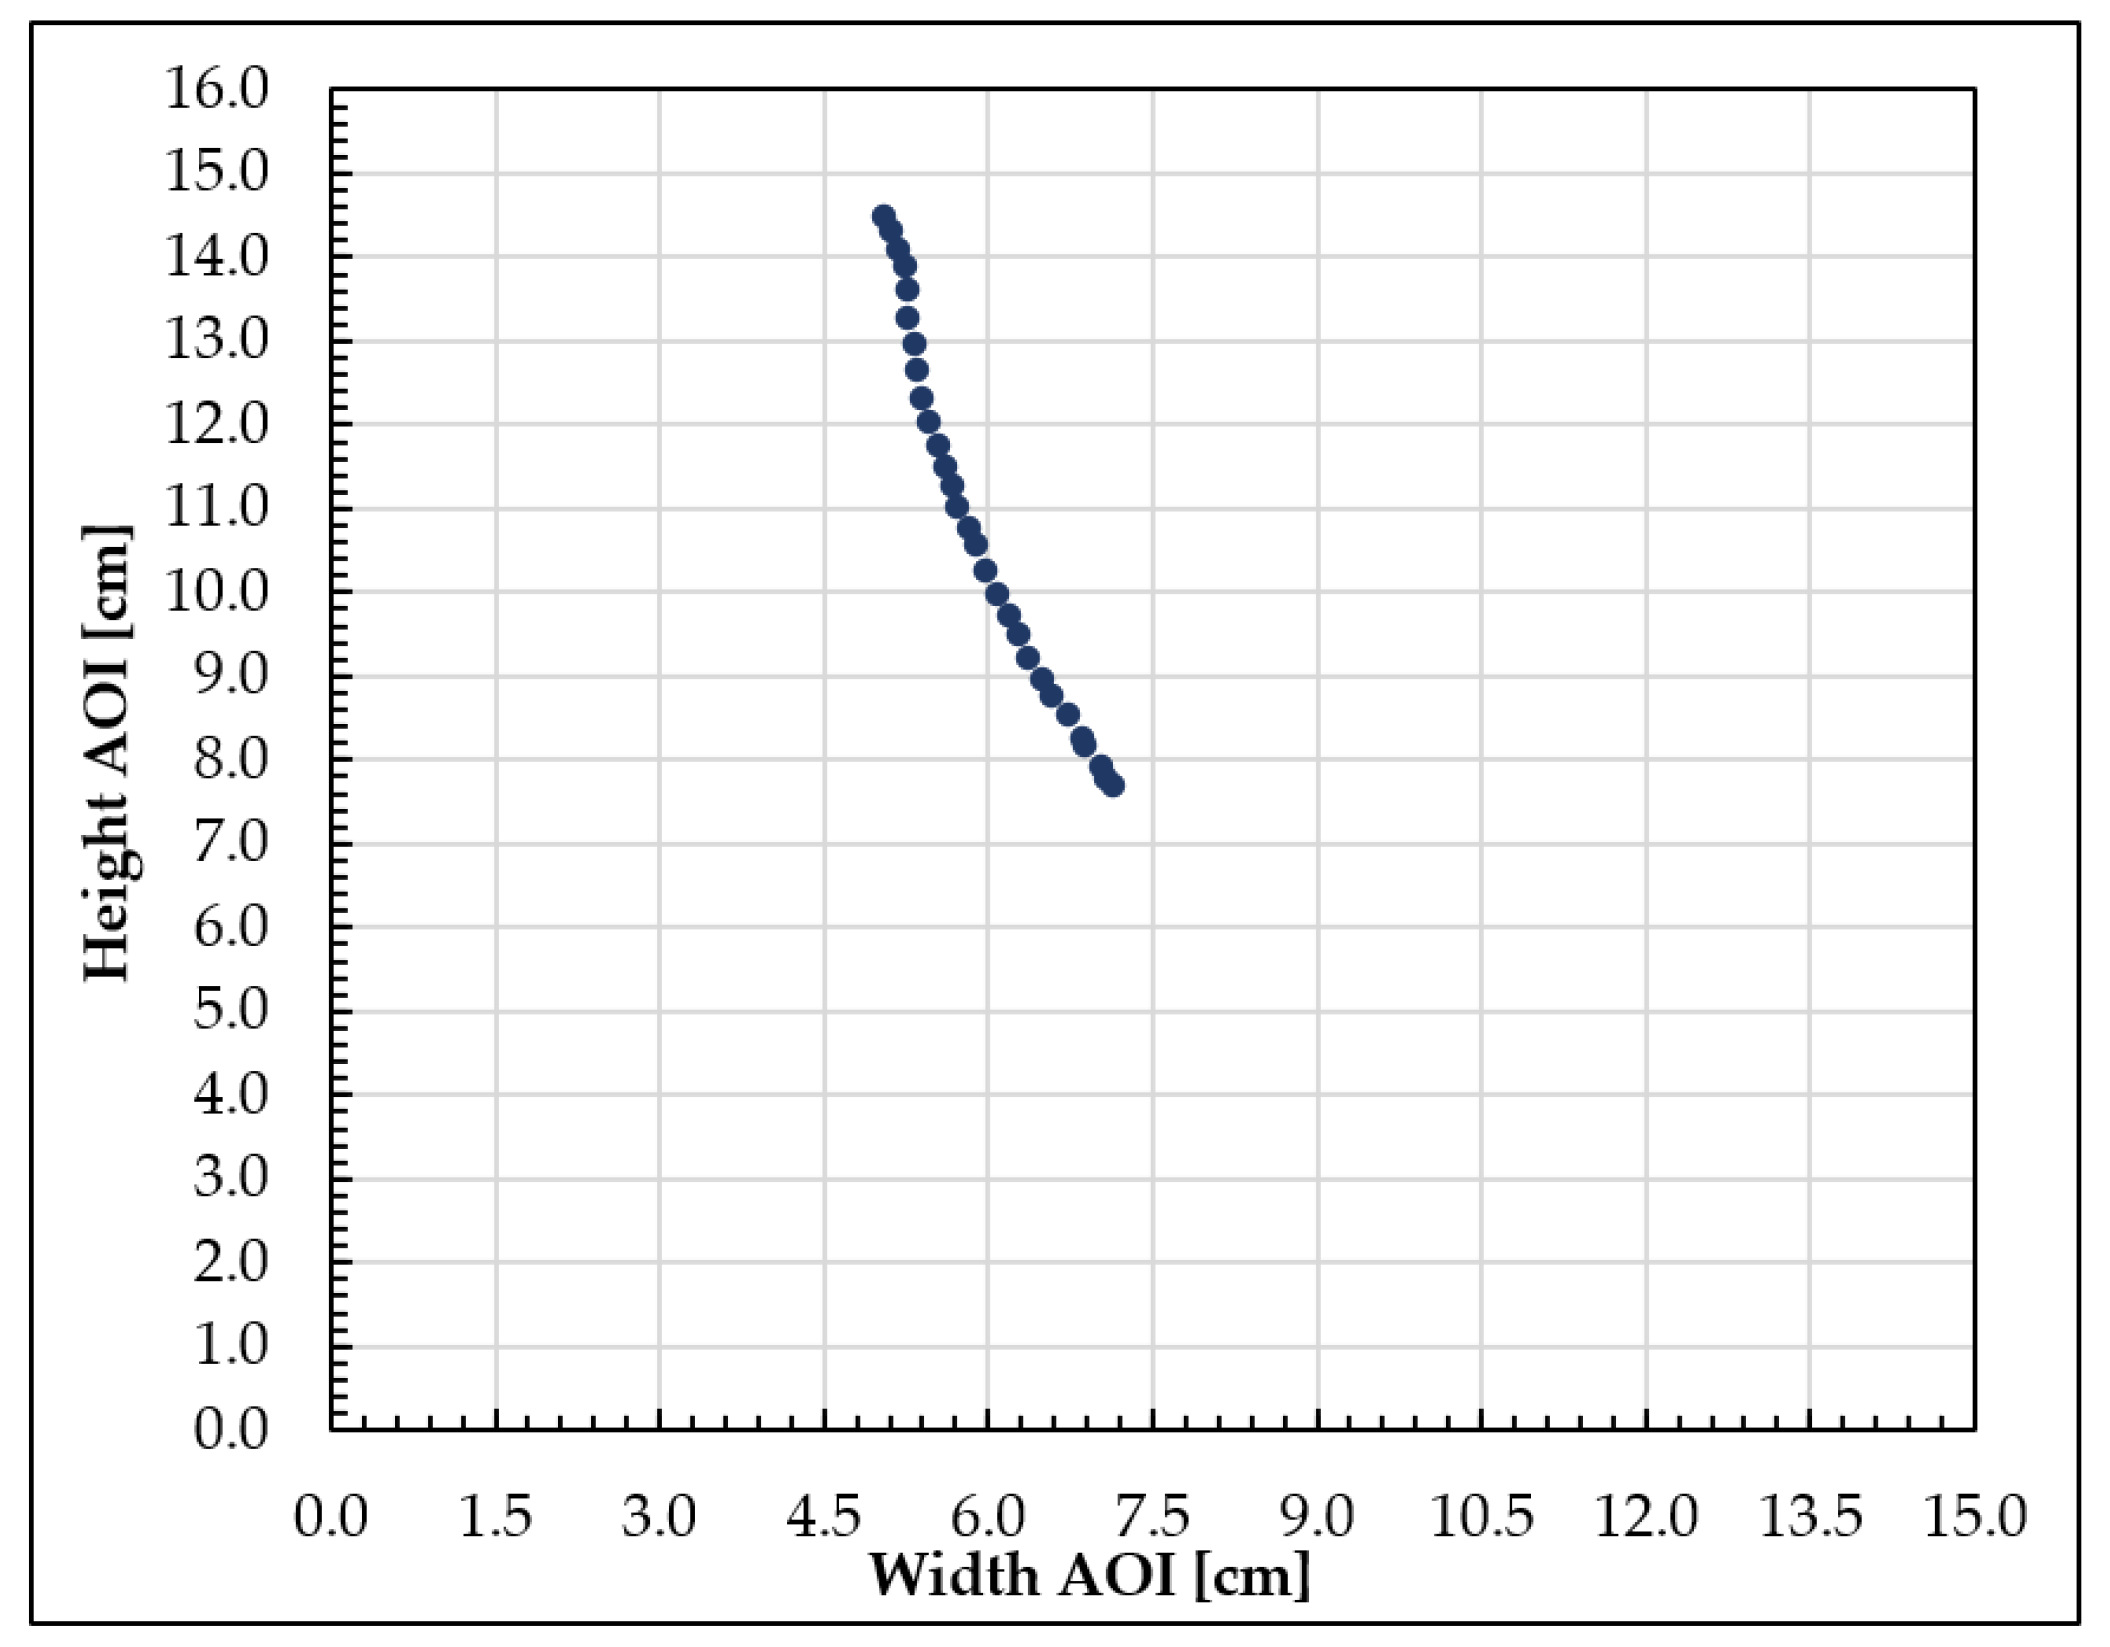
- Once the images were acquired, an area of interest (AOI) was defined on the single image. The area was the same for each image acquired during the experiment in terms of dimensions and origin. The chosen AOI physical size was defined equal to 15 × 16 cm.
- (b)
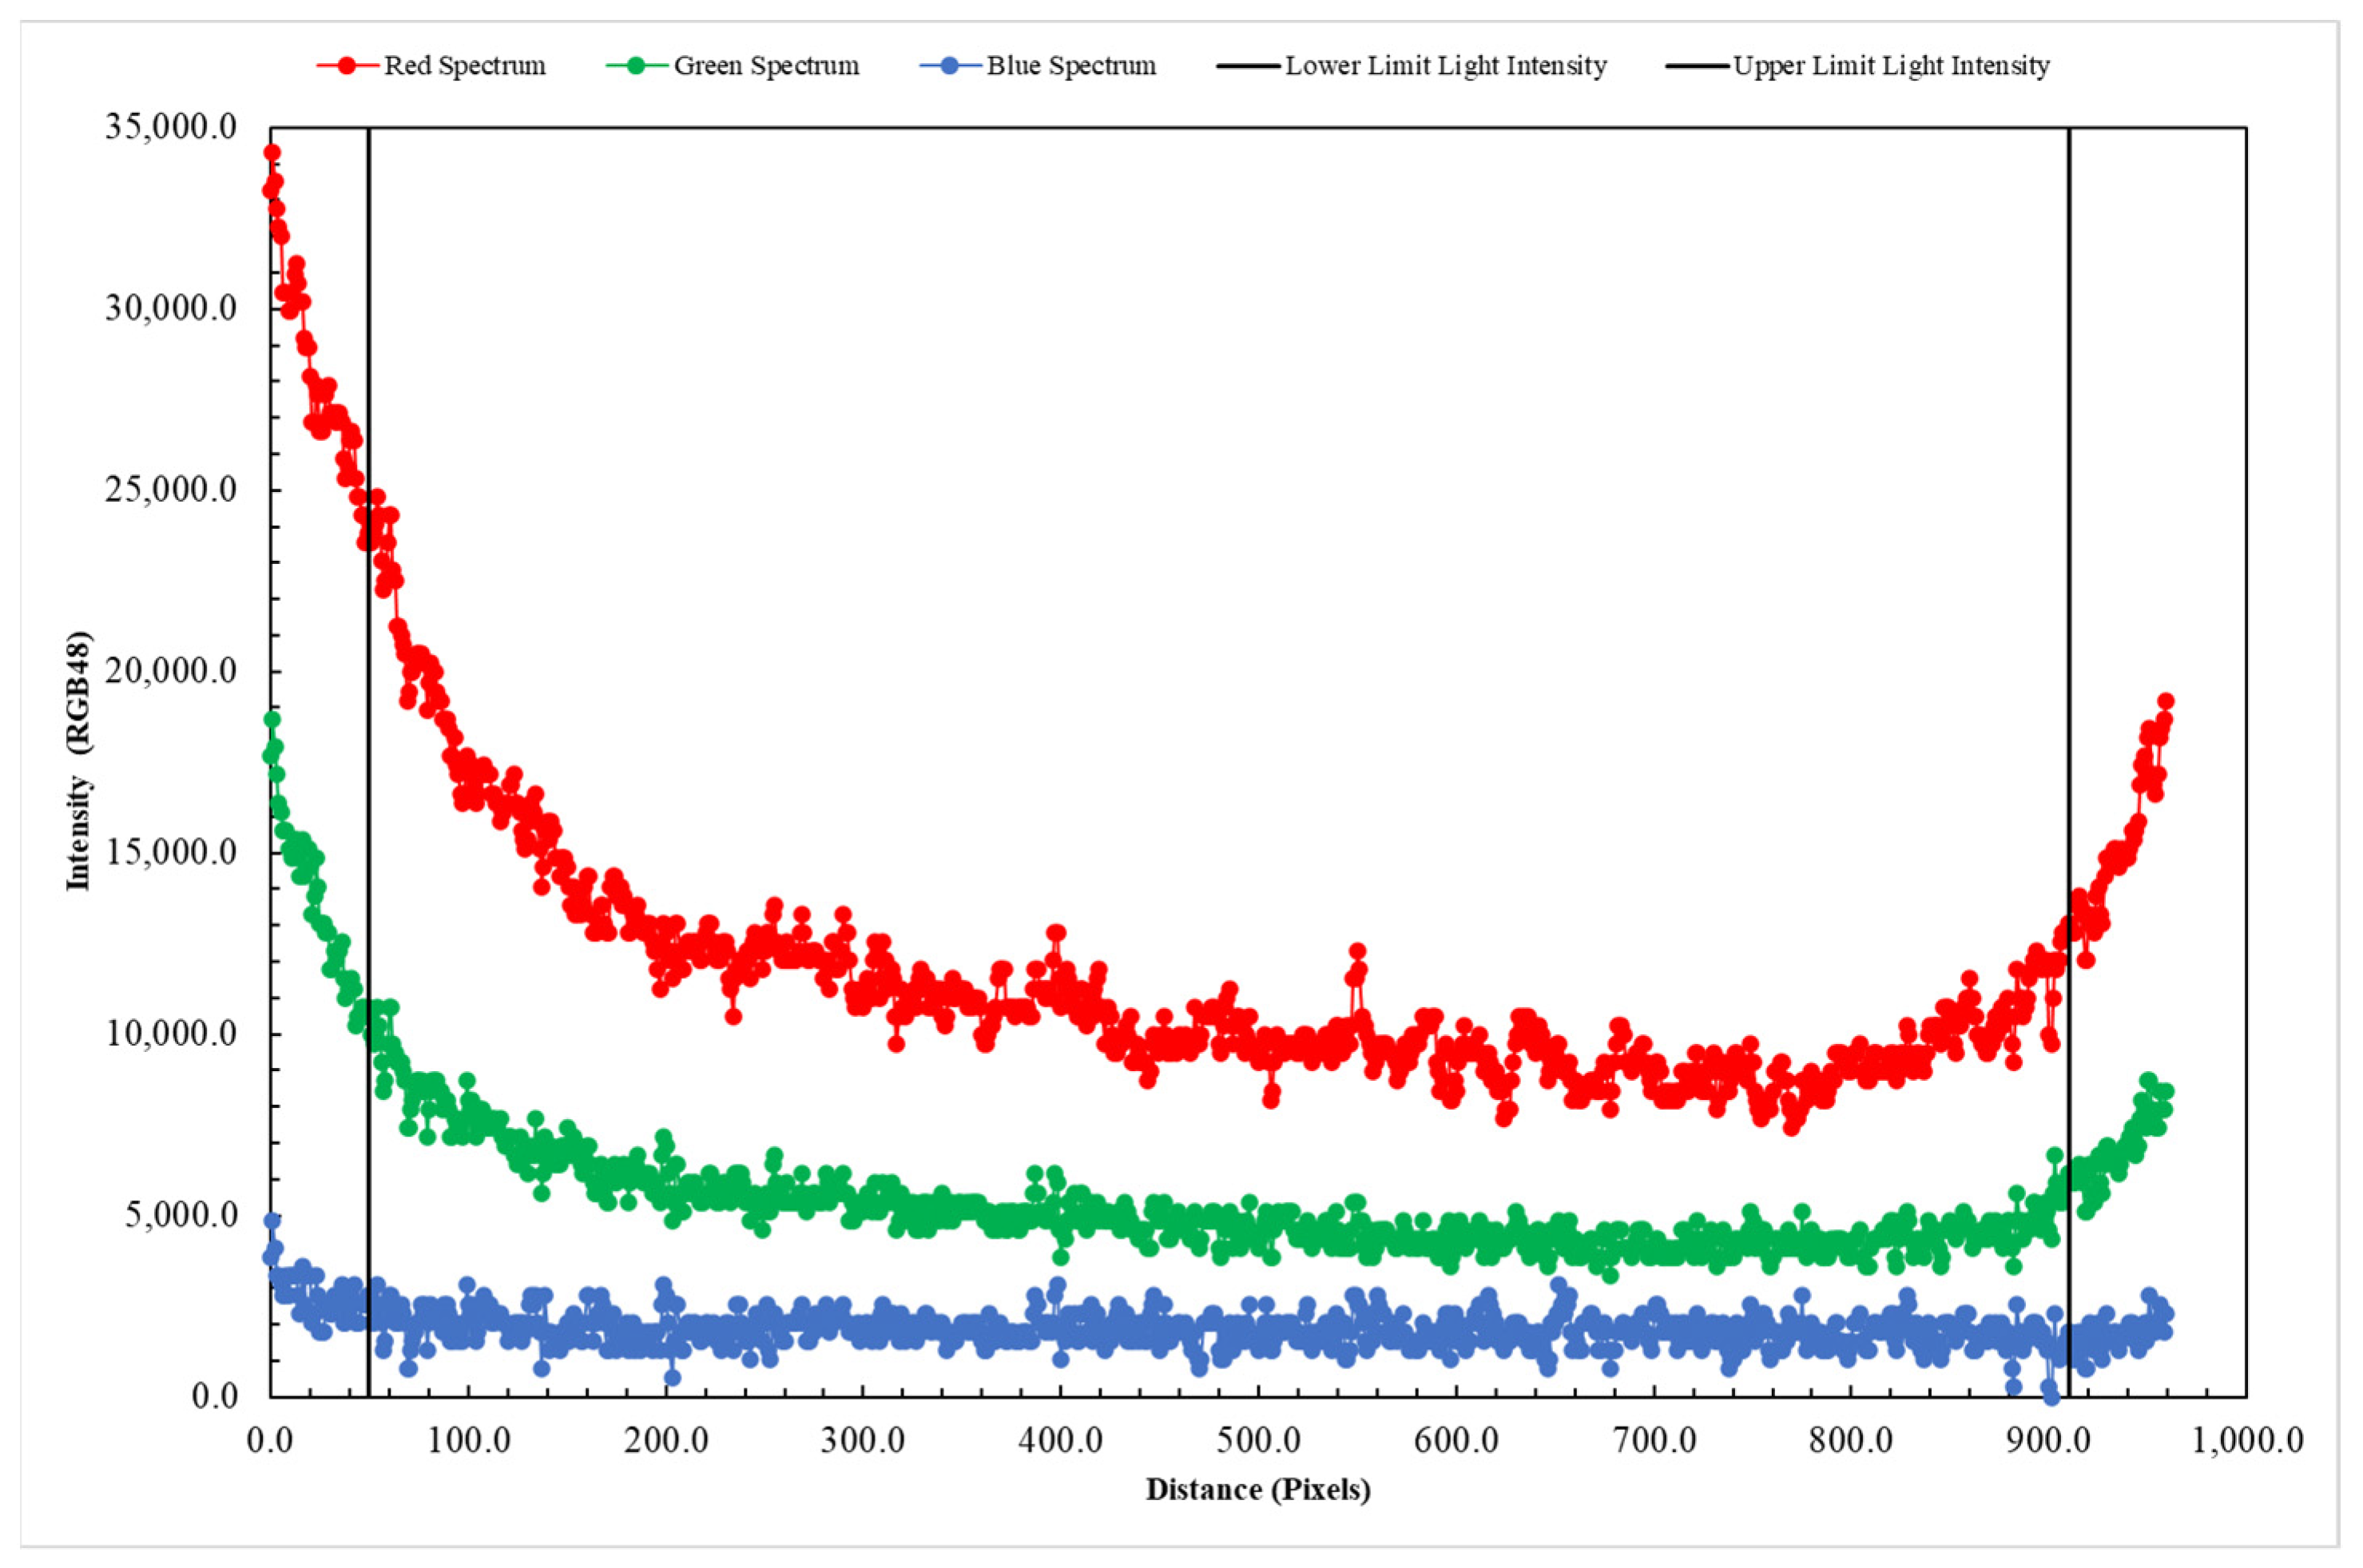
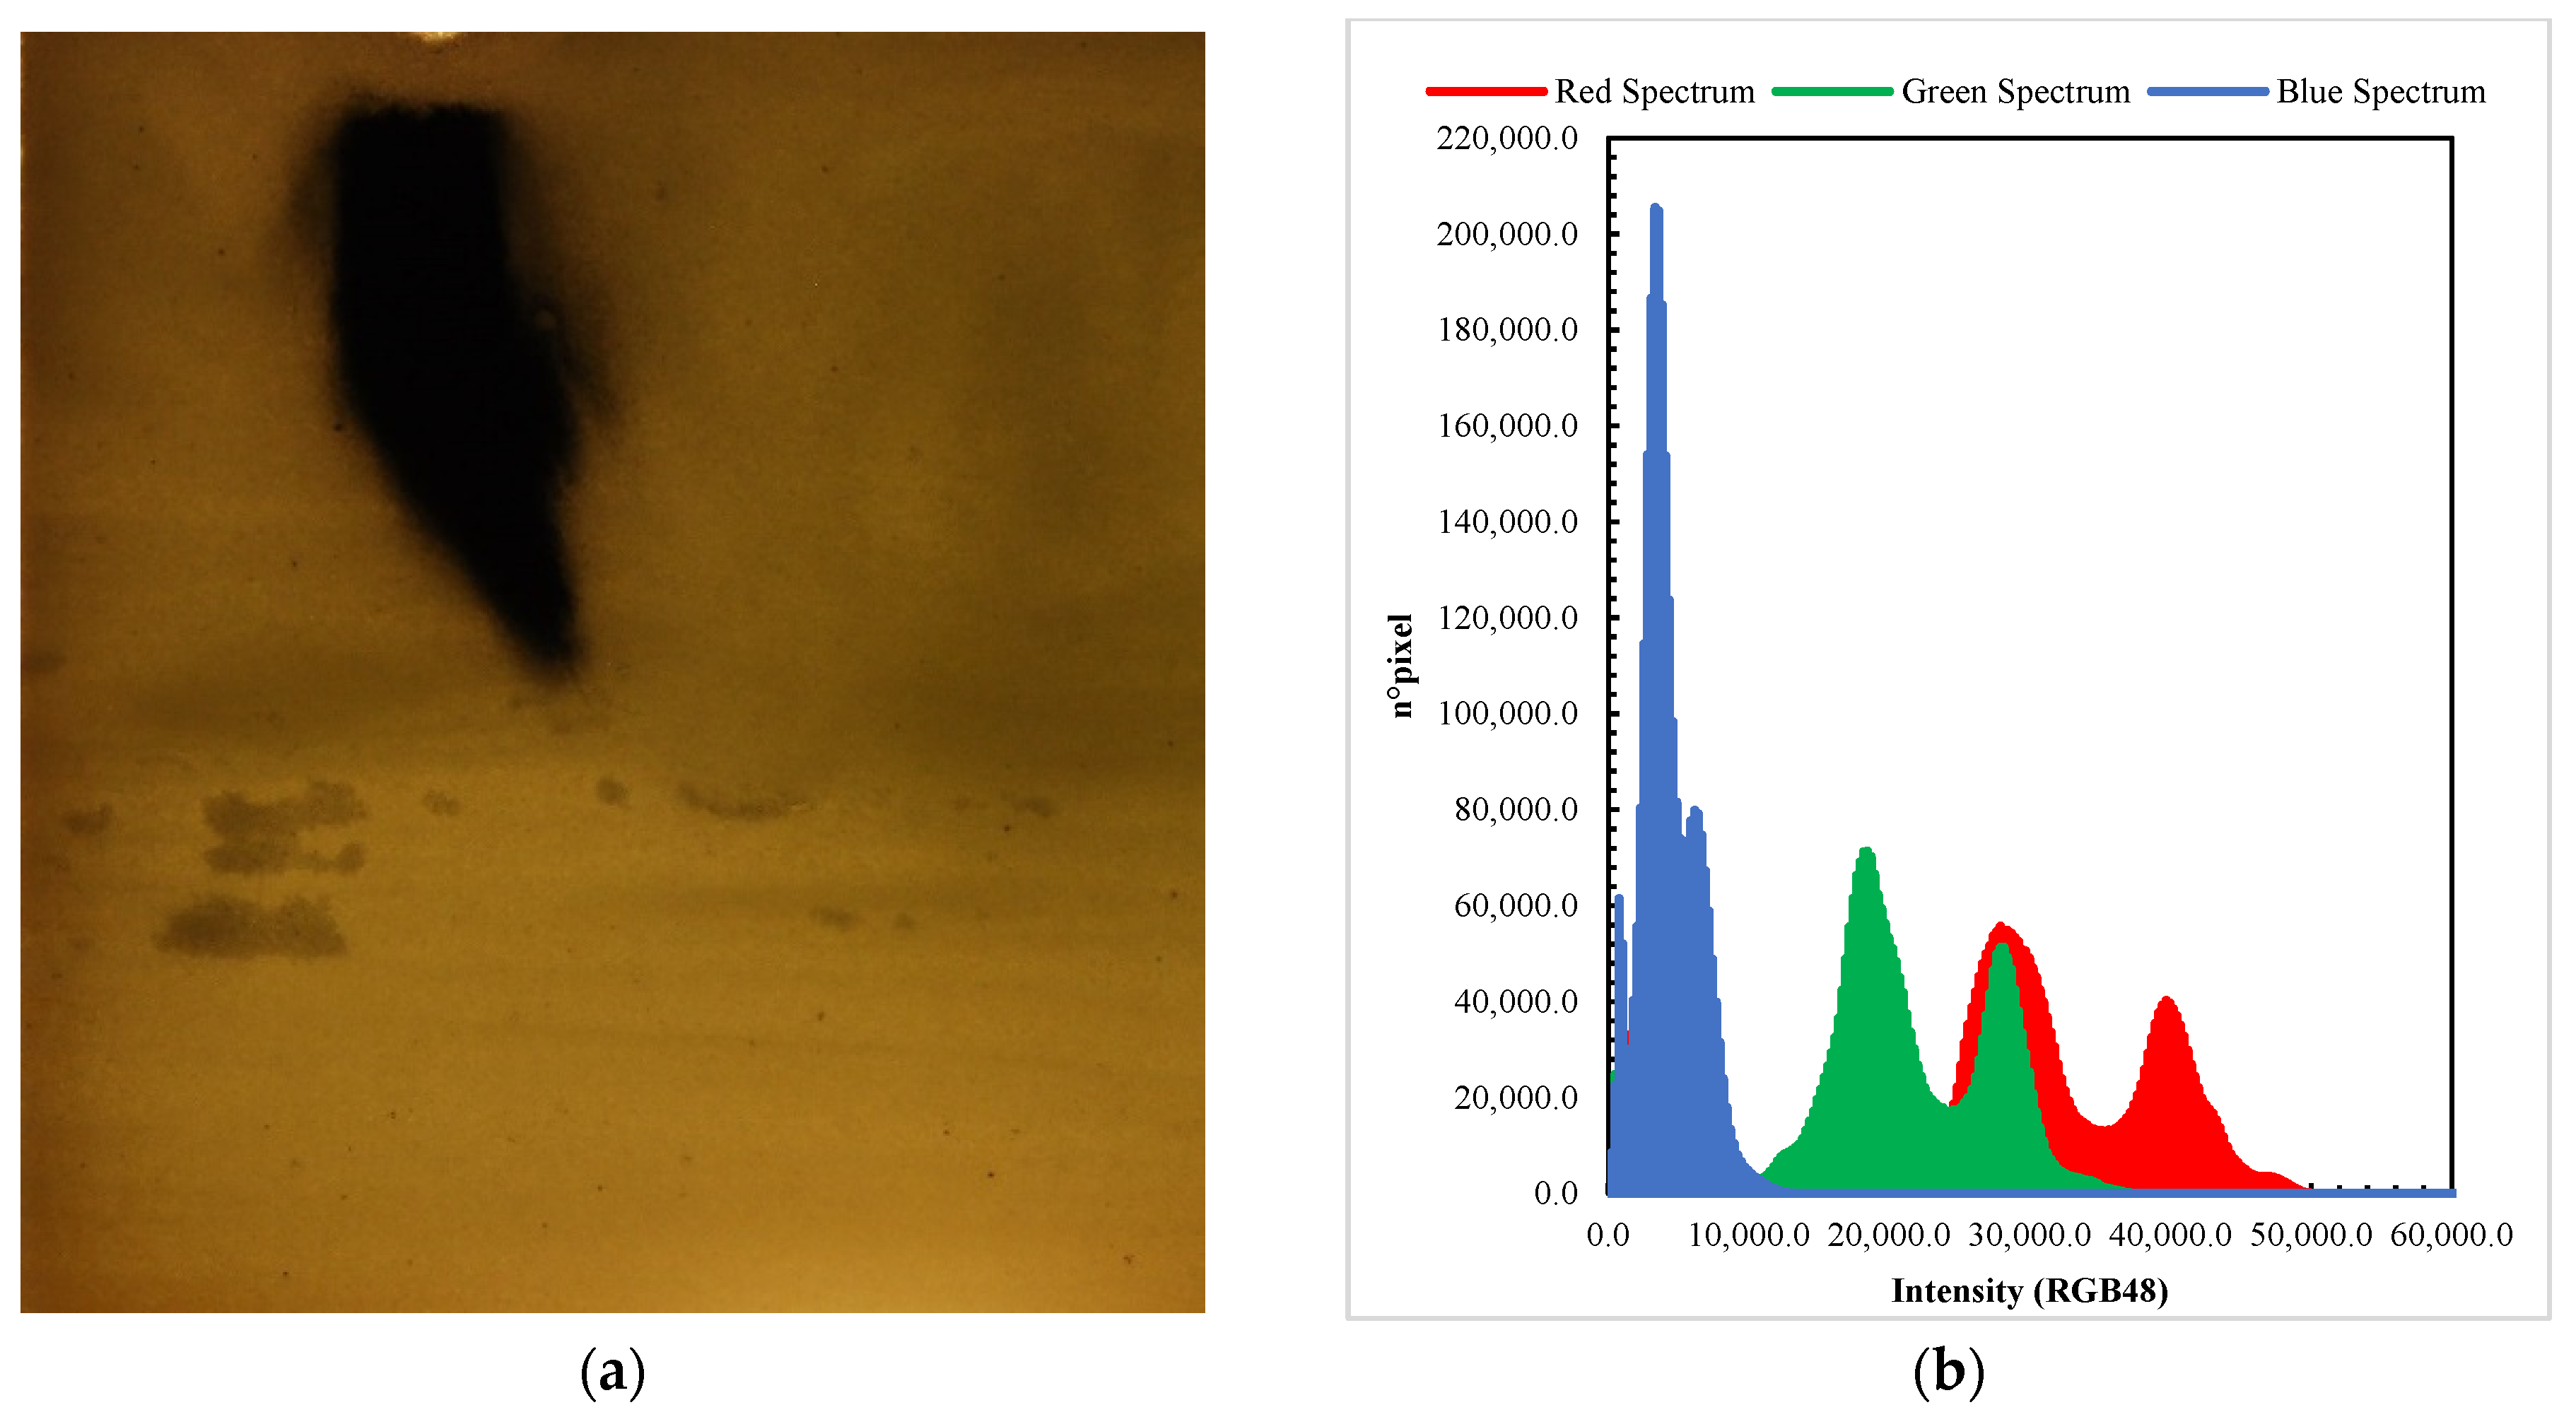
- The AOI was converted in RGB48 format. The converted AOI was processed to enhance the contrast between the background porous media and the darker part (low-light transmissivity region) that represent the nZVI plume. Figure 3 shows an image converted into RGB48 format (Figure 3a) and the pixel frequency graph in three channels: red (R), green (G) and blue (B) (Figure 3b). The graph in Figure 3b shows the results of the pixel frequency reconstruction in the channels. Both green and red channels could be used for the analysis. This is because they allow for distinguishing clearly the dark and light components of the images.Figure 3b shows that the red spectrum is the one evidencing the largest difference between the dark (absence of light transmission) and the light (high light transmission) due the presence of the ensemble of particles. Therefore, the images were processed in the red spectrum.
- (c)
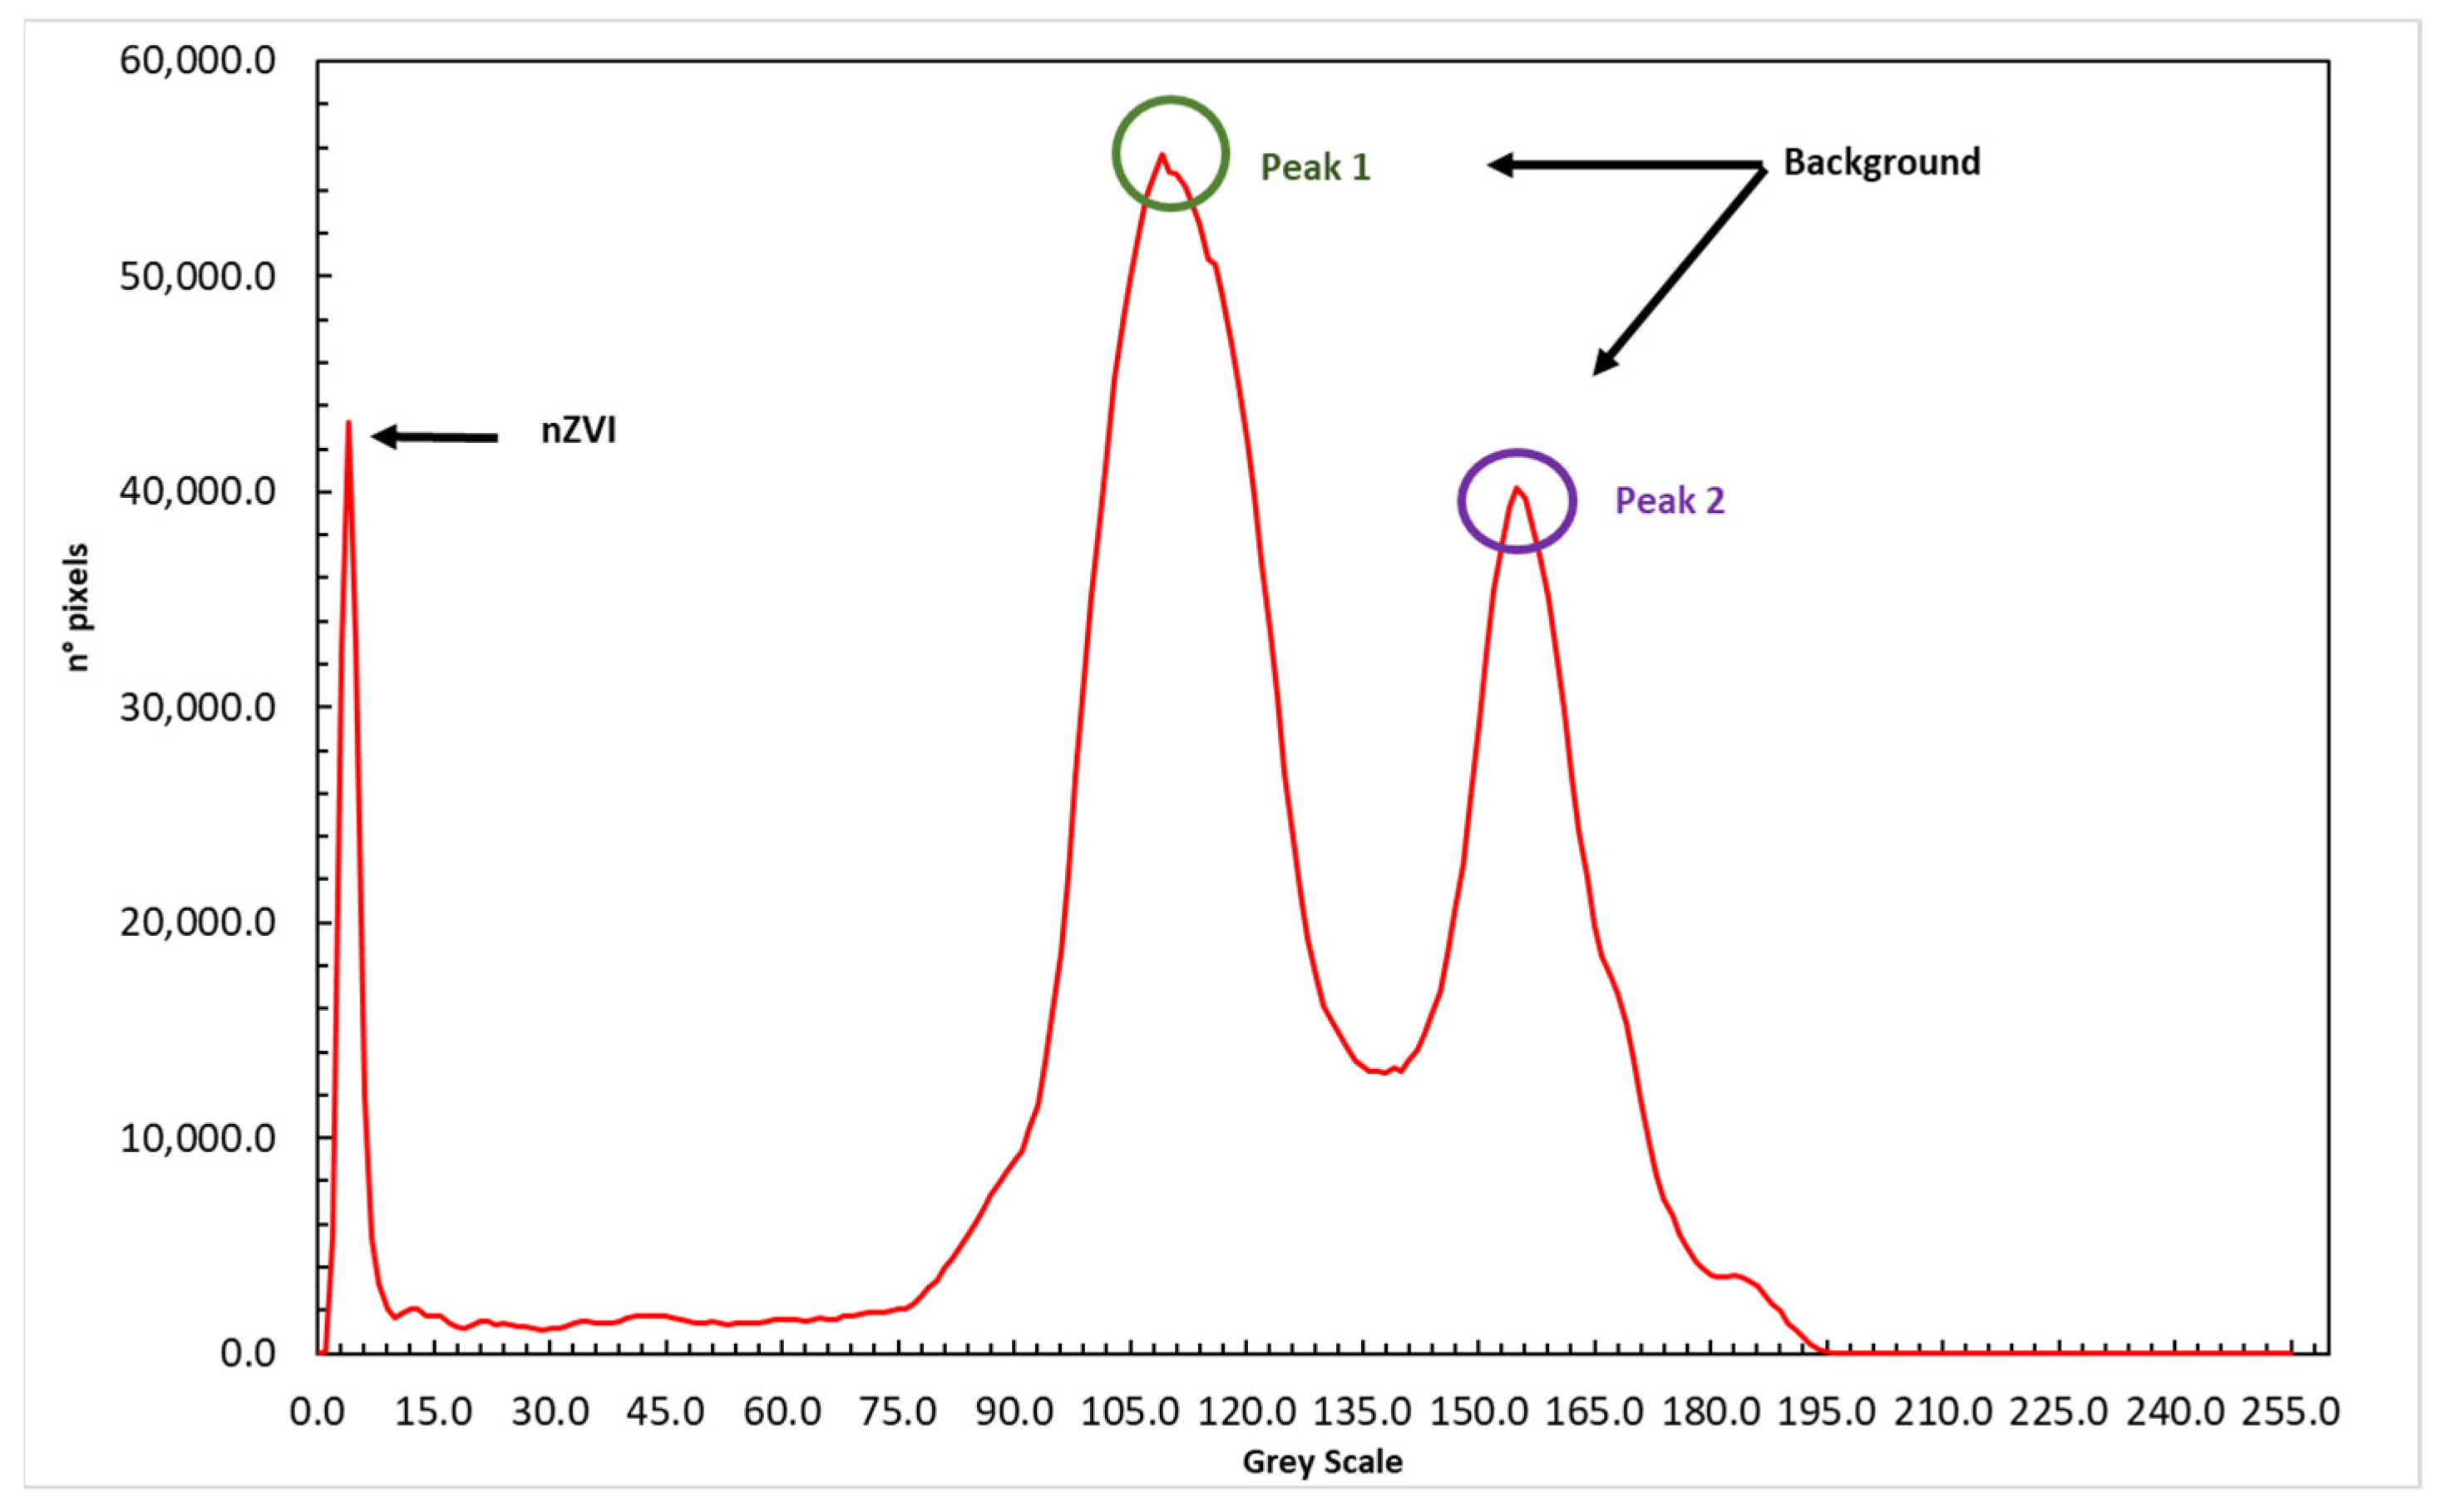
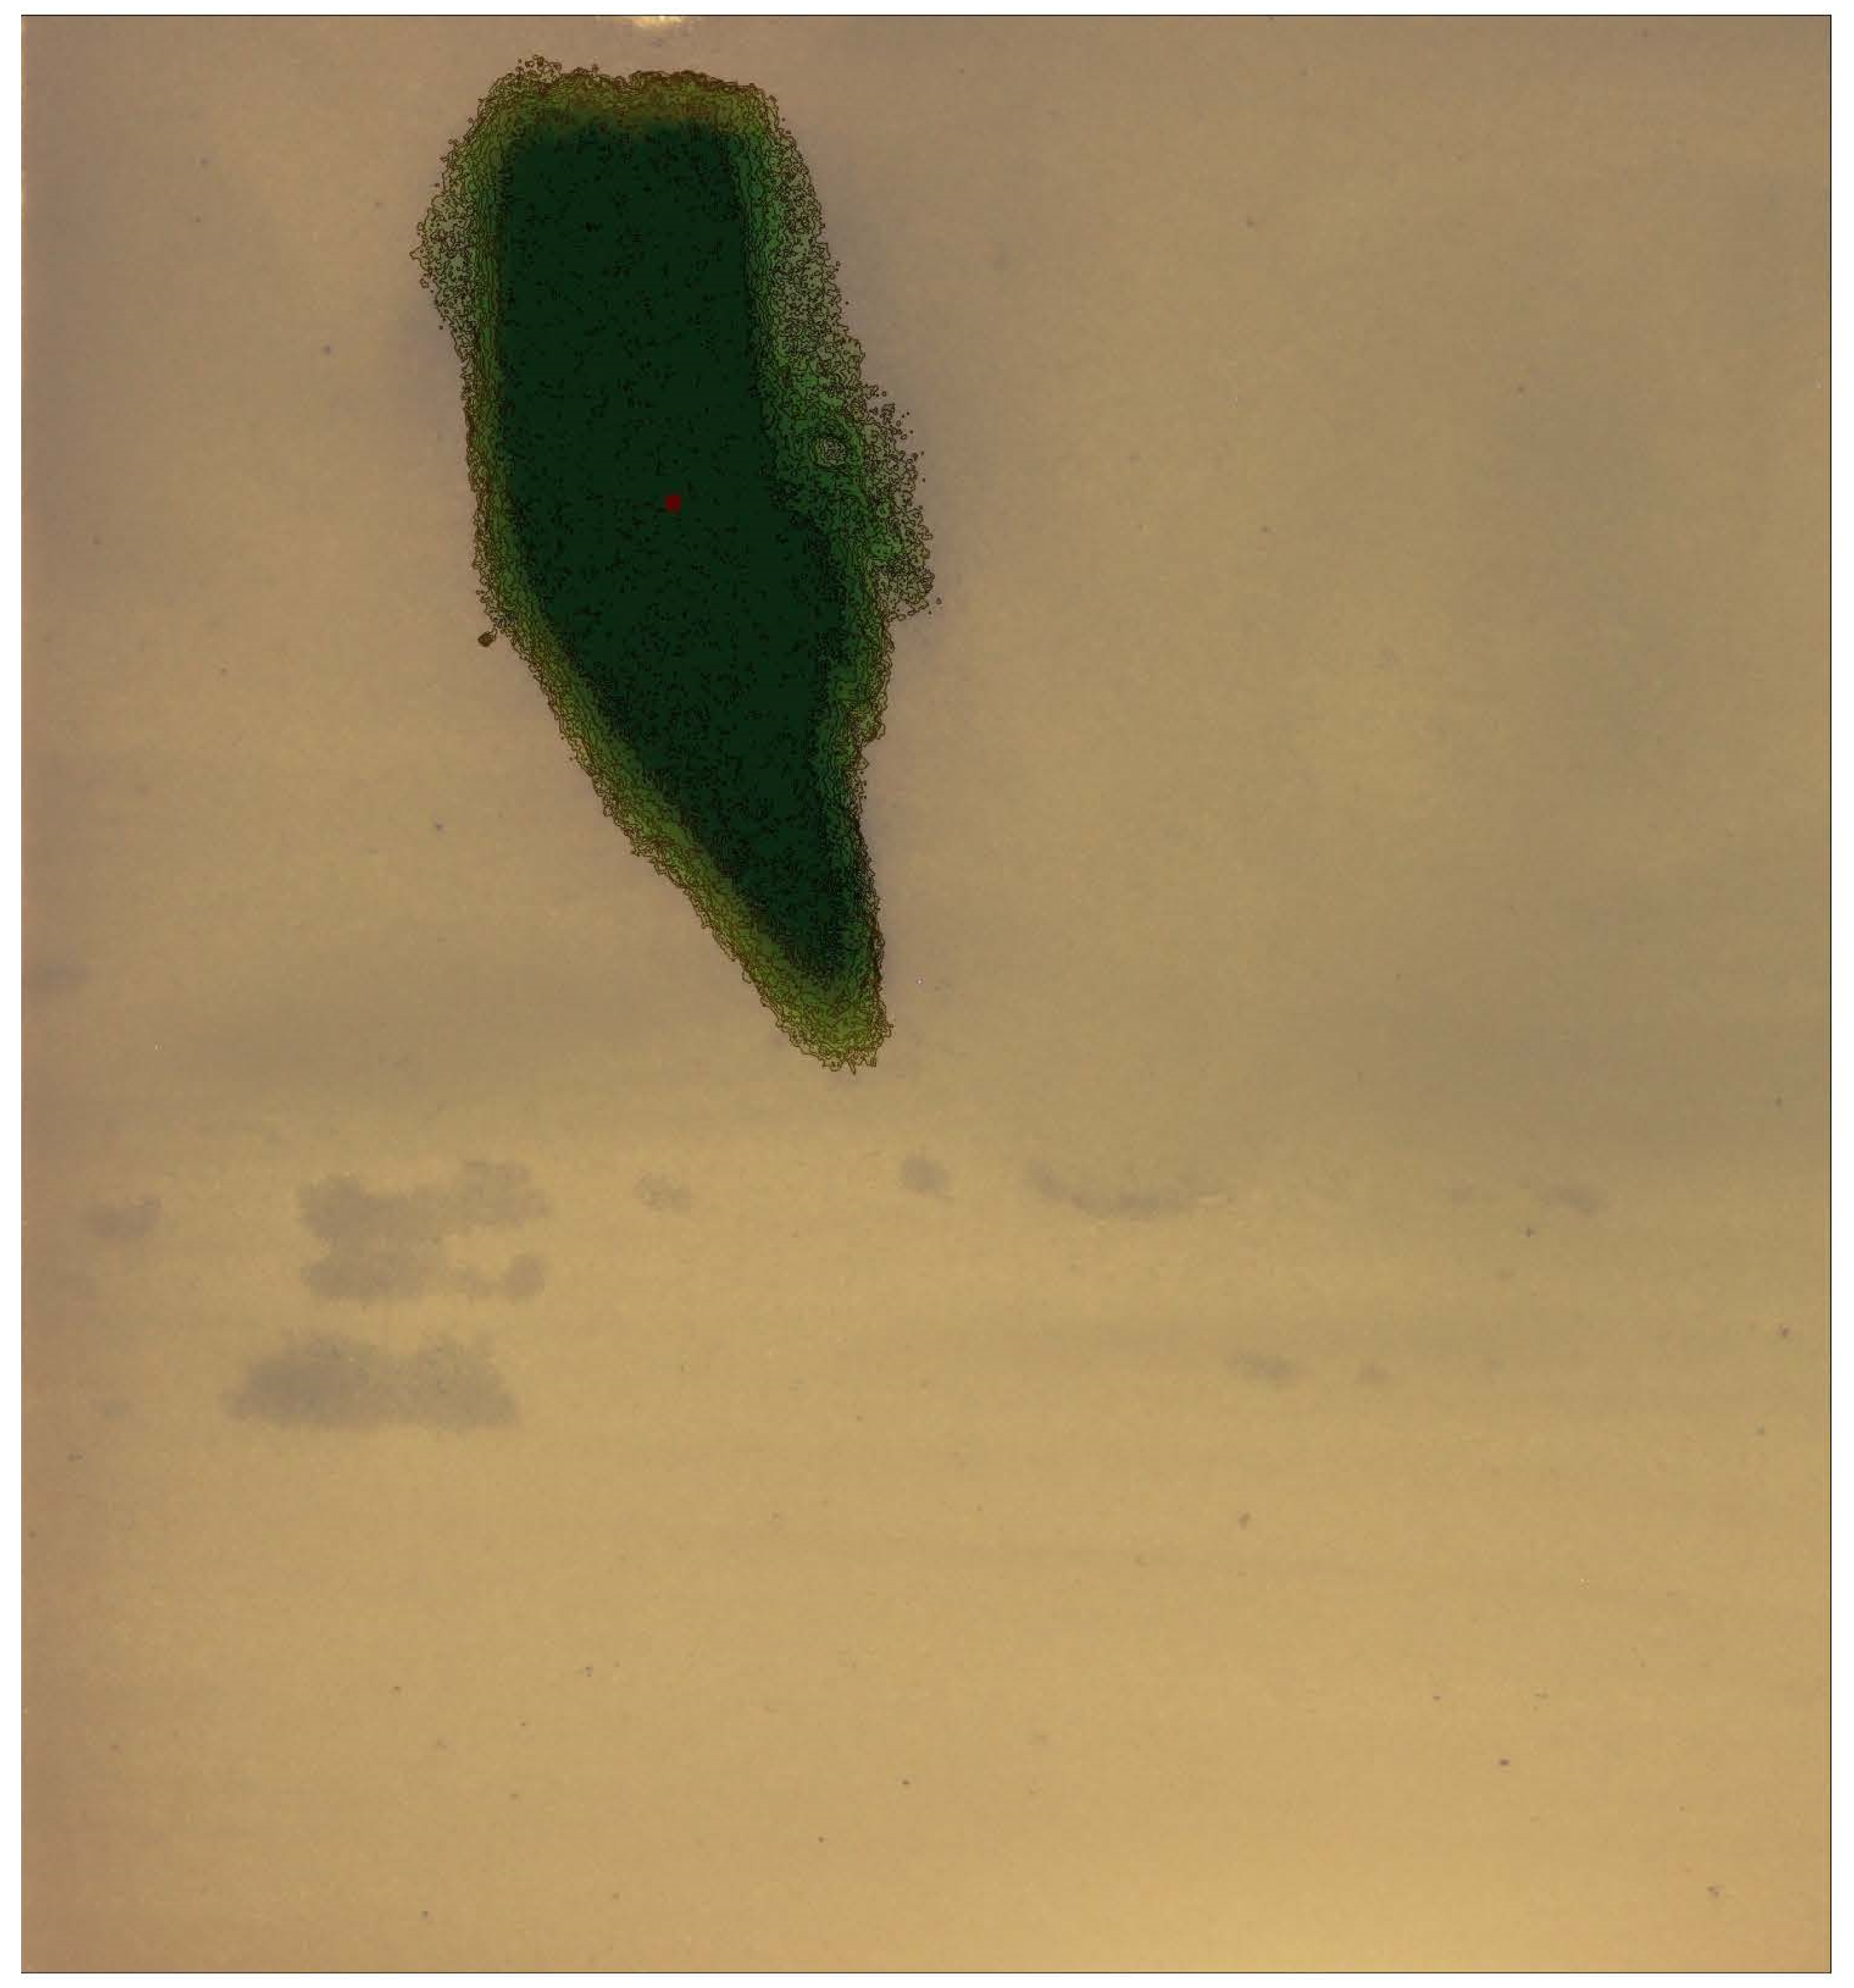
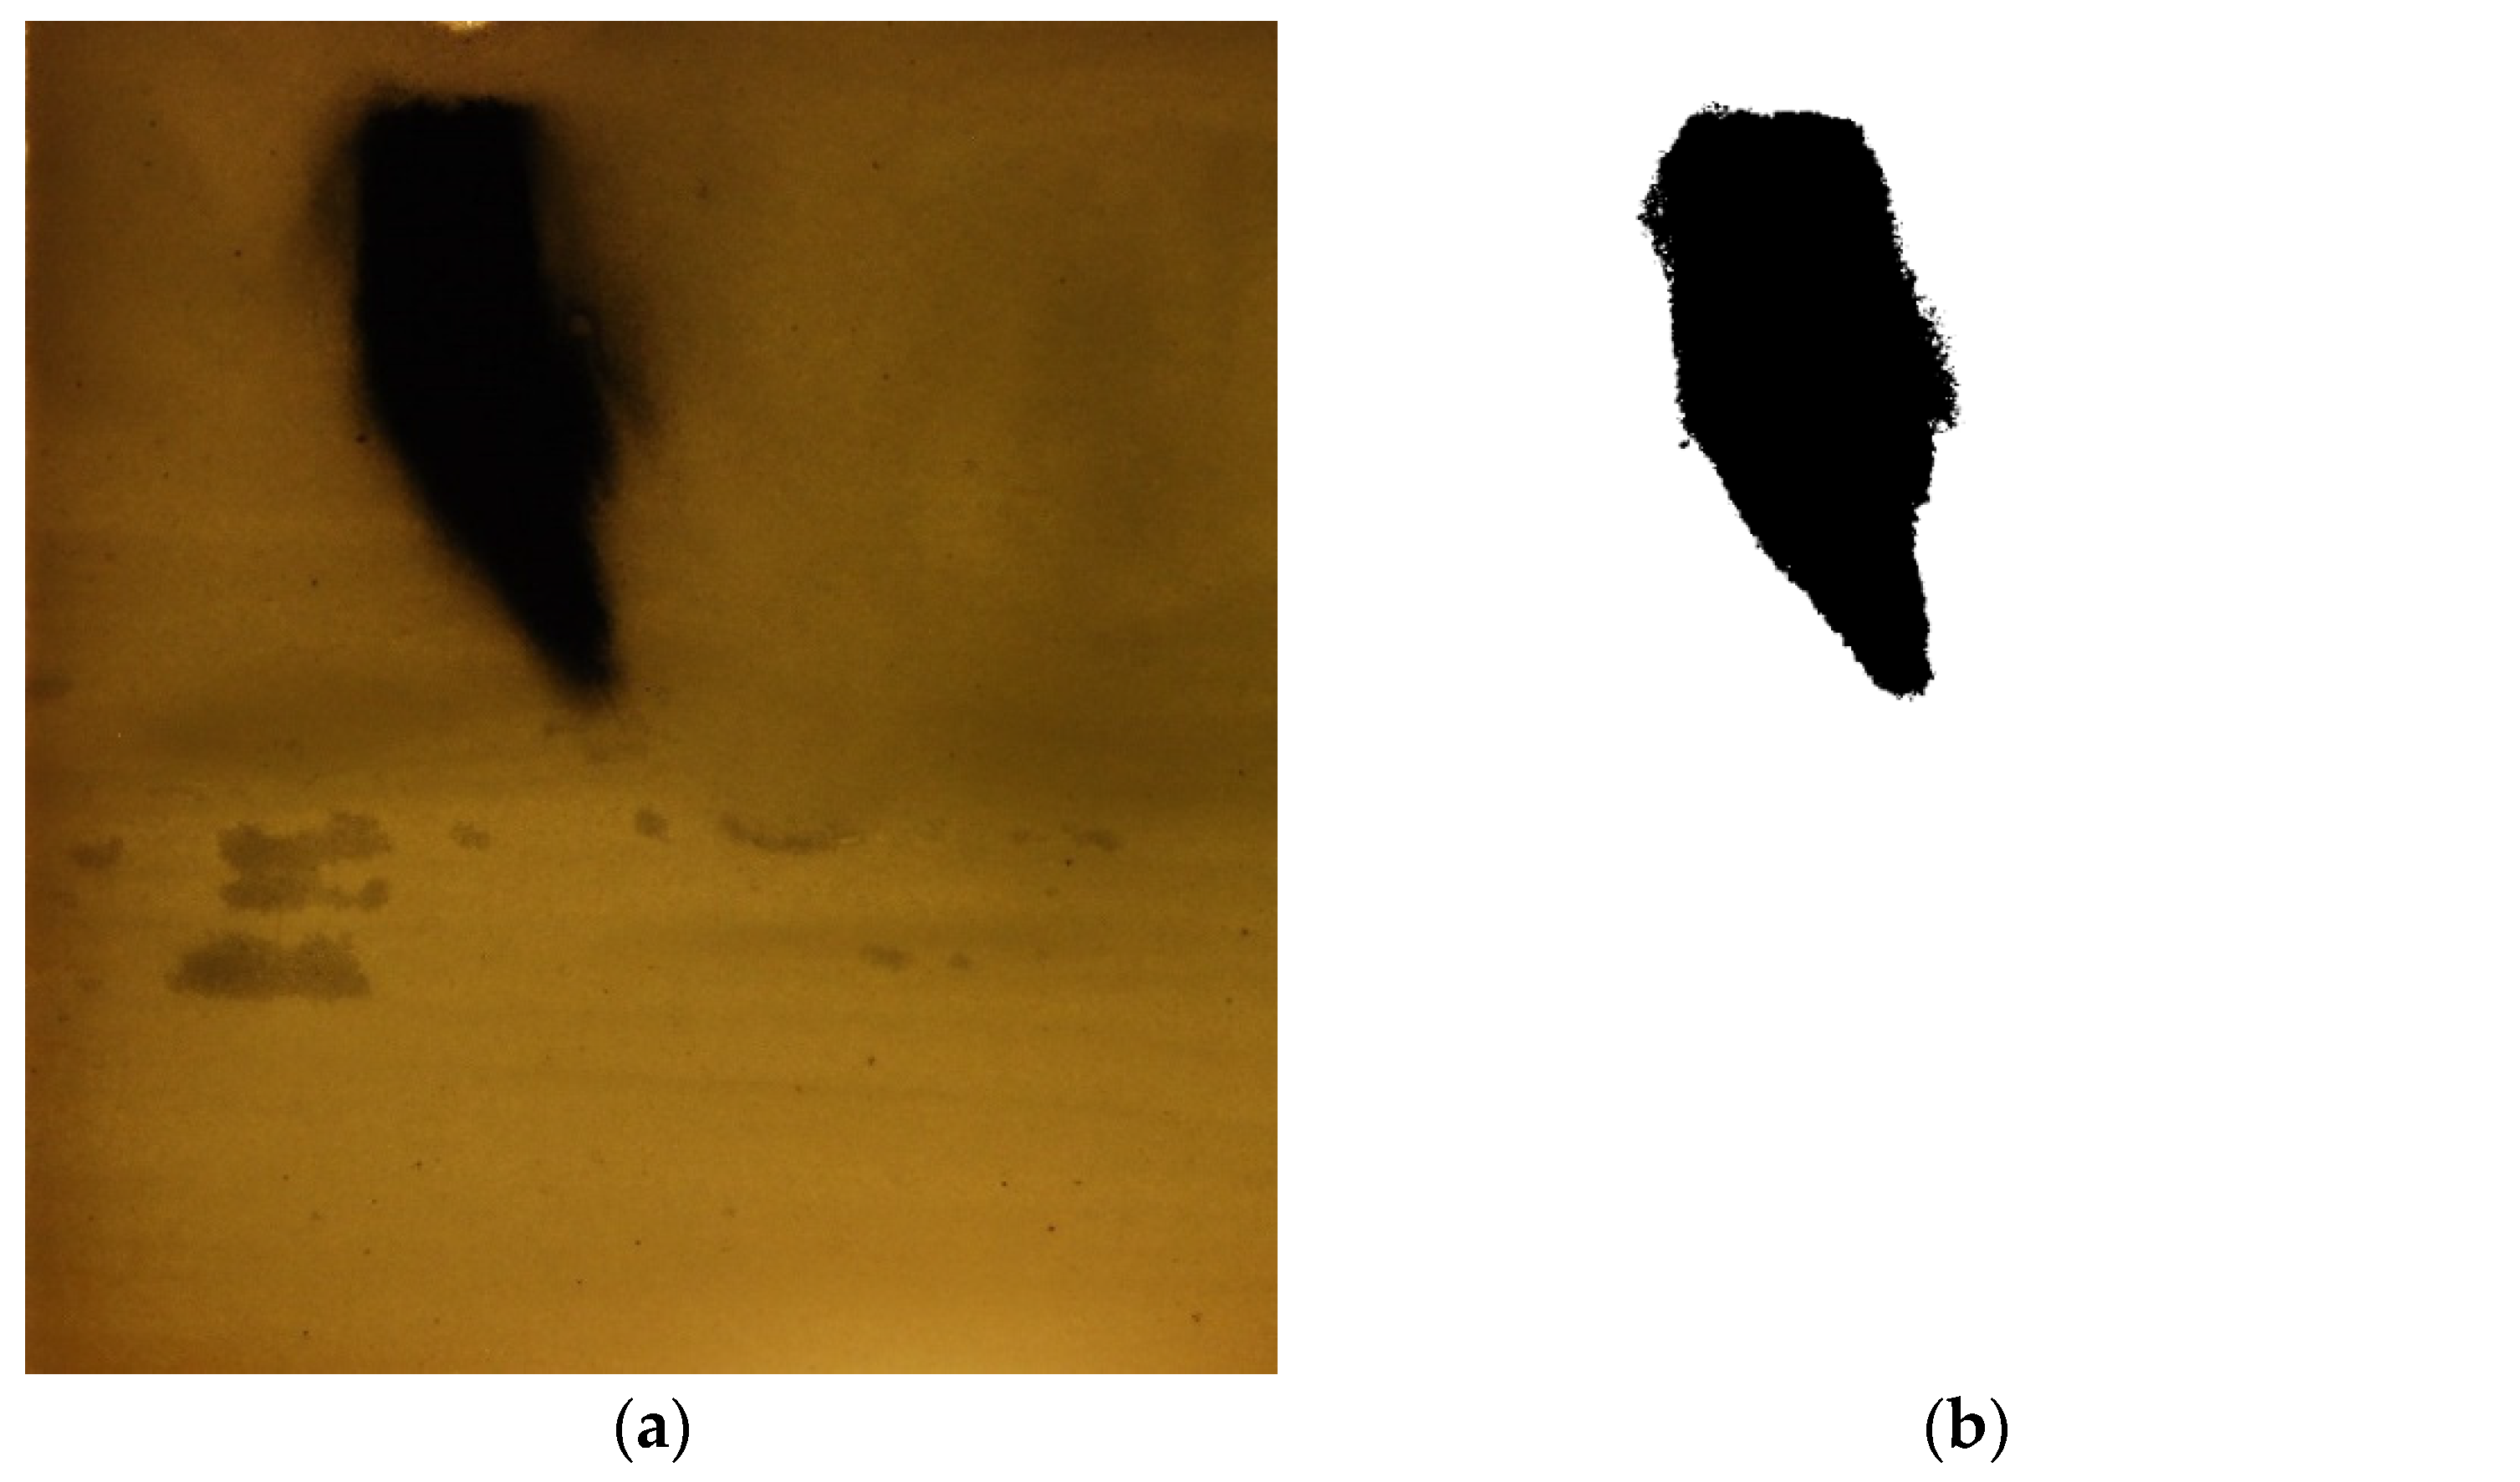
- The AOI was converted into grayscale. In Figure 4 is represented the histogram of pixel value frequency at the different gray levels. It is possible to evidence two distinct peaks that represent two different levels of light transmitted corresponding to the absence of nZVI (background) and a peak to the lower grayscale (close to black) that represent the area where particles are present.The presence of two peaks in Figure 4 is due to an imperfect light distribution in the images. This aspect in any case does not interfere with the nZVI distribution that is clearly identified from the first peak with a lower gray intensity. A threshold was applied and the filtered result was a matrix with two different classes of pixel with assigned values: 0 for nZVI and 255 for the background (Figure 5).Figure 5b shows that the intensity threshold applied makes it possible to identify the mass of the nanoparticles (black) and isolate them from the porous medium (white). However, although it is possible to verify a good identification of the nanoparticle mass, especially in the central part characterized by lower gray intensity values, Figure 5b shows a weak uncertainty for the boundaries of the nZVI plume.
- (d)
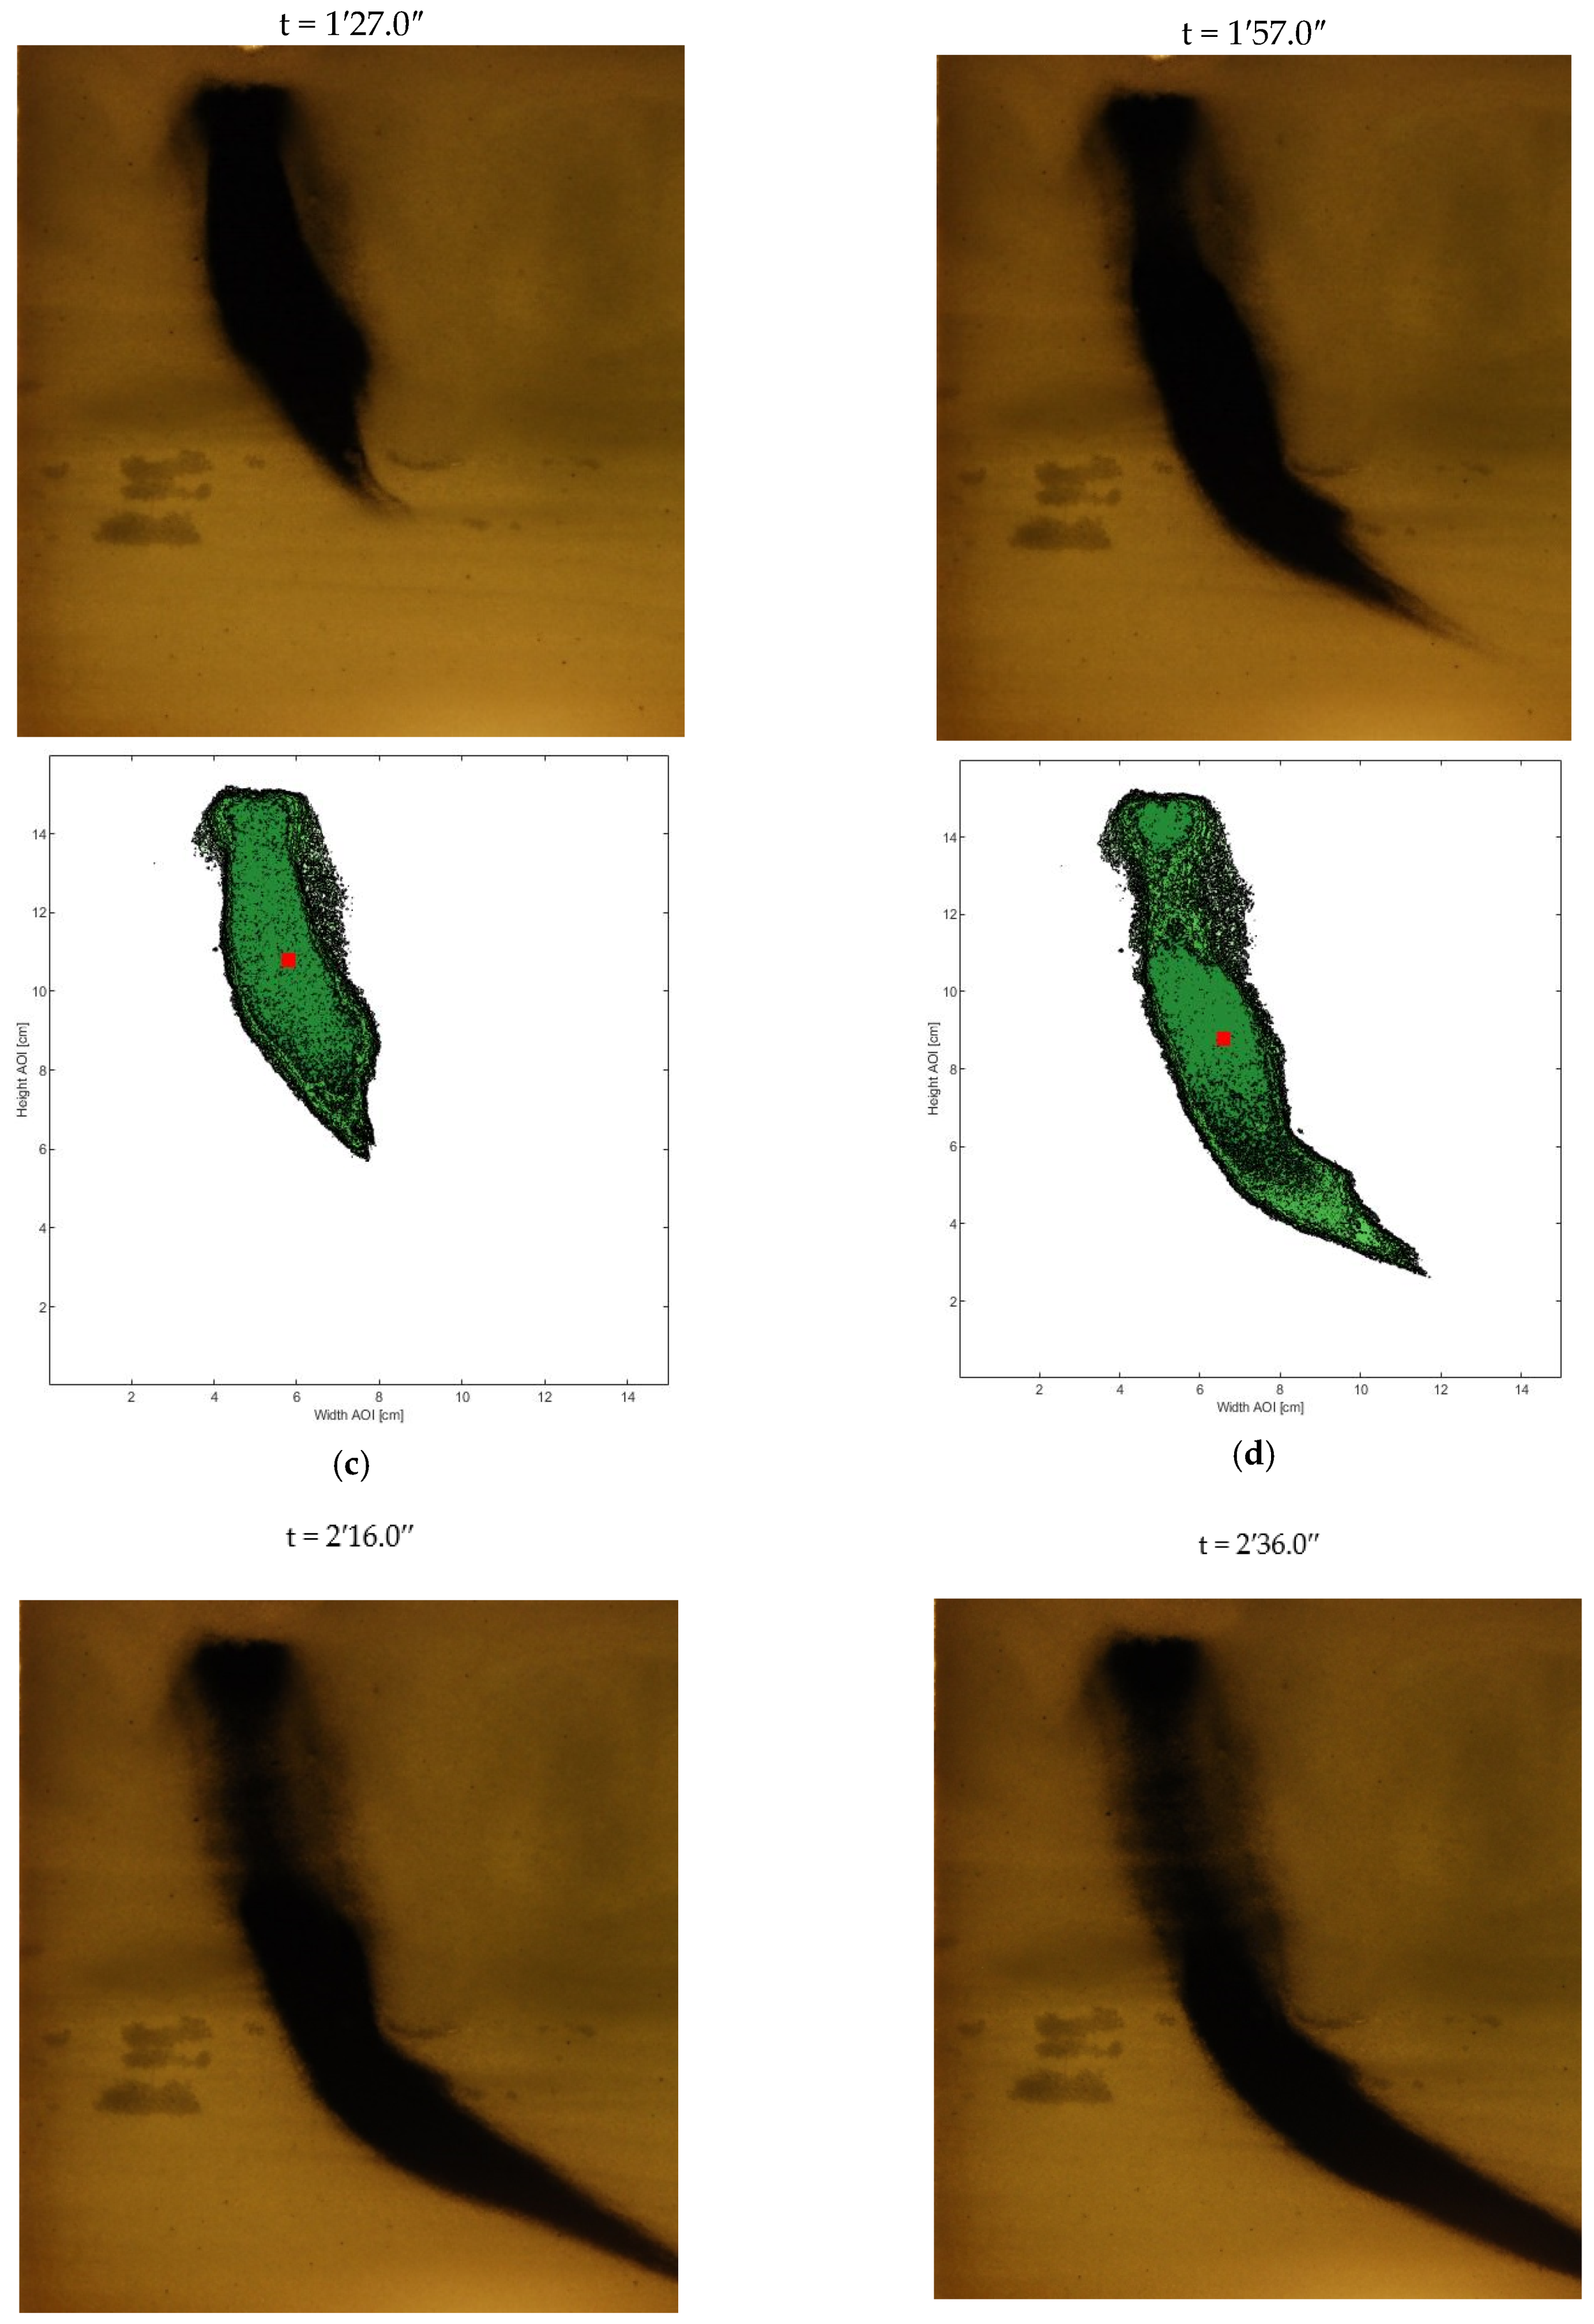
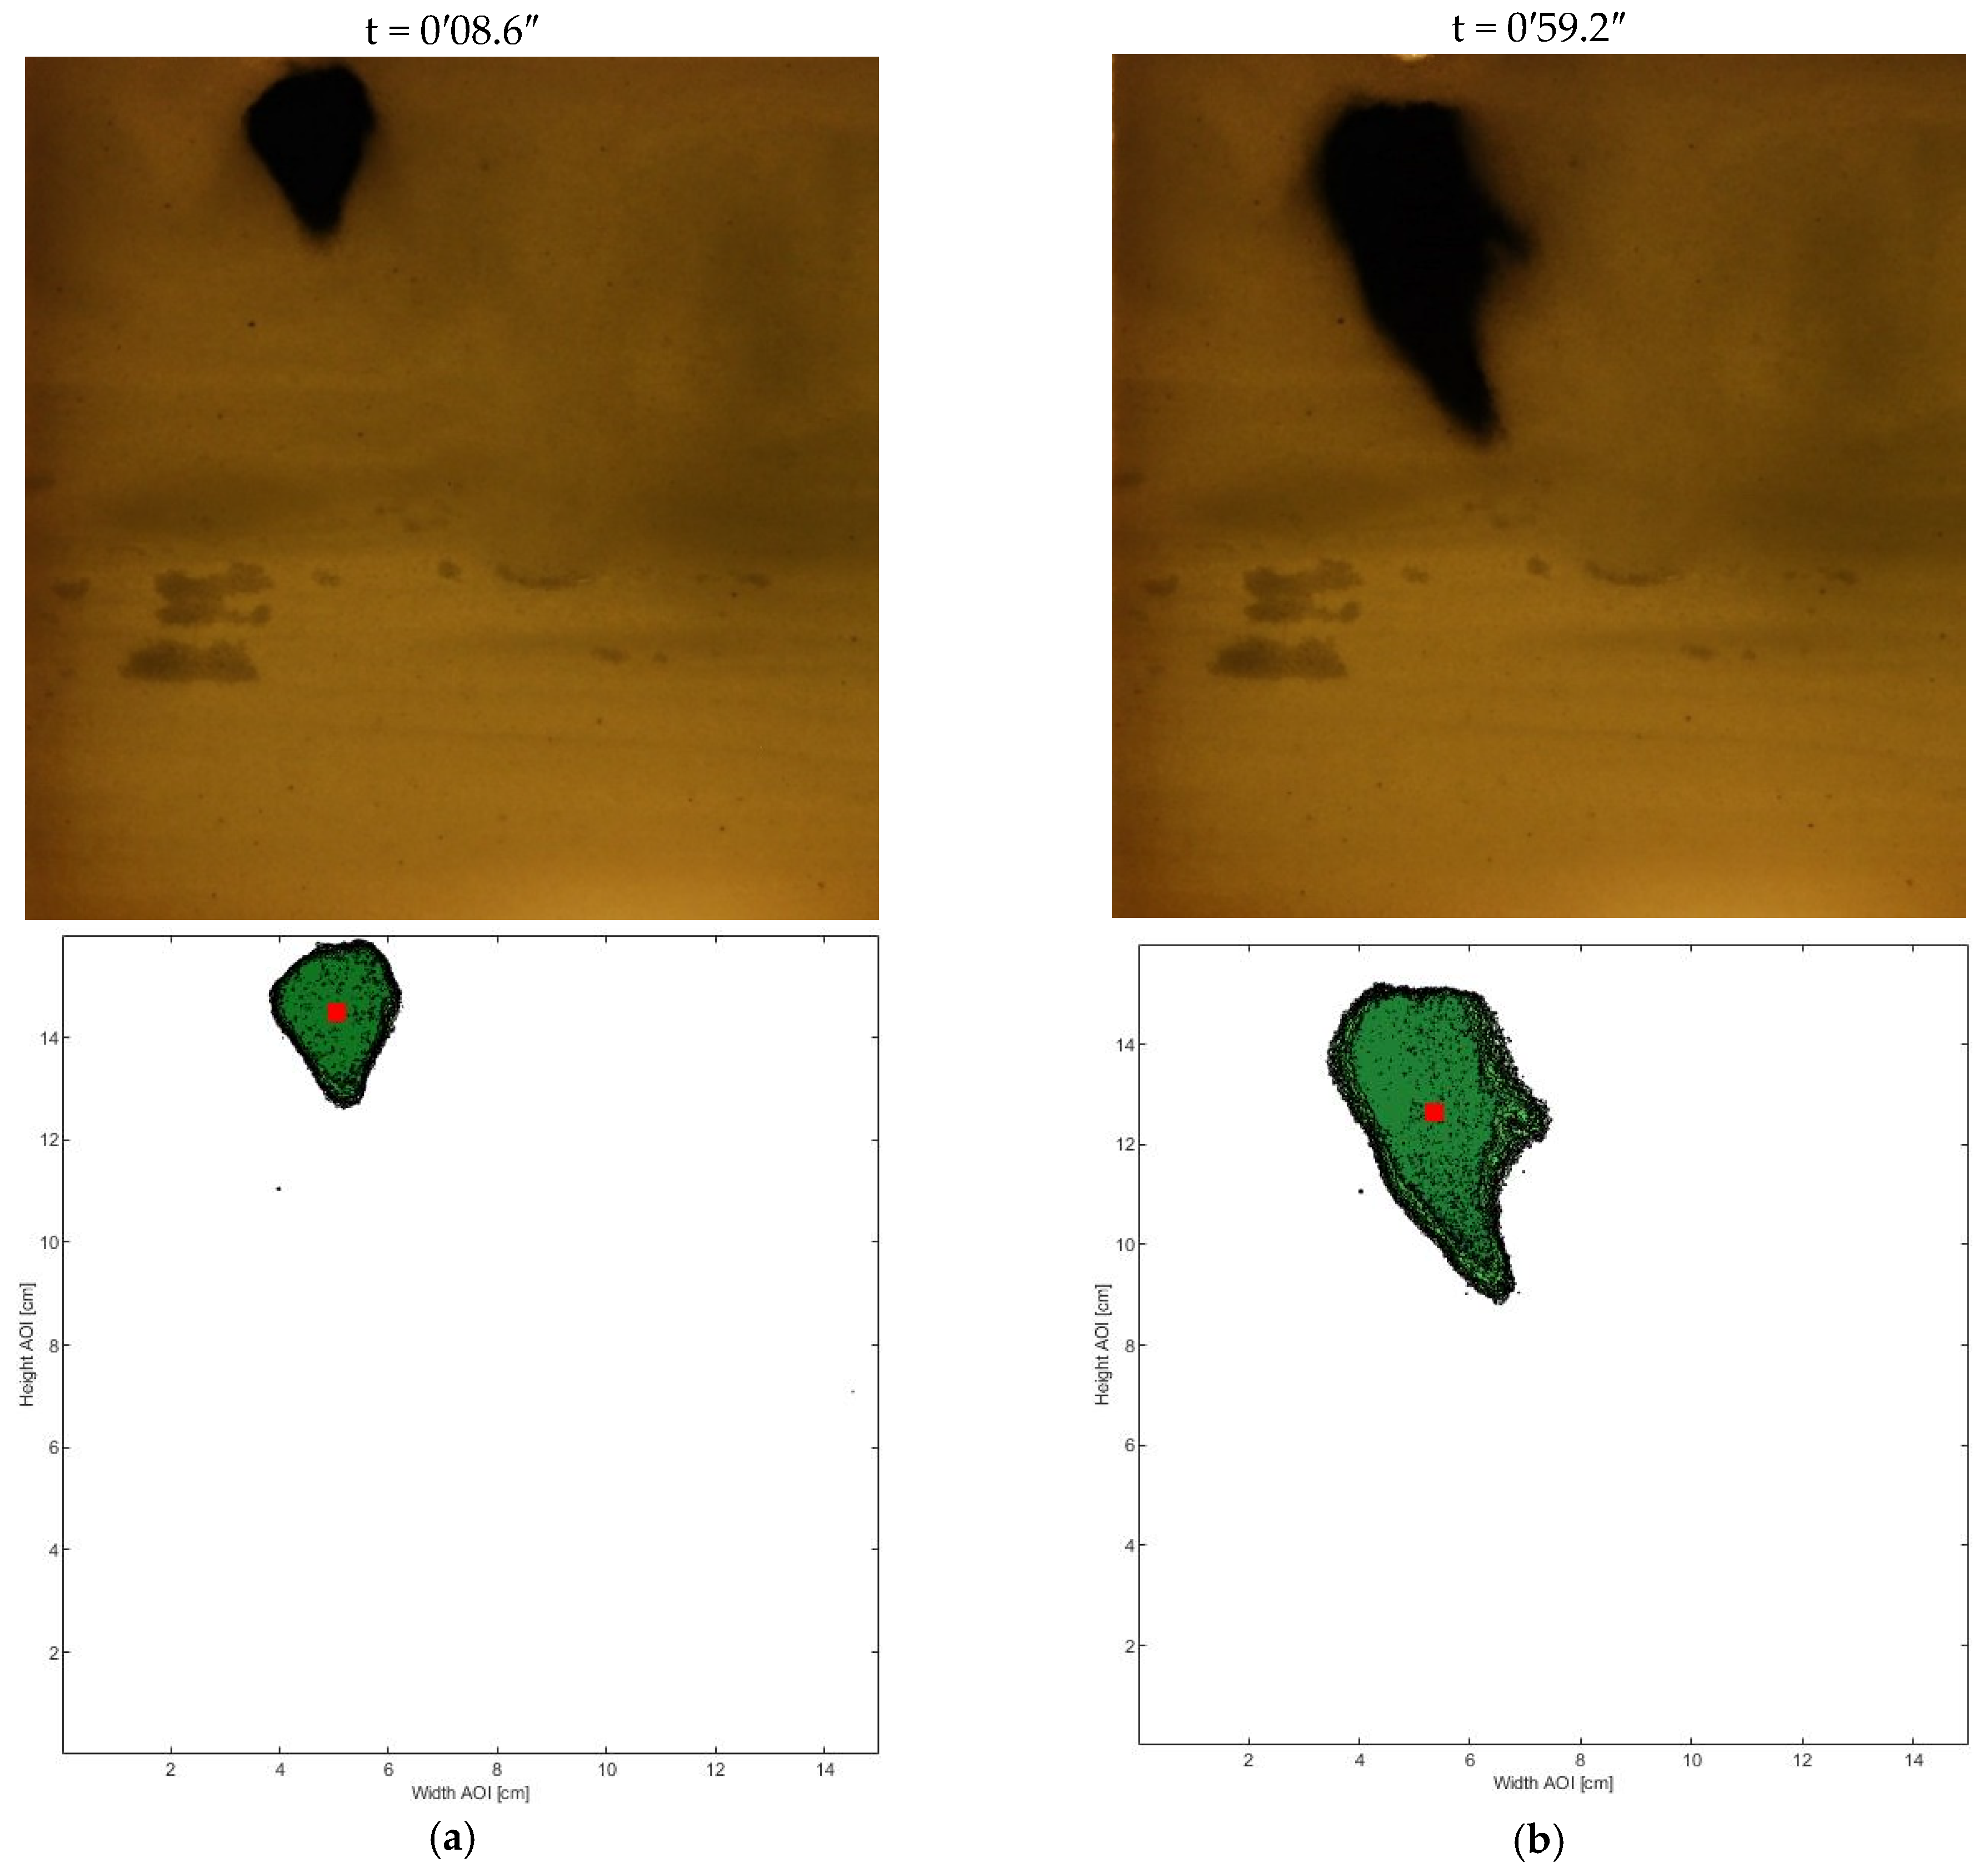
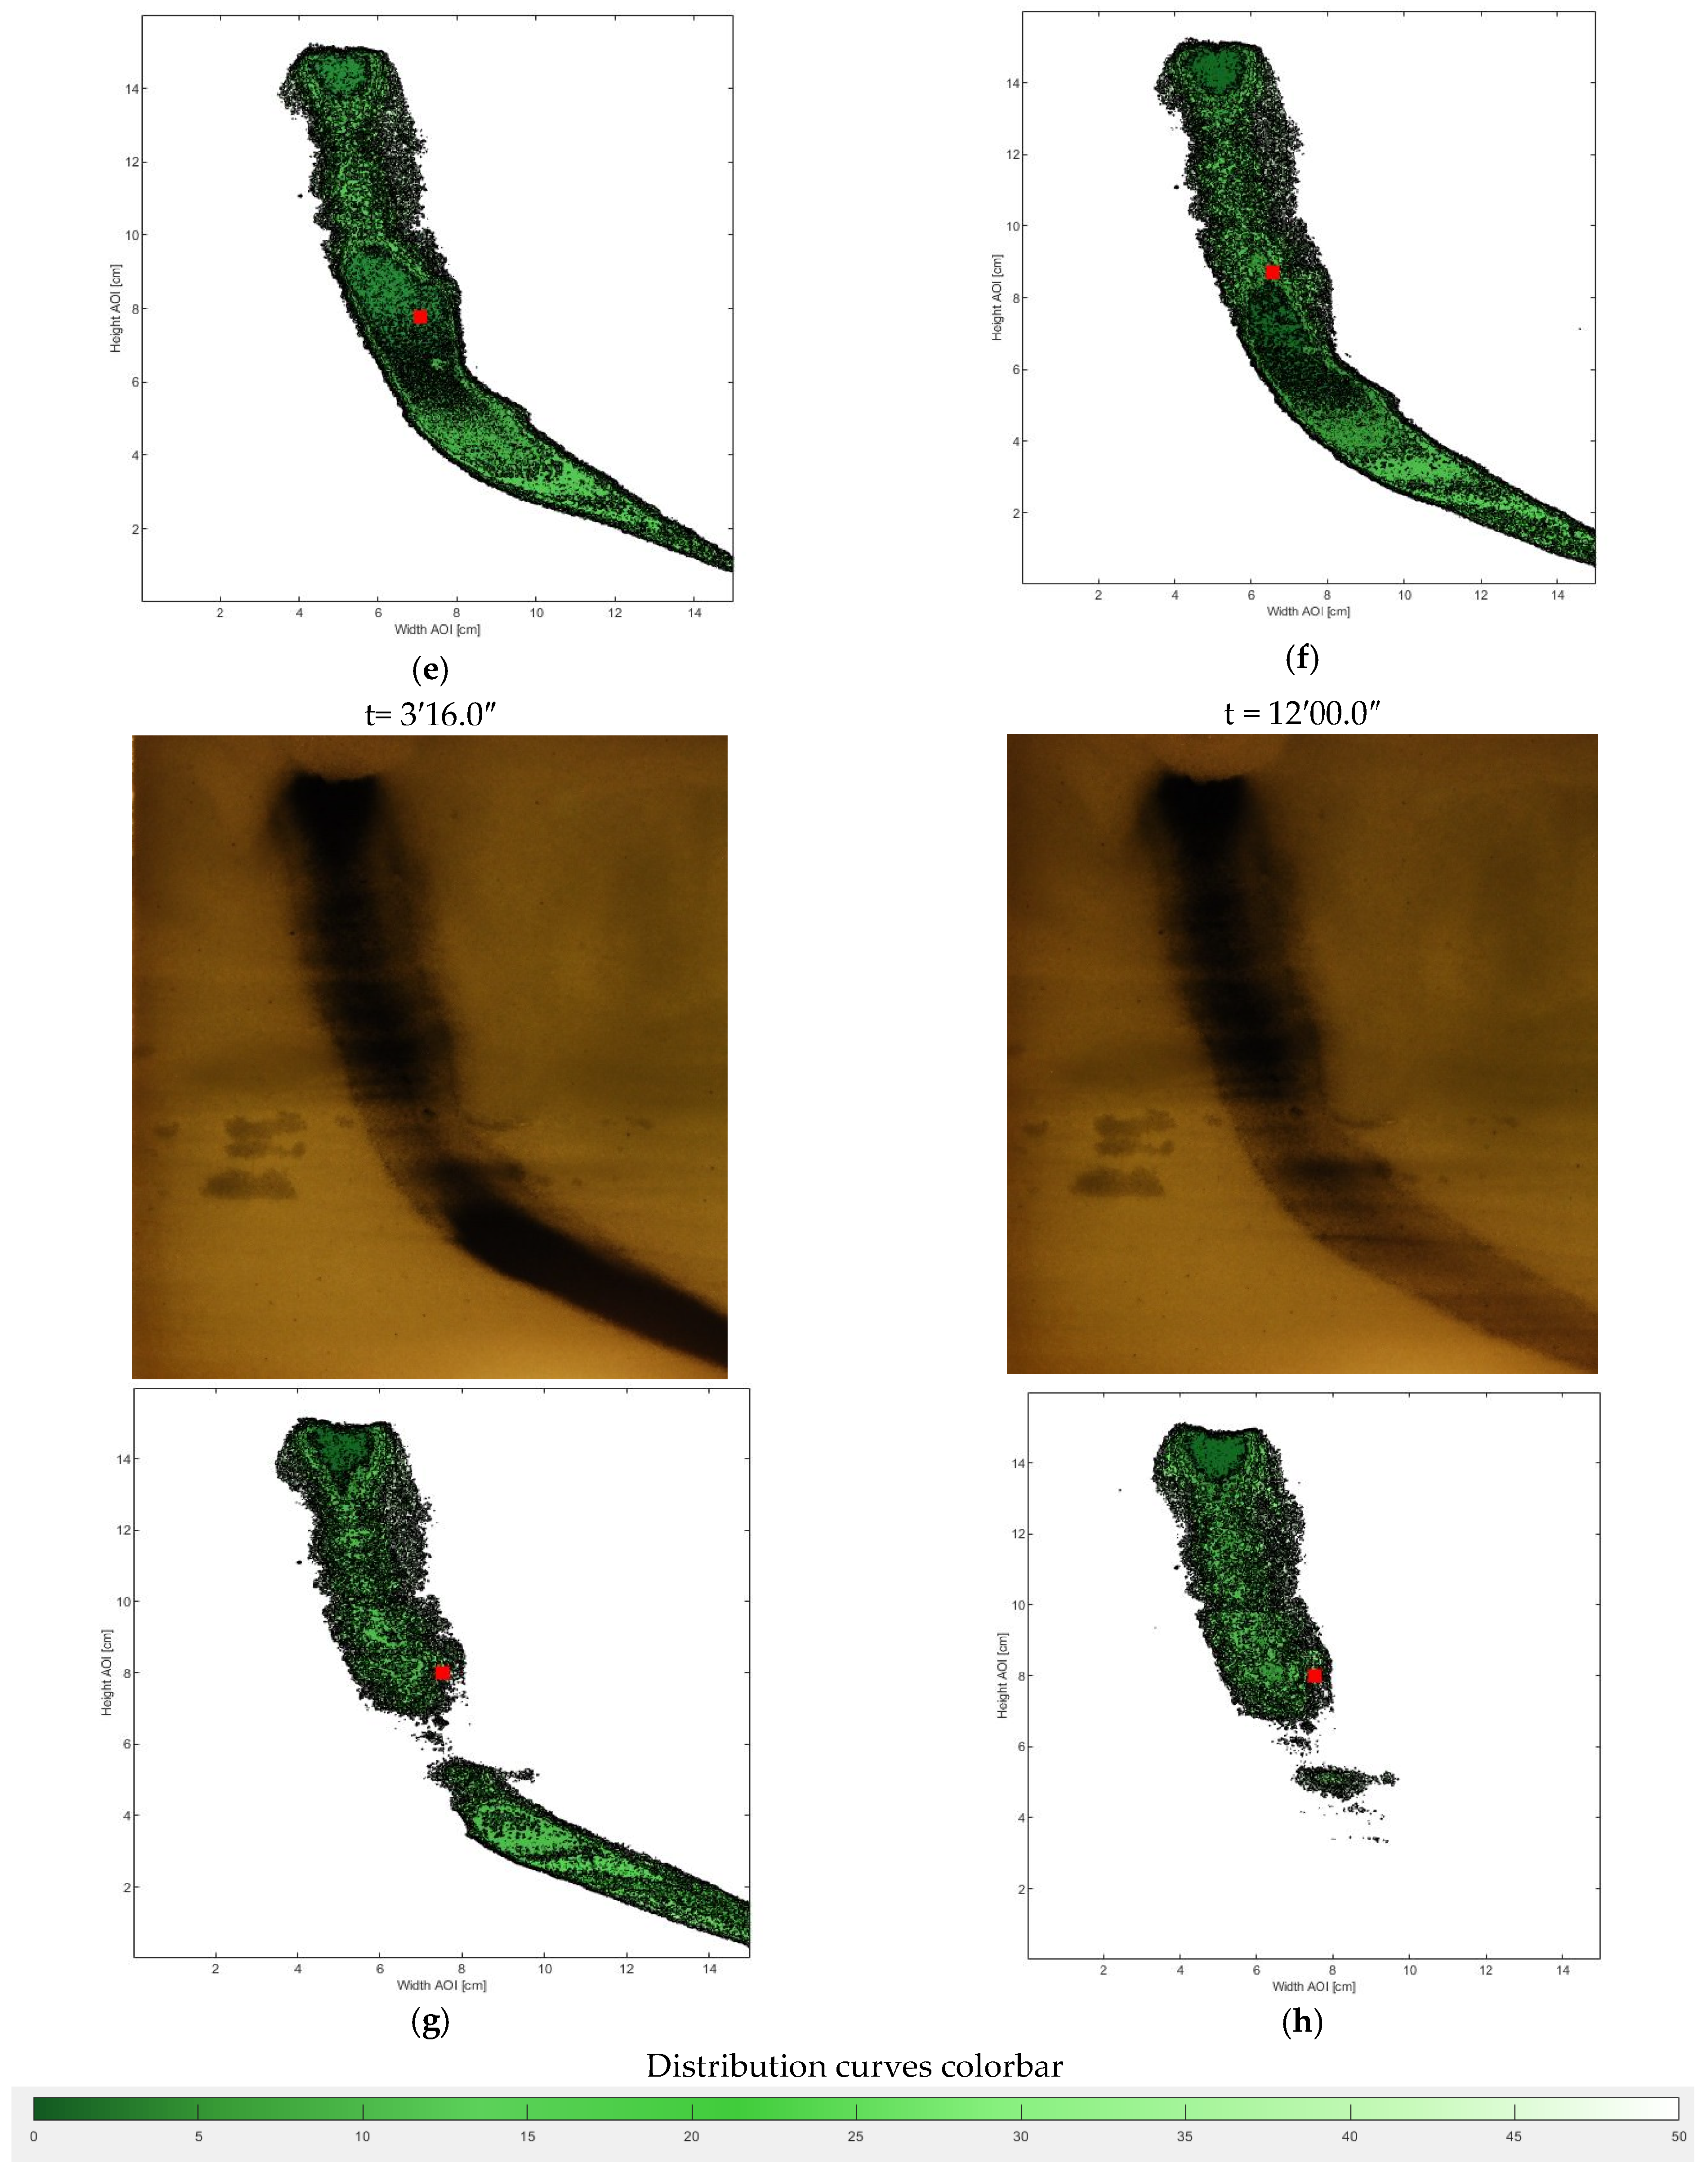
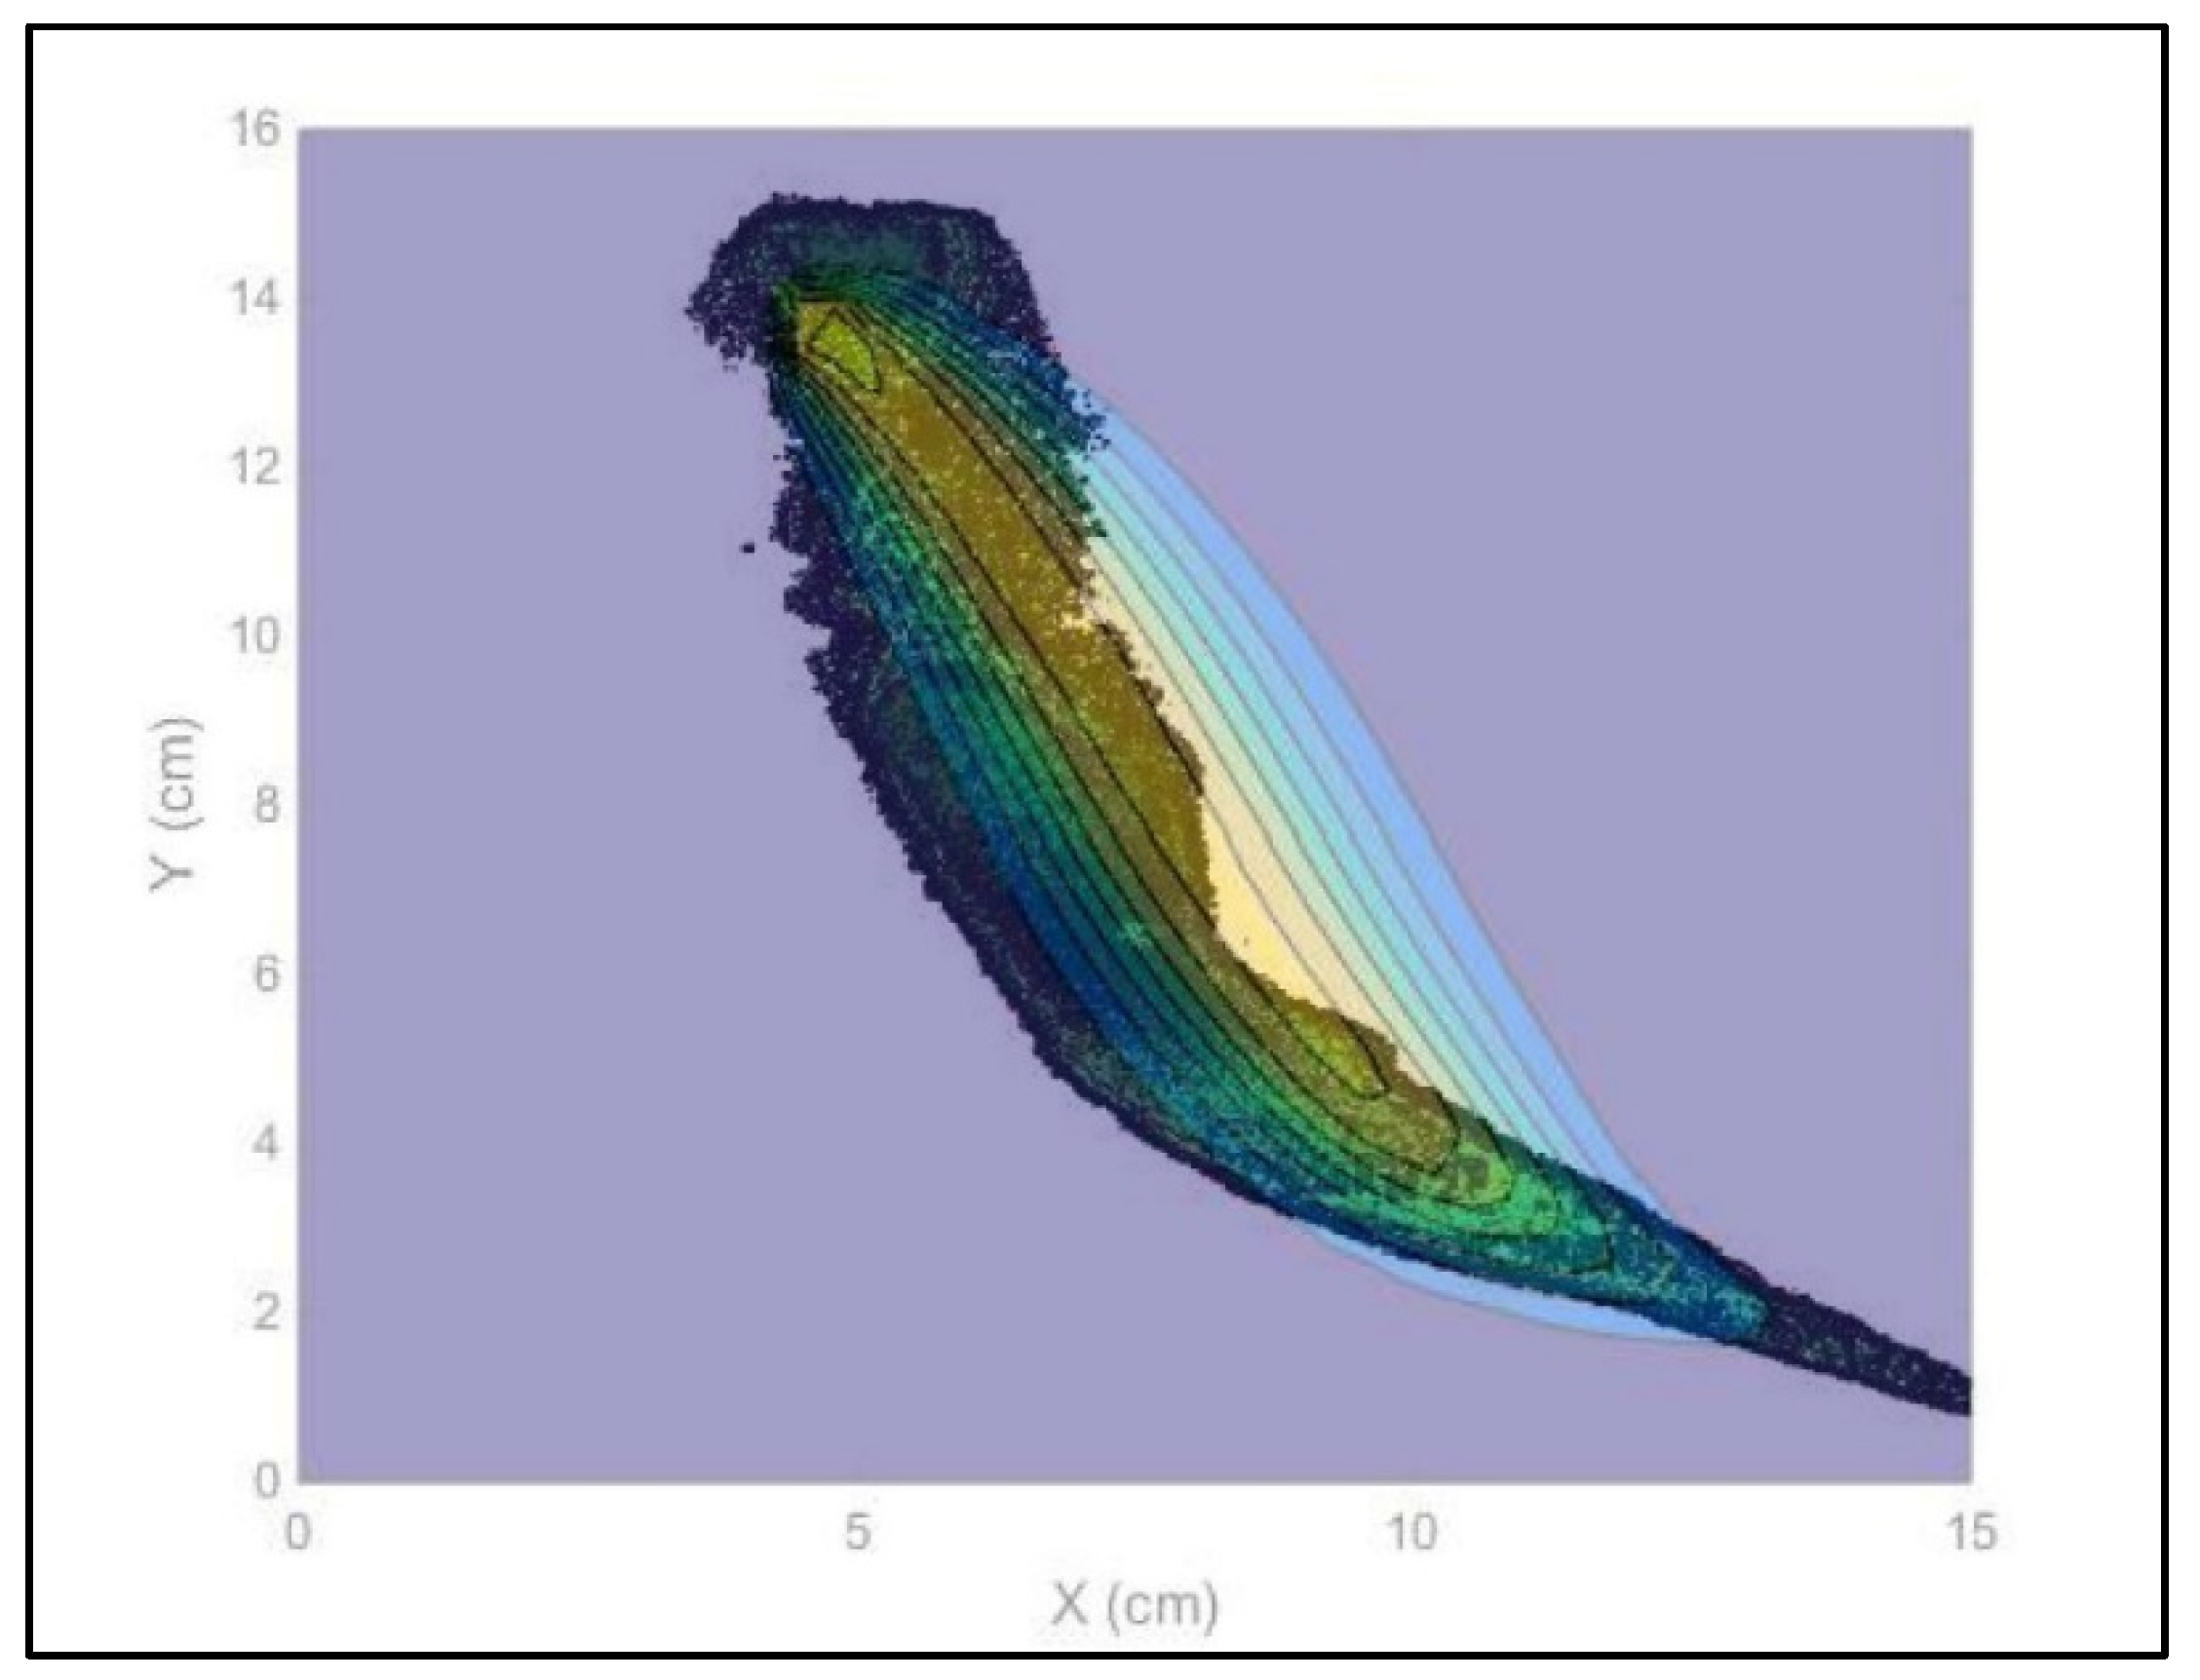
- Therefore, in order to assess the distribution of the nZVI plume, the pixels with intensity 255 were neglected and to the remaining pixels the original gray level were reassigned. All images were then processed again. Once the same intensity threshold was fixed for each image, the 17 gray level intervals were used to process each image in order to obtain the best definition of the nZVI plume dimensions. The 17 gray levels were set with a gray intensity step equal to 2 ranging from to the lowest to the highest gray level (0–2; 3–5; 6–8; 9–11; 12–14; 15–17; 18–20; 21–23; 24–26; 27–29; 30–32; 33–35; 36–38; 39–41; 42–44; 45–47; and 48–50). In such a way, it was possible to evaluate the different values in each pixel belonging to several color intensities that correspond to different nZVI presences. Each gray level was then associated to the interval average of the nZVI distribution: the area with the lowest gray values represents the highest concentration area and the increase of the gray level corresponds to a lower presence of nZVI. Figure 6 shows the overlap between digital photo and nZVI distribution levels, processed by means of the reported procedure. By the data acquired from the image analysis procedure (a–d), the distribution was processed.
2.2.2. nZVI Plume Dispersion
- i.
- By the image analysis procedure (a–d), the number of pixels occupied by the nanoparticles (n) was defined for each image. To identify the number of pixels occupied by the nanoparticles, the same intensity threshold of the proposed image analysis procedure (a–d) was used;
- ii.
- The area of a pixel (Apix) was calculated, knowing the physical width and height of the area of interest and the number of pixels (Width × Height). Table 3 shows some geometric parameters of the AOI.
- iii.
- For each image, the area occupied by the nanoparticles was calculated by means of the following relationship:where the i pedix indicates the time. For the assessment of the areas, all images were considered during the travelling time of the nanoparticle plume from the injection point to the AOI end.
- iv.
- The “dispersion” (Di with the pedix indicating the time) was calculated considering the difference in the occupied area between an image at the time t and the one at time t = 0:
2.3. Calibration Image Analysis Procedure
3. Results and Discussion
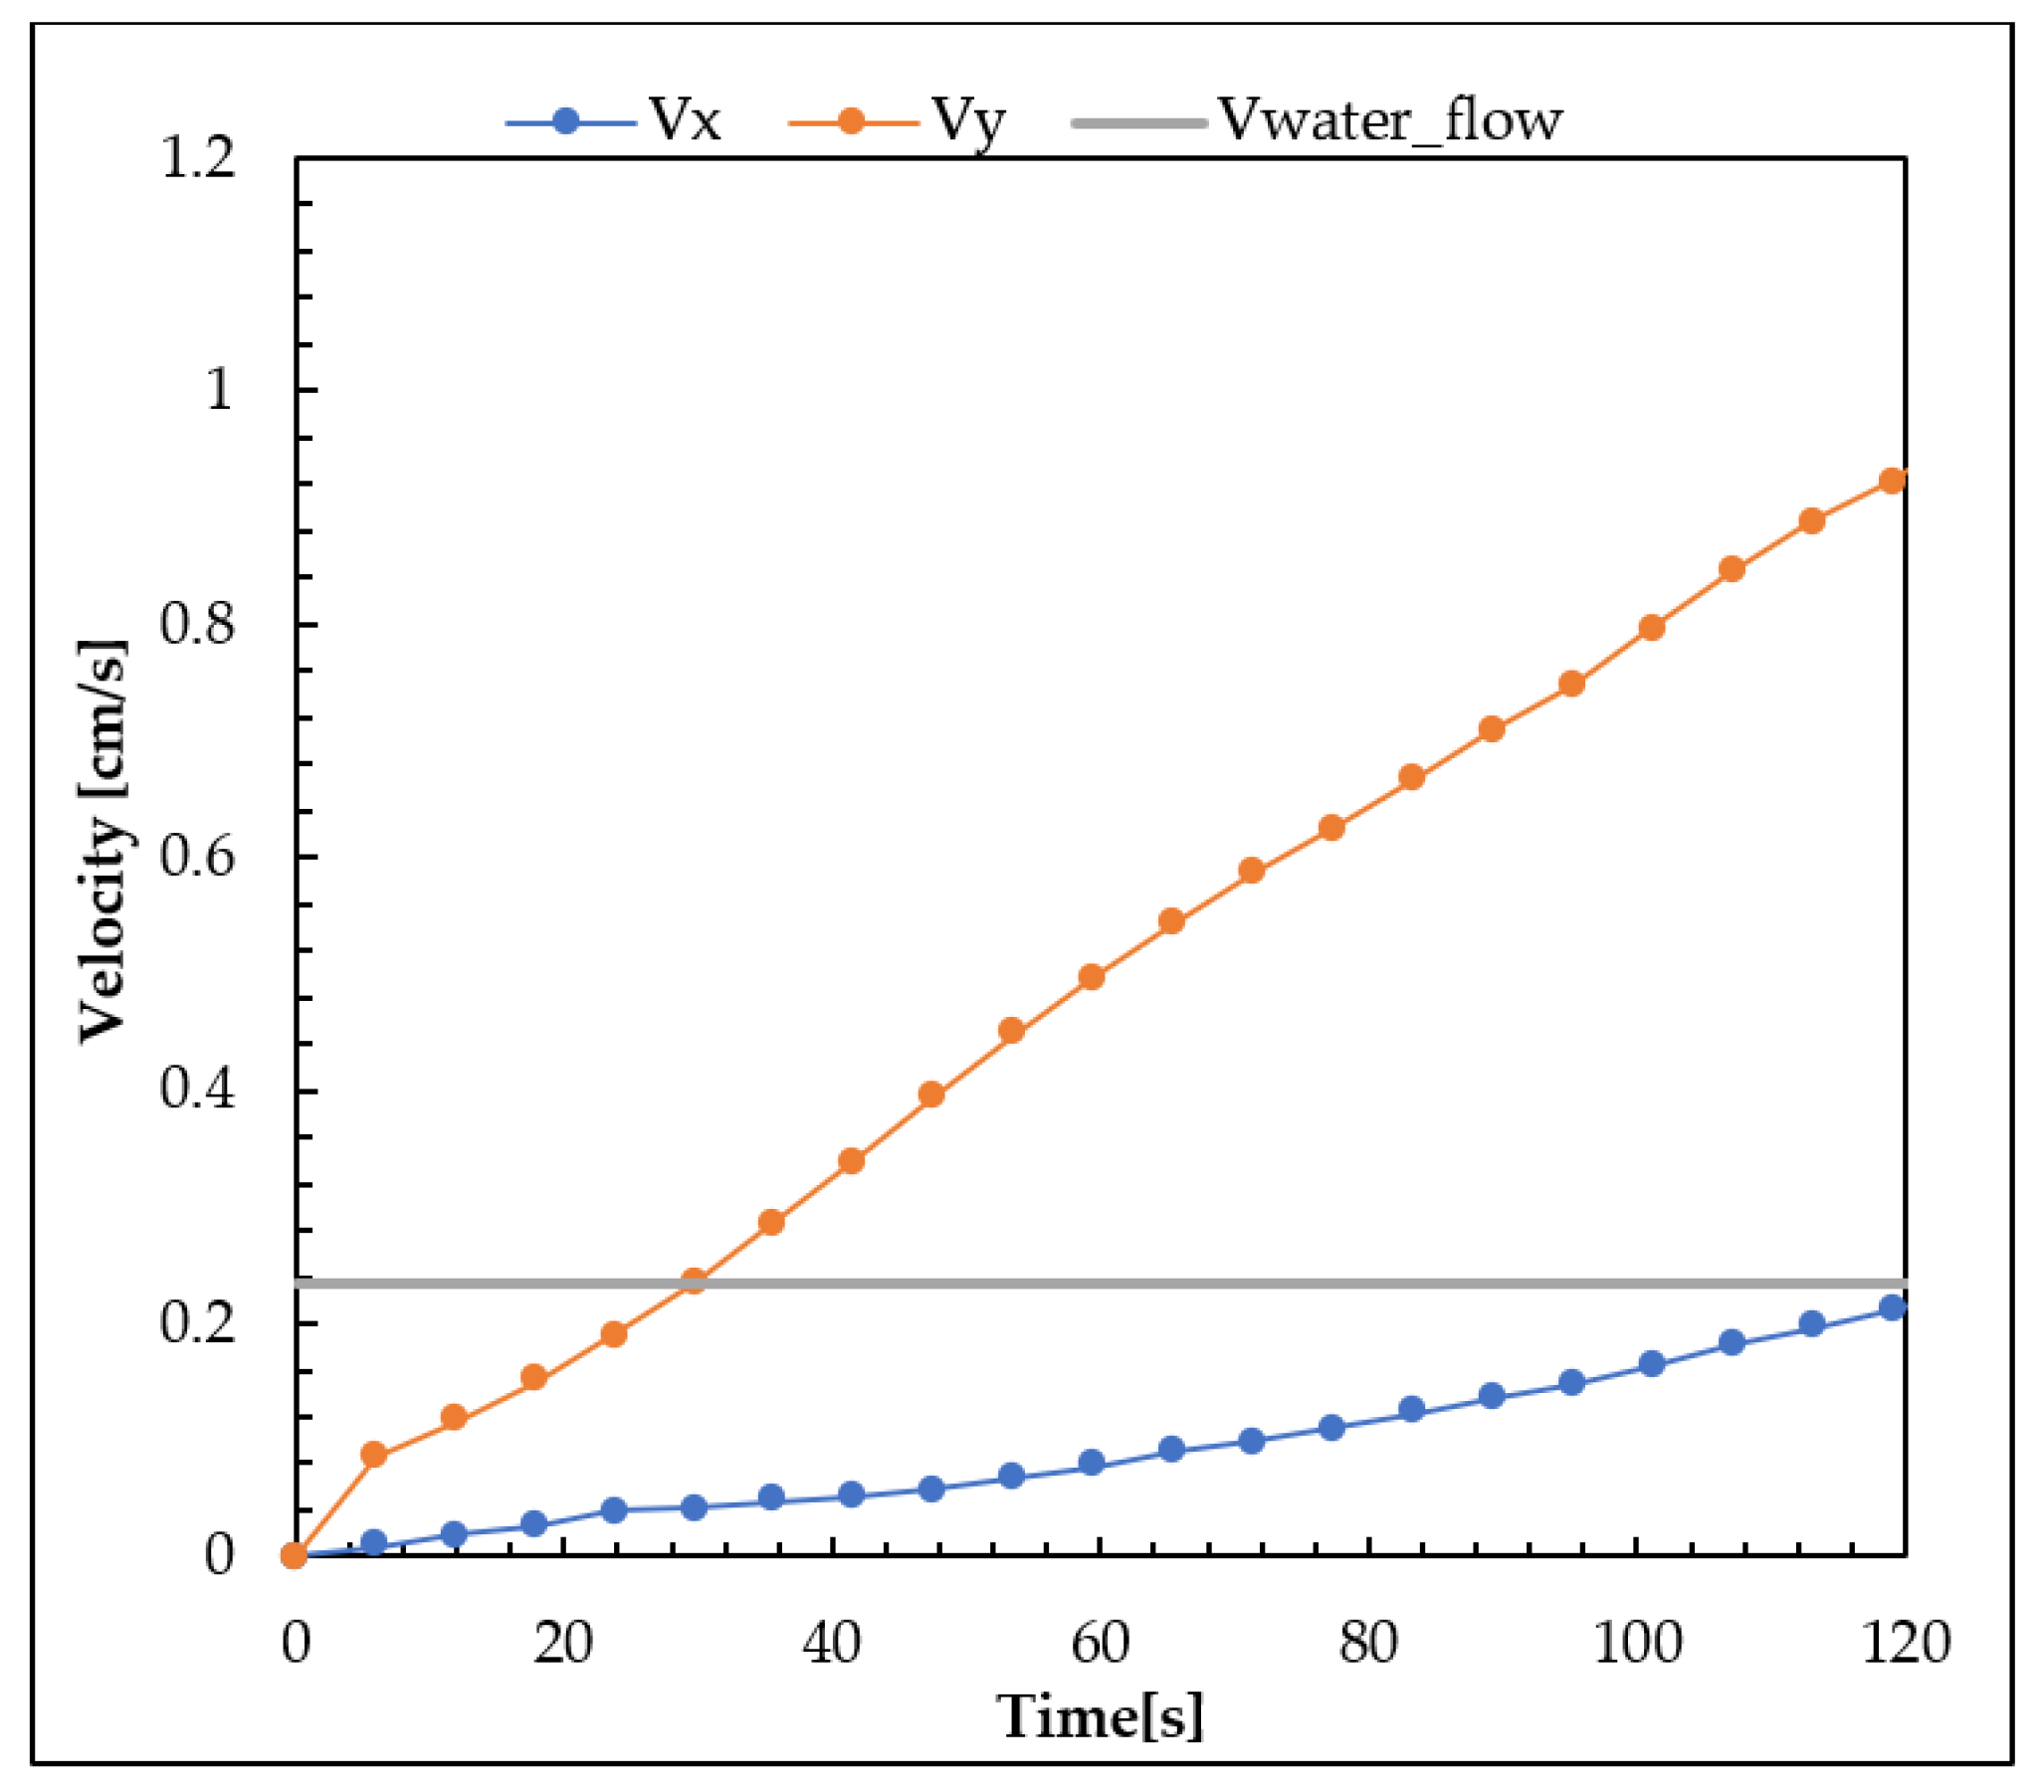
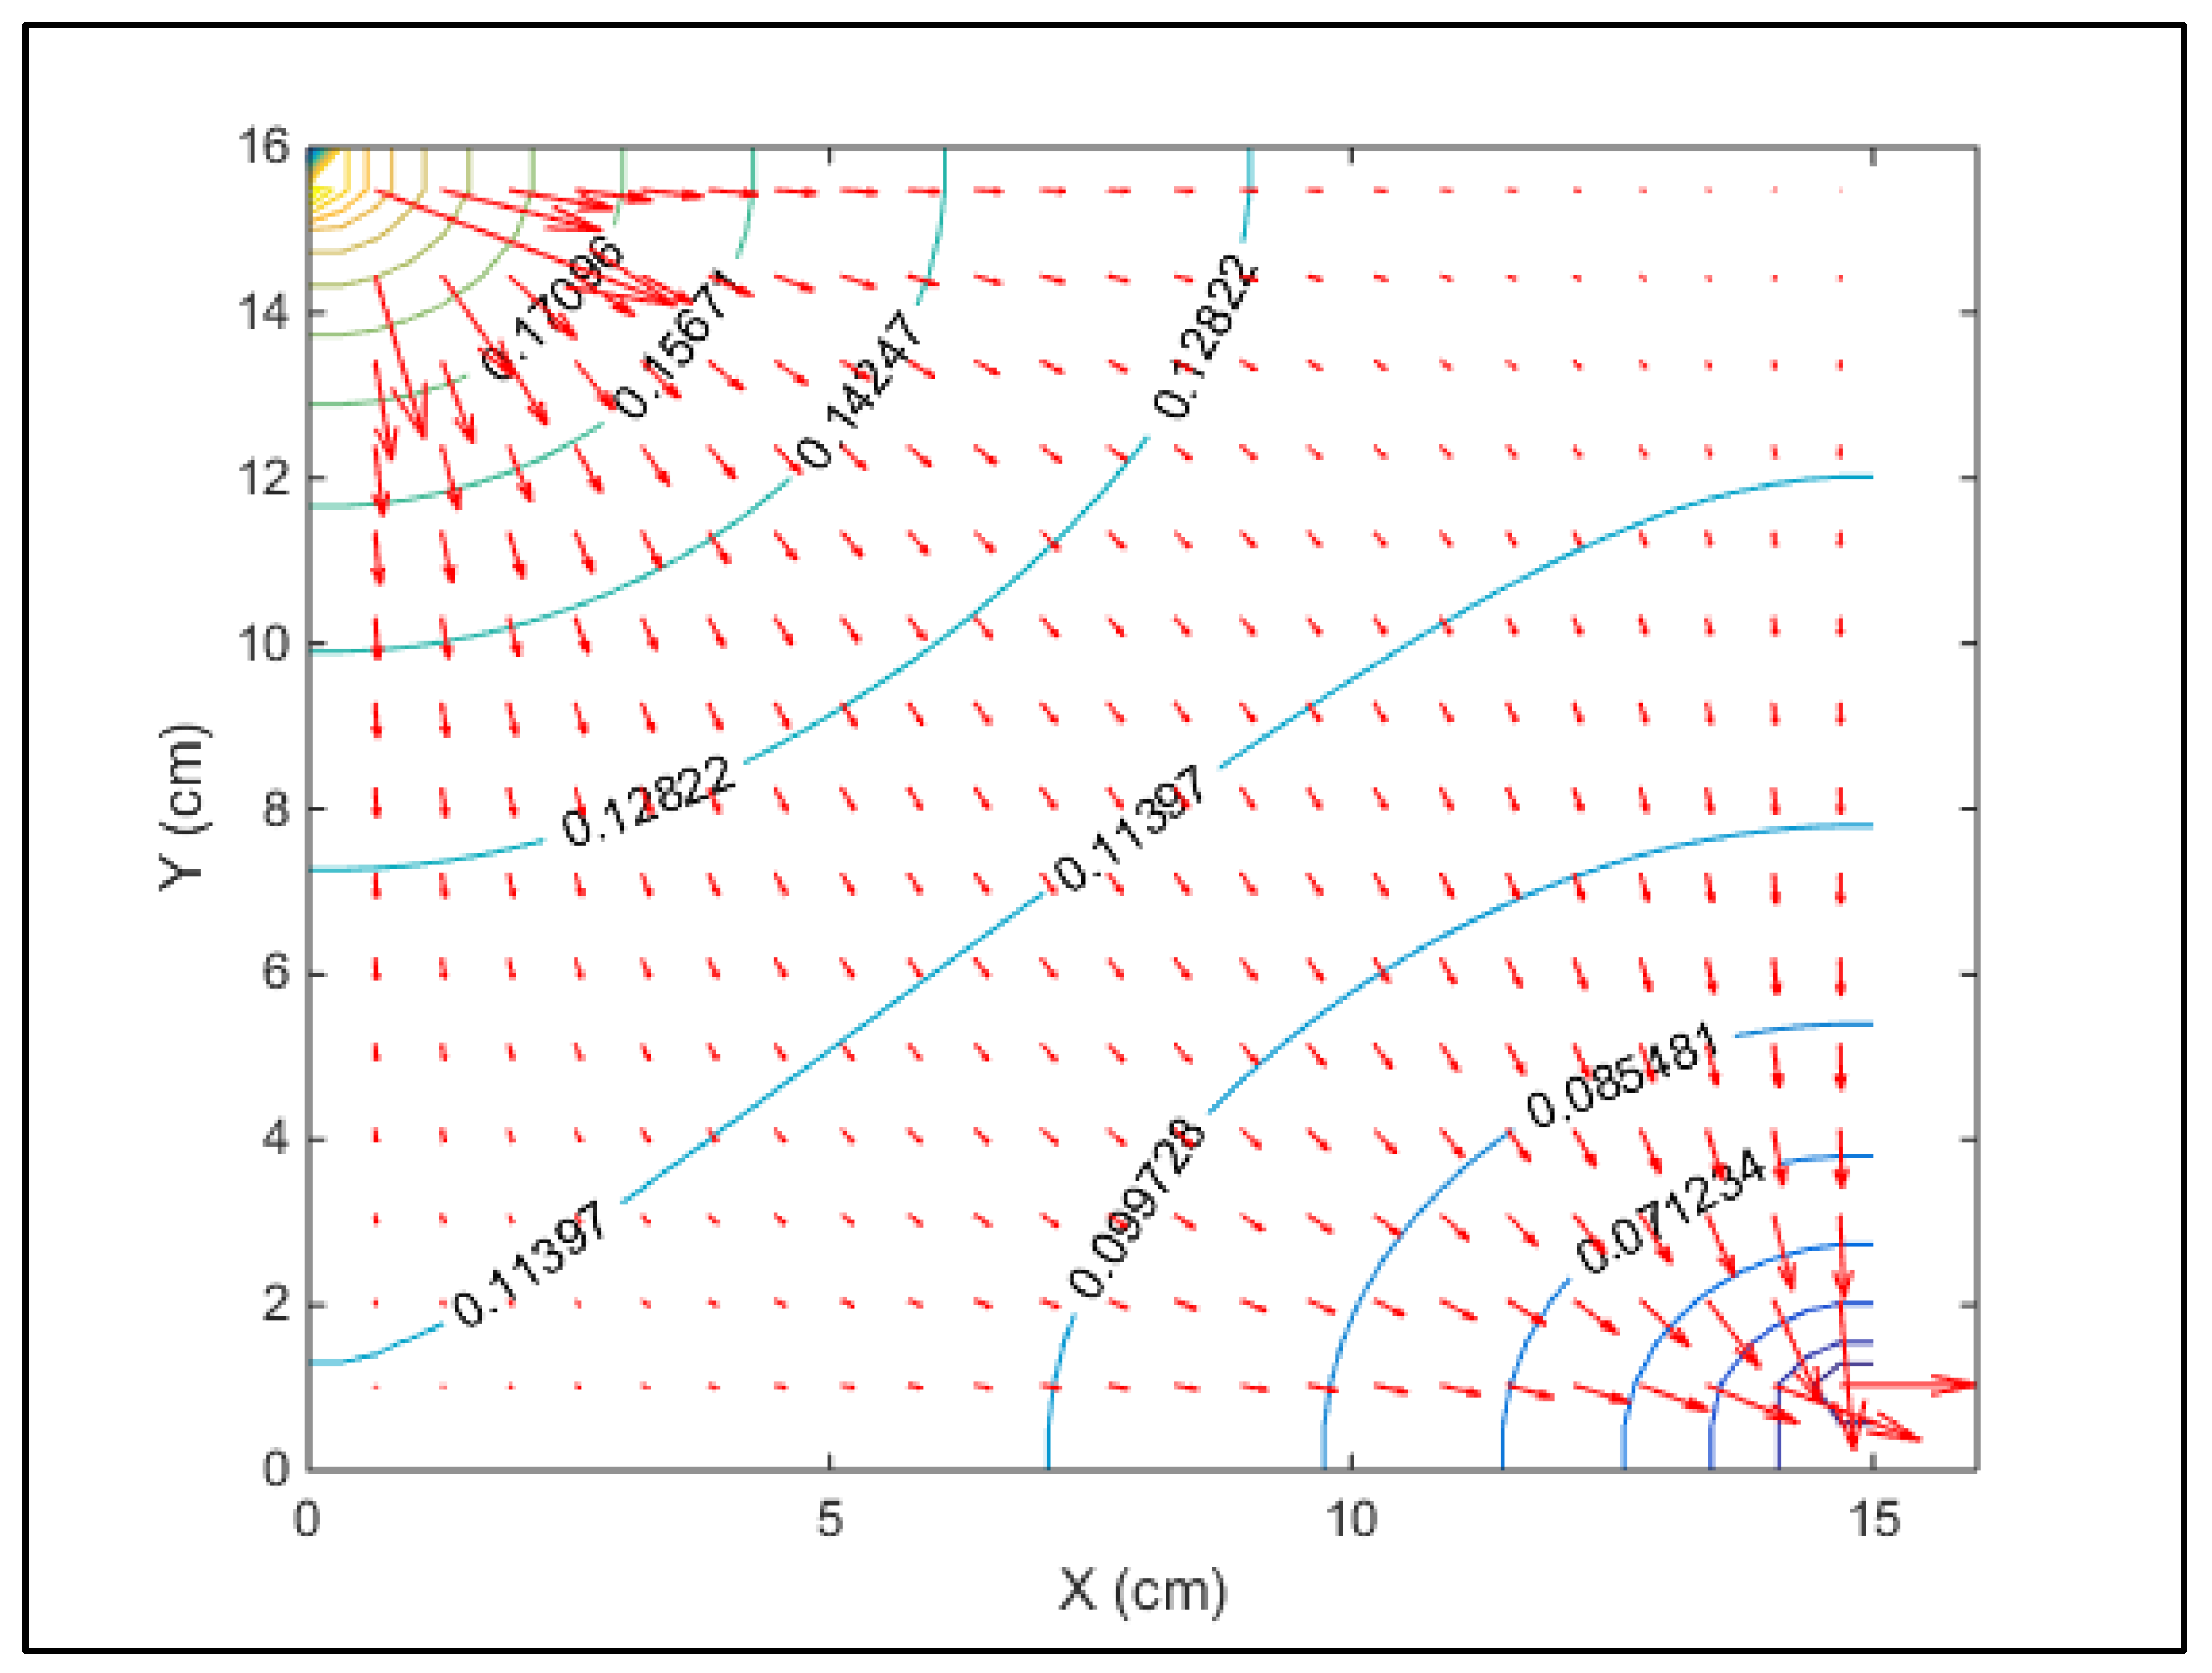
3.1. Nanoparticle Mobility Assessment: Distribution, Velocity, and Barycenter Path
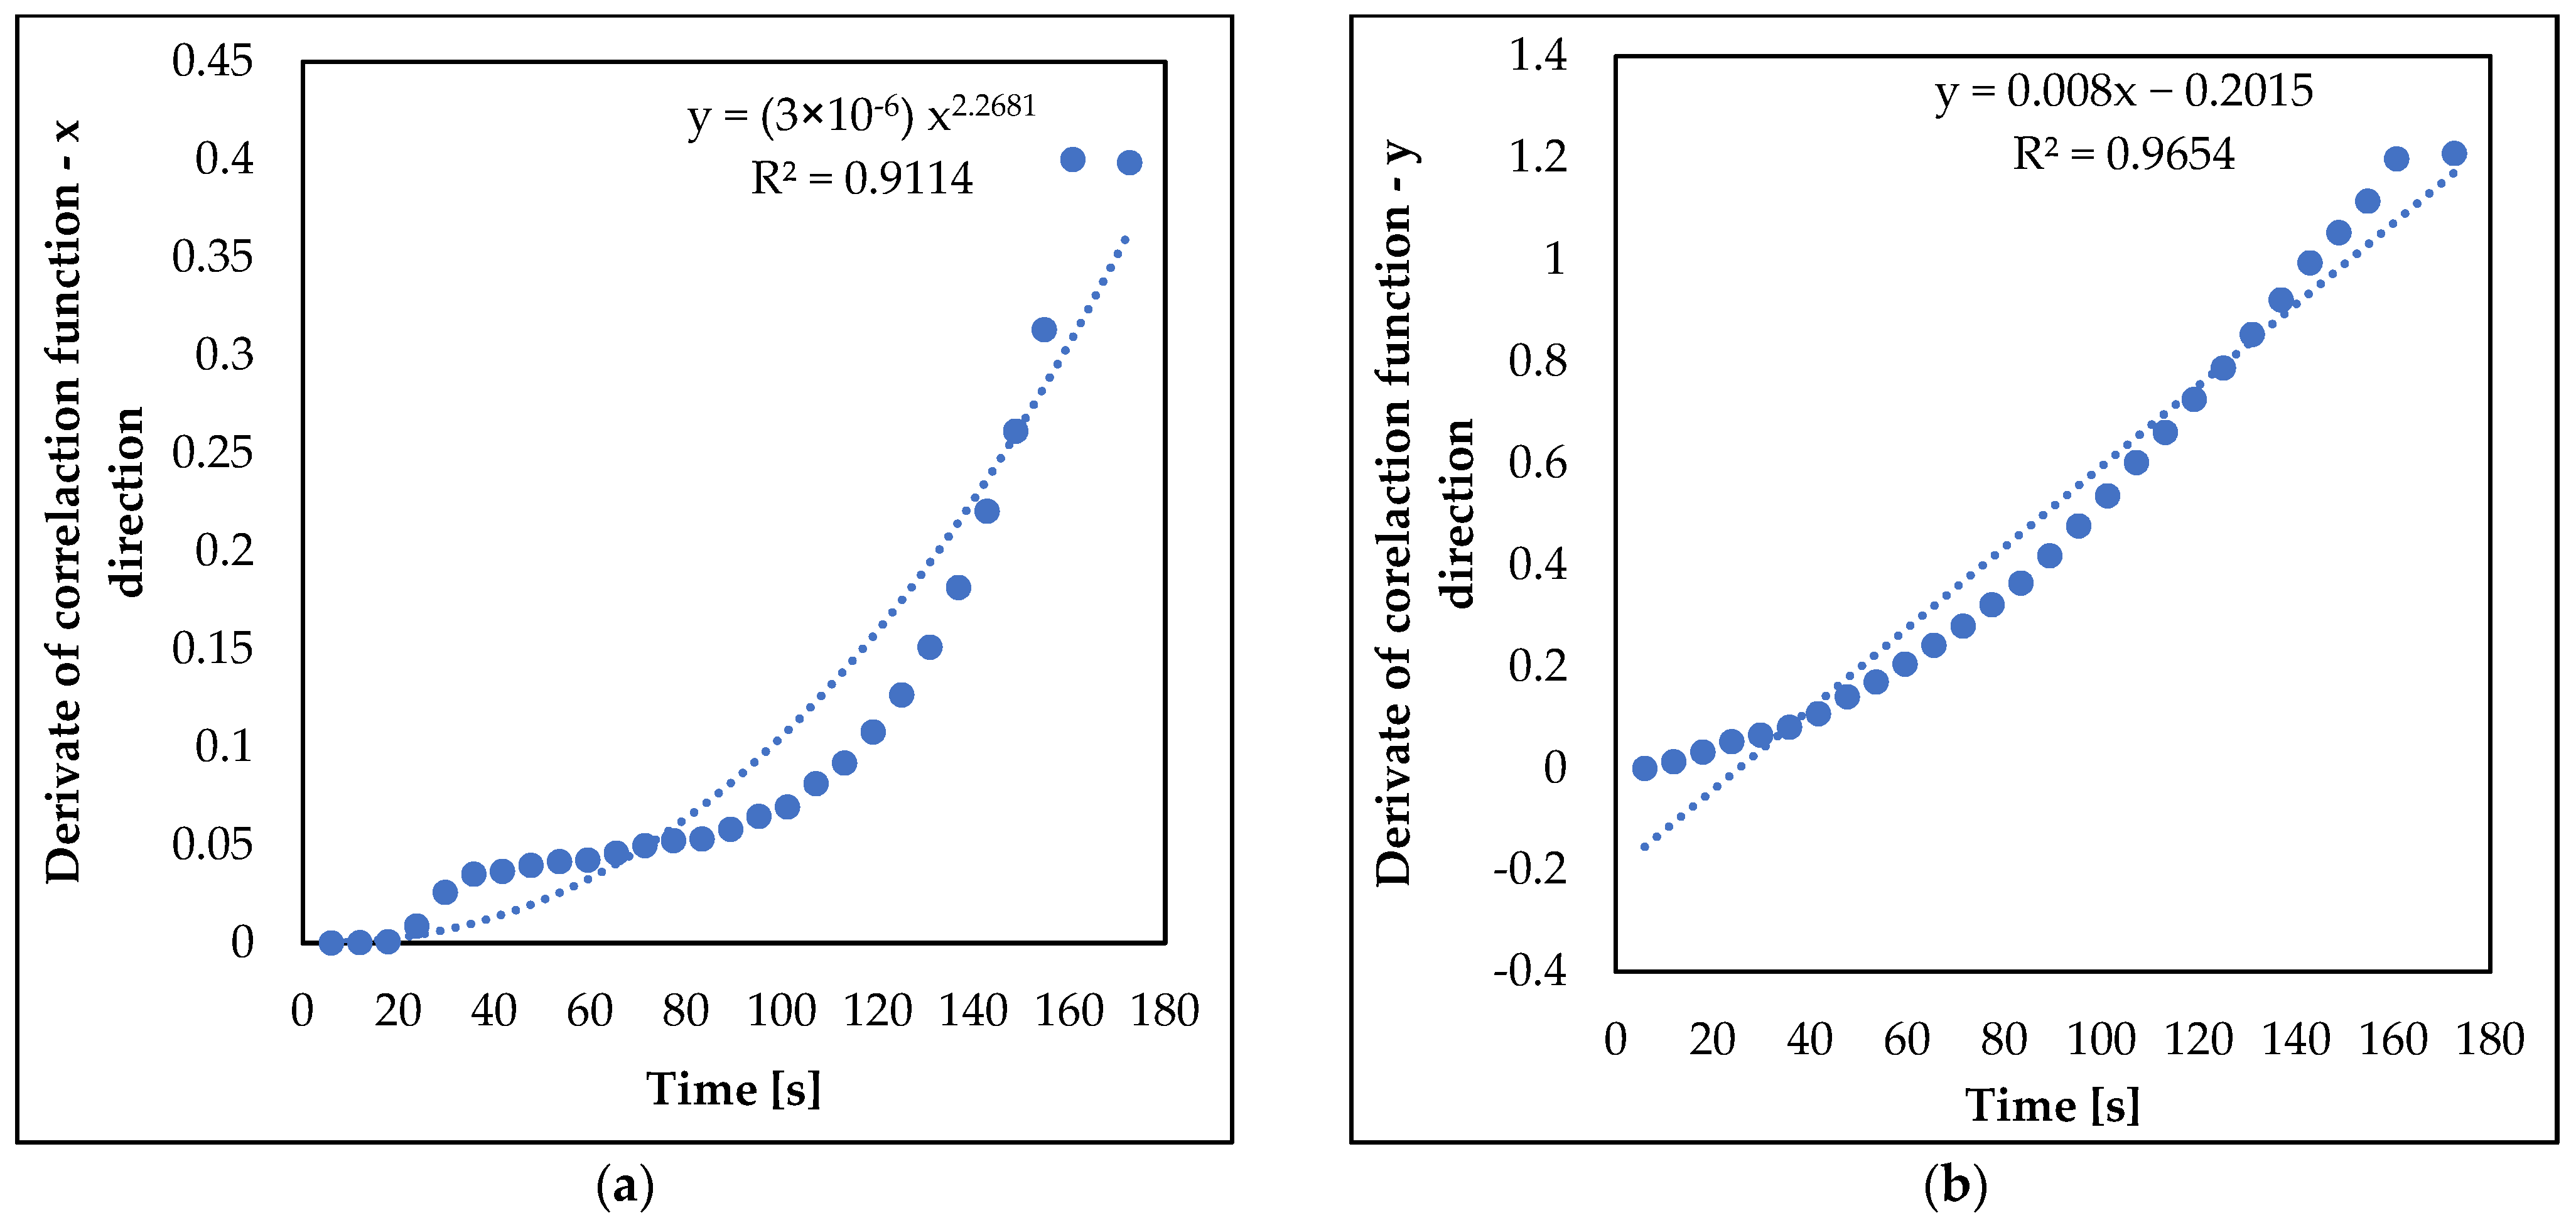
3.2. Analysis of nZVI Plume
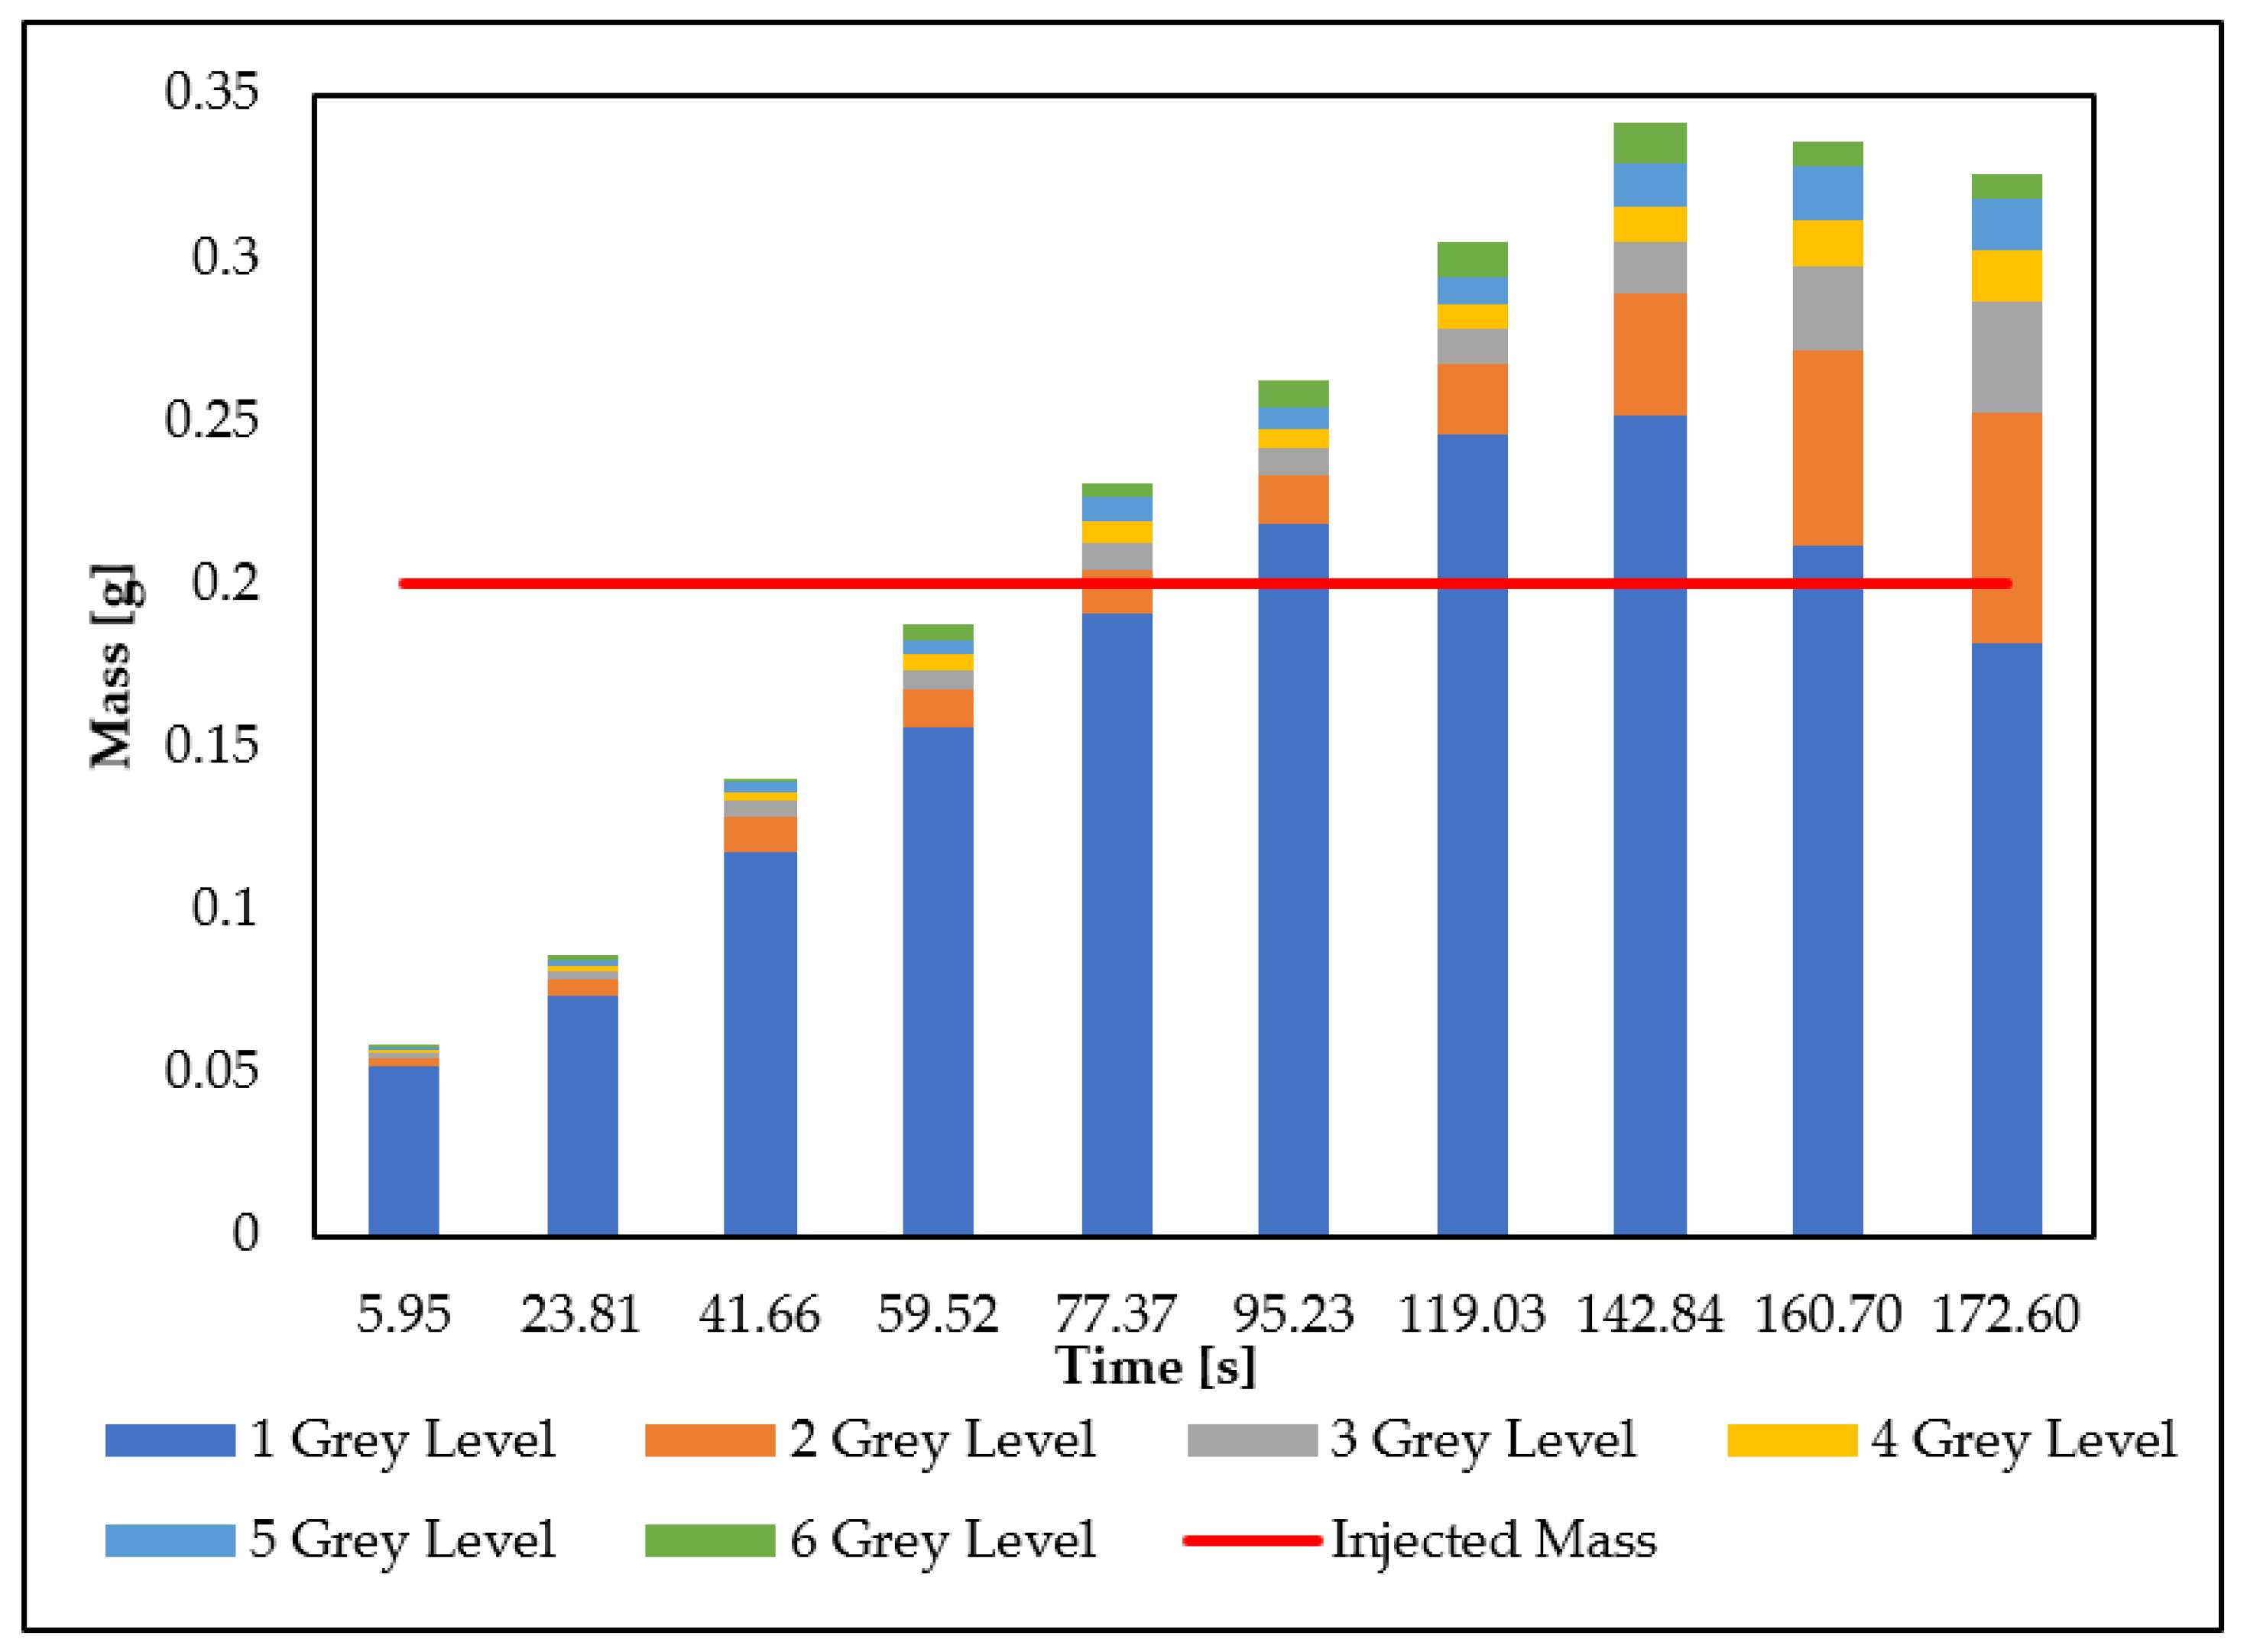
3.3. Mass Balance
- For each image, the same light intensity threshold of the proposed image analysis procedure (a–c) was considered. The intensity threshold applied made it possible to identify the mass of the nanoparticles and isolate them from the porous medium;
- For each image, six light intensity levels of grayscale (r) were considered. The six gray levels were considered individually, with a gray intensity step equal to seven. The gray color levels were set so that the first intervals were characterized by the lower gray values and the last were characterized by the higher gray values, as done for the nanoparticle distribution curves processed;
- For each intensity level of each image, the area occupied by the nanoparticles was calculated with Equation (1);
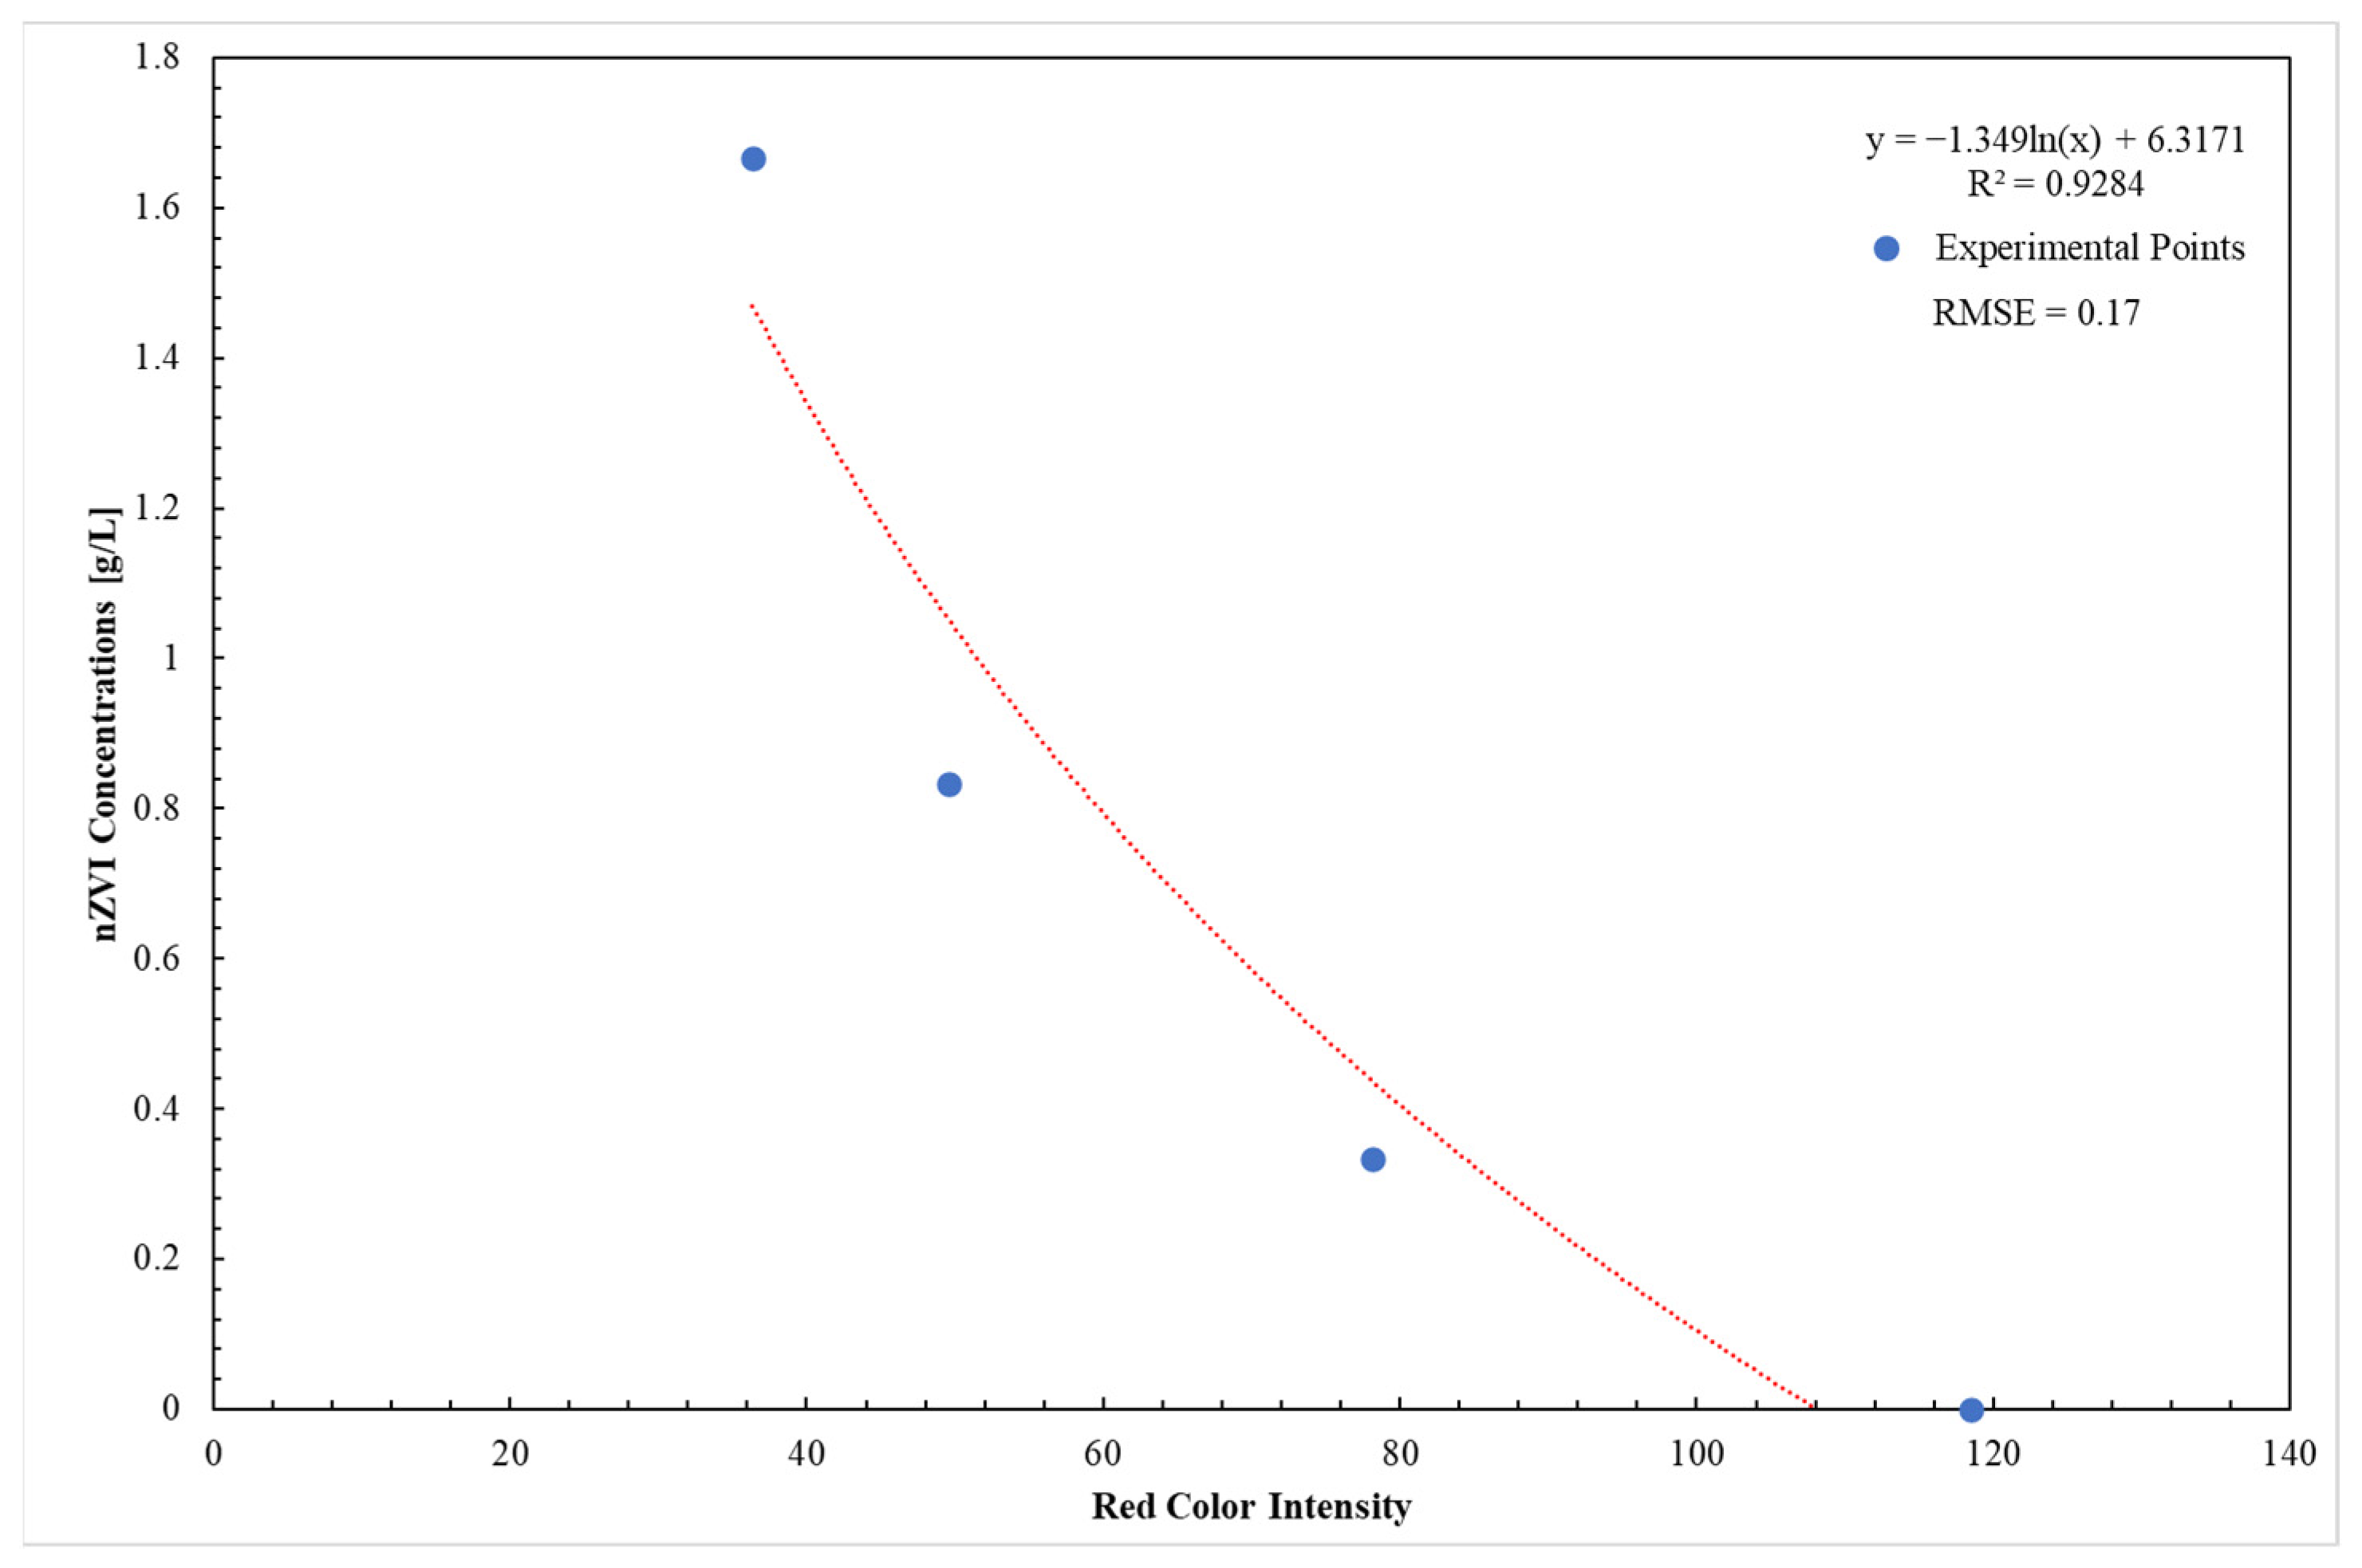
- It is fundamental to apply the same color spectrum (red) to the images in order to compare the results between the different tests. Therefore, the nZVI concentration () was calculated through the following relationship obtained by the calibration procedure:where:
- -
- is the average light intensity value of reference defined for each gray level
- -
- i identifies the image at varying of the time
- -
- e is the porosity (measured) equal to 0.4
- For each gray level, the volume ( occupied by the nanoparticles was calculated with Equation (7). The assumed hypothesis was the nanoparticles were uniformly distributed in the third dimension of the tank (thickness):where:
- -
- is the area occupied by the nanoparticles (cm2)
- -
- s is the thickness of the tank, assumed equal to 3 cm
- The mass () was calculated for each gray level, with the following relationship:
- Knowing the mass of each gray level, the total mass (Mi) was calculated for the image by the following relation:
4. Numerical Model
- -
- C is the concentration of nZVI in the liquid phase;
- -
- S in the solid phase (the pedix i is used for taking into account the possibility of several species of nanoparticles);
- -
- e is the porosity
5. Conclusions
Author Contributions
Funding
Data Availability Statement
Conflicts of Interest
References
- Xue, W.; Huang, D.; Zeng, G.; Wan, J.; Cheng, M.; Zhang, C.; Hu, C.; Li, J. Performance and toxicity assessment of nanoscale zero valent iron particles in the remediation of contaminated soil: A review. Chemosphere 2018, 210, 1145–1156. [Google Scholar] [CrossRef]
- Vilardi, G.; Mpouras, T.; Dermatas, D.; Verdone, N.; Polydera, A.; Di Palma, L. Nanomaterials application for heavy metals recovery from polluted water: The combination of nano zero-valent iron and carbon nanotubes. Competitive adsorption non-linear modeling. Chemosphere 2018, 201, 716–729. [Google Scholar] [CrossRef] [PubMed]
- Cheng, M.; Zeng, G.; Huang, D.; Lai, C.; Xu, P.; Zhang, C.; Liu, Y. Hydroxyl radicals based advanced oxidation processes (AOPs) for remediation of soils contaminated with organic compounds: A review. Chem. Eng. J. 2016, 284, 582–598. [Google Scholar] [CrossRef]
- Wuana, R.A.; Okieimen, F.E. Heavy Metals in Contaminated Soils: A Review of Sources, Chemistry, Risks and Best Available Strategies for Remediation. ISRN Ecol. 2011, 2011, 402647. [Google Scholar] [CrossRef] [Green Version]
- McLaughlin, M.J.; Zarcinas, B.A.; Stevens, D.P.; Cook, N. Soil testing for heavy metals. Commun. Soil Sci. Plant Anal. 2000, 31, 1661–1700. [Google Scholar] [CrossRef]
- Gil-Díaz, M.; Rodríguez-Valdés, E.; Alonso, J.; Baragaño, D.; Gallego, J.R.; Lobo, M.C. Nanoremediation and long-term monitoring of brownfield soil highly polluted with As and Hg. Sci. Total Environ. 2019, 675, 165–175. [Google Scholar] [CrossRef]
- Gallo, A.; Bianco, C.; Tosco, T.; Sethi, R. Ferro zerovalente nanoscopico per la bonifica di acquiferi contaminari. Geoing. Ambient. Min. 2018, 155, 5–16. [Google Scholar]
- Kanel, S.R.; Greneche, J.M.; Choi, H. Arsenic(V) removal from groundwater using nano scale zero-valent iron as a colloidal reactive barrier material. Environ. Sci. Technol. 2006, 40, 2045–2050. [Google Scholar] [CrossRef]
- Liang, Q.; Zhao, D. Immobilization of arsenate in a sandy loam soil using starch-stabilized magnetite nanoparticles. J. Hazard. Mater. 2014, 271, 16–23. [Google Scholar] [CrossRef]
- Martin, J.E.; Herzing, A.A.; Yan, W.; Li, X.Q.; Koel, B.E.; Kiely, C.J.; Zhang, W.X. Determination of the oxide layer thickness in core-shell zerovalent iron nanoparticles. Langmuir 2008, 24, 4329–4334. [Google Scholar] [CrossRef]
- Stefaniuk, M.; Oleszczuk, P.; Ok, Y.S. Review on nano zerovalent iron (nZVI): From synthesis to environmental applications. Chem. Eng. J. 2016, 287, 618–632. [Google Scholar] [CrossRef]
- Lin, Y.H.; Tseng, H.H.; Wey, M.Y.; Lin, M. Der Characteristics, morphology, and stabilization mechanism of PAA250K-stabilized bimetal nanoparticles. Colloids Surf. A Physicochem. Eng. Asp. 2009, 349, 137–144. [Google Scholar] [CrossRef]
- Cundy, A.B.; Hopkinson, L.; Whitby, R.L.D. Use of iron-based technologies in contaminated land and groundwater remediation: A review. Sci. Total Environ. 2008, 400, 42–51. [Google Scholar] [CrossRef] [PubMed]
- Gil-Díaz, M.; Alonso, J.; Rodríguez-Valdés, E.; Gallego, J.R.; Lobo, M.C. Comparing different commercial zero valent iron nanoparticles to immobilize As and Hg in brownfield soil. Sci. Total Environ. 2017, 584–585, 1324–1332. [Google Scholar] [CrossRef]
- Ibrahim, H.M.; Awad, M.; Al-Farraj, A.S.; Al-Turki, A.M. Effect of flow rate and particle concentration on the transport and deposition of bare and stabilized zero-valent iron nanoparticles in sandy soil. Sustainability 2019, 11, 6608. [Google Scholar] [CrossRef] [Green Version]
- O’Carroll, D.; Sleep, B.; Krol, M.; Boparai, H.; Kocur, C. Nanoscale zero valent iron and bimetallic particles for contaminated site remediation. Adv. Water Resour. 2013, 51, 104–122. [Google Scholar] [CrossRef]
- Li, X.Q.; Elliott, D.W.; Zhang, W.X. Zero-valent iron nanoparticles for abatement of environmental pollutants: Materials and engineering aspects. Crit. Rev. Solid State Mater. Sci. 2006, 31, 111–122. [Google Scholar] [CrossRef]
- Schmid, D.; Micić, V.; Laumann, S.; Hofmann, T. Measuring the reactivity of commercially available zero-valent iron nanoparticles used for environmental remediation with iopromide. J. Contam. Hydrol. 2014, 181, 36–45. [Google Scholar] [CrossRef]
- Viotti, P.; Di Palma, P.R.; Aulenta, F.; Luciano, A.; Mancini, G.; Papini, M.P. Use of a reactive transport model to describe reductive dechlorination (RD) as a remediation design tool: Application at a CAH-contaminated site. Environ. Sci. Pollut. Res. 2014, 21, 1514–1527. [Google Scholar] [CrossRef] [Green Version]
- Kanel, S.R.; Manning, B.; Charlet, L.; Choi, H. Removal of arsenic(III) from groundwater by nanoscale zero-valent iron. Environ. Sci. Technol. 2005, 39, 1291–1298. [Google Scholar] [CrossRef]
- Ponder, S.M.; Darab, J.G.; Mallouk, T.E. Remediation of Cr(VI) and Pb(II) aqueous solutions using supported, nanoscale zero-valent iron. Environ. Sci. Technol. 2000, 34, 2564–2569. [Google Scholar] [CrossRef]
- Zhang, W.X. Nanoscale iron particles for environmental remediation: An overview. J. Nanopart. Res. 2003, 5, 323–332. [Google Scholar] [CrossRef]
- Yu, Z.; Hu, L.; Lo, I.M.C. Transport of the arsenic (As)-loaded nano zero-valent iron in groundwater-saturated sand columns: Roles of surface modification and As loading. Chemosphere 2019, 216, 428–436. [Google Scholar] [CrossRef] [PubMed]
- Jiang, Z.; Lv, L.; Zhang, W.; Du, Q.; Pan, B.; Yang, L.; Zhang, Q. Nitrate reduction using nanosized zero-valent iron supported by polystyrene resins: Role of surface functional groups. Water Res. 2011, 45, 2191–2198. [Google Scholar] [CrossRef] [PubMed]
- Prasse, C.; Ternes, T. Removal of Organic and Inorganic Pollutants and Pathogens from Wastewater and Drinking Water Using Nanoparticles—A Review. In Nanoparticles in the Water Cycle; Frimmel, F.H., Niessner, R., Eds.; Springer: Berlin/Heidelberg, Germany, 2010; pp. 55–79. ISBN 9781787284395. [Google Scholar]
- Tratnyek, P.G.; Johnson, R.L. Nanotechnologies for environmental cleanup. Nano Today 2006, 1, 44–48. [Google Scholar] [CrossRef]
- Lin, Y.H.; Tseng, H.H.; Wey, M.Y.; Lin, M. Der Characteristics of two types of stabilized nano zero-valent iron and transport in porous media. Sci. Total Environ. 2010, 408, 2260–2267. [Google Scholar] [CrossRef]
- Tiraferri, A.; Chen, K.L.; Sethi, R.; Elimelech, M. Reduced aggregation and sedimentation of zero-valent iron nanoparticles in the presence of guar gum. J. Colloid Interface Sci. 2008, 324, 71–79. [Google Scholar] [CrossRef]
- Saleh, N.; Sirk, K.; Liu, Y.; Phenrat, T.; Dufour, B.; Matyjaszewski, K.; Tilton, R.D.; Lowry, G.V. Surface modifications enhance nanoiron transport and NAPL targeting in saturated porous media. Environ. Eng. Sci. 2007, 24, 45–57. [Google Scholar] [CrossRef]
- Phenrat, T.; Saleh, N.; Sirk, K.; Tilton, R.D.; Lowry, G.V. Aggregation and sedimentation of aqueous nanoscale zerovalent iron dispersions. Environ. Sci. Technol. 2007, 41, 284–290. [Google Scholar] [CrossRef]
- Ken, D.S.; Sinha, A. Recent developments in surface modification of nano zero-valent iron (nZVI): Remediation, toxicity and environmental impacts. Environ. Nanotechnol. Monit. Manag. 2020, 14, 100344. [Google Scholar] [CrossRef]
- Sun, H.; Wang, L.; Zhang, R.; Sui, J.; Xu, G. Treatment of groundwater polluted by arsenic compounds by zero valent iron. J. Hazard. Mater. 2006, 129, 297–303. [Google Scholar] [CrossRef]
- Kanel, S.R.; Goswami, R.R.; Clement, T.P.; Barnett, M.O.; Zhao, D. Two dimensional transport characteristics of surface stabilized zero-valent iron nanoparticles in porous media. Environ. Sci. Technol. 2008, 42, 896–900. [Google Scholar] [CrossRef] [PubMed]
- Zhang, M.; He, F.; Zhao, D.; Hao, X. Transport of stabilized iron nanoparticles in porous media: Effects of surface and solution chemistry and role of adsorption. J. Hazard. Mater. 2017, 322, 284–291. [Google Scholar] [CrossRef] [PubMed] [Green Version]
- Comba, S.; Sethi, R. Stabilization of highly concentrated suspensions of iron nanoparticles using shear-thinning gels of xanthan gum. Water Res. 2009, 43, 3717–3726. [Google Scholar] [CrossRef] [PubMed]
- Berge, N.D.; Ramsburg, C.A. Oil-in-water emulsions for encapsulated delivery of reactive iron particles. Environ. Sci. Technol. 2009, 43, 5060–5066. [Google Scholar] [CrossRef]
- Kanel, S.R.; Choi, H. Transport characteristics of surface-modified nanoscale zero-valent iron in porous media. Water Sci. Technol. 2007, 55, 157–162. [Google Scholar] [CrossRef]
- Schrick, B.; Hydutsky, B.W.; Bishop, E.J.; Schrick, B.; Blough, J.L.; Mallouk, T.E. Zero-valent metal nanoparticles for soil and groundwater remediation. ACS Natl. Meet. B Abstr. 2004, 228, 2187–2193. [Google Scholar] [CrossRef]
- Yang, C.; Offiong, N.A.; Chen, X.; Zhang, C.; Liang, X.; Sonu, K.; Dong, J. The role of surfactants in colloidal biliquid aphrons and their transport in saturated porous medium. Environ. Pollut. 2020, 265, 114564. [Google Scholar] [CrossRef]
- Yang, C.; Offiong, N.A.; Zhang, C.; Liu, F.; Dong, J. Mechanisms of irreversible density modification using colloidal biliquid aphron for dense nonaqueous phase liquids in contaminated aquifer remediation. J. Hazard. Mater. 2021, 415, 125667. [Google Scholar] [CrossRef]
- Tatti, F.; Papini, M.P.; Sappa, G.; Raboni, M.; Arjmand, F.; Viotti, P. Contaminant back-diffusion from low-permeability layers as affected by groundwater velocity: A laboratory investigation by box model and image analysis. Sci. Total Environ. 2018, 622–623, 164–171. [Google Scholar] [CrossRef]
- Luciano, A.; Mancini, G.; Torretta, V.; Viotti, P. An empirical model for the evaluation of the dissolution rate from a DNAPL-contaminated area. Environ. Sci. Pollut. Res. 2018, 25, 33992–34004. [Google Scholar] [CrossRef]
- Grolimund, D.; Elimelech, M.; Borkovec, M.; Barmettler, K.; Kretzschmar, R.; Sticher, H. Transport of in situ mobilized colloidal particles in packed soil columns. Environ. Sci. Technol. 1998, 32, 3562–3569. [Google Scholar] [CrossRef]
- Werth, C.J.; Zhang, C.; Brusseau, M.L.; Oostrom, M.; Baumann, T. A review of non-invasive imaging methods and applications in contaminant hydrogeology research. J. Contam. Hydrol. 2010, 113, 1–24. [Google Scholar] [CrossRef] [PubMed] [Green Version]
- Konz, M.; Ackerer, P.; Huggenberger, P.; Veit, C. Comparison of light transmission and reflection techniques to determine concentrations in flow tank experiments. Exp. Fluids 2009, 47, 85–93. [Google Scholar] [CrossRef] [Green Version]
- Alazaiza, M.Y.D.; Ramli, M.H.; Copty, N.K.; Sheng, T.J.; Aburas, M.M. LNAPL saturation distribution under the influence of water table fluctuations using simplified image analysis method. Bull. Eng. Geol. Environ. 2020, 79, 1543–1554. [Google Scholar] [CrossRef]
- Flores, G.; Katsumi, T.; Inui, T.; Kamon, M. A simplified image analysis method to study lnapl migration in porous media. Soils Found. 2011, 51, 835–847. [Google Scholar] [CrossRef] [Green Version]
- Sa’ari, R.; Rahman, N.A.; Abdul Latif, H.N.; Yusof, Z.M.; Ngien, S.K.; Kamaruddin, S.A.; Mustaffar, M.; Hezmi, M.A. Application of digital image processing technique in monitoring LNAPL migration in double porosity soil column. J. Teknol. 2015, 72, 23–29. [Google Scholar] [CrossRef] [Green Version]
- Citarella, D.; Cupola, F.; Tanda, M.G.; Zanini, A. Evaluation of dispersivity coefficients by means of a laboratory image analysis. J. Contam. Hydrol. 2015, 172, 10–23. [Google Scholar] [CrossRef]
- Cupola, F.; Tanda, M.G.; Zanini, A. Laboratory Estimation of Dispersivity Coefficients. Procedia Environ. Sci. 2015, 25, 74–81. [Google Scholar] [CrossRef] [Green Version]
- Luciano, A.; Viotti, P.; Papini, M.P. Laboratory investigation of DNAPL migration in porous media. J. Hazard. Mater. 2010, 176, 1006–1017. [Google Scholar] [CrossRef]
- Tatti, F.; Papini, M.P.; Raboni, M.; Viotti, P. Image analysis procedure for studying Back-Diffusion phenomena from low-permeability layers in laboratory tests. Sci. Rep. 2016, 6, 1–11. [Google Scholar] [CrossRef]
- Sappa, G.; Andrei, F.; Viotti, P. Nanoparticles in Envinronmental Applications: First Laboratory Assesments of Nanoparticles Mobility in Porous Media. In Proceedings of the 20th International Multidisciplinary Scientific GeoConference SGEM 2020, Vienna, Austria, 8–11 December 2020; p. 5593. [Google Scholar]
- Keller, A.A.; Garner, K.; Miller, R.J.; Lenihan, H.S. Toxicity of Nano-Zero Valent Iron to Freshwater and Marine Organisms. PLoS ONE 2012, 7, e43983. [Google Scholar] [CrossRef] [PubMed] [Green Version]
- Cenedese, A.; Viotti, P. Lagrangian analysis of nonreactive pollutant dispersion in porous media by means of the particle image velocimetry technique. Water Resour. Res. 1996, 32, 2329–2343. [Google Scholar] [CrossRef]
- Lee, J.; Rolle, M.; Kitanidis, P.K. Longitudinal dispersion coefficients for numerical modeling of groundwater solute transport in heterogeneous formations. J. Contam. Hydrol. 2018, 212, 41–54. [Google Scholar] [CrossRef] [PubMed] [Green Version]
- Chiogna, G.; Eberhardt, C.; Grathwohl, P.; Cirpka, O.A.; Rolle, M. Evidence of compound-dependent hydrodynamic and mechanical transverse dispersion by multitracer laboratory experiments. Environ. Sci. Technol. 2010, 44, 688–693. [Google Scholar] [CrossRef] [PubMed]
- Bear, J. Dynamics of Fluids in Porous Media. Soil Sci. 1975, 120, 162–163. [Google Scholar] [CrossRef] [Green Version]
- Dagan, G. An overview of stochastic modeling of groundwater flow and transport: From theory to applications. Eos Trans. Am. Geophys. Union 2002, 83, 621–625. [Google Scholar] [CrossRef]
- Chrysikopoulos, V.C.; Katzourakis, V.E. Colloid particle size-dependent dispersivity. Water Resour. Res. 2015, 51, 4668–4683. [Google Scholar] [CrossRef]
- Yang, M.; Annable, M.D.; Jawitz, J.W. Light reflection visualization to determine solute diffusion into clays. J. Contam. Hydrol. 2014, 161, 1–9. [Google Scholar] [CrossRef]
- Jones, E.H.; Smith, C.C. Non-equilibrium partitioning tracer transport in porous media: 2-D physical modelling and imaging using a partitioning fluorescent dye. Water Res. 2005, 39, 5099–5111. [Google Scholar] [CrossRef]
- Bennacer, L.; Ahfir, N.D.; Bouanani, A.; Alem, A.; Wang, H. Suspended Particles Transport and Deposition in Saturated Granular Porous Medium: Particle Size Effects. Transp. Porous Media 2013, 100, 377–392. [Google Scholar] [CrossRef]
- Einstein, A. On the motion of small particles suspended in liquids at rest required by the molecular kinetic theory of heat. Ann. Phys. 1905, 17, 549–560. [Google Scholar] [CrossRef] [Green Version]


| Micro Glass Beads | |
|---|---|
| Diameter | 400–800 mm |
| Refractive index | 1.52 |
| Porosity (measured) | 0.4 |
| Bulk density | 1.49 kg/L |
| Hardness (according to Mohs) | ≥6 |
| Nanofer 25S | |
|---|---|
| Compisition mixture | 77% Water 14–18% Iron (Fe) 3% Polyacrylic acid (PAA) 2–6% Magnetite (Fe3O4) 0–1% Carbon (C) |
| Granulometry | d50 < 50 nm |
| pH | 11–12 |
| Specific surface | >25 m2/g |
| Specific gravity | 1.15–1.25 g/cm3 (20 °C) |
| Parameter | Values |
|---|---|
| N. of Pixels in width | 1601 |
| N. of Pixels in height | 1731 |
| Physical width | 15 cm |
| Physical height | 16 cm |
Publisher’s Note: MDPI stays neutral with regard to jurisdictional claims in published maps and institutional affiliations. |
© 2021 by the authors. Licensee MDPI, Basel, Switzerland. This article is an open access article distributed under the terms and conditions of the Creative Commons Attribution (CC BY) license (https://creativecommons.org/licenses/by/4.0/).
Share and Cite
Andrei, F.; Sappa, G.; Boni, M.R.; Mancini, G.; Viotti, P. Mobility of nZVI in a Reconstructed Porous Media Monitored by an Image Analysis Procedure. Water 2021, 13, 2797. https://doi.org/10.3390/w13192797
Andrei F, Sappa G, Boni MR, Mancini G, Viotti P. Mobility of nZVI in a Reconstructed Porous Media Monitored by an Image Analysis Procedure. Water. 2021; 13(19):2797. https://doi.org/10.3390/w13192797
Chicago/Turabian StyleAndrei, Francesca, Giuseppe Sappa, Maria Rosaria Boni, Giuseppe Mancini, and Paolo Viotti. 2021. "Mobility of nZVI in a Reconstructed Porous Media Monitored by an Image Analysis Procedure" Water 13, no. 19: 2797. https://doi.org/10.3390/w13192797
APA StyleAndrei, F., Sappa, G., Boni, M. R., Mancini, G., & Viotti, P. (2021). Mobility of nZVI in a Reconstructed Porous Media Monitored by an Image Analysis Procedure. Water, 13(19), 2797. https://doi.org/10.3390/w13192797