Review

Systematic Review of Flood and Drought Literature Based on Science Mapping and Content Analysis

1
School of Engineering and the Built Environment, Birmingham City University, Birmingham B4 7XG, UK
2
Faculty of Science and Engineering, University of Wolverhampton, Wolverhampton WV1 1LY, UK
*
Author to whom correspondence should be addressed.
Water 2021, 13(19), 2788; https://doi.org/10.3390/w13192788
Submission received: 30 August 2021 / Revised: 30 September 2021 / Accepted: 30 September 2021 / Published: 8 October 2021
(This article belongs to the Special Issue Modelling of Floods and Droughts under a Changing Climate)

Abstract

:
The severity and frequency of flood and drought events have increased in recent decades. These climate change-induced and anthropogenic stressors on water resources represent the leading water-related hazards to communities. Further, the increasing exposure of the population and infrastructure to such events has heightened the risks. Assessing the impact scope of these events in different subfields towards comprehensively evaluating the risks requires an unbiased systematic approach. This paper combines content analysis and science mapping to investigate the existing multidisciplinary body of knowledge on analyzing flood and drought together. Searching the literature using selected search terms yielded a sample of 119 publications. Initially, various contents, such as the authors’ keywords, applied methods and indices, and study scale, were extracted from these articles. These contents were then incorporated into the science mapping technique to form communicative networks. Analyzing these publications revealed 13 major research themes, with a sustained focus on hydrological issues. However, a more diverse range of themes was recently revealed, including economy, sociology, insurance, and policymaking. Producing such computational and visual networks explained informative insights that can help further develop both existing and new frameworks to support the management, design and policymaking sectors in responding to both flood and drought events.

1. Introduction

Flood and drought are examples of water-related hazards that have caused enormous damages to human communities in recent decades. These natural extremes that are highly associated with climate change-induced risks could lead to further anthropogenic disasters if not managed appropriately [1,2,3,4]. Such risks with societal interconnections are influenced by increasing population exposure, partly due to urbanization, water resource stress and management strategies [5,6,7]. Flooding and drought hazards represent two extremes of the same hydrological cycle, which have been researched extensively using different subsets of some similar datasets. However, there is an increasing trend for these hazards to occur consecutively or sometimes even simultaneously [8,9]. Thus, at present, there exists only one water resource management system for coping with these extremes, leading to various short-term and long-term stresses towards mitigating the risks [10,11,12,13,14]. From the socio-economic perspective, water-related hazards in areas under urbanization have been the cause of around 90% of the disastrous events during the last century, and losses have increased five times since the early 1980s [15,16].
Research on hydro-hazards often concentrates on either flood risks or drought risks, whilst these are two extremes of the same hydrological cycle [8,10]. This paper systematically reviews studies that have analyzed combined flood and drought events or issues around them. These studies could be alternative floods and droughts or simply the combined risk that water resource systems may experience during their lives.
Explaining and quantifying flood and drought issues together represents a complex yet challenging area of research [17] and requires implicating various methods and indices. The literature on analyzing flood and drought issues discusses different perspectives ranging from water resources [18,19,20], to climate change [21,22,23,24,25,26,27], urban and landscape planning [15,28,29], ecology [30,31,32,33] socio-economy [34,35,36], policymaking [37,38], water quality [39,40] and even abrupt alternation/coexistence [41].
The fact that these extreme phenomena have been recognized by various study fields shows its importance and extent. Alternatively, it adds, to some degree, more complexity to modelling flood and drought risks and exposure. One reason for this is that some approaches of the mentioned research fields tend to have issues that are contradictorily or slightly overlap. Since the early 2000s after the ecologic resilience concept was first introduced, combined flood and drought issues began to develop [42]. Following from this, many organizations and research studies have attempted to create data platforms and directives to tackle some of the challenges involved in analyzing and modelling these extreme events, such as data availability and management criteria [43]. For example, the United Nations Environment Program/Global Resource Information database-Europe (UNEP/GRID-Europe); Project for Risk Evaluation, Vulnerability, Information and Early Warning (PREVIEW); EU Flood Directive; and Global Assessment Report (GAR) are some of the available data/criteria platforms. However, thus far, there is a lack of general reviews on various existing research directions and trends inhibiting the advancement of this important field of climatic research.
Hence, this paper aims to deliver a comprehensive synthesis of research themes (e.g., hydrology, climate change, economy and sociology) around the literature that has analyzed both flood and drought topics to depict an overview of the applied methods and indices, including the emerging trends and thematic areas. Scientists have made numerous efforts in reviewing the challenges in modelling flood and drought events and identifying widely accessible datasets [5,17,44]. Nevertheless, this paper provides a systematic literature review and an overall evaluation, encompassing all the research themes surrounding the flood and drought body of knowledge. This approach benefits from the novel application of a combination of content analysis and science mapping techniques, based on network theory [45], to extract the relevant information and inputs in seeking to evaluate the connections and patterns amongst the research themes and methods [46,47]. Science mapping, also known as scientography or knowledge domain maps, is a visual representation of the formation and dynamics of scholarly knowledge [48,49,50], which is usually produced by studying extensive collections of scientific publications [51]. This technique could help identify the main topics within a particular scientific field or their relationship to one another and its development over time. It could also demonstrate the factors that define the emergence of the latest interdisciplinary scientific developments [52].
This review paper, therefore, seeks to: (a) identify the main research themes that have emerged around combined analyses of flood and drought topics; (b) identify the methods and indices used in such fields; and (c) quantify their connections and patterns in order to help inform the development of a framework to recognize how flood- and drought-induced risks relate to creating more resilient communities. This combined approach followed a step-wise, systematic process commencing with recognizing the study aims and the dominant research themes in addressing flood and drought at the same time, in addition to understanding the extent to which the literature around flooding and drought research addresses existing and upcoming water-related risks.

2. Materials and Methods

As the initial stage, the approach method investigated the English-written scientific literature (articles, book sections and conference proceedings) that addressed both flood and drought between 2000 and April 2021 This investigation was conducted using a combination of “systematic review”, “content analysis”, and “science mapping” approaches [46,47]. The first two, “systematic review” and “content analysis”, were used to extract and analyze content-wise information on keywords, research themes, applied methods and indices. Datasets prepared by this information were then used as input for the science mapping technique, which calculated the social network analysis metrics and produced graphs of each of the undirected weighted networks.
All the network metrics were computed automatically by using NodeXL (Social Media Research Foundation, 2017), and the graphical demonstrations were performed in Gephi (Gephi Consortium, 2017). To adjust the location of the labels, the SVG files were then exported from Gephi to Inkspace graphical editor.
The process of searching by topic (i.e., titles, abstracts, and keywords) in relation to the flood and drought terms used the Web of Science Core Collection, including its five additional datasets, and the Scopus database. After filtering the non-English, duplicate and irrelevant elements, a sample of 119 articles and conference proceedings (as shown in the list S1 in the supplementary materials) were found to match the criteria. For each article, we extracted the following data: authors’ keywords, research domain, study area, methods and applied indices. These data were first analyzed as a network, based on the network theory, which links every publication to one another. In this method, publications are considered as “nodes”, and the connections are called “edges” [45]. Extracted data from every publication (e.g., keywords, methods or indices) were paired using an undirected edge. If the same pair was repeated in another publication, the weight of the edge was added by one step. Iterating the same process for all publications produced an undirected weighted network [45].
To describe the produced network of nodes and edges, which basically attempts to explain how much central/far away and well-connected/isolated a topic is, we applied metrics particularly to social network interpretation. These metrics were: for “nodes”, degree centrality and betweenness centrality; for edges, weight; and for overall network, density, average geodesic distance, and average clustering coefficient [47]. In our analysis, the degree of a node represents the potential communication activity of the node which makes it a popular node, and it is more likely to hold most of the information [53]. The term “Betweenness centrality” of a node describes the number of shortest paths going through a node, which can be an index of the control it has over the communication dynamics of the network [53]. As for the edge (connections), its weight can be a number of any type representing various parameters, such as affinity, connection costs or distance [54]. However, in this study, it was used to count the number of repetitions of identical edges, as recommended in [47].
In searching the essential scientific materials and parameters on the concept of flood and drought, we inspected the authors’ keywords, methods and indices (Table S1 in the supplementary materials) which were extracted in accordance with the standardized process below
  • Using singular instead of plural (e.g., river instead of rivers);
  • Using all caps or small caps (e.g., Climate Reanalysis, China);
  • Choosing the abbreviated form (e.g., SPI instead of Standardized Precipitation Index; HDI instead of Human Development Index).
In line with the main aim of this paper, two networks, namely, keywords, research materials and applied indices, were created and analyzed to find main themes and methods of research around the concept of evaluating/analyzing flood and drought extremes. The next phase involved using the combined method of systematic literature review and content analysis [46] in assessing the critical themes and the derivation of rich insights around the flood and drought topic. This combined approach draws on the benefits and privileges of both the systematic review and content analysis methods. Systematic review gathers enormous intelligence around the topic [55], whilst content analysis groups accurate qualitative and quantitative interpretation of textual data [56].

3. Results and Discussions

The results from the 119 papers in the analyzed database are presented in Figure 1, Figure 2, Figure 3 and Figure 4. These results are derived from the authors’ keywords, publication year and main research themes using a combination of content analysis and science mapping methods.

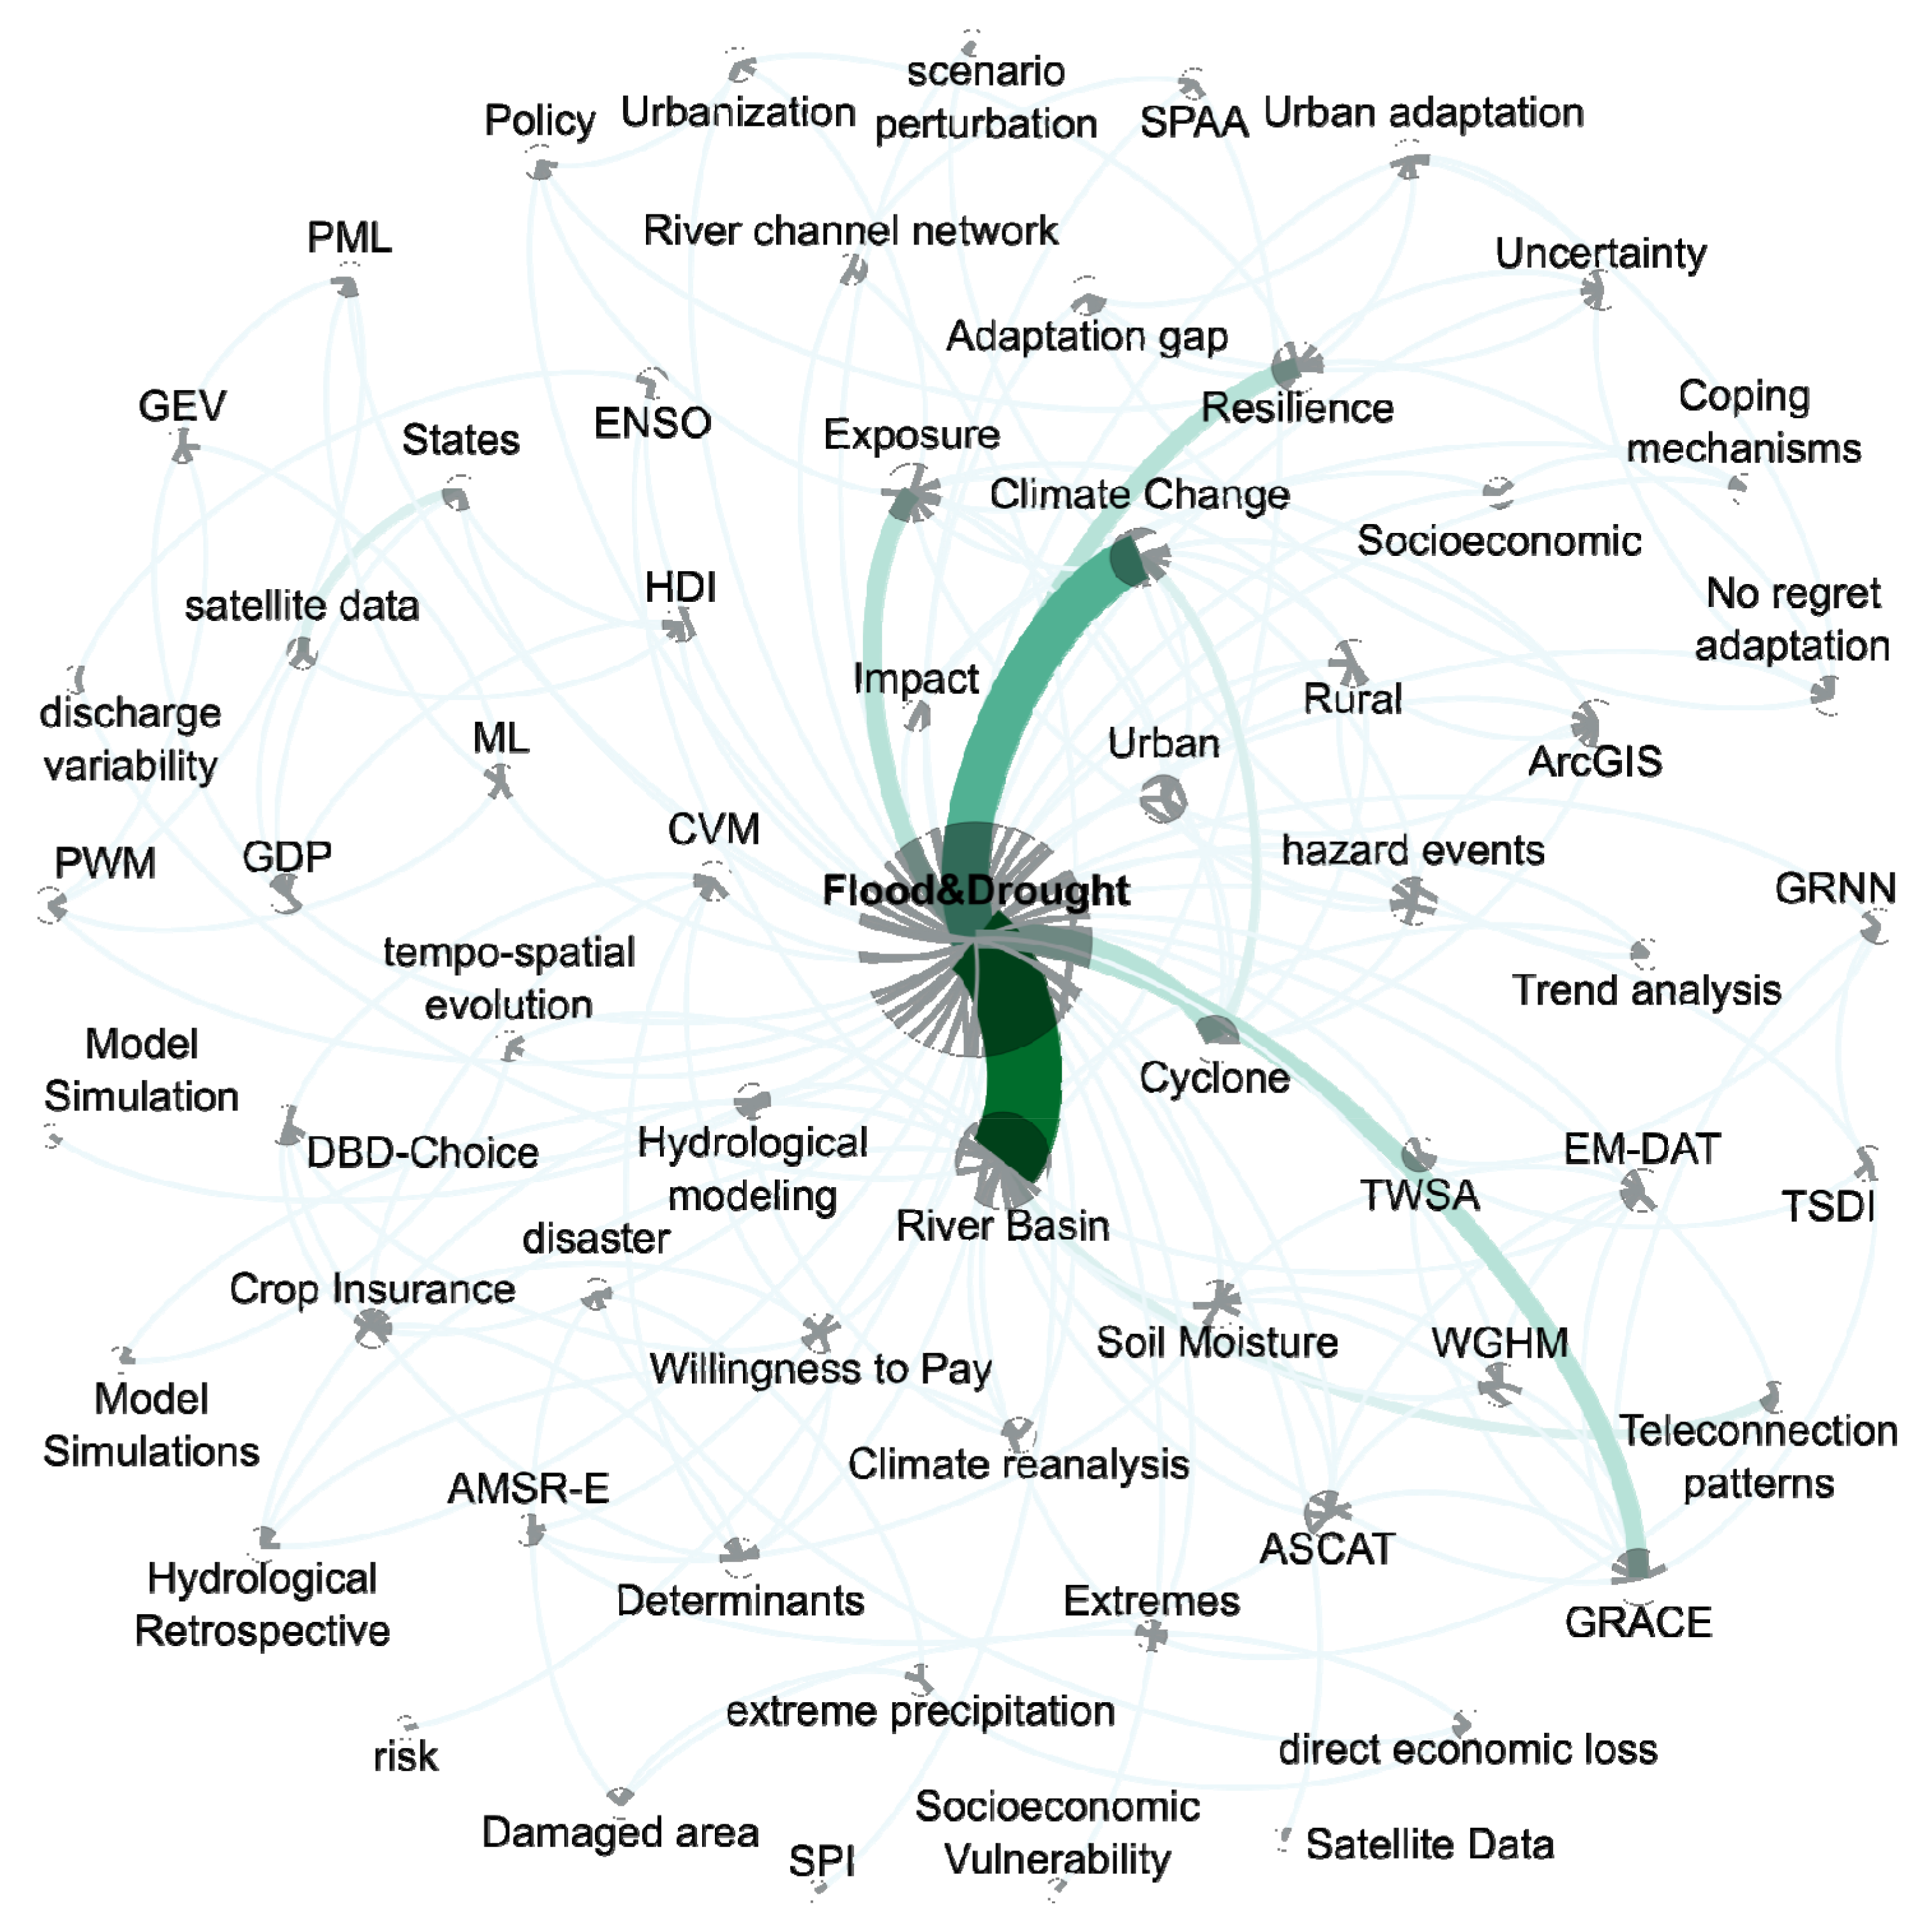
3.1. Analysis of the Authors’ Keywords

Among the 119 papers, a total of 389 author’s keywords were analyzed. The network formed by these keywords was characterized by a relatively low density (0.086), a high average geodesic distance (1.97), and a high average clustering coefficient per node (0.821). The low density and high average geodesic distance here describe a relatively dispersed network that has fewer links between outer nodes (authors’ keywords) than to the central node (“Flood&Drought”). This could be true because there is no meaningful linkage amongst various research fields, except for flood and drought. The most important keywords in the network, in terms of both high degree and high betweenness, were “Flood & Drought”, “River Basin” and “Climate Change” (Table 1). Only 3% of the authors’ keywords showed both degree and betweenness centrality simultaneously above the average of the network, meaning that there were just a few topics that hold the most focus on the investigated scientific maps within the research network attempting to encompass both flood and drought in the systems. Therefore, based on the results from Figure 1 and Table 1, it can be interpreted that the general body of research around the flood and drought combined analysis in the last two decades has concentrated on the river basin scale with a focus on climate change and a willingness to spatially estimate the level of exposure to such risks towards creating more resilient communities. It can be observed that the other central nodes with the following high degrees were “Exposure”, Gravity Recovery and Climate Experiment (“GRACE”) and “Resilience”. Critical nodes in the network, with high betweenness, were also “GDP”, “ENSO” and “tempo-spatial evolution”. The strongest relations were, respectively, between “Flood & Drought” and “River Basin” (six articles); “Climate Change” (four articles); “GRACE”, “Resilience” and “Exposure” (each with two articles).
Betweenness centrality is the number of shortest paths passing through each node. The nodes mentioned in Table 1, especially those with larger betweenness values, such as Flood & Drought, River Basin and GDP, control the communication among other nodes and influence the flow around the system of the authors’ main domains of research. These nodes could also be considered as hubs through which information can travel to different subsections or themes, as shown in Figure 1.
The first outcome that Figure 1 depicts is the diversity of topics around the flood and drought events when it is intended to analyze them together. These topics have been of interest to the authors of publications, ranging from hydrology, economy and climate change to remote sensing applications and policymaking. The nodes in this illustration are sorted based on their degree of centrality, and the higher the degree, the higher the number of nearest neighbors or direct contacts [48]. The fact that the node representing “flood& drought” is larger than others by a great order means that it has been the central research focus of the selected publications, which could be seen as a further confirmation of the validity of the publication selection process. The size of the circles is proportional to their degree of centrality, and for graphical purposes, it ranges between 10 and 80. This means that the circle (node) with the greatest degree of centrality is showed by the scale of 80, whereas the circles with the lowest degree have a scale factor of 10. After filtering out some of the original authors’ keywords based on the above-mentioned criteria, a total number of 64 keywords was selected for presentation purposes.
Using original keywords with consideration of the paper’s main aim, showing the primary points around the combined analysis of flood and drought, revealed that many individual studies have used the same methodology and indices to address floods and droughts, as well as any issues relevant to these events. This could mean that looking into these events separately or independently has seen a shift towards a simultaneous analysis.
Nodes within the second-class size are “river basin”, “climate change”, “exposure”, “resilience”, and “GRACE”, which form the most connected research domains around the combined flood and drought topics (“Flood & Drought” node). The width of connections (hereafter called edge) is a numeric label associated with each edge representing many features of the given system, such as costs or affinity [49]. In this study, the edge width is equal to the number of identical edge repetitions. This feature is also identified by the color scale for visual purposes, meaning edges with a darker color represent a higher number of repetitions. As Figure 1 demonstrates, the highest number of connections are between “flood & drought” and “river basin”, “climate change” “exposure” and “GRACE”, respectively. Accumulating the keywords and selecting those more related to research after filtering out basins, rivers, countries, and very technical terms [47] helped identify the extent of studies on the combined analysis of flood and drought. As Figure 1 demonstrates, researchers have tried to address various issues around this subject, ranging from methods, indices and concepts to policies and consequences. Therefore, keywords are not homogenous or concentrated in one specific field.

3.1.1. Spatial Scale of Studies

Most of the organizations involved in tackling issues with floods and droughts deal with the problems locally. For example, city councils or local water companies under the guidance of regional or national governments try to solve hydro-hazards within their jurisdiction. However, it imposes risks on broader scales, as many problems in this field are not limited to the spatial coverage of these organizations’ responsibilities. Reviewing the literature on studies encompassing both flood and drought analysis suggests that “river basin” instead of current local or regional scales could be the best spatial scale for decision making, adopting strategies and managing water resources.

3.1.2. Managing Risk

During the second decade of this century, water resource management has seen a shift from controlling flood and drought hazards towards managing risk [10] using coping mechanisms, urban adaptation, mitigating exposure and socioeconomic strategies. For instance, rapid drought–flood alternations in Missouri, 2002–2007, and California, 2011–2017, have placed a large amount of stress on water resource management plans [17].
These strategies, which are trade-offs between short-term flood control and long-term water storage [13], could restrict their capacity to cope with extreme events and adaptation gaps if considering floods and droughts independently.

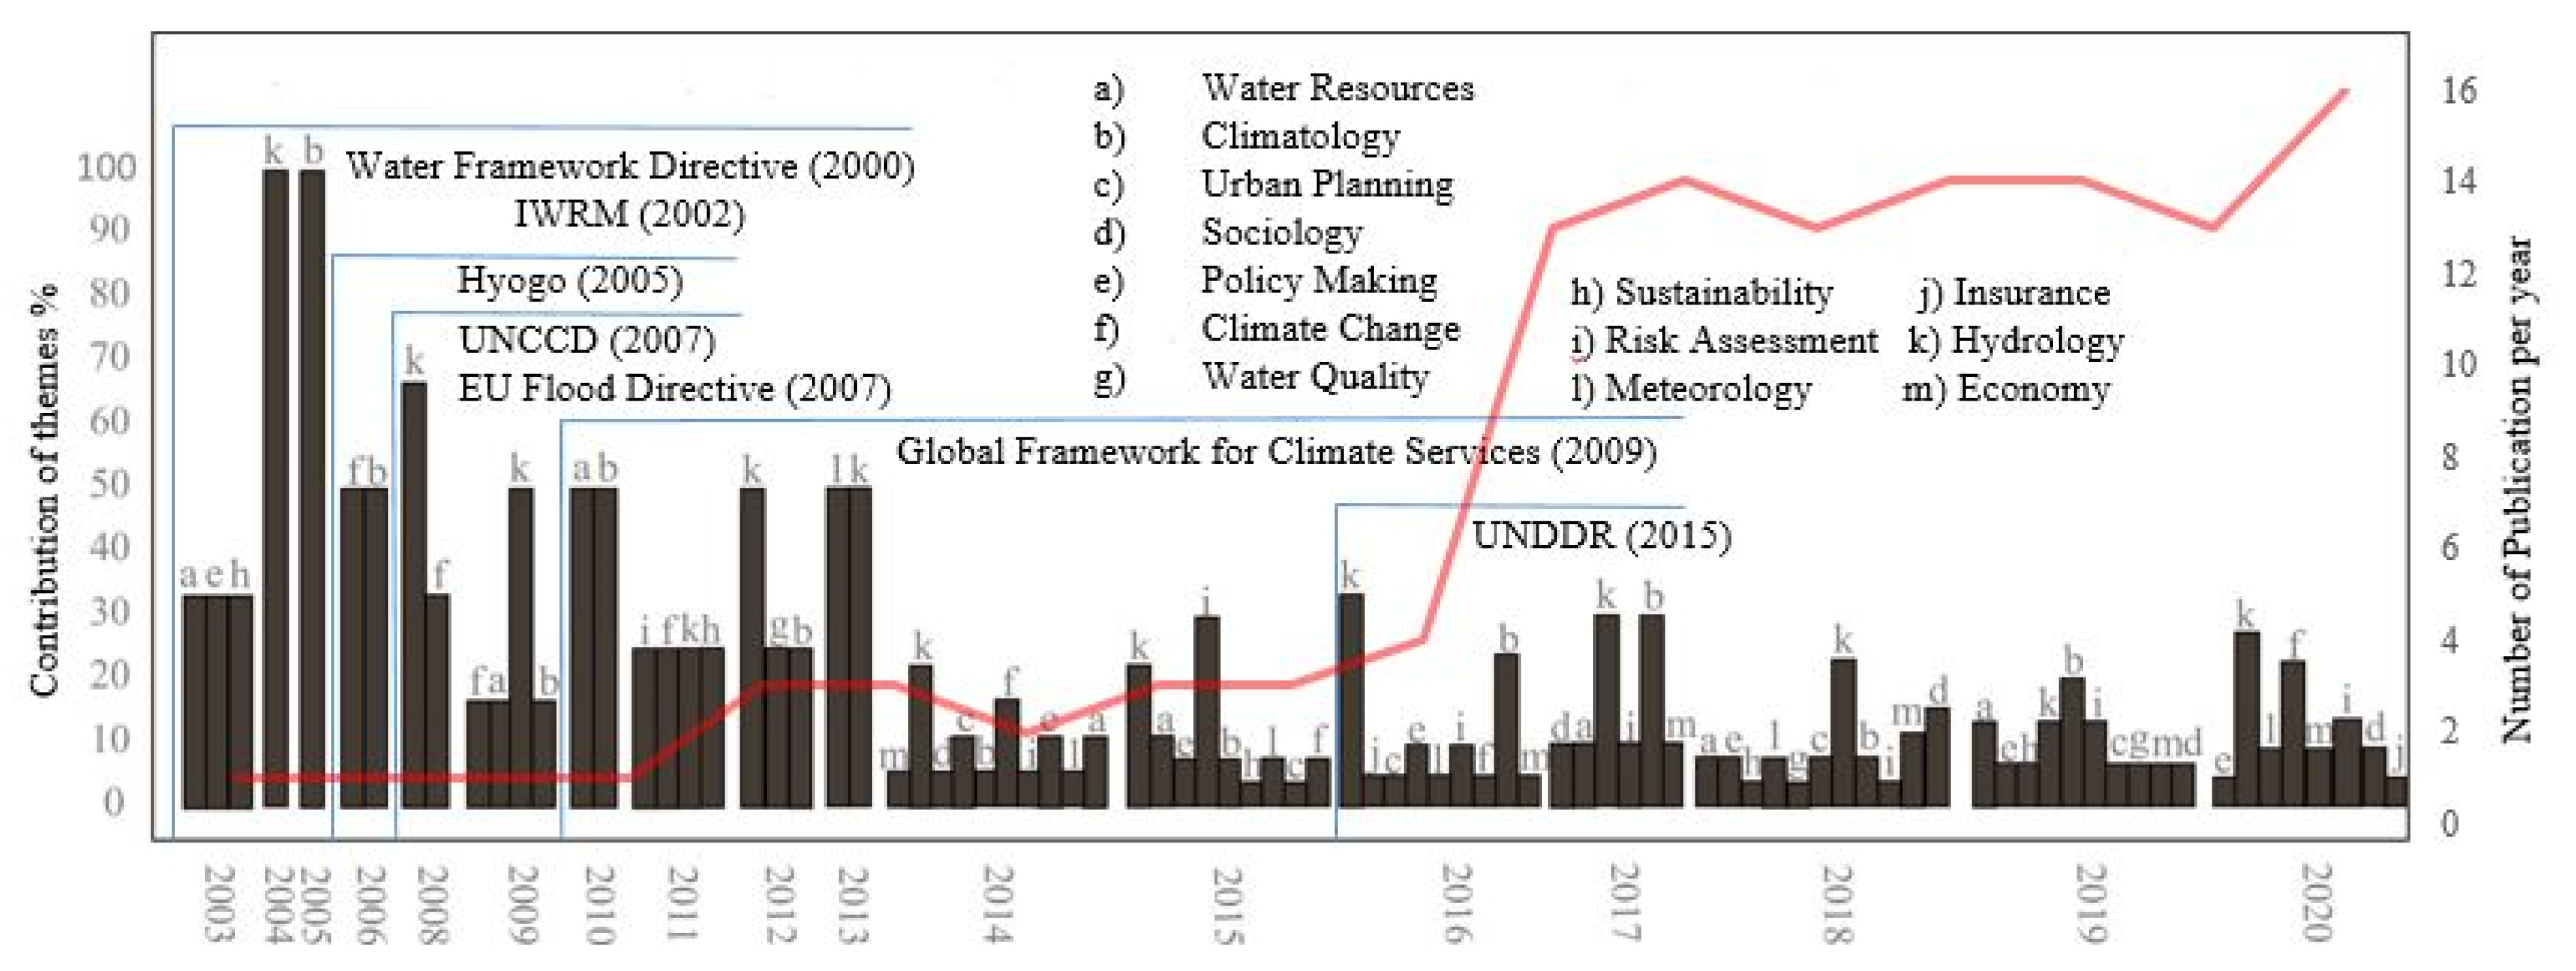
3.2. Analysis of the Research Themes

Figure 2 identifies the themes that have been contributing to the flood and drought topics in the last two decades. In this figure, the horizontal bottom axis is devoted to the publication year, while the vertical axis on the left represents the percentage by which any theme has contributed to studying the flood and drought events. The number of papers published in each year is demonstrated by the red trend on the right vertical axis. Dates of some of the major legislative and contributing services in the water industry are also presented in the graph to highlight possible influences on the trends.
Throughout the selected papers, 13 main themes were identified using content analysis. Results show that the number of publications on flood and drought co-analysis in the first ten years is around 10% of the total. The increase in publications could be due to the passing of many legislations and directives and making data sharing platforms more available and open source. The other significant finding is that during the first half of this period, there were a small number of themes contributing to the simultaneous analysis of flood and drought research, with “Hydrology” being the central presented research theme throughout all years. However, in recent years, interest in diversifying the investigation fields is evident through the application of a range of social science themes, such as economy, insurance, sociology, and urban planning, as contributors to flood and drought topics.
Flood and drought extremes could be perceived as two ends of one spectrum; nevertheless, building resilience against such hazards is a long-term process [38]. The following discussion considers some of the legislations and platforms related to water hazards identified in the literature and presented in Figure 2.
One of the primary attempts in this regard was the Water Framework Directive (WFD) in early 2000, in which a set of guidelines were defined to help preserve the natural and artificial water bodies. In 2002, global authorities agreed upon implementing a directorial framework on the foundation of economic efficiency, environmental sustainability and social equity known as Integrated Water Resource Management (IWRM) [57]. Subsequently, the Hyogo framework for action, 2005–2015, was introduced within the International Strategy for Disaster Reduction [58] to reduce the risks from natural hazards. The conference of the parties to the UN Convention to Combat Desertification [59], which took place in 2007, pursued a plan to mitigate the impact of droughts and promote environmental sustainability. In the 3rd world climate conference in 2009, the world meteorological organization (WMO) adopted a global framework for climate services to provide relevant information on climate change. One of the most recent attempts to set the guidelines for post-2015 developments and disaster risk reduction through to 2030 was made in 2015 during the 3rd conference on Disaster Risk Reduction.

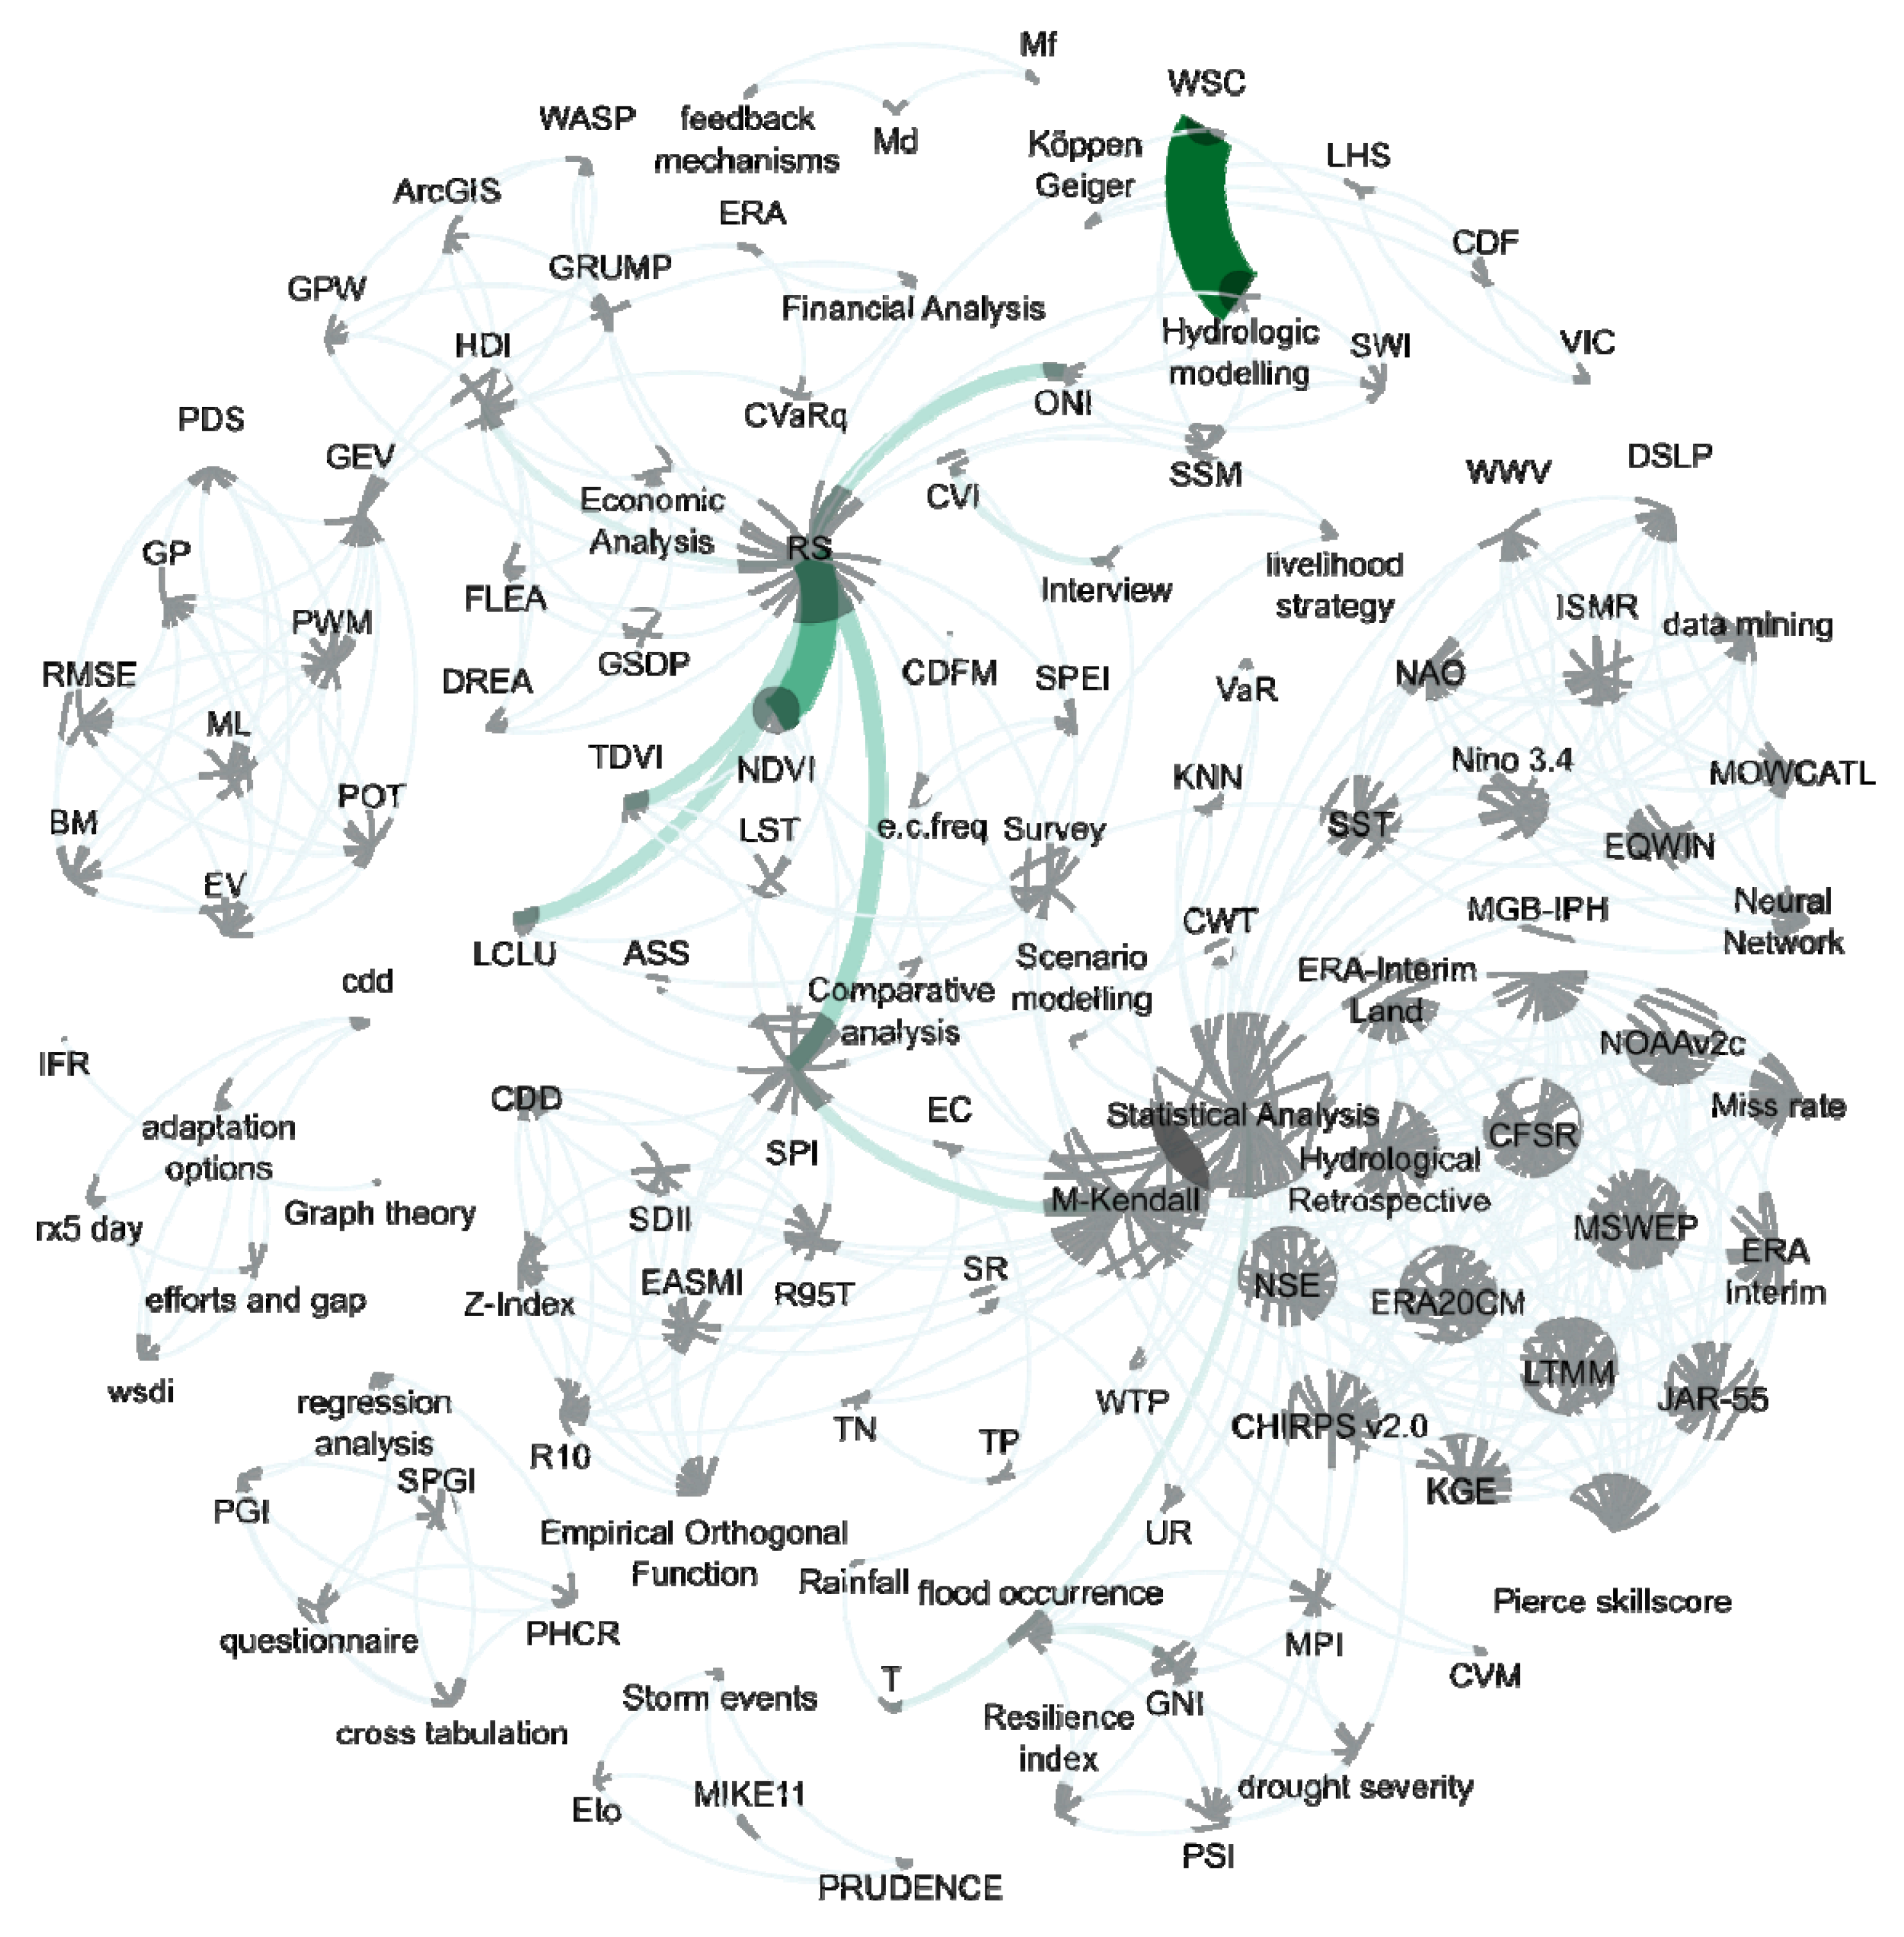
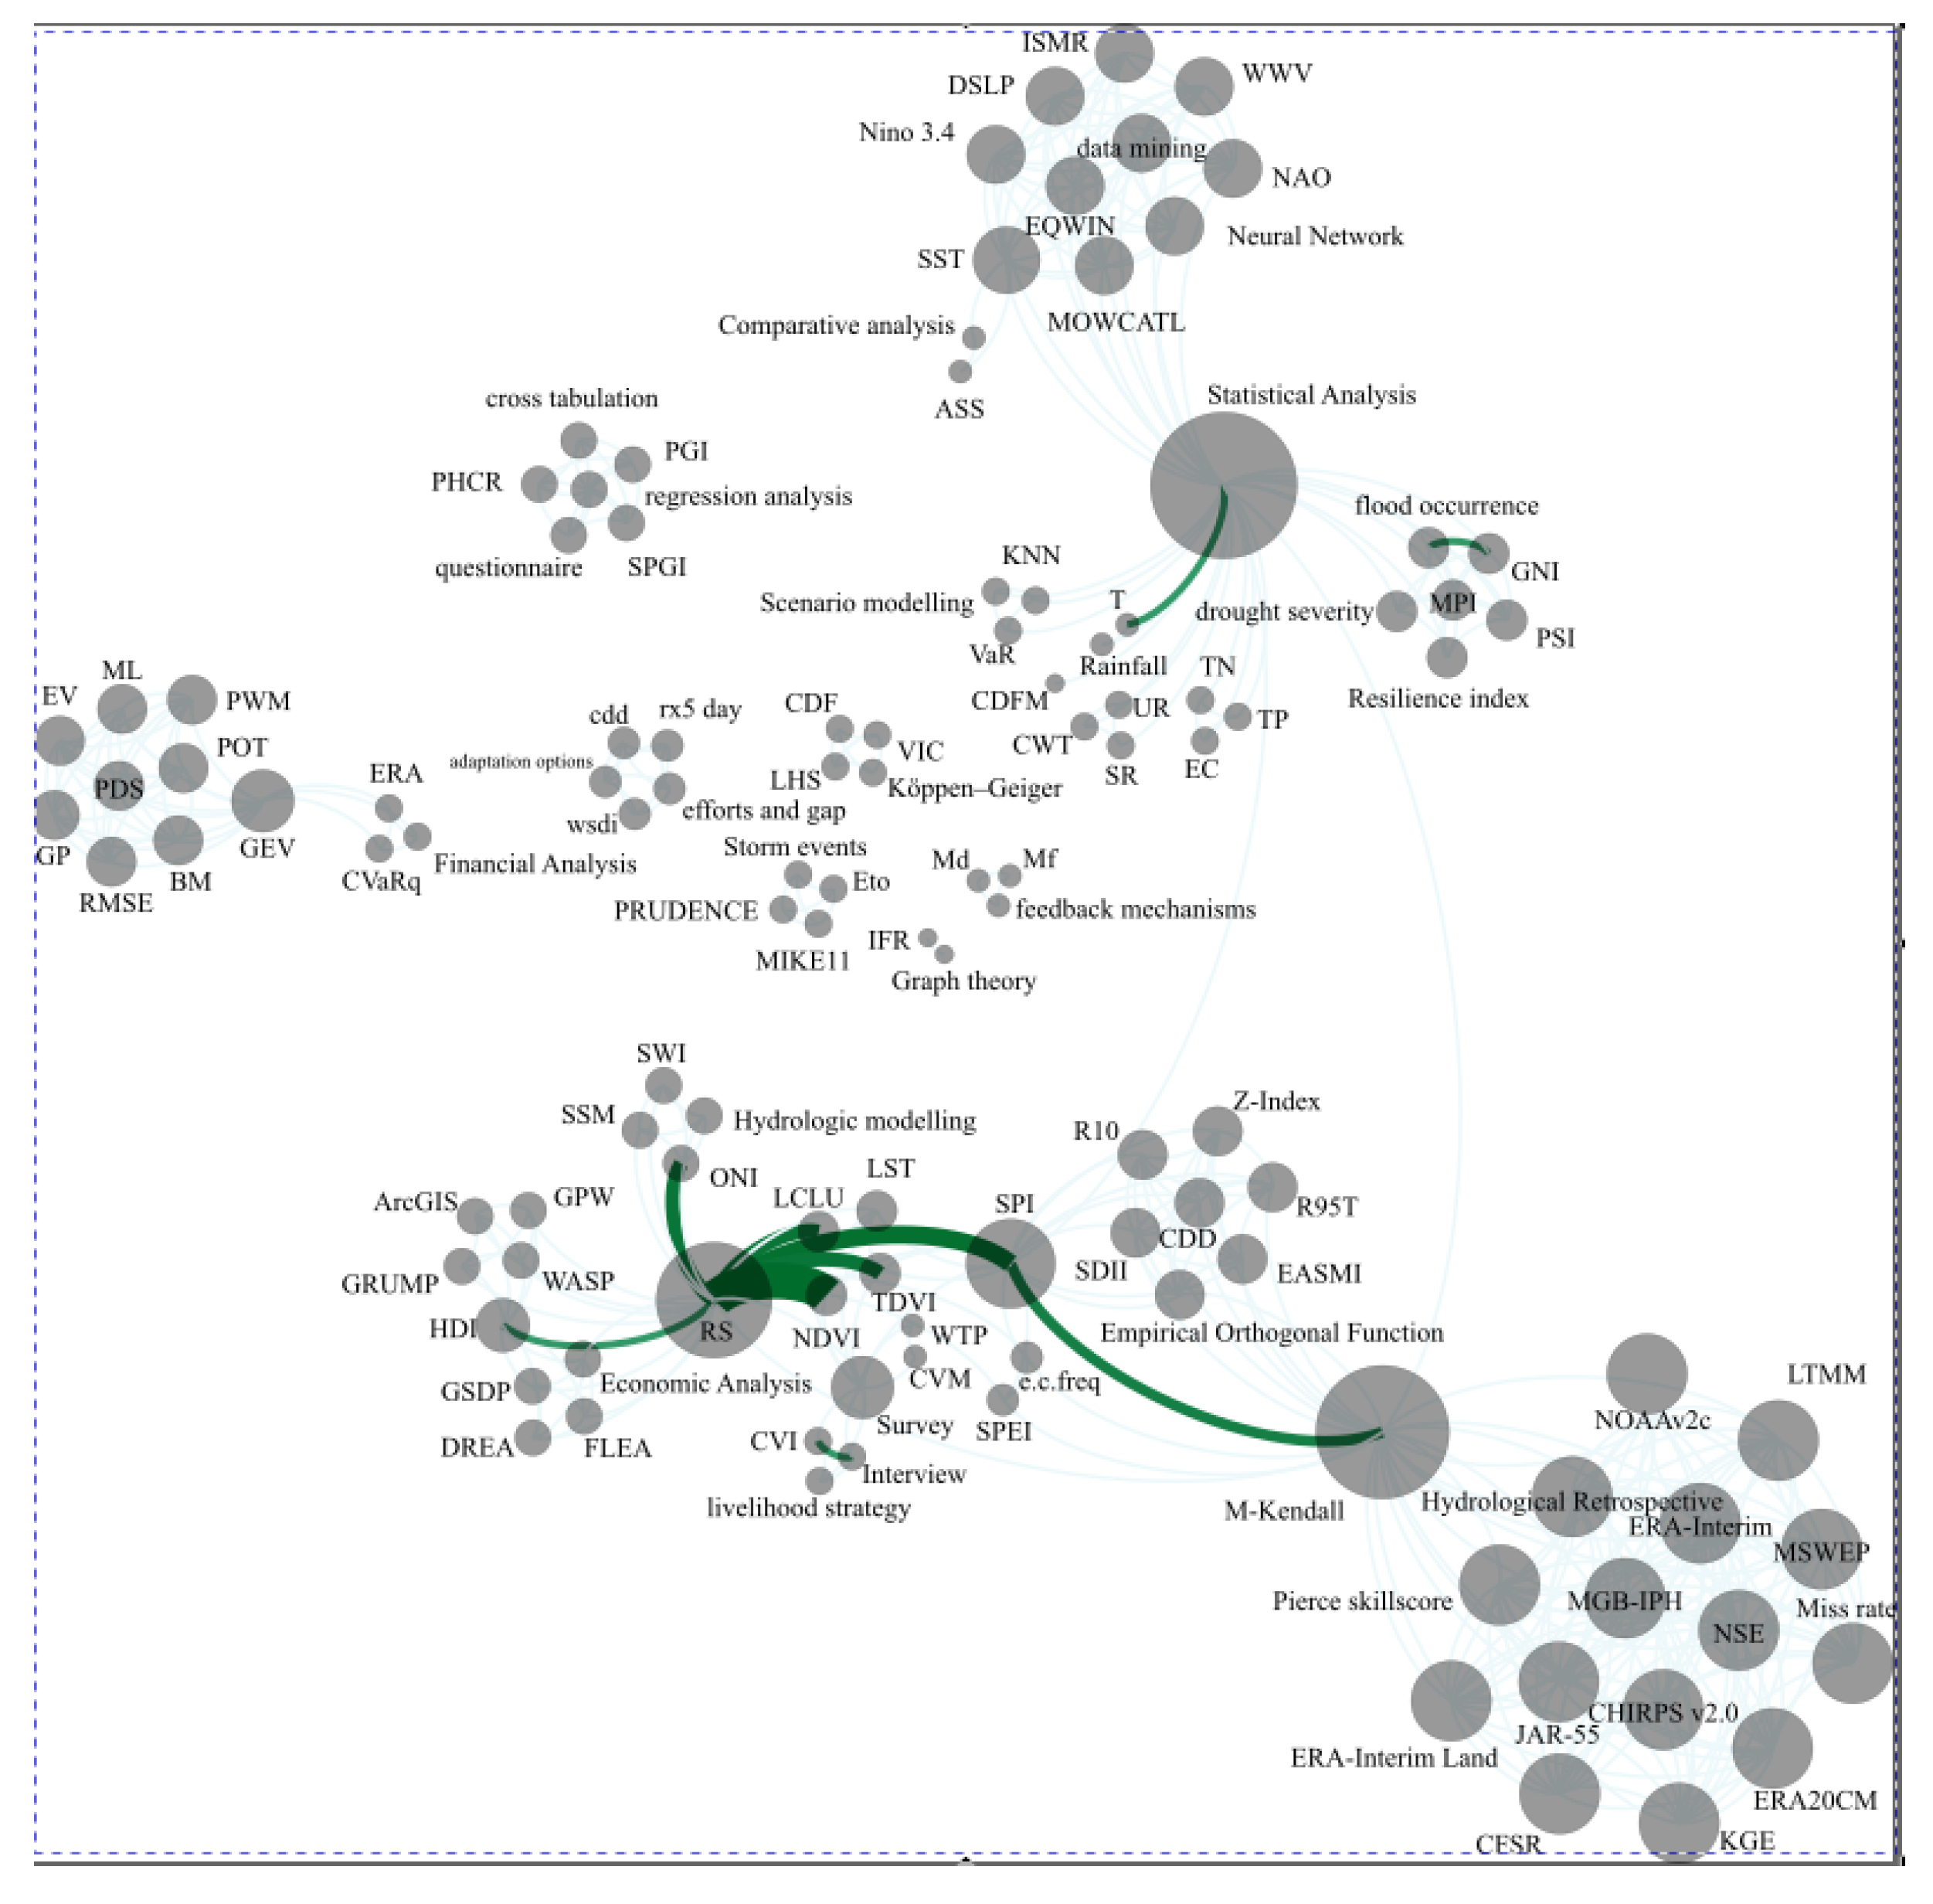
3.3. Methods and Indices Applied in Flood and Drought Research

As explained in previous sections, researchers have investigated water-related hazards from various perspectives, including the application of many different methods and indices with some being fundamentally different. Modelling flood and drought events requires comprehensive data and integrated approaches [10], which need to be unbiased and robust. The first step towards achieving an unbiased integration of flood and drought modelling frameworks or methodologies requires a systematic review of the existing literature. This type of review starts by identifying relevant publications based on search terms in all of the available databases, which systematically removes any scientific bias of the authors towards any particular subfield or methodology.
In the next phase, the approaches and indices that have been used in the literature to describe flood and drought phenomena were extracted from the reviewed papers using the content analysis method. This dataset was used as input for producing a weighted and undirected network (Figure 3).
Similar to Figure 1, the size of the nodes represents their potential communication activity, meaning that the larger nodes have been at the core of the science map of the analyzed literature. As illustrated in Figure 3, (“Statistical Analysis”), remote sensing (“RS”) and Mann-Kendall (“M-Kendall”) are the most widely applied approaches to investigate both flood and drought subjects. The central mutual index used with both methods and hence controls the flow of information in at least some of the studies is “SPI”. The weighted edges show the repetition of connections between nodes (methods and indices). Remote sensing has strong links with terrestrial indices, such as Land Cover Land Use (“LCLU”), Normalized Difference Vegetation Index (“NDVI”), and Transformed Difference Vegetation Index (“TDVI”). The strong connection that exists between “hydrologic modelling” and Water Storage Capacity (“WSC”) suggests that these two are very commonly used together in the investigations.
For visual purposes, the size of circles in Figure 3 and Figure 4, which represent the degree of centrality of the nodes, are scaled from 10 to 80. The size of the edges is represented in color and thickness scales based on their repetition count. Table 2 concludes the overall metrics for the methods and indices network.
Key nodes in the methods and indices network in terms of degree and betweenness centrality were “Statistical Analysis”, “M-Kendall”, “RS” and “SPI” (Table 3). These methods and indices are the most repeatedly used and acted as hubs through which various links could be stablished between different clusters or domains.
Another significant finding of this review is that many different subsets of indices are applied with specific methods and a selection of other indices. Figure 4 depicts a different layout of the methods and indices network, which clearly illustrates the formed clusters and sets out the critical nodes that distinguish them. Researchers have mainly applied meteorological and climatological subsets of indices and methods in combination with statistical analysis and the Mann–Kendall test more often to describe flood and drought events together. The top and bottom right sections of the layout in Figure 4 outline this finding.
By studying Figure 4, “SPI” in this network acts as the hub of information amongst many of the indices used in many different studies. SPI is found to link remote sensing (RS) and M-Kendall methods, which are involved with many meteorological, hydrological, terrestrial economic and sociological indices demonstrated in the lower right hand corner of Figure 4. This scientograph (Figure 4) demonstrates the various approaches used by researchers so far and provides some insights as to how new combinations of methods and indices can potentially progress modelling and address simultaneous flood and drought analysis. This could help to identify any particular combination of methods and indices to build a conceptual framework. Figure 4 shows that the basic version of the framework, which congregates sufficient analysis, could be a combination of remotely sensed terrestrial information with some economic analysis using “GSDP” and “HDI”, which are linked to hydrological parameters through “SPI”.

4. Conclusions

This paper presented a systematic and unbiased analysis of the existing literature that has considered both floods and droughts, to produce networks of information and to show the connections between various relevant research domains. An analysis of the authors’ keywords has shown that the most widely used flood and drought study scale is “river basin”. This could have further implications that help unify many of the involved entities in management strategies (e.g., dam release and water allocation), data platform collaborations and policies (insurance, urban development and transboundary geo-policy) to investigate and work on a standard and similar geographical scale whilst addressing water-related extremes. By having a similar scale in mind, different decision-making bodies could have much greater success in solving water-related problems. The other keywords at the center of focus were climate change, resilience and exposure. This reveals that the focus of research and impact libraries of the frameworks are fundamentally focused on the level of exposure of communities to climate change-induced water hazards and how well they can tolerate their consequences. However, to obtain a more robust modelling framework, with regard to addressing issues on analyzing floods and droughts together, there are many more aspects that must be addressed, such as sociology, economy, geo-policy and ecology.
The thematic distribution of research on the combined analysis of flood and drought issues over the last two decades demonstrated a continuous presence of “Hydrology” as the central theme. However, in the last five years, a multi-disciplinary approach has emerged that focuses on climate change, economy, sociology, urban planning and insurance. This shows that as the communities grow and become more complex, exposure to water-related hazards increases and expands to various categories. Therefore, more flexible and enhanced frameworks are needed to capture these different aspects of analyzing flood and drought issues together. Additionally, the number of publications in this time frame has increased significantly, showing the development of research interest towards addressing integrated flood and drought risks. Many clusters of methods and indices have been identified that try to address various aspects of issues existing around both flood and drought events. Our systematic analysis of utilized methods and indices by researchers showed that “remote sensing”, “statistical analysis” and “Mann-Kendall” were three of the most widely used methods, while “SPI” and “ERA-Interim” are the highlighted indices. It is worth mentioning that the term “Statistical Analysis” used here encompass a range of statistical concepts that were used in the relevant literature, such as moving averages and quartiles. Some of the research themes are more widely clustered together to investigate and model the topic in question, and there are some paths to link between these clusters. It would be beneficial to combine some of these methods and indices from various research fields to more comprehensively and reliably realize the combined analysis of flood and drought events. This realization could potentially be implemented within the existing water-hazard frameworks to enhance their abilities in assessing risks when considering both possible flood and drought events during the lifetime of water resources systems. Nonetheless, investigating different combinations of the aforementioned clusters helps develop a framework to assess the resilience of any adaptation strategy against the increasing exposure of communities and infrastructure to the climate change-induced flood and drought hazards at a river basin scale.

Supplementary Materials

The following are available online at https://www.mdpi.com/article/10.3390/w13192788/s1, Table S1: represents a list of the abbreviations for the methods and indices used in the literature. These terms are used by the original authors and extracted by the content analysis approach.

Author Contributions

Conceptualization, S.F.; methodology, S.F. and W.Z.L.; software S.F.; resources, S.F.; data curation, S.F.; writing—original draft preparation, S.F.; writing—review and editing, S.F., W.Z.L., W.W. and D.P.; supervision, W.Z.L., W.W. and D.P.; project administration, W.Z.L., D.P. and W.W. All authors have read and agreed to the published version of the manuscript.

Funding

This research received no external funding.

Institutional Review Board Statement

Not applicable.

Informed Consent Statement

Not applicable.

Data Availability Statement

No new data were created or analyzed in this study. Data sharing is not applicable to this article.

Acknowledgments

We would like to thank all editors and reviewers for their insightful comments, which helped us improve the quality of this paper.

Conflicts of Interest

The authors declare no conflict of interest.

References

  1. Best, J. Anthropogenic stresses on the world’s big rivers. Nat. Geosci. 2019, 12, 7–21. [Google Scholar] [CrossRef]
  2. Golnaraghi, M.; Surminski, S.; Mehryar, S.; Kousky, C.; Roezer, V. Building Flood Resilience in a Changing Climate. 2020. Available online: https://www.preventionweb.net/files/72437_buildingfloodresilienceinachangingc.pdf (accessed on 30 August 2021).
  3. Van Loon, A.F.; Gleeson, T.; Clark, J.; Van Dijk, A.I.; Stahl, K.; Hannaford, J.; Di Baldassarre, G.; Teuling, A.J.; Tallaksen, L.M.; Uijlenhoet, R.; et al. Drought in the Anthropocene. Nat. Geosci. 2016, 9, 89–91. [Google Scholar] [CrossRef] [Green Version]
  4. Wens, M.; Johnson, J.M.; Zagaria, C.; Veldkamp, T.I. Integrating human behavior dynamics into drought risk assessment—A sociohydrologic, agent-based approach. Wiley Interdiscip. Rev. Water 2019, 6, e1345. [Google Scholar] [CrossRef]
  5. Lindersson, S.; Brandimarte, L.; Mård, J.; Di Baldassarre, G. A review of freely accessible global datasets for the study of floods, droughts and their interactions with human societies. Wiley Interdiscip. Rev. Water 2020, 7, e1424. [Google Scholar] [CrossRef] [Green Version]
  6. Christenson, E.; Elliott, M.; Banerjee, O.; Hamrick, L.; Bartram, J. Climate-related hazards: A method for global assessment of urban and rural population exposure to cyclones, droughts, and floods. Int. J. Environ. Res. Public Health 2014, 11, 2169–2192. [Google Scholar] [CrossRef]
  7. Un.org. Available online: https://www.un.org/en/development/desa/publications/world-urbanization-prospects-the-2011-revision.html (accessed on 30 August 2021).
  8. Krysanova, V.; Buiteveld, H.; Haase, D.; Hattermann, F.F.; Van Niekerk, K.; Roest, K.; Martínez-Santos, P.; Schlüter, M. Practices and lessons learned in coping with climatic hazards at the river-basin scale: Floods and droughts. Ecol. Soc. 2008, 13, 1–28. [Google Scholar] [CrossRef] [Green Version]
  9. Pinho, P.F.; Marengo, J.A.; Smith, M.S. Complex socio-ecological dynamics driven by extreme events in the Amazon. Reg. Environ. Chang. 2015, 15, 643–655. [Google Scholar] [CrossRef]
  10. Ward, P.J.; de Ruiter, M.C.; Mård, J.; Schröter, K.; Van Loon, A.; Veldkamp, T.; von Uexkull, N.; Wanders, N.; AghaKouchak, A.; Arnbjerg-Nielsen, K.; et al. The need to integrate flood and drought disaster risk reduction strategies. Water Secur. 2020, 11, 100070. [Google Scholar] [CrossRef]
  11. Kreibich, H.; Blauhut, V.; Aerts, J.C.; Bouwer, L.M.; Van Lanen, H.A.; Mejia, A.; Mens, M.; Van Loon, A.F. How to improve attribution of changes in drought and flood impacts. Hydrol. Sci. J. 2019, 64, 1–18. [Google Scholar] [CrossRef] [Green Version]
  12. Di Baldassarre, G.; Wanders, N.; AghaKouchak, A.; Kuil, L.; Rangecroft, S.; Veldkamp, T.I.; Garcia, M.; van Oel, P.R.; Breinl, K.; Van Loon, A.F. Water shortages worsened by reservoir effects. Nat. Sustain. 2018, 1, 617–622. [Google Scholar] [CrossRef]
  13. Di Baldassarre, G.; Martinez, F.; Kalantari, Z.; Viglione, A. Drought and flood in the Anthropocene: Feedback mechanisms in reservoir operation. Earth Syst. Dyn. 2015, 8, 225–233. [Google Scholar] [CrossRef] [Green Version]
  14. Marengo, J.A.; Alves, L.M.; Soares, W.R.; Rodriguez, D.A.; Camargo, H.; Riveros, M.P.; Pabló, A.D. Two contrasting severe seasonal extremes in tropical South America in 2012: Flood in Amazonia and drought in northeast Brazil. J. Clim. 2013, 26, 9137–9154. [Google Scholar] [CrossRef]
  15. Güneralp, B.; Güneralp, İ.; Liu, Y. Changing global patterns of urban exposure to flood and drought hazards. Glob. Environ. Chang. 2015, 31, 217–225. [Google Scholar] [CrossRef]
  16. United Nation World Water Assessment Programme, 2009, Global Trends in Water-Related Disasters: An Insight for Folicymakers. Available online: https://unesdoc.unesco.org/ark:/48223/pf0000181793 (accessed on 30 August 2021).
  17. Brunner, M.I.; Slater, L.; Tallaksen, L.M.; Clark, M. Challenges in modeling and predicting floods and droughts: A review. Wiley Interdiscip. Rev. Water. 2021, 8, e1520. [Google Scholar] [CrossRef]
  18. McMartin, D.W.; Merino, B.H.H.; Bonsal, B.; Hurlbert, M.; Villalba, R.; Ocampo, O.L.; Upegui, J.J.V.; Poveda, G.; Sauchyn, D.J. Limitations of water resources infrastructure for reducing community vulnerabilities to extremes and uncertainty of flood and drought. Environ. Manage. 2018, 62, 1038–1047. [Google Scholar] [CrossRef] [Green Version]
  19. Kim, S.; Kwak, J.; Noh, H.S.; Kim, H.S. Evaluation of drought and flood risks in a multipurpose dam under climate change: A case study of Chungju Dam in Korea. Nat. Hazards 2014, 73, 1663–1678. [Google Scholar] [CrossRef]
  20. Jun, K.S.; Chung, E.S.; Sung, J.Y.; Lee, K.S. Development of spatial water resources vulnerability index considering climate change impacts. Sci. Total Environ. 2011, 409, 5228–5242. [Google Scholar] [CrossRef]
  21. Lee, K.; Chun, H.; Song, J. New Strategies for Resilient Planning in response to Climate Change for Urban Development. Procedia Eng. 2018, 212, 840–846. [Google Scholar] [CrossRef]
  22. Huang, S.; Krysanova, V.; Hattermann, F. Projections of climate change impacts on floods and droughts in Germany using an ensemble of climate change scenarios. Reg. Environ. Chang. 2015, 15, 461–473. [Google Scholar] [CrossRef]
  23. Lassa, J.A.; Nugraha, E. Building Urban Resilience to Climate Change in the Secondary Cities in Indonesia; IRGSC: Kupang, Indonesia, 2014; pp. 1–22. [Google Scholar]
  24. Masood, M.; Takeuchi, K. Climate Change Impact on the Manageability of Floods and Droughts of the Ganges-Brahmaputra-Meghna Basins Using Flood Duration Curves and Drought Duration Curves. J. Disaster Emerg. Res. 2015, 10, 991–1000. [Google Scholar] [CrossRef]
  25. Boukhris, O.E.F. The impact of climate change on the hydrology in highly urbanised Belgian areas. In Water and Urban Development Paradigms; CRC Press: Boca Raton, FL, USA, 2008; pp. 289–294. [Google Scholar]
  26. Hirabayashi, Y.; Kanae, S.; Emori, S.; Oki, T.; Kimoto, M. Global projections of changing risks of floods and droughts in a changing climate. Hydrol. Sci. J. 2008, 53, 754–772. [Google Scholar] [CrossRef]
  27. Lehner, B.; Döll, P.; Alcamo, J.; Henrichs, T.; Kaspar, F. Estimating the impact of global change on flood and drought risks in Europe: A continental, integrated analysis. Clim. Chang. 2006, 75, 273–299. [Google Scholar] [CrossRef]
  28. Grasham, C.F.; Korzenevica, M.; Charles, K.J. On considering climate resilience in urban water security: A review of the vulnerability of the urban poor in sub-Saharan Africa. Wiley Interdiscip. Rev. Water. 2019, 6, e1344. [Google Scholar] [CrossRef] [Green Version]
  29. Head, B.W. Managing urban water crises: Adaptive policy responses to drought and flood in Southeast Queensland, Australia. Ecol. Soc. 2014, 19, 1–15. [Google Scholar] [CrossRef] [Green Version]
  30. Parasiewicz, P.; King, E.L.; Webb, J.A.; Piniewski, M.; Comoglio, C.; Wolter, C.; Buijse, A.D.; Bjerklie, D.; Vezza, P.; Melcher, A.; et al. The role of floods and droughts on riverine ecosystems under a changing climate. Fish. Manag. Ecol. 2019, 26, 461–473. [Google Scholar] [CrossRef]
  31. Hoa, N.T.; Vinh, N.Q. The notions of resilience in spatial planning for drought-flood coexistence (DFC) at regional scale. IOP Conf. Ser. Earth Environ. Sci. 2018, 143, 012066. [Google Scholar] [CrossRef]
  32. Ramyar, R.; Zarghami, E. Green infrastructure contribution for climate change adaptation in urban landscape context. Appl. Ecol. Environ. Res. 2017, 15, 1193–1209. [Google Scholar] [CrossRef]
  33. Pavelic, P.; Brindha, K.; Amarnath, G.; Eriyagama, N.; Muthuwatta, L.; Smakhtin, V.; Gangopadhyay, P.K.; Malik, R.P.S.; Mishra, A.; Sharma, B.R.; et al. Controlling Floods and Droughts Through Underground Storage: From Concept to Pilot Implementation in the Ganges River Basin; International Water Management Institute (IWMI): Gujarat, India, 2015. [Google Scholar]
  34. De Silva, M.M.G.T.; Kawasaki, A. Socioeconomic vulnerability to disaster risk: A case study of flood and drought impact in a rural Sri Lankan community. Ecol. Econ. 2018, 152, 131–140. [Google Scholar] [CrossRef]
  35. Markantonis, V.; Farinosi, F.; Dondeynaz, C.; Ameztoy, I.; Pastori, M.; Marletta, L.; Ali, A.; Carmona Moreno, C. Assessing floods and droughts in the Mékrou River basin (West Africa): A combined household survey and climatic trends analysis approach. Nat. Hazards Earth Syst. Sci. 2018, 18, 1279–1296. [Google Scholar] [CrossRef] [Green Version]
  36. Bola Bosongo, G.; Ndembo Longo, J.; Goldin, J.; Lukanda Muamba, V. Socioeconomic impacts of floods and droughts in the middle Zambezi river basin. Int. J. Clim. Chang. Strateg. Manag. 2014, 6, 131–144. [Google Scholar] [CrossRef]
  37. Chen, C.; Doherty, M.; Coffee, J.; Wong, T.; Hellmann, J. Measuring the adaptation gap: A framework for evaluating climate hazards and opportunities in urban areas. Environ. Sci. Policy 2016, 66, 403–419. [Google Scholar] [CrossRef] [Green Version]
  38. Grobicki, A.; MacLeod, F.; Pischke, F. Integrated policies and practices for flood and drought risk management. Water Policy 2015, 17, 180–194. [Google Scholar] [CrossRef]
  39. Bi, W.; Weng, B.; Yuan, Z.; Yang, Y.; Xu, T.; Yan, D.; Ma, J. Evolution of drought–flood abrupt alternation and its impacts on surface water quality from 2020 to 2050 in the Luanhe River Basin. Int. J. Environ. Res. Public Health 2019, 16, 691. [Google Scholar] [CrossRef] [PubMed] [Green Version]
  40. Hrdinka, T.; Novický, O.; Hanslík, E.; Rieder, M. Possible impacts of floods and droughts on water quality. J. Hydro-Environ. Res. 2012, 6, 145–150. [Google Scholar] [CrossRef]
  41. Ji, Z.; Li, N.; Wu, X. Threshold determination and hazard evaluation of the disaster about drought/flood sudden alternation in Huaihe River basin, China. Theor. Appl. Climatol. 2018, 133, 1279–1289. [Google Scholar] [CrossRef]
  42. Meerow, S.; Newell, J.P.; Stults, M. Defining urban resilience: A review. Landsc. Urban. Plan. 2016, 147, 38–49. [Google Scholar] [CrossRef]
  43. Giuliani, G.; Peduzzi, P. The PREVIEW Global Risk Data Platform: A geoportal to serve and share global data on risk to natural hazards. Nat. Hazards Earth Syst. Sci. 2011, 11, 53–66. [Google Scholar] [CrossRef] [Green Version]
  44. Zhao, Y.; Weng, Z.; Chen, H.; Yang, J. Analysis of the Evolution of Drought, Flood, and Drought-Flood Abrupt Alternation Events under Climate Change Using the Daily SWAP Index. Water 2020, 12, 1969. [Google Scholar] [CrossRef]
  45. Newman, M.E.J. Networks: An Introduction; Oxford University Press: Oxford, UK, 2010. [Google Scholar]
  46. Khirfan, L.; Mohtat, N.; Peck, M. A systematic literature review and content analysis combination to “shed some light” on stream daylighting (Deculverting). Water Secur. 2020, 10, 100067. [Google Scholar] [CrossRef]
  47. Ioana-Toroimac, G. Outcomes of the hydromorphology integration in the water framework directive: A review based on science mapping. J. Environ. Manag. 2018, 206, 1135–1144. [Google Scholar] [CrossRef]
  48. Börner, K.; Chaomei, C.; Boyack, K. Visualizing Knowledge Domains. Annu. Rev. Inf. Sci. Technol. 2003, 37, 179–255. [Google Scholar] [CrossRef]
  49. Chen, C. Science Mapping: A Systematic Review of the Literature. J. Data Inf. Sci. 2017, 2, 1–40. [Google Scholar] [CrossRef] [Green Version]
  50. Veslava, O.; Malak, P. Maps and Mapping in Scientometrics. In Metody i Narzędzia BadaĔ Piśmiennictwa Cyfrowego i Jego Użytkowników [Methods and Tools for Researching Digital Writing and Its Users]; Góralska, M., Wandel, A., Eds.; Wrocław University: Wrocław, Poland, 2016; pp. 59–72. [Google Scholar]
  51. Cobo, M.J.; López-Herrera, A.G.; Herrera-Viedma, E.; Herrera, F. ‘Science Mapping Software Tools: Review, Analysis, and Cooperative Study among Tools’. J. Am. Soc. Inf. Sci. Technol. 2011, 62, 1382–1402. [Google Scholar] [CrossRef]
  52. Loet, L.; Goldstone, R.L. Interdisciplinary at the Journal and Specialty Level: The Changing Knowledge Bases of the Journal Cognitive Science. J. Assoc. Inf. Sci. Technol. 2014, 65, 164–177. [Google Scholar] [CrossRef] [Green Version]
  53. Freeman, L.C. Centrality in social networks conceptual clarification. Soc. Netw. 1987, 1, 215–239. [Google Scholar] [CrossRef] [Green Version]
  54. Goodrich, M.; Tamassia, R.; Design, A. Foundations, Analysis, and Internet Examples; John Wiley and Sons Inc.: Hoboken, NJ, USA, 2002. [Google Scholar]
  55. Mulrow, C.D. Systematic reviews: Rationale for systematic reviews. BMJ 1994, 309, 597–599. [Google Scholar] [CrossRef]
  56. Cho, J.Y.; Lee, E.H. Reducing confusion about grounded theory and qualitative content analysis: Similarities and differences. Qual. Rep. 2014, 19, 1–20. [Google Scholar]
  57. Page, C.P. Plan of Implementation of the World Summit on Sustainable Development. Sustain. Dev. 2002, 24, 20. [Google Scholar]
  58. Undrr.org. Available online: https://www.undrr.org/publication/hyogo-framework-action-2005-2015-building-resilience-nations-and-communities-disasters (accessed on 30 August 2021).
  59. Unccd.int. Available online: https://www.unccd.int/sites/default/files/relevant-links/2017-01/Decision%203COP8%20adoption%20of%20The%20Strategy%20%281%29_0.pdf (accessed on 30 August 2021).
Figure 1. Scientograph of the authors’ keywords around the subjects of flood and drought.
Water 13 02788 g001
Figure 2. Publication year of research material database around the subject of flood and drought from 2003 to 2020 (red line shows the number of publications).
Water 13 02788 g002
Figure 3. Methods and indices used in the investigated studies to define and evaluate subjects relating to flood and drought.
Water 13 02788 g003
Figure 4. Clusters of methods and indices used in the literature to address both floods and droughts.
Water 13 02788 g004
Table 1. List of the top ten most important keywords in the network, with high degree (left) and high betweenness (right).
RankKeywordDegreeKeywordBetweenness Centerality
1Flood & Drought54Flood & Drought1413.917
2River Basin19River Basin126.833
3Climate Change10GDP34.250
4Exposure10ENSO18.083
5GRACE9tempo-spatial evolution18.083
6Resilience8HDI17.750
7Soil Moisture7States17.750
8ASCAT7Climate Change14.667
9Cyclone7ML12.750
10hazard events7PWM12.750
Table 2. Overall metrics for the methods and indices network.
Average Geodesic DistanceAverage Clustering CoefficientGraph DensityAverage Degree
2.660.9350.067.19
Table 3. List of the top ten most frequently used methods and indices in the network, with high degree (left) and high betweenness (right).
RankMethod/IndexDegreeMethod/IndexBetweenness Centrality
1Statistical Analysis30Statistical Analysis1874
2M-Kendall27M-Kendall1421.5
3RS23RS1081
4SPI17SPI901.5
5Hydrological Retrospective15Survey386
6MGB-IPH15SST158
7ERA-Interim15GEV24
8ERA20CM15HDI8
9CFSR15Hydrological Retrospective0
10JAR-5515MGB-IPH0
Publisher’s Note: MDPI stays neutral with regard to jurisdictional claims in published maps and institutional affiliations.

