Communication

Removal of Coliphage MS2 Using a Microbial Fuel Cell Stack

by
Liliana Alzate-Gaviria
1,*,
Raul Tapia-Tussell
1,
Jorge Domínguez-Maldonado
1,
Rubi Chable-Villacis
1,
Gabriela Rosiles González
2 and
Cecilia Hernández-Zepeda
2
1
Renewable Energy Unit, Yucatan Center for Scientific Research, Mérida 97203, Mexico
2
Water Research Unit, Yucatan Center for Scientific Research, Cancún 77524, Mexico
*
Author to whom correspondence should be addressed.
Water 2021, 13(19), 2756; https://doi.org/10.3390/w13192756
Submission received: 16 July 2021 / Revised: 14 September 2021 / Accepted: 28 September 2021 / Published: 5 October 2021
(This article belongs to the Special Issue Water Quality Engineering and Wastewater Treatment Ⅱ)

Abstract

:
Bioelectrochemical technologies offer alternative ways of treating wastewater and using this process to generate electricity. However, research in this area is just beginning to consider environmental transmission of viruses present in wastewater. The viral fecal indicator coliphage MS2 (the most frequently used pathogen model) was used in this study, since it is a well-known indigenous wastewater virus. The scaled-up bioelectrochemical system had a working volume of 167 L and coliphage MS2 concentration decreased from 8000 to 285 PFU/mL. The kinetics were quantified up to 15 h, after which excessive yeast growth in the system prevented further bacteriophage determination. The logarithmic reduction value (LRV) calculated within the first three hours was 3.8. From 4 hours to 14, LRV values were from 4.1 to 4.8, and in hour 15 the LRV increased to 5.3, yielding a more than 90% reduction. Overall, results obtained indicate that the scaled-up bioelectrochemical treatment system was efficient in reducing coliphage MS2 densities and could be used as a model to explore its further applicability for the reduction of viruses or pathogens in treated effluents.

1. Introduction

Microbial fuel cells (MFCs) are technologies that convert organic matter to electricity through the use of electroactive bacteria. In recent years, the energy efficiency of MFCs has been researched in terms of structural elements like the anode, cathode, separator, design improvements, and operational conditions [1,2].
Recent studies demonstrated the presence of pathogenic bacteria in bioelectrochemical systems. These results informed the first conclusions on the viability of biological stabilization of MFC effluents. It was shown that pathogenic Salmonella enteritidis and Hepatitis B viruses were removed from human urine flowing through an MFC system [2,3].
The global community working on the study of waterborne pathogens has underlined the need to understand the fate of SARS-CoV-2 in the urban water cycle, and to define the potential risks to people [4]. It is known that water contaminated with this coronavirus can pose a risk to human health if aerosols are produced; for example, during the SARS outbreak in 2003, drainage failures in a building resulted in an outbreak in Hong Kong [5]. The stability of SARS-CoV-2 in environmental matrices is not yet known; therefore, it is very possible that water could act as a transmission vehicle, as has happened with other coronaviruses [6,7]. To better prepare to fight waterborne viral diseases, it is important to study the survival rates of viruses in order to evaluate the risks and operational conditions in all sanitation technologies.
The SARS-CoV-2 virus was recently detected in wastewater collected from the primary clarifiers of two treatment plants located in the northern zone of Quintana Roo, Mexico. The SARS-CoV-2 concentrations detected ranged from 1.8 × 10³ to 7.5 × 10³ genome copies per liter (GC/L) [8,9].
In this study, we chose the coliphage MS2 as a pathogen model; it is a bacteriophage commonly used as a surrogate for other human-infecting viruses that are present in wastewater due to its similarities in size, capsid structure, and nucleic acid content. The coliphage MS2 coat protein is the primary structural component of the MS2 protein shell. In addition to this function, it binds to the coliphage MS2 operator site and acts as a translation repressor of transcription of the MS2 replicase cistron.
The maturation A protein has been shown to be involved in attachment to the bacterial pili, genome circularization, and infectivity in vivo through the A protein–RNA complex. The replicate and lysis proteins are involved in the replication and lysis of the E. coli bacteria, respectively [10,11].
Our aim in the current study was therefore to investigate the survival of coliphage MS2 as a pathogen model in microbial fuel cell systems and to reach the required inactivation efficacy.

2. Materials and Methods

2.1. Inoculum and Development of Halotolerant Microbial Bioanodes

Sediments collected from a hyperhaline lagoon (“Ría Lagartos” at Las Coloradas, Yucatán, Mexico) were used as inoculum (15% v/v). The salinity of the collection site was 50 g/L. The start-up in order to develop the bioanodes was run for 7 days [12]. The wastewater was composed of sodium acetate 94.58 mg/L, glacial acetic acid 15.7 mL, sodium bicarbonate 33.4 mg/L, sodium carbonate 33.4 mg/L, dibasic potassium phosphate 6.68 mg/L, and ammonium chloride 33.4 mg/L [12].

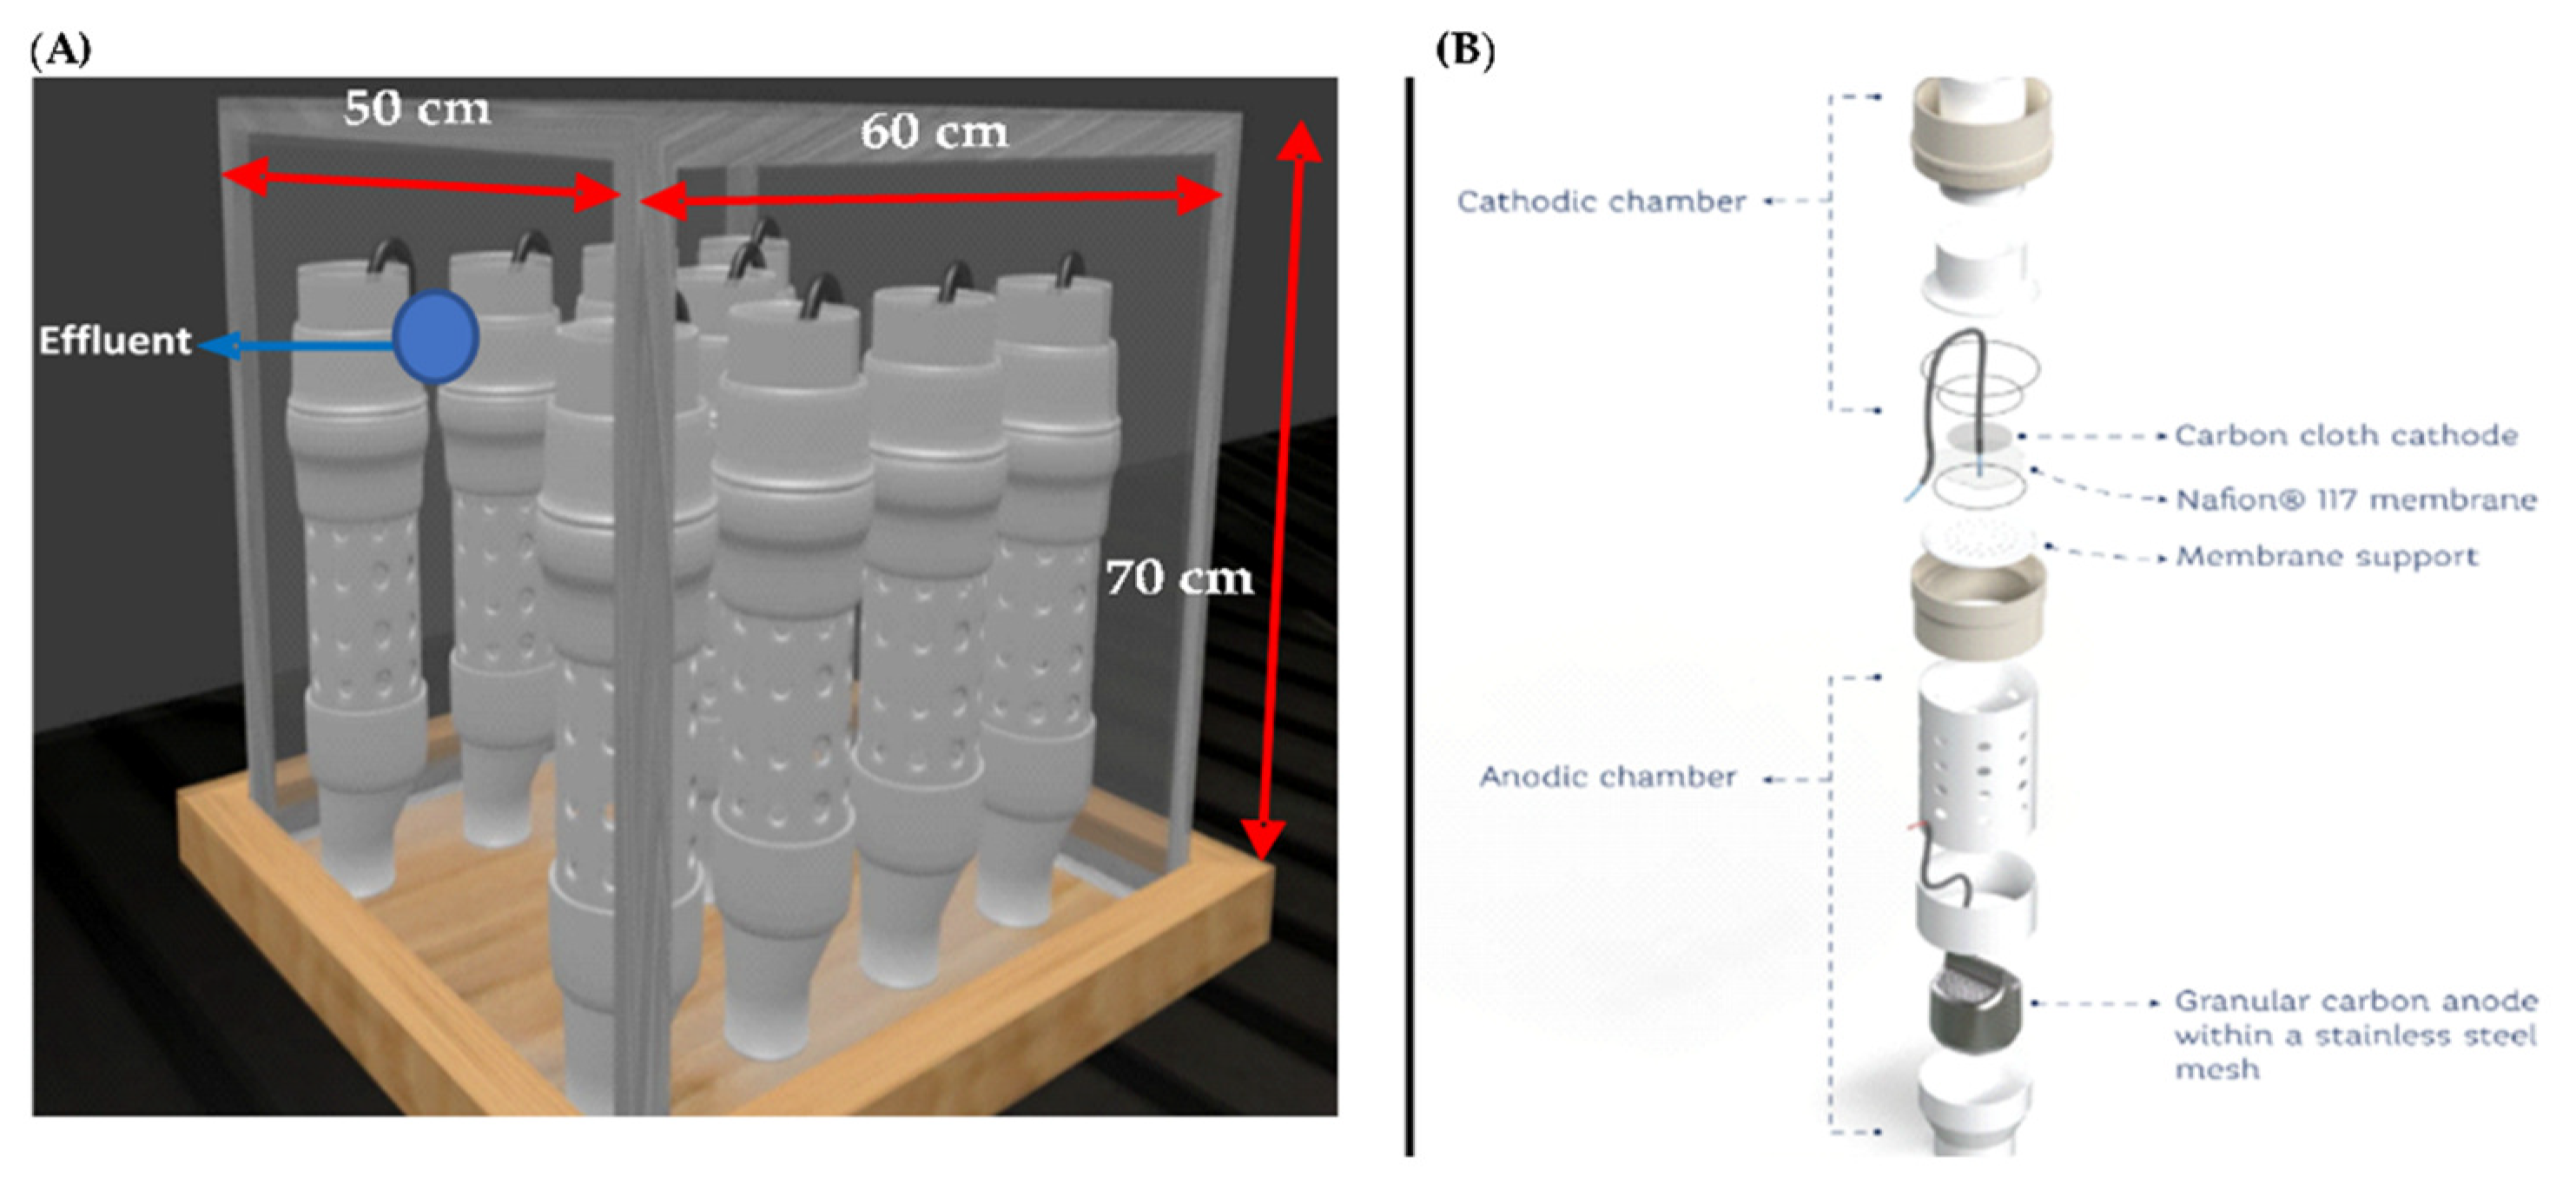
2.2. Developing MFC Setup

The anode chamber was built from a PVC reducer (4 “to 2” reduction) using stainless steel mesh, activated carbon, and plastic wire, and 500 g of activated carbon was placed within. The anode terminal was made of stainless steel mesh strips. A Nafion® 117 membrane was used; it was activated prior to its implementation [13]. For the construction of the cathode, carbon cloth with a diameter of 6.5 cm was used. Subsequently, a catalytic ink with a deposit density of 10 mg cm−2 was placed, composed of a 5% Nafion® solution, isopropyl alcohol, and Vulcan XC carbon [14]. Once the membranes and cathodes were applied with the catalytic ink, the membrane-electrode assembly process was carried out using a dam at a pressure of 300 lb/in at 110 °C [15]. The cathode chamber was made up of two membrane supports, a stainless steel mesh terminal, and two assembly pieces. The distance between anode and cathode was 7 cm [16].

2.3. Stack Assembly

The stack was built with nine MFCs, which were placed in an acrylic cube with dimensions of 60 cm length, 50 cm width, and 70 cm height (Figure 1A). The cells were kept in an open circuit during the stabilization stage; later, an external energy storage circuit was placed for energy recovery, consisting of nine capacitors (4.7 F) that allowed energy storage. Once a certain time had elapsed, the energy was discharged into a battery and the cycle started again [17]. The working volume was 167 L.
The start-up stage ended when steady-state value was reached; this was the average of three consecutive measurements for effluent COD (Chemical Oxygen Demand) when the deviations between the observed values were less than 5% [12].

2.4. Energy Storage Circuit

The circuit used in this experiment was previously designed at the Yucatan Scientific Research Center (CICY). The electronic circuit to harvest energy from ultra-low-power sources comprising an integrated capacitor module with a set of capacitors, a microcontroller, two analog switch modules each comprising a set of analog switches, an auxiliary battery module arrangement, a terminal, and an operation mode module with a solid-state battery. The electronic circuit was to harvest energy from ultra-low-power sources within a voltage range of 0.1 V to 12 V [17].

2.5. Analytical Methods

Temperature, pH, total solids, volatile solids, and nitrogen were analyzed following standard methods [18]. Colorimetric methods (Hach Company DR-890, Loveland, CO, USA) were used to determine COD (chemical oxygen demand). Redox potential was determined using a Hach Lange model MTC101 oxidation–reduction potential sensor. VFA (volatile fatty acid) content was determined in a gas chromatograph (Clarus-500 Perkin Elmer, Waltham, MA, USA). The column employed was an Agilent J&W (30 m long, 0.53 mm internal diameter) with a flame ionization detector (FID). Before analysis of VFA by chromatography, samples were filtered, acidified with phosphoric acid, centrifuged, and frozen at −80 °C for 24 h [19].

2.6. Electrochemical Measurements

The voltage and current of all the MFCs were measured with a Fluke 289 multimeter. These values were taken in open-circuit voltage when the energy storage circuit was disconnected from the system [20].

2.7. Coliphage MS2 Propagation

Viral fecal indicators, namely phage MS2 (ATTC® 15597-B1™) and Escherichia coli C3000 (ATCC® 15597™), were used to estimate wastewater indigenous viral concentrations for each method tested. For the propagation of the bacteriophage, a pre-inoculum of the bacteria was added to a test tube with Tryptone medium and incubated at 37 °C and 200 rpm for 16 h. A volume of 1.5 mL of the pre-inoculum was transferred to an Erlenmeyer flask with 30 mL of Tryptone medium and incubated at 37 °C and 200 rpm for 2 h. At the end of the incubation, 1 mL of the bacteriophage (dilution 10−1 in sterile distilled water) was incubated at 37 °C and 100 rpm for 4 h. The bacteriophage was recovered by filtration on a 0.22 µm membrane pretreated with meat extract (10 mL). Bacteriophage concentration was determined by counting PFUs (plaque-forming units) using the double-layer method in five-fold. The filtered and quantified coliphage MS2 was used to inoculate 167 L of synthetic wastewater.

2.8. Efficiency of Viral Load Removal in Bioelectrochemical Treatment System

The recovered coliphage MS2 (25 mL) was added to the scaled-up bioelectrochemical system. For the validation of bacteriophage elimination, samples were taken every hour for 24 h and quantified using the double-layer method. One milliliter of the sample taken was added to a test tube containing 5 mL of TSB medium (tryptic soy broth agar), previously melted and kept at 43–45 °C, to which 100 µL of host Escherichia coli C3000. The mixture was quickly poured onto a Petri dish containing TSA medium (tripticase soy agar) and spread by manual circular shaking until solid. Plates were incubated inverted at 37 °C for 12 h. Plating was carried out with 10−1 dilutions in duplicate for the samples of the scaled-up bioelectrochemical system and five-fold for controls, which were water, synthetic wastewater, and time zero (T0, from the inoculation of the coliphage MS2). Hydrolytic spots on the bacterial plaque were considered to be PFUs. The suspension of the host bacteria was obtained by adding 1.5 mL of pre-inoculum (described above) to an Erlenmeyer flask with 30 mL of Tryptone medium and incubated at 37 °C and 200 rpm for 4 h. The efficiency was calculated using the formula of the logarithmic reduction value of the bacteriophage: LRV = log10 Ci − log10 Cf, where LRV is logarithmic reduction value, Ci is the initial concentration of the bacteriophage, and Cf the concentration of the bacteriophage after bioelectrochemical treatment system.

3. Results

3.1. Evaluation of Physicochemical and Electrochemical Parameters

Two replications of the bioelectrochemical treatment system were performed for the coliphage MS2. The scaled-up bioelectrochemical system required an external electronic card [17] to extract and use the electrons from molecules present in the wastewater, as well as the treatment of the coliphage MS2. The system was monitored every hour for 24 h to identify the reduction of both organic matter and coliphage MS2. The values obtained from the physicochemical and electrochemical parameters can be seen in Figure 2.

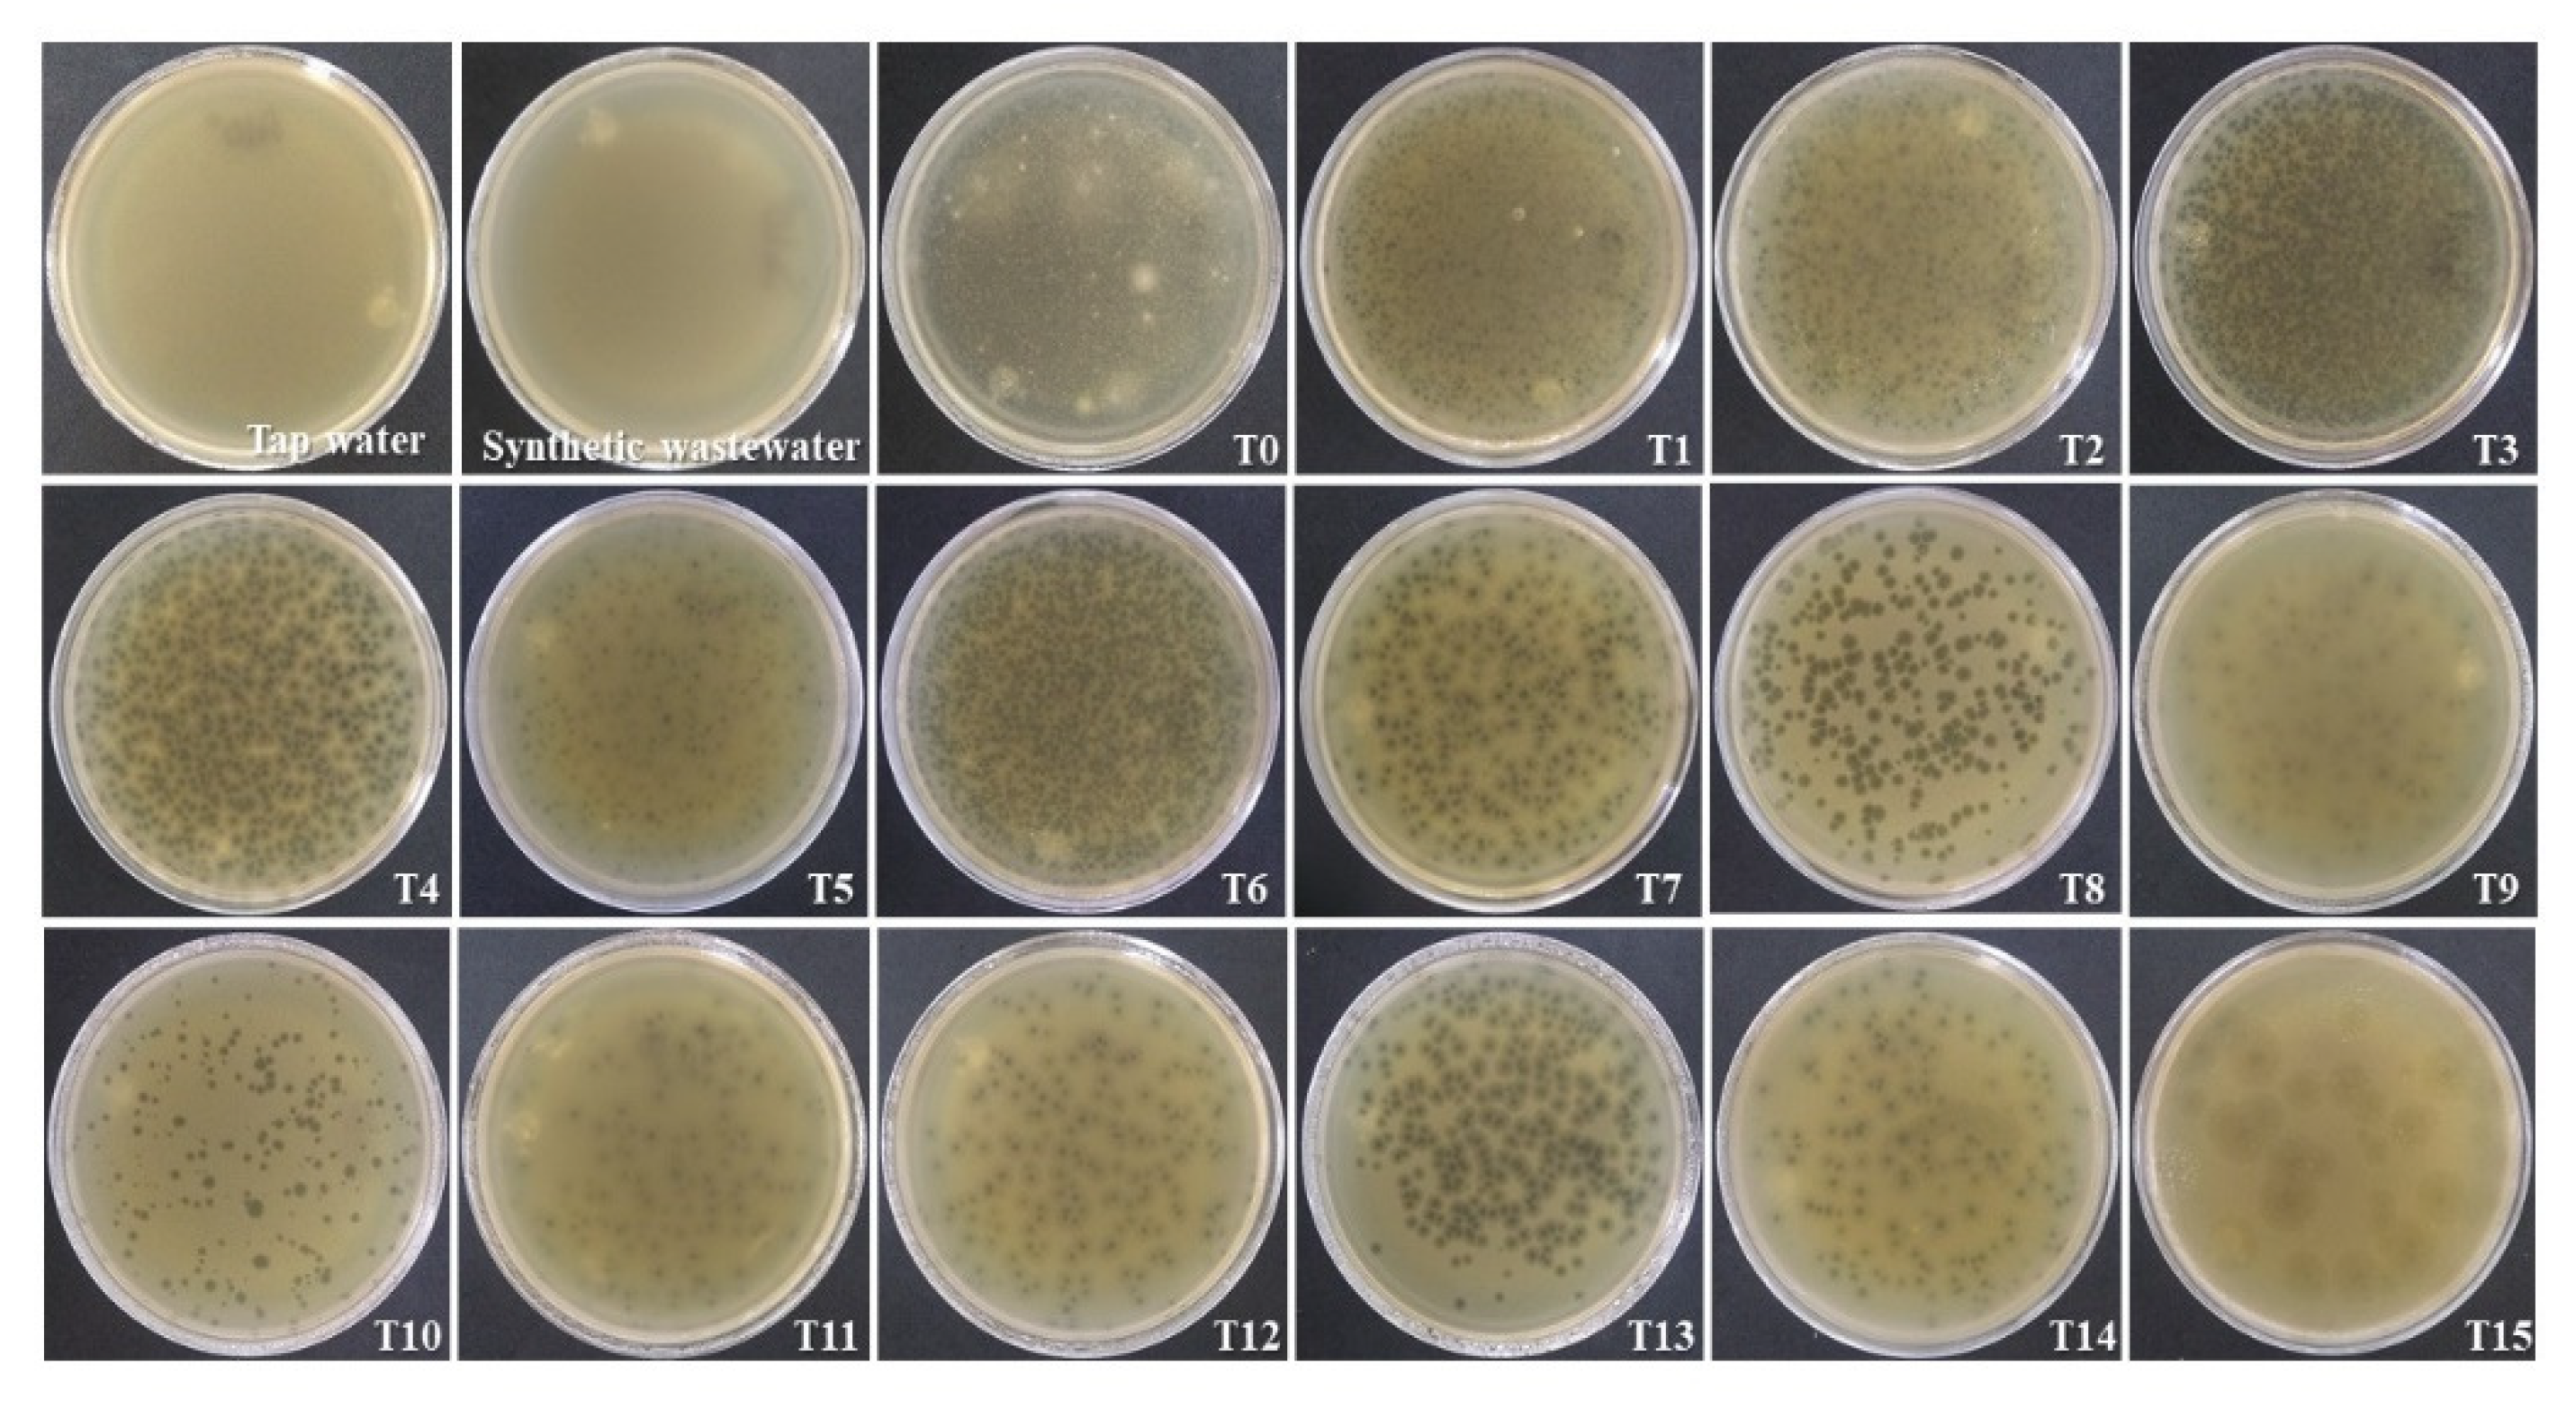
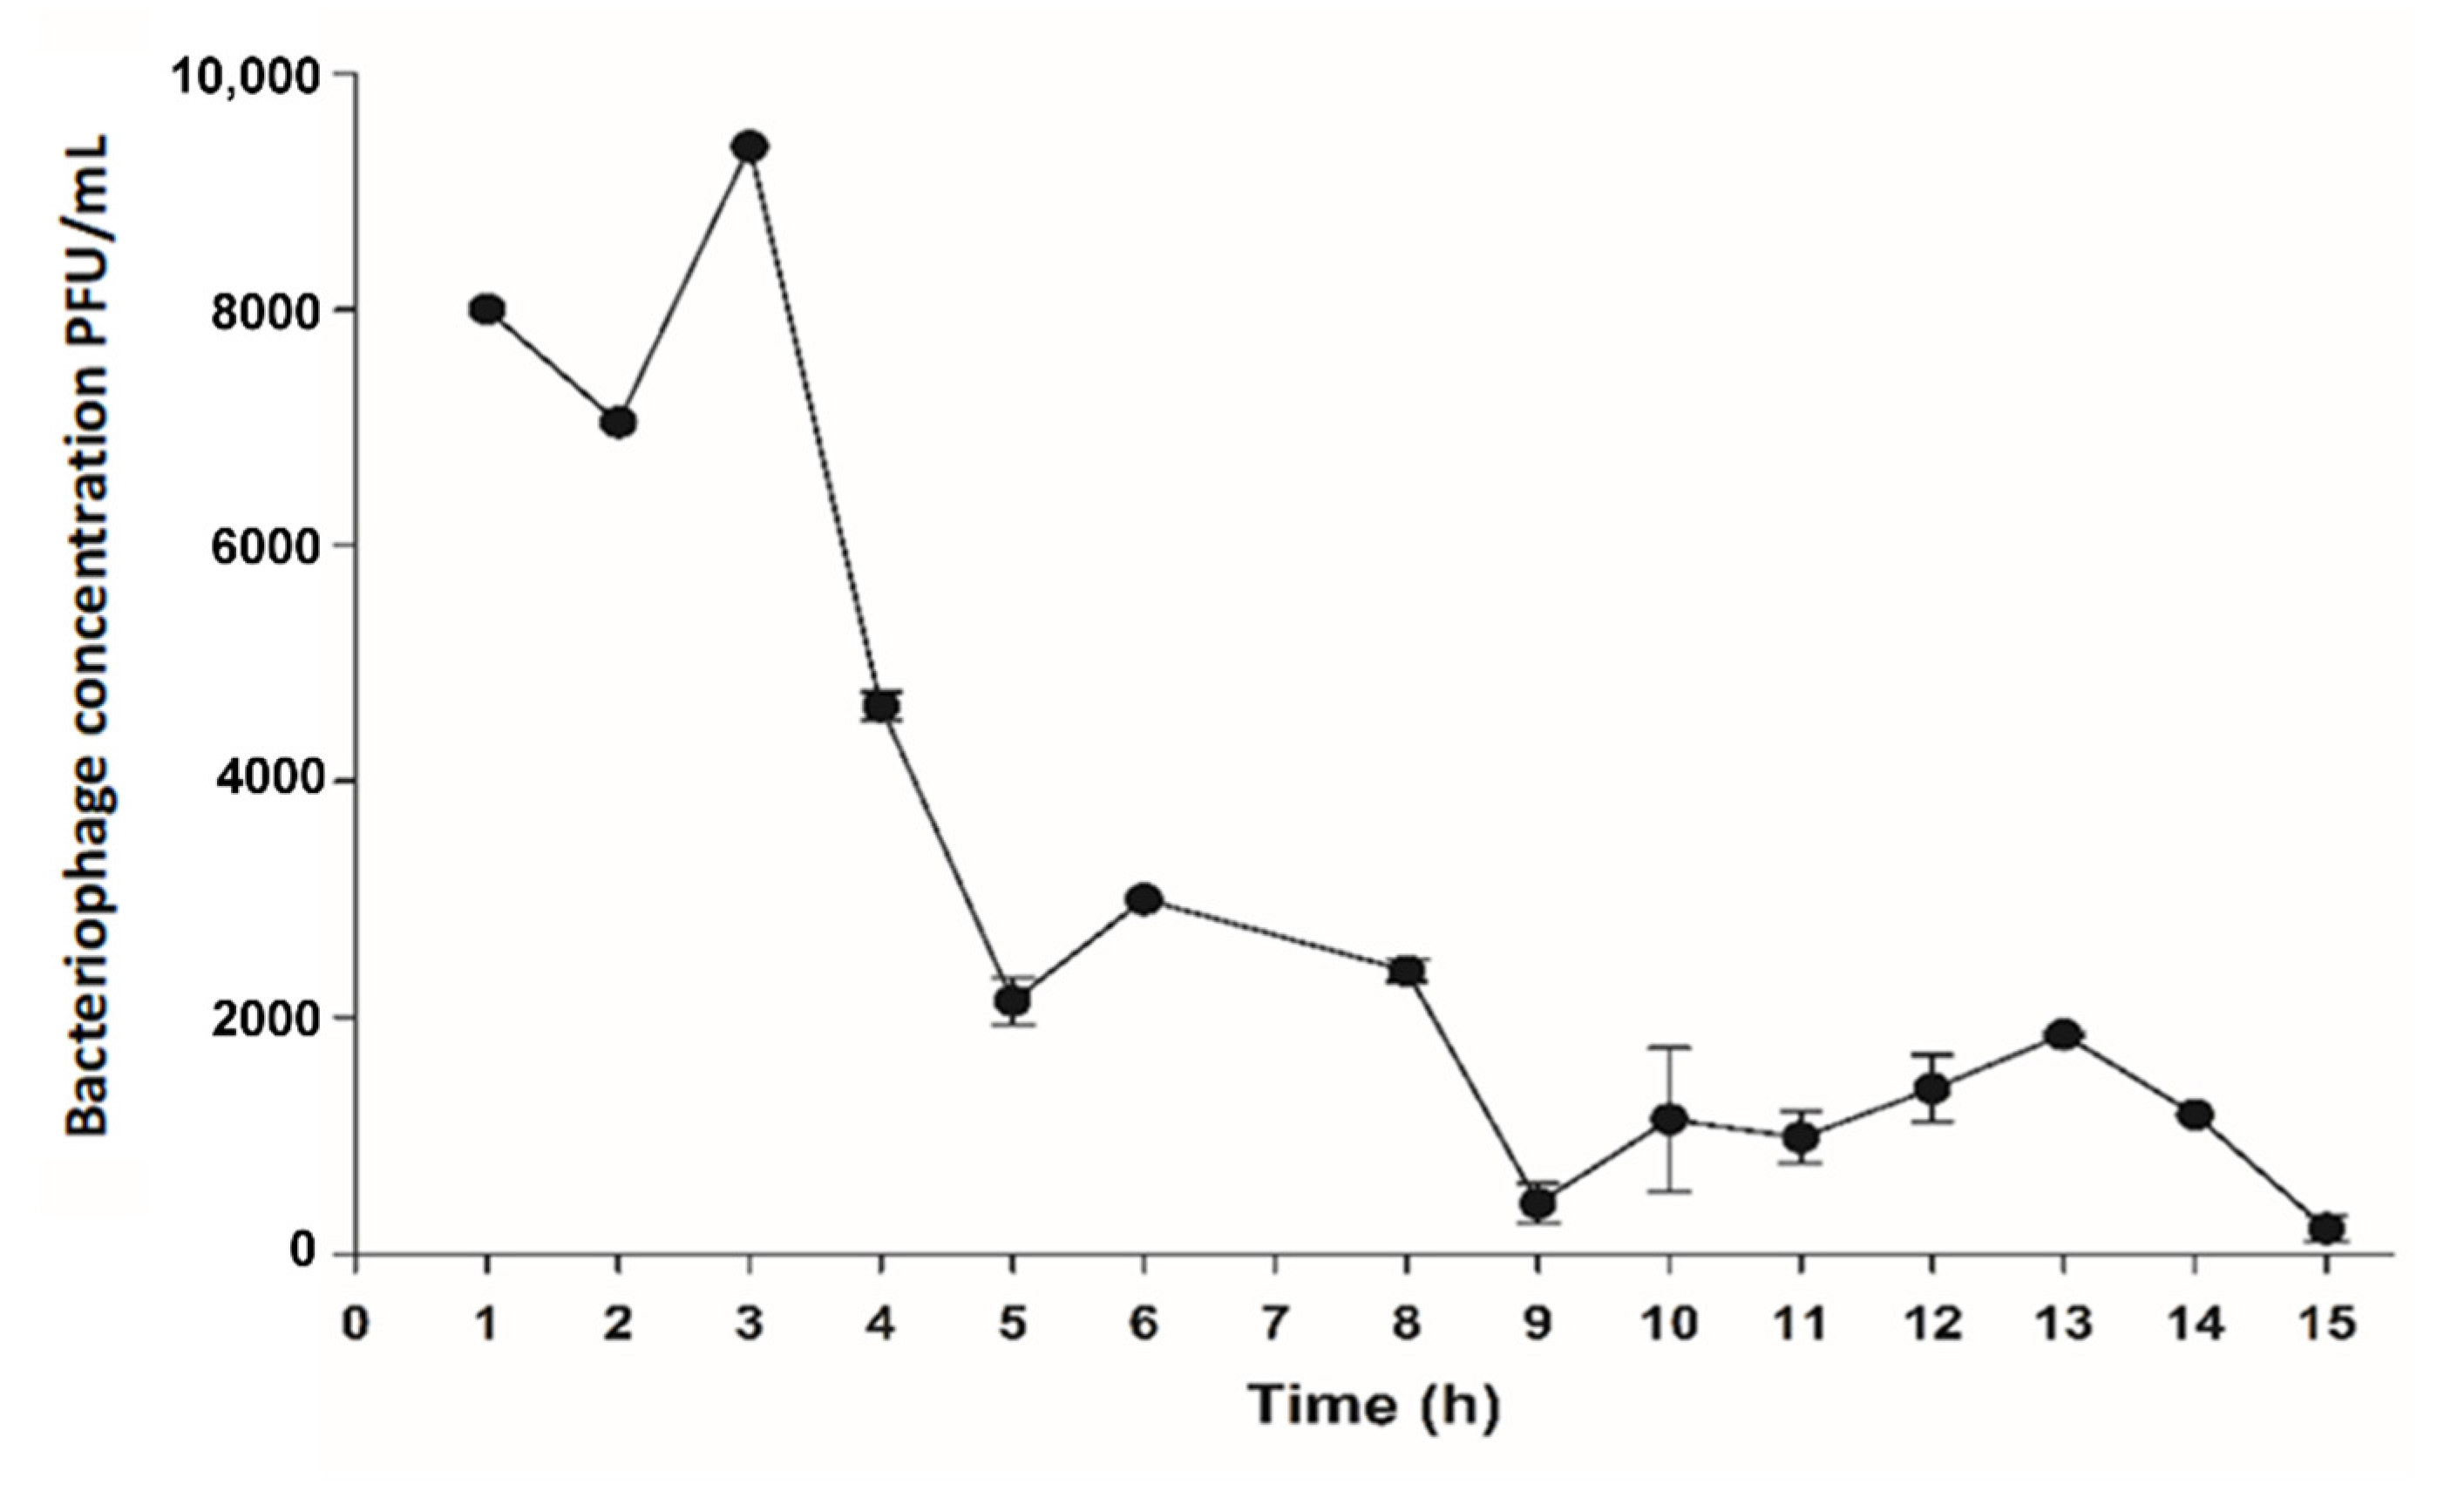
3.2. Coliphage MS2 Removal

The coliphage obtained in the quantification of the five repetitions was 230 PFU, giving an average of 46 PFU per plated milliliter. Since the quantification was carried out in a 10−10 dilution, the bacteriophage titer was 4.6 × 10¹¹ PFU/mL in a recovered volume of 25 mL.
The scaled-up bioelectrochemical system had a working volume of 167 L and was inoculated with the recovered volume, giving an initial coliphage concentration of 6.89 × 10⁷ PFU/mL of the treatment (T0). The negative controls, synthetic residual water, and tap water with which it was prepared presented a complete and intact bacterial plate, as shown in Figure 3 (Petri dishes), unlike T0, where many hydrolysis points were caused by the bacteriophage. Bacteriophage removal by the bioelectrochemical treatment system was more noticeable from 6 h after the start of treatment; after 15 h (T15), there were no hydrolytic spots on the bacterial plaque.
The coliphage MS2 density removal through the bioelectrochemical treatment system is visualized in Figure 4. The concentration of the bacteriophage was quantified up to 15 h of treatment, after which it was stopped due to the excessive yeast and bacteria in the system. Although there were fluctuations in the removal behavior of the bacteriophage, a clear reduction in concentration was evident from 3 h until less than 300 PFU/mL were counted.
The logarithmic reduction values (LRV) calculated for each time-point sampled during treatment are presented in Table 1. The results showed an increase in the logarithmic reduction over time.

4. Discussion

4.1. Evaluation of Physicochemical and Electrochemical Parameters

The chemical oxygen demand line had a slight negative slope trend between T0 to T15 h. As shown in Figure 2a, the inoculation value of coliphage MS2 was 1370 mg/L; subsequently the COD showed a slight increase (from T1 to T10) due to the release of organics and metabolites as well as bacterial enrichment in electrochemically active biofilm species inside the anodic biofilm [21,22]. Likewise, the current from T1 to T10 showed a slight increase for approximately 10 h and then slowly decreased over the remaining time [21,22]. Figure 2a shows a COD range from 1370 ± 10 mg/L to 1152 ± 05 mg/L, being values close in removal to that reported by Rashid and colleagues [23], who treated pharmaceutical industrial wastewater in an MFC and reached 26.92% COD reduction in the first cycle. Likewise, the Glastonbury trial of high-flow-rate COD reduction capability showed that the system as a whole had a maximum mean of 25% per day [3].
The scaled-up bioelectrochemical system chronoamperometry is shown in Figure 2b; over the 24 h, the sum of the current varied from 14 to 10 mA, decreasing at 4 mA; similarly, the sum of the voltage was 4 volts for nine microbial fuel cells, maintaining a stable system regarding power generation with slight variation over time. The current values per cell remained at an average of 1.3 mA, similar to the results reported in the work of Kim and colleagues [24], who obtained 1.07 mA per cell with a current generation of 0.87 mA.
The VFAs (volatile fatty acids) at T0 (inoculation of coliphage MS2) increased by 83 ppm due to the presence of protein; however, 1 h later it had fallen to 990 ppm and subsequently at T14 to 955 ppm, reaching 970 ppm at T23. As the substrate used in this study was synthetic wastewater containing mainly acetic acid, we expected the constant presence of VFA. VFAs are important intermediate products with six carbons or fewer, including acetic acid, propionic acid, and butyric acid, and can be utilized for electricity generation in MFC, being more easily absorbed by exoelectrogen compared with macromolecules and demonstrating lower viscidity as a fuel substrate. The superiority of acetate as an electron donor for anode-respiring bacteria over other VFAs has been demonstrated (Figure 2c) [25]. The pH reduced from 7.4 to 7.15, as shown in Figure 2d; no serious pH variation was observed. In general, the pH in the anode chamber decreased by releasing protons during redox metabolism, even though a concentration phosphate buffer was used inside the chamber [1,26].

4.2. Coliphage MS2 Removal in Bioelectrochemical Treatment System

The stack voltage measurement (summation) was 3.4 ± 0.1 V while the current was 12.8 ± 0.7 mA, resulting in a power of 47.25 mW. These values were higher than those reported by Pasternak and colleagues [1], who used single-chamber air-cathode MFCs (closed-circuit cascade) and obtained 200 mV and a maximum power of 70 uW.
A control without the coliphage MS2 was carried out in this study. The results showed that both current and voltage were lower without the coliphage MS2. Coliphage MS2 densities decreased from 8000 to 285 PFU/mL at T15; these results suggest that the initial interaction between an electroactive community and phage was essential for the potential generation in our stack. It is possible that the bacterial community interacted with the large number of phage particles, since the charges on the surface of the phage are H+ ions [27].
The coliphage MS2 densities decreased, most likely as a result of their degradation in the MFC stack; such results are suggested to be the result of changes in pH (there was a greater presence of protons between 1 and 9 h, Figure 2d) and other possible factors including physical and chemical factors (ethanol, glutaraldehyde, and enzymatic degradation), but this is not conclusive. It will be necessary to carry out more research in this are [1]. The enriched microbial consortia are also rich in proteolytic enzymes, which could have affected the virus inactivation; proteolytic enzymes are known for their efficient degradation in feces and sewage [1,2,28]. In addition, an electroactive community that is able to metabolize the available carbon energy into electricity could be responsible for the killing or suppression of pathogenic bacteria and viruses as a result of antagonism from the incumbent biofilm competition against these incoming pathogenic perpetrators [29].
The kinetics could be not quantified up to 24 h because after 15 h, there was an excessive growth of yeast in the system and the PFU could only be quantified up to that time. In order to solve this problem inherent to the treatment system, it was decided in the following experiment to filter the sample water before plating. Since two replications of each box were made to obtain the average PFU/mL at each time-point, it was observed that there were variations in the number of PFUs per plate. However, despite the variations, the reduction in the PFU/mL at 15 h (T15) was evident (Figure 3).
The calculated values of the logarithmic reduction proved that within the first three hours, the value of the logarithmic reduction ranged from 3.9 to 3.8. However, during hours 4 to 14, the values varied from 4.1 to 4.8 (with the exception of hour 9, because the sample was taken at another point of the acrylic cube), and in hour 15 the value increased to 5.3. The results obtained indicate that the scaled bioelectrochemical treatment system was efficient in reducing MS2 phage concentrations from 4 h, with another reduction from 15 h. In comparison with other studies where the highest efficiency of Hepatitis B virus inactivation was observed for a retention time of approximately 1.5 h, the microbial fuel cells tested here would require at least 10 h of hydraulic retention time to reach a log reduction of 1.0 and obtain 90% of reduction [1].

5. Conclusions

Few studies have investigated the removal of model viruses or pathogens in MFC systems. In this study, the inactivation in the scaled-up bioelectrochemical system required approximately 15 h (hydraulic retention time) to reduce by 5.3 log fold. Therefore, the results show that coliphage MS2 was efficiently reduced and essential for the potential generation in this bioelectrochemical system. Further research is needed on this topic.

Author Contributions

Conceptualization, L.A.-G. and C.H.-Z.; writing—review and editing, R.T.-T., J.D.-M. and L.A.-G.; investigation, R.C.-V., L.A.-G., J.D.-M., G.R.G. and C.H.-Z.; methodology. All authors have read and agreed to the published version of the manuscript.

Funding

This research was funded by CONACYT (National Council of Science and Technology), grant number 313216.

Institutional Review Board Statement

Not applicable.

Informed Consent Statement

Not applicable.

Data Availability Statement

Data is contained within the article.

Acknowledgments

Not applicable.

Conflicts of Interest

The authors declare no conflict of interest.

References

  1. Pasternak, G.; Greenman, J.; Ieropoulos, I. Removal of Hepatitis B virus surface HBsAg and core HBcAg antigens using microbial fuel cells producing electricity from human urine. Sci. Rep. 2019, 9, 11787. [Google Scholar] [CrossRef] [Green Version]
  2. Ieropoulos, I.; Pasternak, G.; Greenman, J. Urine disinfection and in situ pathogen killing using a Microbial Fuel Cell cascade system. PLoS ONE 2017, 12, e0176475. [Google Scholar] [CrossRef] [Green Version]
  3. Ieropoulos, I.A.; Stinchcombe, A.; Gajda, I.; Forbes, S.; Merino-Jimenez, I.; Pasternak, G.; Sanchez-Herranz, D.; Greenman, J. Pee power urinal–microbial fuel cell technology field trials in the context of sanitation. Environ. Sci. Water Res. Technol. 2016, 2, 336–343. [Google Scholar] [CrossRef] [Green Version]
  4. Naddeo, V.; Liu, H. Editorial Perspectives: 2019 novel coronavirus (SARS-CoV-2): What is its fate in urban water cycle and how can the water research community respond? Environ. Sci. Water Res. Technol. 2020, 6, 1213–1216. [Google Scholar] [CrossRef]
  5. Hung, H.C.; Chan, D.W.; Law, L.K.; Chan, E.H.; Wong, E.S. Industrial experience and research into the causes of SARS virus transmission in a high-rise residential housing estate in Hong Kong. Build. Serv. Eng. Res. Technol. 2006, 27, 91–102. [Google Scholar] [CrossRef]
  6. Wurtzer, S.; Waldman, P.; Ferrier-Rembert, A.; Frenois-Veyrat, G.; Mouchel, J.M.; Boni, M.; Madaye, Y.; OBEPINE consortium; Marecha, V.; Moulin, L. Several forms of SARS-CoV-2 RNA can be detected in wastewaters: Implication for wastewater-based epidemiology and risk assessment. Water Res. 2021, 198, 117183. [Google Scholar] [CrossRef]
  7. Al Huraimel, K.; Alhosani, M.; Kunhabdulla, S.; Stietiya, M.H. SARS-CoV-2 in the environment: Modes of transmission, early detection and potential role of pollutions. Sci. Total Environ. 2020, 744, 140946. [Google Scholar] [CrossRef] [PubMed]
  8. Científicos del CICY Detectan al SARS-CoV-2 en Aguas Residuales en Q. Roo. Available online: https://www.cicy.mx/noticias-y-eventos/boletin-08-cientificos-del-cicy-detectan-al-sars-cov-2-en-aguas-residuales-en-q-roo (accessed on 30 April 2021).
  9. Rosiles-González, G.; Carrillo-Jovel, V.H.; Alzate-Gaviria, L.; Betancourt, W.Q.; Gerba, C.P.; Moreno Valenzuela, O.; Tapia-Tussell, R.; Hernández-Zepeda, C. Environmental surveillance of SARS-CoV-2 RNA in wastewater and groundwater in Quintana Roo, Mexico. Food Environ. Virol. 2021. under review. [Google Scholar] [CrossRef]
  10. Atkins, J.F.; Steitz, J.A.; Anderson, C.W.; Model, P. Binding of mammalian ribosomes to MS2 phage RNA reveals an overlapping gene encoding a lysis function. Cell 1979, 18, 247–256. [Google Scholar] [CrossRef]
  11. Fiers, W.; Contreras, R.; Duerinck, F.; Haegeman, G.; Iserentant, D.; Merregaert, J.; Min Jou, W.; Molemans, F.; Raeymaekers, A.; Van den Berghe, A.; et al. Complete nucleotide sequence of bacteriophage MS2 RNA: Primary and secondary structure of the replicase gene. Nature 1976, 260, 500–507. [Google Scholar] [CrossRef] [PubMed]
  12. Tapia-Tussell, R.; Valle-Gough, R.E.; Peraza-Baeza, I.; Domínguez-Maldonado, J.; Gonzalez-Muñoz, M.; Cortes-Velazquez, A.; Leal-Baustista, R.; Alzate-Gaviria, L. Influence of two polarization potentials on a bioanode microbial community isolated from a hypersaline coastal lagoon of the Yucatan peninsula, in México. Sci. Total Environ. 2019, 681, 258–266. [Google Scholar] [CrossRef]
  13. Ghasemi, M.; Daud, W.R.W.; Ismail, A.F.; Jafari, Y.; Ismail, M.; Mayahi, A.; Othman, J. Simultaneous wastewater treatment and electricity generation by microbial fuel cell: Performance comparison and cost investigation of using Nafion 117 and SPEEK as separators. Desalination 2013, 325, 1–6. [Google Scholar] [CrossRef]
  14. Nandy, A.; Kumar, V.; Mondal, S.; Dutta, K.; Salah, M.; Kundu, P.P. Performance evaluation of microbial fuel cells: Effect of varying electrode configuration and presence of a membrane electrode assembly. New Biotechnol. 2015, 32, 272–281. [Google Scholar] [CrossRef] [PubMed]
  15. Atkinson III, R.W.; Hazard, M.W.; Rodgers, J.A.; Stroman, R.O.; Gould, B.D. An open-cathode fuel cell for atmospheric flight. J. Electrochem. Soc. 2016, 164, F46. [Google Scholar] [CrossRef]
  16. Valladares Linares, R.; Domínguez-Maldonado, J.; Rodríguez-Leal, E.; Patrón, G.; Castillo-Hernández, A.; Miranda, A.; Díaz Romero, D.; Moreno-Cervera, R.; Cámara-chale, G.; Borroto, C.G.; et al. Scale up of microbial fuel cell stack system for residential wastewater treatment in continuous mode operation. Water 2019, 11, 217. [Google Scholar] [CrossRef] [Green Version]
  17. Alzate-Gaviria, L.M.; Dominguez-Maldonado, J.A.; Del Rio-Rivera, F.J.; Flota-Banuelos, M.I.; Camara-Chale, G.R. Electronic circuit for harvesting energy from ultra-low power sources. U.S. Patent Application No. 15/752,830, 4 August 2020. [Google Scholar]
  18. Water Environmental Federation; American Public Health Association (APHA). Standard Methods for the Examination of Water and Wastewater; American Public Health Association: Washington, DC, USA, 2005. [Google Scholar]
  19. Pind, P.F.; Angelidaki, I.; Ahring, B.K. A new VFA sensor technique for anaerobic reactor systems. Biotechnol. Bioeng. 2003, 82, 54–61. [Google Scholar] [CrossRef]
  20. Shimoyama, T.; Komukai, S.; Yamazawa, A.; Ueno, Y.; Logan, B.E.; Watanabe, K. Electricity generation from model organic wastewater in a cassette-electrode microbial fuel cell. Appl. Microbiol. Biotechnol. 2008, 80, 325–330. [Google Scholar] [CrossRef] [PubMed]
  21. Monasterio, S.; Mascia, M.; Di Lorenzo, M. Electrochemical removal of microalgae with an integrated electrolysis-microbial fuel cell closed-loop system. Sep. Purif. Technol. 2017, 183, 373–381. [Google Scholar] [CrossRef]
  22. Erable, B.; Etcheverry, L.; Bergel, A. From microbial fuel cell (MFC) to microbial electrochemical snorkel (MES): Maximizing chemical oxygen demand (COD) removal from wastewater. Biofouling 2011, 27, 319–326. [Google Scholar] [CrossRef] [PubMed] [Green Version]
  23. Rashid, T.; Sher, F.; Hazafa, A.; Hashmi, R.Q.; Zafar, A.; Rasheed, T.; Hussain, S. Design and feasibility study of novel paraboloid graphite based microbial fuel cell for bioelectrogenesis and pharmaceutical wastewater treatment. J. Environ. Chem. Eng. 2021, 9, 104502. [Google Scholar] [CrossRef]
  24. Kim, K.Y.; Chae, K.J.; Choi, M.J.; Yang, E.T.; Hwang, M.H.; Kim, I.S. High-quality effluent and electricity production from non-CEM based flow-through type microbial fuel cell. Chem. Eng. J. 2013, 218, 19–23. [Google Scholar] [CrossRef]
  25. Yang, G.; Wang, J.; Zhang, H.; Jia, H.; Zhang, Y.; Cui, Z.; Gao, F. Maximizing energy recovery from homeostasis in microbial fuel cell by synergistic conversion of short-chain volatile fatty acid. Bioresour. Technol. Rep. 2019, 7, 100200. [Google Scholar] [CrossRef]
  26. Indarto, A.; Ikhsan, N.A.; Wibowo, I. Applications of carbon nanotubes for controlling waterborne pathogens. Waterborne Pathog. 2020, 433–461. [Google Scholar] [CrossRef]
  27. Gupta, R.; Bekele, W.; Ghatak, A. Harvesting energy of interaction between bacteria and bacteriophage in a membrane-less fuel cell. Bioresour. Technol. 2013, 147, 654–657. [Google Scholar] [CrossRef] [PubMed]
  28. Santhanam, K.S. Electrochemical approaches towards sensing viruses: A mini review. Med. Devices Sensors 2021, 4, e10148. [Google Scholar]
  29. Smith, S.C.; Rodrigues, D.F. Carbon-based nanomaterials for removal of chemical and biological contaminants from water: A review of mechanisms and applications. Carbon 2015, 91, 122–143. [Google Scholar] [CrossRef]
Figure 1. Stack Setup: (A) Assembly for 9 cells; (B) MFC components [16]. Reproduced with permission from Rodrigo Valladares Linares, Water; published by MDPI, 2019.
Water 13 02756 g001
Figure 2. Evaluation of physicochemical and electrochemical parameters during wastewater treatment and reduction of coliphage MS2: (a) COD mg/L; (b) current and voltage; (c) VFA mg/L; (d) pH.
Water 13 02756 g002
Figure 3. Samples taken from bioelectrochemical treatment system with coliphage MS2, using double-layer method. Negative controls (tap water and synthetic wastewater) and samples taken at times 0–15 h (T0–T15), every hour.
Water 13 02756 g003
Figure 4. Coliphage MS2 concentration (PFU/mL) in the bioelectrochemical treatment system.
Water 13 02756 g004
Table 1. Values of the logarithmic reduction and efficiency percentage in the bioelectrochemical treatment system.
Time after Coliphage MS2 Inoculation (Hours)Initial Concentration
(Ci; PFU/mL)
Final Concentration
(Cf; PFU/mL)
Logarithmic Reduction Value (LRV)Efficiency Percentage
(%)
16.89 × 10780003.9499.9884
26.89 × 10770403.9999.9898
36.89 × 10793803.8799.9864
46.89 × 10746354.1799.9933
56.89 × 10732804.3299.9952
66.89 × 10730004.3699.9956
86.89 × 10723954.4699.9965
96.89 × 1074305.2099.9994
106.89 × 10711404.7899.9983
116.89 × 1079854.8499.9986
126.89 × 10714004.6999.9980
136.89 × 10718554.5799.9973
146.89 × 10711804.7799.9983
156.89 × 1072855.3899.9996
Publisher’s Note: MDPI stays neutral with regard to jurisdictional claims in published maps and institutional affiliations.

