Abstract
In Nigeria, the rural population comprises 49% of the total population and has been reported to bear the brunt of ongoing water access challenges. For communities to have access to clean and safe water, an adequate water source should be ensured. In dissevering the definition of water access, this research identifies that distance to a water source, time spent to collect water, water availability, and water quality are determinants of water source choice. A survey with 404 randomly selected respondents was conducted in three local government areas in Kogi state alongside interviews with key participants (n = 12). The data collected were analysed using a Chi-square test to determine any significant relationship between water source choice and the predictor variables (age, education, occupation, religion, ethnic group, household size, income, and distance). Furthermore, multinomial logistic regression was adopted to investigate the relationship and effect between these variables. Findings indicated that the predictor factors such as age, level of education, ethnic group, and participants’ occupation have a statistically significant relationship with using a particular water source. Finally, more insights for policymakers are provided to bridge the gap surrounding water access in developing countries while focusing on an adequate water source.
1. Introduction
Water access (WA) has been a demanding issue concerning the rural communities globally for several decades [1,2] and was included in the sustainable development goals (SDG6). The SDG6 indicates that the availability and sustainable management of water and sanitation is to be made accessible to every member of society. Irrespective of this, several rural areas still face difficulties in addressing issues related to WA. In Nigeria, the rural population comprises 49% of the total population and has been reported to bear the brunt of ongoing WA challenges [3]. Naturally, most rural communities in Nigeria have water resources present within their communities, such as rivers and lakes, but utilising such sources can yield negative outcomes, due to contamination and pollution, subsequently leading to life-threatening illness [4,5].
1.1. Potable Water Access Definition
There have been several definitions of WA across many pieces of literatures. However, regardless of the variations in WA definition, factors such as distance, quantity, source, and time are commonalities found when defining WA [6,7]. It is important to grasp the true meaning of WA, as unclear understanding and interpretation in WA definition was identified to be problematic in early years [6]. Misinterpretation of WA makes it difficult to address the underlying issue of inadequate WA in general [6,7]. In defining WA, the World Bank [8] describes WA as when individuals have access to a safe water source (SWS) of good quality, positioned not more than 200 m away from dwelling, further implying that a considerable amount of time should not be spent when collecting water. The World Health Organisation (WHO) describes adequate water access to be from an adequate source free from pollutants and chemicals, situated within a reasonable distance while being readily available when needed by individuals [9]. However, the World Health Organisation [10] going further in their definition indicates that individuals are entitled to at least 20 litres of water per day and should not spend more than 30 min to and from their destination to get water. A factor such as ‘distance’ to and from the SWS can differ depending on locale (whether it is urban and rural) as it is discussed by several authors [8,11,12], where they argue that urban residents are perceived to spend less time in collecting water compared to rural inhabitants. Additionally, Ritchie and Roser [13] emphasise the fact that the presence of SWS within a reasonable distance to an individual’s dwelling does not affirm adequate WA if the water quality is debatable. This study hereby adopts the WHO and UN-Water’s definition of WA encompassing distance, quality, source, waiting time, and availability as essential criteria in ensuring WA. Therefore, WA is defined in this study as readily available water meeting individual’s daily requirement of minimally 20 litres per day from an appropriate source, free from contaminants such as chemical, faecal, or other forms of waste situated. Furthermore, the WA should be within walking distances of less than a mile to individuals’ dwellings, where the time spent to collect/fetch would not exceed 30 min.
1.2. Water Access Infrastructure and Quality Issues in Nigeria
To address ongoing WA issues in Nigeria, several organisations (such as the World Bank, African Development Bank, French Development Bank, USAID, and partners), go on to fund Water, Sanitation and Hygiene projects (WASH) across the country in affected areas. These WASH projects are aimed at providing sustainable water access to 2.5 million affected Nigerians [14]. It is important to note that most of Sub-Saharan Africa is dependent on ground water supply [7,15]. In Nigeria, groundwater availability is linked to geographical location, whereby some regions have it in abundance, and other regions do not [16]. Furthermore, groundwater is threatened by pollution and contaminants. In areas where groundwater is naturally available, other factors such as uncontrolled exploitation and mismanagement threaten WA availability [17]. To manage water-related matters, several governing bodies have been put in place (Table 1).

Table 1.
Overview of water governing bodies in Nigeria and their responsibilities.
The water projects being implemented are mainly borehole types across sub-Saharan regions [18]. These types of water projects (borehole) can pose a challenge when it comes to maintenance, as many of the implemented schemes have been reported to fail and subsequently have been abandoned by rural communities [19].
Other water projects being initiated in Nigeria and sub-Sahara are usually centralised water systems, which make it more tasking to meet the needs of all community members, taking distance, time, quantity, and availability into consideration [18]. Affordability is another limitation that can arise. There are reported cases that have been identified in Thambonkulu community, South Africa, where the price of water increases as water demand also increases [20]. Putting a high cost on the water can compel individuals to adopt alternate means of water regardless of whether the alternate source is considered safe or not [18,21]. Additionally, in a study conducted in Malawi and Zambia, Scanlon et al. [19] argues that the high cost of water resources involuntarily forces individual(s) in communities to abandon a SWS, which can hinder the planned sustainability of the water scheme.
In addressing WA issues, another area to investigate would be water quality threatened by pollution [22,23,24] resulting from either agricultural, industrial, or household contaminants [25,26,27]. Livestock grazing has been identified to pollute surface water sources [28]. This pollution occurs through the transportation of pathogens from faecal waste, fertilisation processes, and animal nutrients (nitrogen and phosphorous), which are harmful to the human body [29]. As the population is rapidly increasing in developing countries [30], more specifically in Nigeria [15], maintaining substantial sanitary and hygienic practices has been proven to be a challenge [31,32]. The consequence of this is contaminated SWS, leading to life-threatening ailments more dominant in rural parts of the country [27,33].
In Nigeria, Galadima et al. [34] identified water quality to be affected by both non-point source and point source pollution. Run-off from polluted areas is the primary source of non-point pollution in Nigeria, while point source pollution is mainly by industrial, sewage waste, and oil spills. Local communities in Nigeria were identified to be hugely affected by water pollution [35]. Their study identified various cultural lifestyles to influence water pollution, such as the use of unconventional toilets, inappropriate waste disposals, nonchalant erection of structures that block drainage, and agricultural practices such as the improper use of fertilisers and pesticides.
1.3. Current Advancement in Water Access Issues in Nigeria
Irrespective of these shortcomings, we cannot fail to identify efforts by government, stakeholders, and non-governmental organisations in improving WA. Studies have reported some progress with the number of populations with improved SWS (ISWS) when the comparison is made with past years and more recent years (Figure 1). However, there is still room for more advancement [24,31] especially as safe drinking water still shows a rise in inadequacy over time (Figure 1).
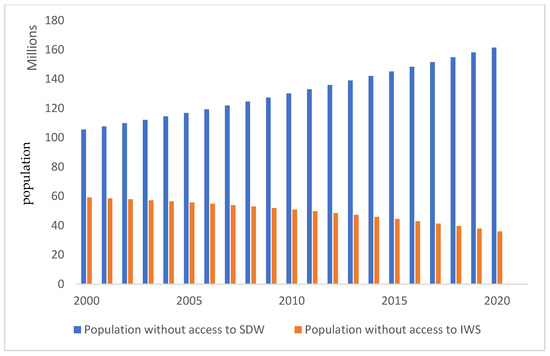
Figure 1.
Overview of the population without access to safe drinking water (SDW) and ISWS in Nigeria from 2000 to 2020 (Obtained from [13]).
As at 2020, from the 202 million population in Nigeria, 161 million do not have access to ISWS, while 35.8 million approximately are without access to safe drinking water (SDW) [13]. ISWS is defined as a “SWS which by nature of its construction, adequately protects the water from outside contamination” [35]. However, having access to ISWS does not guarantee access to safe drinking water, which is when drinking water quality conforms with the WHO drinking-water quality guidelines on acceptable microbiological and chemical levels [35], which are also free from pollution and contaminant [13].
Not only is water needed for our survival and considered our basic human right, but it is also believed that to improve sustainable development in rural areas, and adequate WA is considered an essential element in achieving this [21,30,36,37].
1.4. Barriers to Water Access—The Role of Socio-Cultural Factors
Eichelberger [38] highlighted the influence of socio-cultural factors on access to adequate water. Traditional beliefs, social norms, and various traditional practices determine what type of SWS is used by the rural communities in Alaska [38], where most individuals utilise poor SWS because of their cultural heritage and ties. This report conforms with studies by Smith [39] where they investigated ethnic minorities in the United Kingdom, Kenya [36], and Nepal [28], where cultural factors have been identified to influence water access. Maurice et al. [27] further stressed that communities with strong cultural ties are seen to disregard the quality of an SWS due to inherited habits. In the context of Nigeria, where diversity in culture and ethnicity is evident across all states, Crow and Sultan [40] attribute these disparities in culture to be an influencing factor in how water resource is accessed.
Another socio-cultural factor identified to influence adequate WA is gender inequality [31]. When it comes to deciding water access and ownership of water resources, women are often underrepresented [40], making it a male-dominated position. Gender disparity is apparent with regard to natural resource ownership in Nigeria [41]. Most water projects carried out in Nigeria are mainly controlled by men in rural parts of the country [42]. This practice can be relatively linked to the Hofstede cultural dimension of a high level of power distance within this community [43,44], which then have limited chances of development and growth [45]. In addition, equal gender representation in the use and decision making of natural resources can improve their management [46,47].
Gender discrimination is predominant in remote areas of the world [48], and this is because of the strong cultural values being preserved within these communities. For instance, in rural parts of Benin, the average time spent by young female children in collecting water is estimated to be an hour in a day, compared to male children reported to spend less than 30 min [11]. Asides from gender inequality, social inequality and exclusion have been identified to impact equal WA across communities [31].
Key roles of social actors such as traditional rulers in ensuring WA in Sub-Saharan Africa have been identified [19], further recognising that cultural factors such as religion in rural parts of Zambia have been established to influence WA.
Additionally, several practices such as farming, fishing, and other daily activities are also seen to influence water access in rural Nigeria. On top of climate change, the traditional farming practices contribute to the further worsening of water scarcity and increasing groundwater pollution [15,49,50]. This traditional method is accustomed to rural communities, and community members find it difficult to adopt more modern sustainable practices due to existing cultural ties and effort to preserve their cultural values [51].
1.5. Kogi State Water Project Formulation
In a bid to address the ongoing issues highlighted with water access under the SDG 6 framework, the federal government in Nigeria awarded several water projects to all thirty-six states in the country, targeting rural communities. The water projects were tendered and opened for bidding to private contractors (Figure S1: contractor bid) who were awarded the contract to develop ISWS in specific locations selected by the Federal Ministry of Works and Housing (FMWH), under the Federal Republic of Nigeria. The Kogi project commenced in 2017, and the contractors selected are paid in stages and receive up to 90% of payment only after the completion of the project. Afterwards, the contractors are subject to a waiting period of 6 months to ensure any defects with the water scheme are addressed before they are paid the remaining 10% (Figure S2: certificate of defect). The contractors must work with engineers appointed by the FMWH whose presence on site is essential in determining the water source location and type of water source that fits the location. The federal government engineers are the local expert that makes the decision onsite regarding what type of water source (borehole, handpump) is suitable for the rural community. Through collaboration with the community leaders, the site where the water scheme would be situated is selected (this is usually where tribal dominance takes hold, as the ethnic group with favoured political personnel or party will be at the forefront of the decision-making process which determines in which area the water source will be located). Some contractors implemented motorised or solar boreholes (as recommended by the onsite engineer) (Figure S3: borehole design). After the project completion and the 6-month defect period elapses, the responsibility of maintaining the ISWS is then transferred to the community leader who ensures long-term functionality of the ISWS in cooperation with the community residents. The entire community has free access to the water source that has been provided and is now being managed locally by the appointed community members/leaders. They are expected to come up with ways to manage the schemes through maintenance fees and other minor contributions according to what is determined by the community and their leaders. However, in some areas where a solar borehole was proposed, long-term management issues of a technical nature discouraged the idea, which then led to a switch to a motorised borehole system. This preferred system will be cheaper to manage, and communal contribution for fuel and maintenance was agreed to be a better option for the beneficiaries.
1.6. Conceptual Model Development
WA issues in developing countries are central to the lack of adequate infrastructure and a proper SWS [52]. To address WA issues, SWS has been identified to be an influencing factor in Nigeria [53]—with the presence of an adequate SWS, water access issues in affected communities would be tackled. Therefore, this study focuses on SWS choice and several predictors. According to prior studies, an adequate SWS is described as an ISWS, which can be either a borehole, piped scheme, and/or protected wells [35,54]. To further understand the influencing factors on SWS choice, studies carried out by Abubakar [54] and Emenike et al. [55] in Nigeria identified demographic factors such as distance to SWS, gender, household size, education, occupation, and income level to contribute to choosing a type of SWS being used by individuals in concerned rural communities. These findings are in line with other studies carried out in other regions such as Jamaica [30], Ecuador [27], and Nepal [29], where cultural factors such as gender inequality, beliefs, traditional practices, and religion [19] were also identified to influence decisions on SWS usage. This paper’s main hypothesis is that the predictor variables (age, water distance, gender, occupation, education, ethnic group, religion, income, household size) will influence the choice to use a particular water source.
1.7. Study Objectives and Goals
This study aims to identify the influence of demographic factors (gender, education, income, occupation) and cultural factors such as religion and ethnic groups [55] on water access in rural communities in Kogi state, Nigeria. Similar studies have been carried out in Nigeria in the northeastern and northwestern regions of the country [55] as well as in the southwestern part of Nigeria [56], where influencing factors such as age, ethnicity, gender, household size, state, and local government area (LGA) of residency, occupation, wealth, and level of education of the household head amongst other factors were investigated. However, this paper is conducted in a different region, the Middlebelt part of Nigeria, Kogi state, and it would go a step further to add to the uniqueness of the current research by investigating and identifying the level at which these factors have an effect on SWS choice.
Furthermore, this study aims to proffer recommendations for future studies and policymakers in addressing issues surrounding WA. These will be achieved by identifying how the aforementioned factors influence the choice to use a particular SWS.
The structure of this paper is as follows: Section one (Introduction) defines WA, and it also includes a literature review on the barriers to WA and SWS, a conceptual model, the problem statement, study goals, and the objective. Section two (Materials and Methods) highlights the methodology used for this research. Section three presents the results of the study. Section four highlights the discussion from the results and it concludes with the final section, which presents recommendations and a summary of the findings.
2. Materials and Methods
2.1. Study Area
Kogi state is among the states in the Federal Republic of Nigeria located in the middle belt region. Kogi has a total land area of approximately 30,230 km2. The state is popularly known as the confluence state because of the meeting of two rivers (river Niger and river Benue). There are mainly two climate seasons: the wet/rainy season (April–October) and dry/harmattan season (November–April). As a result of this seasonal variation, alternate SWS is vital.
Based on the 2016 national census, the estimated population count is 4,473,544. The state is inhabited by diverse people from different cultural backgrounds. Kogi state is divided into three zones: Kogi East, Kogi West, and Kogi Central. This study was conducted in Kogi East, which is dominated by the Igala ethnic group. Kogi has more than ten different ethnicities and cultures [57,58], which are richly flourished with natural resources ranging from water, land, and minerals. Within Kogi state, there are six main ethnic groups (Table 1). The state is mainly dominated by rural communities, amassing almost 70% of its population [58]. Occupations such as technical craft and trading are evident in the state, but the economy is mainly boosted by agricultural income, primarily through fishing and farming [58,59]. Kogites (as inhabitants of the state are known to be called) have three main religious beliefs, which are Christianity, Islam, and traditional religion.
The characteristics of the participants in the study with relation to water collection are described as follows: 35.6% of participants travel on foot to the water source destination, usually less than 15 min or less than 1 mile, as described in more details in the Results section. Furthermore, participants use buckets and gallons as water collection instruments (Appendix A Figure A1; Appendix A Figure A2). The average daily trip made to the water collection points is twice, in the morning and evening. A good portion (60%) of the individuals, as described in Appendix A Table A1, utilise the water for domestic consumption within their households.
This study was conducted in the eastern part of the state in three LGA (Figure 2) namely, Dekina, Omala, and Ankpa, which in total have an area of 867.04 km² and are situated approximately 41 km apart from each other. These LGAs were randomly selected from the list of LGAs that were approved beneficiaries of government implemented water schemes within Kogi state [60]. The selected LGAs are mainly dominated by rural communities, having most of the inhabitants specialising in agricultural practices, petty trading, and vocational jobs as a means of livelihood, with a few white-collar jobs in the region [58]. The LGAs are home to numerous tribes, with the majority group being Igalas; other tribes are Bassa, Agatu, Yoruba, and Idoma. Until recently, the residents of the study region depended on the water from rivers and streams and collected water for their daily needs. Still, some areas rely on these sources; however, the introduction of water projects to the region gives room for the residents to have options to choose from another range of SWS (e.g., motorised borehole systems and handpumps borehole systems) (Table 2). The rural communities studied were selected based on the number of approved water projects being implemented through the Federal Government of Nigeria.
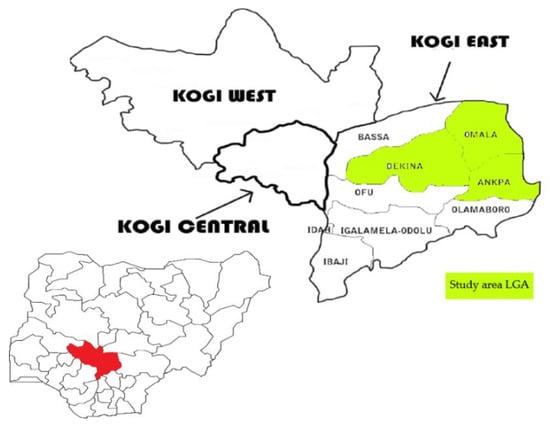
Figure 2.
Map of Kogi state showing the study area.
Table 2.
The various water source with description of the level of adequacy.
2.2. Data Collection and Analysis
This study used the viewpoint that water access is a basic human right, also emphasised in SDG 6, wherein every individual is entitled to potable water. Multistage sampling was adopted for this research. Based on the list of states that were beneficiaries of the water projects that have been implemented and ongoing, Kogi state was selected, after which the three LGAs within Kogi state were randomly selected [61]. Participants were also randomly selected. The questionnaire survey was administered to 404 community members residing in any of the three selected LGAs described as follows: Dekina LGA (n = 140), Ankpa LGA (n = 132), and Omala LGA (n = 132) between June and July 2019. To build a good rapport with the community and assist with language barriers, a male local guide was present during the survey administration process.
The questionnaire was elaborated based on the adoption of the Joint Monitoring Programme (JMP) 2018 core questions intended for a water access household survey to monitor WASH and SDGs in affected communities. The questionnaire comprised of 19 questions, which were grouped to collect demographic and other relevant information used to measure the participants’ access to water such as the SWS being used, their culture and ethnical background, along with their level of knowledge about and involvement in water management activities. The questions were designed as open-ended, multiple-choice, and a 5-point Likert-scale option. Water access is measured in this study using SWS (that is, the selected choice of SWS indicated by respondents). To identify the main water source in the study area, multiple-choice questions were used, including tap/borehole, tap/handpump, well, stream, and reservoir. Further insight on cultural factors of water access issues and effects of socio-cultural factors were identified through structured interviews with key players in the community [62]. A total of 12 participants including four community leaders, four farmers, two civil servants, and two private contractors were purposively selected from the three LGAs where the study was conducted (four participants from each LGA).
Qualitative data were analysed using the online application DEDOOSE for coding and analysis of transcribed data. For the quantitative data, STATA version 13 was utilised for the analysis. A Pearson Chi-square test of association was used to test for relationships between a dependent variable (SWS choice) and independent variables (demographic). Multinomial regression [56] was used at a multivariate level to explain the relationships between dependent (water source choice) and independent variables [29,63,64] (age, gender, level of education, religion, occupation, household size, income, and ethnic groups). This choice of analysis has been used by prior research [55,56] in similar studies conducted in southern and western regions of Nigeria; hence, its adoption in the current study is being carried out in the middle belt region of Nigeria (Table 3).
Table 3.
Characteristics of the main ethnic groups in Kogi state (source; author).
Multinomial Logistic Regression Model
The multinomial logistic regression assumes that the dependent variable should be nominal in nature; the independent variable(s) should not be multicollinear and should be more than one (either be nominal, ordinal, or continuous); the continuous independent variable and logit transformation of dependent variable should be linear in nature; the dependent variable should have exclusive categories; the model should not have high influential points and outliers [65].
To achieve the econometric specification of the dependent variable, which is SWS, the research adopts the use of the multinomial logistic regression model. SWS choice is accessed using the following predictor variables: (1) Age, (2) Gender, (3) Ethnic group, (4) Religion, (5) Household size, (6) Level of education, (7) Occupation, (8) Monthly income, and (9) Distance to a water source.
According to Rodriguez [65], the model estimates a set of coefficients, (1), (2), and (3)…, corresponding to each outcome
In the model, there is more than one solution to (1), (2), and (3) that leads to the same probabilities for y = 1, y = 2, and y = 3; therefore, we set any one of the coefficients ((1), (2), and (3)) to 0. In other words, if (1) is set =0, the other coefficients (2) and (3) will measure the change relative to the y = 1 group, and so on.
If (1) = 0, then:
The SWS selected by the participants vary by distance to WS and other socio-demographic parameters. All obtained parameters must be interpreted relatively to this reference category, which is stream. SWS has M categories (Table 4); hence, we calculate M-1 equations for each of the categories relative to the reference category in the other to describe the relationship between the predictor variable and dependent variable. Given the probability (Pr = (Yi = j)), to sum one over remaining choice, we then have this equation: , allowing probability to be calculated independently. To solve the problem, we use normalisation to set the following = 0, k = 1, …, K. Considering this, normalisation Zi1 = 0, hence, the equation below:
Table 4.
Descriptive statistics of key variables (N = 404).
To calculate the log odds, the probability of outcome (j = m) to outcome (j = k) from the equations above ((7) and (8)), the equation below is derived. The log odds are the logarithm of the odds ratio, meaning the coefficient normalised by the standard error.
2.3. Socio-Demographic Characteristics of the Study
The descriptive characteristics of respondents are shown in Table 4. The survey evenly covered samples from three LGAs in Kogi state: 132 (32.7%) respondents from Ankpa, 140 (34.7%) from Dekina, and 132 (32.7%) from Omala. The majority of respondents (52.5%) belong to the Igala ethnic group (out of the five groups), the rest are distributed among Ebira (7.9%), Yoruba (Okun) (12.4%), Agatu (11.4%), and small tribes such as Hausa, Igbo, and Nupe (15.8%). The majority of the respondents proclaim association with Christianity (56.2%) and Islam (43.8%). Male respondents 241 (59.7%) prevailed over females 163 (40.3%) with an average age of about 30 years.
As regards the highest level of education achieved, 22.3% of the respondents have primary education, 42.6% have secondary education, 20.3% have higher education, and 14.9% have technical education. The respondents live in households comprising on average 2.6 members.
As for the occupation, the respondents reported themselves as small business owners (30.7%), farmers (24.8%), students (18.3%), civil servants (16.6%), and blue collar workers (9.7%) including mechanics, welders, carpenters, brick layers (mason), and electricians. The income was measured using the minimum wage at the time of survey, which is 18,000 naira (43 USD). Only 11.9% of the respondents indicated that they earn less than 18,000 naira as monthly income, 40.1% earn more than 18,000 as household monthly income, while the majority (159 respondents) 39.4% refused to divulge information about their monthly income, while 35 (8.7%) of the respondents did not have a monthly income.
Distance to SWS was measured using the time it takes to walk to the SWS. The study estimated 30 min of walking to be approximately 2 miles (3.2 km) using a pace calculator; (with the average speed being 0.0667 per minute). Most (79%) of respondents indicated they walk less than 15 min (less than 1 mile) to a SWS, while only 4.0% respondents indicated that they walk more than 3.2 km to the SWS.
3. Results
3.1. Association between a Water Source Choice and Predictor Variables
When testing for the relationship of the independent variables with the dependent variables, the study adopted the use of the Chi-square test [55]. The test shows the association between respondents’ characteristics and the SWS being used by the respondents. The results show a significant relationship between the level of education and type of SWS used (p ≤ 0.001). Aside from respondents that indicated they had just a primary level of education, where it shows that their main water source was a “stream”, the rest (secondary, technical, and higher education) had 16%, 5.4%, and 10.4% respectively, indicating “tap/borehole” source to be their main SWS. Additionally, there was a significant relationship between age and type of SWS used (p = 0.055, confidence interval = 90%) (Table 5). From Table 5, most of the participants (4.5%) that fall within the age group 42 years and above utilise “stream” compared to the younger population, where the majority indicated that “tap/borehole” was their main source of water. Table 5 also indicates that more than 50% of the participants in each of the income level categories utilise ISWS (i.e., either tap/borehole or tap/handpump). The majority (56, 13.9%) of the respondents who earn more than N18,000 had access to “tap/borehole” water, 33 (8.2%) had access to “stream” water, and 23 (5.7%) of them had access to “well” water. Fifteen (3.7%) of the respondents who earn less than N18,000 had access to “tap/borehole” water, while 10 (2.5%) had access to “well” water, and 7 (1.7%) had access to “stream” water.
Table 5.
Test of association between predictor variables and water source used (N = 404).
3.2. Influence of Predictor Factors on the Choice of Water Source Usage
3.2.1. Influence of Age on Water Source Choice
The multinomial logistic regression results (Appendix A, Table A2) show that the age of the respondents influences the choice of water source being used. While using “stream” as the reference category, only “tap/handpump” was statistically significant (p = 0.027), with the log odds for respondents within the age group 42 years and above choosing “tap/handpump” over “stream” to be -1.822 times less than respondents within the age group of 18–25 years. Even though the other water sources did not show any statistical significance, they all had negative coefficients, which implies that respondents that fall with the age groups (42 and above) when compared to the age group (18–25 years) are more likely going to choose “stream” over the other water sources investigated in this study. During the interview, an older respondent (54 years) expressed comfort and freedom as a reason for choosing to use “stream”. In a similar finding, [65] identified that households that are headed by people aged between 35 and 55 years were utilising an unimproved SWS compared to the households headed by younger people.
3.2.2. Influence of Education on the Water Source Choice
The relationship between water source choice and education was determined by placing the category primary education as redundant to identify the impact of the other levels of educations observed (secondary, technical, and higher education). With the reference category being “stream” while having all other factors constant, the multinomial logistic regression showed that the level of education has a positive effect on the choice to use a particular type of water scheme by participants. For “tap/borehole”, education was significant (p = 0.007, 0.023, and 0.001, for secondary, technical, and higher education, respectively) and has a positive predictor. The log odds of participants that have secondary education choosing “tap/borehole” over “stream” is 2.439 times greater than participants that have primary education. For participants with technical education and higher education, log odds = 2.509 and 5.618, respectively. For “tap/handpump”, the predictor was positive for all the education groups (secondary, technical, and higher): for secondary education (p = 0.001, log odds = 3.496), for technical education (p = 0.001, log odds = 4.027), and for higher education (p = <0.001, log odds = 6.988). Looking at “well”, secondary and higher education showed statistical relationships (p = 0.027, log odds = 2.031) and (p = 0.021, log odds = 4.168) respectively, indicating that respondents with higher and secondary education are more likely going to choose a “well” over a “stream”. In addition, there exists no statistical relationship between the level of education and “reservoir” for all educational levels. This relationship is not far-fetched from the fact that 10.4% of those with higher education had access to tap/borehole water, which is by convention known as the cleanest source of water.
3.2.3. Influence of Ethnic Groups on Water Source Choice
The tap/handpump category shows that only the “Okun/Yoruba” tribe are statistically significant (p = 0.018, log odds = −2.168), denoting that in comparison to Igala participants, Okun/Yoruba participants are less likely going to choose “tap/handpump” over “stream”. For “well”, the results (Appendix A Table A2) show it is statistically significant (p = 0.012, log odds = 0.997), for “Agatu” and (p = 0.003, log odds = 1.632) for “other” tribes. This implies that participants are more likely going to choose a “well” over a “stream” compared to respondents that identify as Igalas. Findings are similar with “reservoir”, where “Agatu” (p = 0.050, log odds = 1.536) and “other” tribe (p = 0.05, log odds = 2.075) show a statistically significant relationship. The results indicate that the minor ethnic groups (Agatu and other tribes) in comparison to the dominant ethnic group (Igalas) are more likely going to utilise water of lesser quality. The MLR shows that “tap/borehole” and “tap/handpump” have no significant relationship with the tribe of the respondents.
3.2.4. Influence of Occupation on Water Source Choice
The results (Appendix A Table A2) show a statistically positive coefficient for occupation and most of the choices with “stream” being the base outcome and “farmers” as the redundant. Looking at “tap/borehole”, for “students”, p = 0.009, log odds = 0.153; for respondents that engage in “business”, p = 0.001, log odds = 1.349. For choosing “well”, those that engage in business were the only statistically significant group (p = 0.002, log odds = 1459). “Reservoir” shows only respondents that work as “civil servants” (p = 0.008, log odds = 2.495) and engage in “business” (p = 0.031, log odds = 1.979) to be statistically significant. In Table 5, from the 24.8% of respondents that identify as farmers, 10.9% indicated that they use a “stream”. Evidently, farmers in rural Kogi East that participated in the study prefer streams due to the ease as the majority of these farmers spend most of their day (leaving very early in the morning and returning late in the afternoon) on their farmland working. During the interview, a female farmer (41 years) indicated that it is more conducive to collect water when she is working, so she journeys to the farm with water containers. “… When we go to the farm, on our way back home we can carry water filled containers straight home, we would not have to branch somewhere to fetch water…”.
In addition, due to the regulation of the water schemes (construction of tap/borehole, tap/handpump), there is miscommunication and discrimination as to when farmers come to the water point to fetch water. Respondents indicated that they strictly monitor farmers when they come to use a “tap/borehole” because they feel they waste it on their produce, as a community female member (teacher) 32 years responded within the interview: “… We have to strictly monitor to ensure that they (farmers) do not come and waste the water, emptying our tanks for their crops when we have not seen enough to use for ourselves…”.
3.2.5. Influence of Distance to on Water Source Choice
Looking at the results from the MLR (Appendix A Table A2), the tap/borehole category shows that participants that walk between 15 and 30 min, alongside participants that walk approximately 15 min, are statistically significant ((p ≤ 0.0001, log odds = 1.341) and (p ≤ 0.0001, log odds = 7.634)). Participants that fall within this group are more likely going to choose a tap/borehole compared to those that walk less than 15 min. Similar results are seen for tap/handpump. For “well”, the result shows that respondents that walk between 15 and 30 min had a negative coefficient (p ≤ 0.0001, log odds = −15.989). This implies that respondents that fall within this group are less likely going to choose a “well” compared to participants that must walk less than 15 min to the water schemes. For “reservoir”, participants that walk approximately 15 min to water are more likely going to choose that over “stream” compared to participants that walk less than 15 min to the water source. Table 5 shows the majority (35.6%) of respondents that walk less than 15 min use a tap/borehole, and 3.5% of respondents that use a stream indicated that they walk more than 30 min.
4. Discussion of Findings
In the association between a water source choice and predictor variables, the study finds no significant relationship between sex of the respondents and type of water source used within the communities. Similar findings are reported in the studies conducted in Eswatini [66], Ghana [63], and in Malawi [67], where there exists no statistical relationship between gender and SWS choice. Additionally, it was discovered that no significant relationship exists between household monthly income and type of water source. This is likely since the cost to use a SWS in the region is almost free of charge except for minor maintenance fees, as the water schemes being introduced are funded by the government. However, Abubakar [55] reports that income was stated to influence SWS. Similarly, Gondo et al. [68] argue that a high level of income determines household access to SWS; however, this study shows no significant relationship.
Looking at the influence of age on water source choice, the findings reveal all negative coefficients, implicating that older respondents are more likely going to choose a “stream” over the other sources investigated as earlier mentioned. An explanation for this outcome can be seen through modernism that is associated with younger generations, as they are more likely to use a “tap/borehole” (comparatively reviewed as new methods). Furthermore, another reason besides curiosity and exposure to modern tools is that most of the elderly members of the participants that were interviewed indicated that they would rather use a source that they are comfortable with. In their research conducted in Eswatini, Simelane et al. [66] argued that respondents below the age of 35 are seen to be from richer households compared to the older respondents; as a result, they were able to afford ISWS for their use.
Moving on to the influence of education on water source choice, as expected, individuals with a higher level of education are perceived to prefer using ISWS compared to those with only basic education because of their wider knowledge and exposure. One reason could be the fact that the educated population tend to understand the health risk [56] and thus opt to use SWS. This finding is in line with Akoteyon [53], where the research identified that participants that are uneducated use poor SWS compared to educated participants. Similarly, using education as a socioeconomic factor, Iranti et al. [69] argue that educated people are more likely going to use improved SWS compared to uneducated individuals.
For the influence of ethnic group on choice of water source, the results reveal that minor ethnic groups (Agatu and other tribes) in comparison to the dominant ethnic group (Igalas) are more likely going to utilise water from lesser quality. These findings corroborate with prior studies [55,70] where the prevalent ethnic groups are seen to utilise water from adequate sources compared to lesser ethnic groups. In a study conducted in Nigeria, it was identified that distinct ethnic groups have a preference with regard to the type of water source being used [55]. The research also identified that a larger portion of the dominant ethnic group utilise ISWS in comparison to the subordinate ethnic groups [55]. A reason for this disparity could be associated with the political affiliation of dominant ethnic groups. In this study, the dominant ethnic group, which is defined by the population and ruling party, is “Igala”. This ethnic group can be more daring in requesting for developmental changes, which can be attributed to them having a sense of ownership. Subsequently, they become beneficiaries of new water schemes that also result from existing ties to the ruling party in the region. In a similar finding from a study conducted in Zambia, Mulenga et al. [70] also identified inequalities in access to ISWS between various regions. The research argues that a particular province, which was identified to be the beneficiary to several water projects, was seen to have more access to SWS compared to other provinces that did not have these projects in their regions.
In explaining the influence of occupation on choice of water source, the findings suggest that farmers have the least favoured occupation when SWS availability is determined, as they are believed to overuse communal water sources. This argument is supported by Gomez et al. [71], where agricultural practices in rural communities are seen to negatively impact access to SWS in middle- and low-income countries that were investigated. The study further argues that excessive water is consumed during agricultural practices in comparison to being used for the household [71].
Furthermore, the walking distance to the water source shows that a participant chooses their water source according to ease. Distance to a water source is a factor known to influence water access and water source usage, as identified by several authors [8,9,10,11,12]. This could be the reason why newly implemented water schemes (boreholes and handpumps) that are initiated by the government are centralised and within reasonable distance to households. In a similar context, Deal and Sabatini [72] indicated that handpumps are situated in close distance to households.
The research highlights that the majority of the participants in the study area utlises water from improved sources stemming from government intervention through water schemes in the regions. However, the lessons learnt from this study implicate the inequalities in certain fractions whereby older, less educated individuals still depend on unimproved water sources, despite the availability of IWS, which is mainly due to the lack of awareness. Nonetheless, water access in Kogi rural communities have been improved in several local governments, including the study areas. Therefore, this study may be adapted in similar regions taking into consideration lessons learnt from the study.
Additionally, the study conducted has provided many insights into the problems associated with water access while investigating water sources in rural parts of Kogi state. It has also uncovered the rationale behind water source choice among rural communities in Nigeria. However, it is not without some limitations. The study was carried out during the rainy season, which means that water sources such as streams and reservoirs would be functional. Even though the government water projects implemented in these vicinities should serve especially during the dry and harmattan seasons, the investigation was only carried in the specified rainy season; hence, it is possible that in November up to April, the variation in seasonality may impact the choice of a water source. However, a prior study indicates that rainwater harvesting is hardly practiced in Nigeria [56] and would contribute little to the current research goals.
5. Conclusions and Recommendation
The significance of providing public education in rural communities has been emphasised based on the findings of this study, as a lower level of education is associated with the use of unimproved water sources. Therefore, it is important for public awareness and basic education to be encouraged in rural communities of developing countries. Recalling the objectives of SDG 4 (quality education) and SDG 6 (clean water and sanitation), policymakers are responsible for providing an inclusive, quality primary free basic education especially in rural poor communities to avoid poor decisions that are detrimental to well-being. Furthermore, the study highlights the issues that persist amongst minority ethnic groups. Similarly to the less educated, minority ethnic groups usually end up with poor water sources, and this inequality should be addressed in regions where dominant tribes are seen to have autonomy on the distribution of water projects or schemes and the usage of water provided under such schemes. Alongside the minority ethnic groups, farmers are another group affected with discrimination when improved water sources are used such as tap/boreholes. Due to the nature of their occupation of which irrigation is heavily dependent, they are regarded as wasteful with water usage; therefore, alternatives such as providing famers with better options for irrigation should be incorporated into water project formulation so that these groups may have equal access to improved water source. Finally, the study suggests that the government, policymakers, and project implementers, in developing countries and rural communities, should investigate the issues identified (lack of awareness, education, and equal participation) to tackle inequality to water access and further the achievement of sustainable development goals in the process.
Supplementary Materials
The following are available online at https://www.mdpi.com/article/10.3390/w13192755/s1, Figure S1: contractor bid, Figure S2: certificate of defect, Figure S3: borehole design.
Author Contributions
Conceptualisation, J.O.A. and J.M.; methodology, J.O.A. and J.M.; validation, J.O.A. and J.M.; formal analysis, J.O.A.; investigation, J.O.A.; data curation, J.O.A.; writing—original draft preparation, J.O.A.; writing—review and editing, J.M.; supervision, J.M.; project administration, J.M.; funding acquisition, J.O.A. and J.M. All authors have read and agreed to the published version of the manuscript.
Funding
This study is supported by the Internal Grant Agency (IGA) of the Faculty of Tropical AgriSciences, Czech University of Life Sciences (IGA20205008; IGA20213111).
Institutional Review Board Statement
Not applicable.
Informed Consent Statement
Not applicable.
Data Availability Statement
Not applicable.
Conflicts of Interest
The authors declare no conflict of interest.
Appendix A
Table A1.
Test of association of water practices with water source.
Table A1.
Test of association of water practices with water source.
| Type of Water Source | Stream | Tap/Borehole | Tap/Handpump | Well | Reservoir | Total | p-Value |
|---|---|---|---|---|---|---|---|
| Number of respondents (%) | |||||||
| Cost of maintenance of the water point is reasonable | 0.014 ** | ||||||
| Strongly Disagree | 5 (1.2) | 6 (1.5) | 1 (0.2) | 1 (0.2) | 0 (0.0) | 13 (3.2) | |
| Disagree | 16 (4.0) | 15 (3.7) | 13 (3.2) | 4 (1.9) | 0 (0.0) | 48 (11.9) | |
| Neutral | 23 (5.7) | 40 (9.9) | 26 (6.4) | 17 (4.2) | 6 (1.5) | 112 (27.7) | |
| Agree | 31 (7.7) | 87 (21.5) | 41 (10.1) | 50 (12.4) | 20 (5.0) | 229 (56.7) | |
| Strongly Agree | 0 (0) | 2 (0.5) | 0 (0.0) | 0 (0.0) | 0 (0.0) | 2 (0.5) | |
| 404 (100) | |||||||
| Women and children do the water fetching for domestic needs | <0.0001 *** | ||||||
| Strongly Disagree | 0 (0) | 3 (0.7) | 0 (0.0) | 0 (0.0) | 0 (0.0) | 3 (0.7) | |
| Disagree | 10 (2.5) | 70 (2.4) | 38 (9.4) | 31 (7.6) | 12 (2.9) | 161 (39.8) | |
| Neutral | 22 (5.4) | 37 (5.4) | 15 (3.7) | 13 (3.2) | 9 (2.2) | 96 (23.7) | |
| Agree | 41 (10.1) | 37 (10.) | 28 (6.9) | 28 (6.9) | 5 (1.2) | 139 (34.4) | |
| Strongly Agree | 2 (0.5) | 3 (0.4) | 0 (0.0) | 0 (0.0) | 0 (0.0) | 5 (1.2) | |
| 404 (100) | |||||||
| The water available is better used for farming activities than domestic ones | <0.0001 *** | ||||||
| Strongly Disagree | 0 (0) | 18 (0)) | 3 (0.7) | 0 (0.0) | 0 (0.0) | 21 (5.1) | |
| Disagree | 3 (0.7) | 123 (0.7) | 62 (15.3) | 21 (5.1) | 13 (3.2) | 222 (54.9) | |
| Neutral | 11 (2.7) | 8 (2.0) | 13 (3.2) | 33 (8.2) | 12 (3.0) | 77 (19.1) | |
| Agree | 57 (14.1) | 0 (0) | 2 (0.5) | 18 (4.5) | 1 (0.2) | 78 (19.3) | |
| Strongly Agree | 4 (1.0) | 1 (0.2) | 1 (0.2) | 0 (0.0) | 0 (0.0) | 6 (1.5) | |
| 404 (100) | |||||||
| Daily trips to water points for households use | <0.0001 *** | ||||||
| 3 times a day | 34 (8.4) | 61 (15.1) | 51 (12.6) | 43 (10.6) | 16 (4.0) | 205 (50.7) | |
| 5 times a day | 3 (0.7) | 80 (19.8) | 18 (4.5) | 16 (4.0) | 3 (0.7) | 120 (29.7) | |
| More than 5 times a day | 0 (0.0) | 4 (1.0) | 4 (1.0) | 1 (0.2) | 2 (0.5) | 11 (2.7) | |
| Once a day | 6 (1.5) | 2 (0.5) | 0 (0.0) | 0 (0.0) | 0 (0.0) | 8 (2.0) | |
| Twice a day | 32 (7.9) | 3 (0.7) | 8 (2.0) | 12 (3.0) | 5 (1.2) | 60 (14.9) | |
| 404 (100) | |||||||
| The water is used for cooking | <0.0001 *** | ||||||
| Disagree | 0 (0.0) | 0 (0.0) | 0 (0.0) | 5 (1.2) | 0 (0.0) | 5 (1.2) | |
| Neutral | 39 (9.7) | 1 (0.2) | 0 (0.0) | 11 (2.7) | 2 (0.5) | 53 (13.1) | |
| Agree | 33 (8.2) | 149 (36.9) | 81 (20.0) | 54 (13.4) | 24 (5.9) | 341 (84.4) | |
| Strongly Agree | 3 (0.7) | 0 (0.0) | 0 (0.0) | 2 (0.5) | 0 (0.0) | 5 (1.2) | |
| 404 (100) | |||||||
N = 404, Confidence level = 95%, 90%, *** p value ≤ 0.001, ** p value ≤ 0.05, 0.1.
Table A2.
Multinomial logistic result.
Table A2.
Multinomial logistic result.
| Water Source Used | Variables | Values | Coef. | Std. Err. | p > z |
|---|---|---|---|---|---|
| Stream | (Base outcome) | ||||
| Tap/Borehole | |||||
| Age | years | ||||
| 26–33 | 0.6825705 | 0.959345 | 0.477 | ||
| 34–41 | 1.54005 | 1.218627 | 0.206 | ||
| 42 and above | −1.464128 | 1.144241 | 0.201 | ||
| 18–25 b | |||||
| Level of education | |||||
| Secondary * | 2.438755 | 0.9112686 | 0.007 | ||
| Technical * | 2.509305 | 1.102314 | 0.023 | ||
| Higher * | 5.617636 | 1.767656 | 0.001 | ||
| Primary b | |||||
| Religion | |||||
| Islam | −0.4578727 | 0.6720153 | 0.496 | ||
| Christian b | |||||
| Tribe | |||||
| Ebira | 1.844106 | 1.223997 | 0.132 | ||
| Okun/Yoruba | −2.068542 | 0.885295 | 0.019 | ||
| Agatu | −0.443176 | 1.08457 | 0.683 | ||
| Others | 0.5753387 | 0.921216 | 0.532 | ||
| Igala b | |||||
| Occupation | |||||
| Student * | 0.153149 | 1.254742 | 0.009 | ||
| Civil servant | −0.1677164 | 1.134713 | 0.882 | ||
| Business * | 1.349364 | 0.832663 | 0.001 | ||
| Blue collar | −1.948051 | 1.163646 | 0.094 | ||
| Farmer b | |||||
| Distance to water source | 30 min | −0.9191591 | 1.655886 | 0.579 | |
| Between 15 and 30 min * | 1.340592 | 1.52721 | 0.000 | ||
| 15 min * | 7.634129 | 1.540821 | 0.000 | ||
| Less than 15 min b | |||||
| cons | −5.767704 | 1.793481 | 0.001 | ||
| Tap/Handpump | |||||
| Age | years | ||||
| 26–33 | 0.243689 | 0.970339 | 0.802 | ||
| 34–41 | 1.112352 | 1.244772 | 0.372 | ||
| 42 years and above * | −2.820681 | 1.278305 | 0.027 | ||
| 18–25 b | |||||
| Level of education | |||||
| Secondary * | 3.495554 | 1.059181 | 0.001 | ||
| Technical * | 4.027456 | 1.226449 | 0.001 | ||
| Higher * | 6.987709 | 1.84979 | 0.000 | ||
| Primary b | |||||
| Religion | |||||
| Islam | −0.9805033 | 0.693886 | 0.158 | ||
| Christian b | |||||
| Tribe | |||||
| Ebira | 0.8261669 | 1.2807 | 0.519 | ||
| Okun/Yoruba * | −2.168269 | 0.918882 | 0.018 | ||
| Agatu | −0.8467842 | 1.192332 | 0.478 | ||
| Others | 1.25069 | 0.924189 | 0.176 | ||
| Igala b | |||||
| Occupation | |||||
| Student | −0.3053326 | 1.283788 | 0.812 | ||
| Civil servant | −0.2125548 | 1.177387 | 0.857 | ||
| Business | 1.465985 | 0.851483 | 0.085 | ||
| Blue collar | −2.347968 | 1.235203 | 0.057 | ||
| Farmer b | |||||
| Distance to water source | 30 min | 16.86397 | 6.144 | 0.997 | |
| Between 15 and 30 min * | 18.71043 | 1.3941 | 0.000 | ||
| 15 min * | 24.16621 | 1.6122 | 0.000 | ||
| Less than 15 min b | |||||
| cons | −23.46168 | 1.5647 | 0.997 | ||
| Well | |||||
| Age | years | ||||
| 26–33 | 0.4342989 | 0.973115 | 0.655 | ||
| 34–41 years | 1.076971 | 1.23618 | 0.384 | ||
| 42 years and above | −1.092513 | 1.147965 | 0.341 | ||
| 18–25 b | |||||
| Level of education | |||||
| Secondary * | 2.031327 | 0.9197395 | 0.027 | ||
| Technical | 1.866753 | 1.13681 | 0.101 | ||
| Higher * | 4.167881 | 1.812678 | 0.021 | ||
| Primary b | |||||
| Religion | |||||
| Islam | −0.825671 | 0.697828 | 0.237 | ||
| Christian b | |||||
| Tribe | |||||
| Ebira | 1.165925 | 1.271032 | 0.359 | ||
| Okun/Yoruba | −1.558749 | 0.93303 | 0.095 | ||
| Agatu * | 0.996792 | 1.066671 | 0.012 | ||
| Others * | 1.631538 | 0.958386 | 0.003 | ||
| Igala b | |||||
| Occupation | |||||
| Student | −0.1563987 | 1.29754 | 0.904 | ||
| Civil servant | −0.0798009 | 1.19928 | 0.947 | ||
| Business * | 1.458507 | 0.86799 | 0.002 | ||
| Blue collar | −1.657063 | 1.170383 | 0.157 | ||
| Farmer b | |||||
| Distance to water source | 30 min | 1.41148 | 1.62373 | 0.385 | |
| Between 15 and 30 min * | −15.9897 | 2.487343 | 0.000 | ||
| 15 min * | 6.41447 | 1.46820 | 0.000 | ||
| Less than 15 min b | |||||
| cons | −4.85758 | 1.68724 | 0.004 | ||
| Reservoir | |||||
| Age | years | ||||
| 26–33 | 0.2505239 | 1.151682 | 0.828 | ||
| 34–41 years | 0.0348633 | 1.46232 | 0.981 | ||
| 42 years and above | −1.6978 | 1.340359 | 0.205 | ||
| 18–25 b | |||||
| Level of education | |||||
| Secondary | −0.229556 | 1.121572 | 0.838 | ||
| Technical | −14.82726 | 769.544 | 0.992 | ||
| Higher | 3.452957 | 1.914172 | 0.071 | ||
| Primary b | |||||
| Religion | |||||
| Islam | −0.0342996 | 0.8466606 | 0.968 | ||
| Christian b | |||||
| Tribe | |||||
| Ebira | −14.31414 | 767.0132 | 0.663 | ||
| Okun/Yoruba | −1.999022 | 1.409539 | 0.156 | ||
| Agatu * | 1.536424 | 1.331755 | 0.050 | ||
| Others * | 2.075243 | 1.065262 | 0.051 | ||
| Igala b | |||||
| Occupation | |||||
| Student | 0.729698 | 1.676664 | 0.663 | ||
| Civil servant * | 2.494875 | 1.426156 | 0.008 | ||
| Business * | 1.979099 | 1.088879 | 0.031 | ||
| Blue collar | −16.96119 | 793.0258 | 0.991 | ||
| Farmer b | |||||
| Distance to water source | 30 min | 0.120472 | 0.10284 | 0.998 | |
| Between 15 and 30 min | −17.59264 | 0.34839 | 0.997 | ||
| 15 min * | 0.228780 | 0.93420 | 0.000 | ||
| Less than 15 min b | |||||
| cons | −22.36752 | 0.9342 | 0.997 |
N= 404, * = significant at 0.05 level. Pseudo R-Square (McFadden = 0.1684). Model Fitting (Prob > Chi2 ≤ 0.001). Likelihood ratio Chi2 = 202.26. b = Redundant.
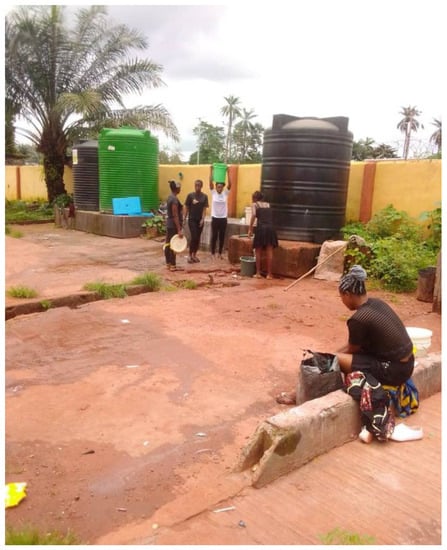
Figure A1.
Community members collecting water with bucket.
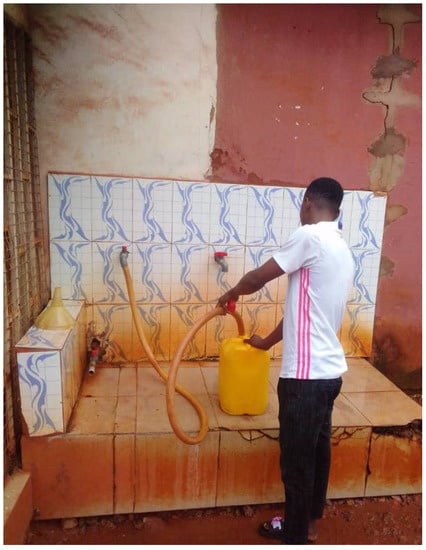
Figure A2.
Community member collecting water with gallon.
References
- Brookshire, D.; Whittington, D. Water Resources Issues in the Developing Countries. Water Resour. Res. 1993, 29, 1883–1888. [Google Scholar] [CrossRef]
- Grönwall, J.; Danert, K. Regarding Groundwater and Drinking Water Access through a Human Rights Lens: Self-Supply as a Norm. Water 2020, 12, 419. [Google Scholar] [CrossRef] [Green Version]
- USAID Nigeria. Water. Available online: https://www.usaid.gov/nigeria/water (accessed on 9 September 2020).
- Onyenekenwa, C.E. Improving the access to potable water in Nigeria. Afr. J. Sci. 2007, 8, 1962–1971. [Google Scholar]
- Ishaku, H.T.; Majid, M.R.; Ajayi, A.A.; Haruna, A. Water Supply Dilemma in Nigerian Rural Communities: Looking Towards the Sky for an Answer. J. Water Resour. Prot. 2011, 3, 598–606. [Google Scholar] [CrossRef] [Green Version]
- Aiga, H.; Umenai, T. Standardisation of the definition of access to safe water. Lancet 2003, 361, 2156. [Google Scholar] [CrossRef]
- Kulinkina, A.V.; Kosinski, K.C.; Plummer, J.D.; Durant, J.L.; Bosompem, K.M.; Adjei, M.N.; Griffiths, J.K.; Gute, D.M.; Naumova, E.N. Indicators of improved water access in the context of schistosomiasis transmission in rural Eastern Region, Ghana. Sci. Total Environ. 2017, 579, 1745–1755. [Google Scholar] [CrossRef] [PubMed] [Green Version]
- World Bank. World Bank World Development Report 1997; Oxford University Press: New York, NY, USA, 1997. [Google Scholar]
- World Bank. Access to Water. Available online: https://datacatalog.worldbank.org/access-water (accessed on 11 June 2020).
- World Health Organization (WHO). Meeting the MDG Drinking Water and Sanitation Target: The Urban and Rural Challenge of the Decade; WHO: Geneva, Switzerland, 2006. [Google Scholar]
- United Nations-Water (UN-Water). UNDP Photo Story from Dry Season in Benin. Available online: https://www.unwater.org/undp-photo-story-dry-season-benin/ (accessed on 9 September 2020).
- Geere, J.-A.L.; Mudau, S.L.; Mokoena, M. Public health and social benefits of at-house water supplies. In Proceedings of the Stakeholder Feedback and Workshop, Brussels, Belgium, 27 September 2016. [Google Scholar]
- Ritchie, H.; Roser, M. Clean Water. Available online: https://ourworldindata.org/water-access (accessed on 30 August 2021).
- Global Water Partnership. Water, Sanitation and Hygiene Finance (WASH—FIN). Available online: https://www.globalwaters.org/wash-fin (accessed on 9 September 2020).
- Yusuf, M.A.; Abiye, T.A. Risks of groundwater pollution in the coastal areas of Lagos, southwestern Nigeria. Groundw. Sustain. Dev. 2019, 9, 100222. [Google Scholar] [CrossRef]
- The Federal Republic of Nigeria. National Water Policy; The Federal Republic of Nigeria: Abuja, Nigeria, 2004.
- The Federal Republic of Nigeria. National Water Resource Policy; The Federal Republic of Nigeria: Abuja, Nigeria, 2016.
- Price, H.; Adams, E.; Quilliam, R.S. The difference a day can make: The temporal dynamics of drinking water access and quality in urban slums. Sci. Total Environ. 2019, 671, 818–826. [Google Scholar] [CrossRef]
- Scanlon, T.; Uguru, O.P.; Jafry, T.; Chinsinga, B.; Mvula, P.; Chunga, J.; Zimba, L.M.; Mwape, M.; Nyundo, L.; Mwiinga, B.; et al. The role of social actors in water access in Sub-Saharan Africa: Evidence from Malawi and Zambia. Water Resour. Rural Dev. 2016, 8, 25–36. [Google Scholar] [CrossRef] [Green Version]
- Nkuna, Z.; Ngorima, E. Challenges for water service delivery and its impacts on South’s Africa rural community: The case of Thambonkulu: The small rural community in South Africa. In Proceedings of the East Africa Young Water Professionals, Kampala, Uganda, 7–10 December 2011. [Google Scholar]
- Herslund, L.; Mguni, P. Examining urban water management practices—Challenges and possibilities for transitions to sustainable urban water management in Sub-Saharan cities. Sustain. Cities Soc. 2019, 48, 101573. [Google Scholar] [CrossRef]
- World Health Organization (WHO); The United Nations Children’s Fund (UNICEF). Progress on Drinking Water, Sanitation and Hygiene: 2017 Update and SDG Baselines; WHO: Geneva, Switzerland, 2017. [Google Scholar]
- United Nations Environment Programme (UNEP). A Snapshot of the World’s Water Quality: Towards a Global Assessment; UNEP: Nairobi, Kenya, 2016. [Google Scholar]
- Dos Santos, S.; Adams, E.A.; Neville, G.; Wada, Y.; de Sherbinin, A.; Mullin Bernhardt, E.; Adamo, S.B. Urban growth and water access in sub-Saharan Africa: Progress, challenges, and emerging research directions. Sci. Total Environ. 2017, 607–608, 497–508. [Google Scholar] [CrossRef] [PubMed]
- Fulazzaky, M. Challenges of Integrated Water Resources Management in Indonesia. Water 2014, 6, 2000–2020. [Google Scholar] [CrossRef] [Green Version]
- Geissen, V.; Mol, H.; Klumpp, E.; Umlauf, G.; Nadal, M.; van der Ploeg, M.; van de Zee, S.E.A.T.M.; Ritsema, C.J. Emerging pollutants in the environment: A challenge for water resource management. Int. Soil Water Conserv. Res. 2015, 3, 57–65. [Google Scholar] [CrossRef]
- Maurice, L.; López, F.; Becerra, S.; Jamhoury, H.; Le Menach, K.; Dévier, M.-H.; Budzinski, H.; Prunier, J.; Juteau-Martineau, G.; Ochoa-Herrera, V.; et al. Drinking water quality in areas impacted by oil activities in Ecuador: Associated health risks and social perception of human exposure. Sci. Total Environ. 2019, 690, 1203–1217. [Google Scholar] [CrossRef]
- Behera, B.; Rahut, D.B.; Sethi, N. Analysis of household access to drinking water, sanitation, and waste disposal services in urban areas of Nepal. Util. Policy 2020, 62, 100996. [Google Scholar] [CrossRef]
- Hubbard, R.K.; Newton, J.L.; Hill, G.M. Water quality and the grazing animal. J. Anim. Sci. 2004, 82, 255–263. [Google Scholar] [CrossRef]
- Lester, S.; Rhiney, K. Going beyond basic access to improved water source: Towards deriving a water accessibility index. Habitat Int. 2018, 73, 129–140. [Google Scholar] [CrossRef]
- Aliyu, Y.A.; Botai, J.O. An Exposure Appraisal of Outdoor Air Pollution on the Respiratory Well-being of a Developing City Population. J. Epidemiol. Glob. Health 2018, 8, 91. [Google Scholar] [CrossRef] [Green Version]
- Odiyo, J.O.; Makungo, R. Water quality problems and management in rural areas of Limpopo Province, South Africa. Water Pollut. 2012, 164, 135–146. [Google Scholar] [CrossRef] [Green Version]
- Alfaro, A.C. Effects of mangrove removal on benthic communities and sediment characteristics at Mangawhai Harbour, northern New Zealand. ICES J. Mar. Sci. 2010, 67, 1087–1104. [Google Scholar] [CrossRef] [Green Version]
- Galadima, A.; Garba, Z.N.; Leke, L.; Almustapha, M.N.; Adam, I.K. Domestic Water Pollution among Local Communities in Nigeria—Causes and Consequences. Eur. J. Sci. Res. 2011, 52, 592–603. [Google Scholar]
- World Health Organisation (WHO); United Nations Children Education Fund (UNICEF). Progress on Sanitation and Drinking Water: 2013 Update; UNICEF: New York, NY, USA, 2013. [Google Scholar]
- Li, Y.; Westlund, H.; Liu, Y. Why some rural areas decline while some others not: An overview of rural evolution in the world. J. Rural Stud. 2019, 68, 135–143. [Google Scholar] [CrossRef]
- Wasonga, J.; Okowa, M.; Kioli, F. Sociocultural Determinants to Adoption of Safe Water, Sanitation, and Hygiene Practices in Nyakach, Kisumu County, Kenya: A Descriptive Qualitative Study. J. Anthropol. 2016, 2016, 7434328. [Google Scholar] [CrossRef] [Green Version]
- Eichelberger, L. Household Water Insecurity and its Cultural Dimensions: Preliminary Results from Newtok, Alaska. Environ. Sci. Pollut. Res. Int. 2017, 25, 32938–32951. [Google Scholar] [CrossRef] [PubMed]
- Smith, A.; Ali, M. Understanding the impact of cultural and religious water use. Water Environ. J. 2006, 20, 203–209. [Google Scholar] [CrossRef]
- Gruber, N. Warming up, turning sour, losing breath: Ocean biogeochemistry under global change. Philos. Trans. R. Soc. A Math. Phys. Eng. Sci. 2011, 369, 1980–1996. [Google Scholar] [CrossRef] [Green Version]
- Crow, B.; Sultana, F. Gender, Class, and Access to Water: Three Cases in a Poor and Crowded Delta. Soc. Nat. Resour. 2002, 15, 709–724. [Google Scholar] [CrossRef]
- Oladokun, Y.O.M.; Adenegan, K.O.; Salman, K.K.; Alawode, O.O. Level of asset ownership by women in rural North-East and South-East Nigeria. Women’s Stud. Int. Forum 2018, 70, 68–78. [Google Scholar] [CrossRef]
- Opeyemi, O.A.; Bayode, O.J. Impact of Gender Involvement in Sustainable Water Development Projects in Ibadan, Nigeria. Int. J. World Policy Dev. Stud. 2018, 7, 2415–5241. [Google Scholar]
- Cheung, G.C.K.; Chang, C.Y. Cultural identities of Chinese business: Networks of the shark-fin business in Hong Kong. Asia Pacific Bus. Rev. 2011, 17, 343–359. [Google Scholar] [CrossRef] [Green Version]
- Arends-Tóth, J.; van de Vijver, F.J.R. Cultural and Gender Differences in Gender-Role Beliefs, Sharing Household Task and Child-Care Responsibilities, and Well-Being Among Immigrants and Majority Members in The Netherlands. Sex Roles 2008, 58, 896. [Google Scholar] [CrossRef] [Green Version]
- Hrivíková, T. Gender Equality and Cultures—Are We There Yet? In Proceedings of the Kautz Gyula Emlékkonferencia, Győr, Hungary, 15 June 2016. [Google Scholar]
- Leisher, C.; Temsah, G.; Booker, F.; Day, M.; Samberg, L.; Prosnitz, D.; Agarwal, B.; Matthews, E.; Roe, D.; Russell, D.; et al. Does the gender composition of forest and fishery management groups affect resource governance and conservation outcomes? A systematic map. Environ. Evid. 2016, 5, 6. [Google Scholar] [CrossRef] [Green Version]
- Kinias, Z.; Kim, H.S. Culture and gender inequality. Gr. Process. Intergr. Relat. 2012, 15, 89–103. [Google Scholar] [CrossRef]
- World Health Organisation (WHO). Water and Climate Change. Available online: https://www.who.int/news/item/17-03-2020-water-and-climate-change (accessed on 11 June 2021).
- Gi Lee, S.; Adelodun, B.; Choi, K.S.; Won Do, J.; Ya Lee, G. Farm-level participation of a novel water saving education model to improve water use efficiency and irriagtion sustainability. In Proceedings of the 3rd World Irrigation Forum (WIF3), Bali, Indonesia, 1–7 September 2019. [Google Scholar]
- Choi, I.-C.; Shin, H.-J.; Nguyen, T.; Tenhunen, J. Water Policy Reforms in South Korea: A Historical Review and Ongoing Challenges for Sustainable Water Governance and Management. Water 2017, 9, 717. [Google Scholar] [CrossRef] [Green Version]
- Matthews-njoku, E.C.; Nwaogwugwu, O.N. Cultural factors affecting livelihood strategies of rural households in southeast Nigeria: Implication for agricultural transformation agenda. Russ. J. Agric. Socio-Econ. Sci. 2014, 36, 18–26. [Google Scholar]
- Antunes, M.; Martins, R. Determinants of access to improved water source: Meeting the MDGs. Util. Policy 2020, 63, 101019. [Google Scholar] [CrossRef]
- Akoteyon, I.S. Inequalities in Access to Water and Sanitation in Rural Settlements in Parts of Southwest Nigeria. Ghana J. Geogr. 2019, 11, 158–184. [Google Scholar]
- Abubakar, I.R. Factors influencing household access to drinking water in Nigeria. Util. Policy 2019, 58, 40–51. [Google Scholar] [CrossRef]
- Emenike, C.; Tenebe, I.; Omole, D.; Ngene, B.; Oniemayin, B.; Maxwell, O.; Onoka, B.I. Accessing safe drinking water in sub-Saharan Africa: Issues and challenges in South–West Nigeria. Sustain. Cities Soc. 2017, 30, 263–272. [Google Scholar] [CrossRef]
- Madiba, S.; Ngwenya, N. Cultural practices, gender inequality and inconsistent condom use increase vulnerability to HIV infection: Narratives from married and cohabiting women in rural communities in Mpumalanga province, South Africa. Glob. Health Action 2017, 10, 1341597. [Google Scholar] [CrossRef] [PubMed] [Green Version]
- Kabiru, M.; Shuaibu, E.; Halimat, N.; Sulaiman, M. Occurrence of coliform bacterium in boreholes water. Bima J. Sci. Technol. 2020, 3, 147–152. [Google Scholar]
- Babatimehin, O.I.; Eludoyin, A.O.; Ekundayo, O.O.; Ekwere, N.J. Water quality and perception on use in Obafemi Awolowo University, Ile-Ife, Nigeria. Interdiscip. Environ. Rev. 2020, 20, 100. [Google Scholar] [CrossRef]
- Atedhor, G. Agricultural Vulnerability to Climate Change in Sokoto State, Nigeria. Afr. J. Food Agric. Nutr. Dev. 2015, 15, 9856–9871. [Google Scholar]
- Kogi State Government of Nigeria. Approved Budget Estimates; The Government of Nigeria: Abuja, Nigeria, 2020.
- Kwangware, J.; Mayo, A.; Hoko, Z. Sustainability of donor-funded rural water supply and sanitation projects in Mbire district, Zimbabwe. Phys. Chem. Earth Parts A/B/C 2014, 76–78, 134–139. [Google Scholar] [CrossRef]
- Mahama, A.M.; Anaman, K.A.; Osei-Akoto, I. Factors influencing householders’ access to improved water in low-income urban areas of Accra, Ghana. J. Water Health 2014, 12, 318–331. [Google Scholar] [CrossRef] [PubMed] [Green Version]
- Tuyet-Hanh, T.T.; Lee, J.-K.; Oh, J.; Van Minh, H.; Ou Lee, C.; Hoan, L.T.; Nam, Y.-S.; Long, T.K. Household trends in access to improved water source and sanitation facilities in Vietnam and associated factors: Findings from the Multiple Indicator Cluster Surveys, 2000–2011. Glob. Health Action 2016, 9, 29434. [Google Scholar] [CrossRef] [PubMed] [Green Version]
- Rodríguez, G. Lecture Notes on Generalized Linear Models. 2007. Available online: https://data.princeton.edu/wws509/notes/ (accessed on 9 September 2021).
- Simelane, M.S.; Shongwe, M.C.; Vermaak, K.; Zwane, E. Determinants of Households’ Access to Improved Drinking water source: A Secondary Analysis of Eswatini 2010 and 2014 Multiple Indicator Cluster Surveys. Adv. Public Health 2020, 2020, 6758513. [Google Scholar] [CrossRef] [Green Version]
- Price, H.D.; Adams, E.A.; Nkwanda, P.D.; Mkandawire, T.W.; Quilliam, R.S. Daily changes in household water access and quality in urban slums undermine global safe water monitoring programmes. Int. J. Hyg. Environ. Health 2021, 231, 113632. [Google Scholar] [CrossRef]
- Gondo, R.; Kolawole, O.D.; Mbaiwa, J.E.; Motsholapheko, M.R. Demographic and socio-economic factors influencing water governance in the Okavango Delta, Botswana. Sci. Afr. 2020, 10, e00602. [Google Scholar] [CrossRef]
- Irianti, S.; Prasetyoputra, P.; Sasimartoyo, T.P. Determinants of household drinking-water source in Indonesia: An analysis of the 2007 Indonesian family life survey. Cogent Med. 2016, 3, 1151143. [Google Scholar] [CrossRef]
- Mulenga, J.N.; Bwalya, B.B.; Kaliba-Chishimba, K. Determinants and inequalities in access to improved water source and sanitation among the Zambian households. Int. J. Dev. Sustain. 2017, 6, 746–762. [Google Scholar]
- Gomez, M.; Perdiguero, J.; Sanz, A. Socioeconmic Factors Affecting Water Access in Rural Areas of Low and Middle Income Countries. Water 2019, 11, 202. [Google Scholar] [CrossRef] [Green Version]
- Deal, P.; Sebatini, D. Evaluating the Level of the Household Water Service Provided by a Private Water Enterprise in Ghana. Water 2020, 12, 693. [Google Scholar] [CrossRef] [Green Version]
Publisher’s Note: MDPI stays neutral with regard to jurisdictional claims in published maps and institutional affiliations. |
© 2021 by the authors. Licensee MDPI, Basel, Switzerland. This article is an open access article distributed under the terms and conditions of the Creative Commons Attribution (CC BY) license (https://creativecommons.org/licenses/by/4.0/).