Article

Synchronous Cycle of Available Phosphorus, Iron, and Sulfur in the Sediment of Lancang River Reservoirs

1
School of Water Conservancy and Hydroelectric Power, Hebei University of Engineering, Handan 056038, China
2
State Key Laboratory of Simulation and Regulation of Water Cycle in River Basin, China Institute of Water Resources and Hydropower Research, Beijing 100038, China
3
Hebei Key Laboratory of Intelligent Water Conservancy, Hebei University of Engineering, Handan 056038, China
4
State Key Laboratory Base of Eco-Hydraulic Engineering in Arid Area, Xi’an University of Technology, Xi’an 710048, China
5
Department of Water Ecology and Environment, China Institute of Water Resources and Hydropower Research, Beijing 100038, China
*
Authors to whom correspondence should be addressed.
Water 2021, 13(19), 2691; https://doi.org/10.3390/w13192691
Submission received: 18 July 2021 / Revised: 15 September 2021 / Accepted: 26 September 2021 / Published: 28 September 2021
(This article belongs to the Section Water Quality and Contamination)

Abstract

:
Large-scale deep reservoirs associated with hydropower cascade development are known to influence the cycle of phosphorus (P). However, there is scarce information on the fractions and availability of P in sediments of large-scale deep reservoirs constructed due to hydropower cascade development. In this study, we researched the fractions and release mechanism of P in the sediments of large-scale deep reservoirs by analyzing the fractions and availability of P in the sediments of the Xiaowan (XW) and Nuozhadu (NZD) reservoirs in the middle and lower reaches of the Lancang River (China). According to the results, there is a significant difference in the P fractions in the sediments of the XW and NZD reservoirs, but not for the available P in the sediments. Compared to the NZD reservoir, there was less solid bioavailable phosphorus (BAP) in the sediments of the XW reservoir, but the replenishment degree of active solid phase P into pore water was higher in the XW. There was a significant positive correlation between the available P and the BAP; the Fe/P ratio measured by the diffusive gradients in thin films reflects the control of active iron (oxyhydr) oxides over labile P in the sediments. In addition to the reductive dissolution of iron-bound P, the release of P into the large deep reservoirs may be related to factors such as the sulfate reduction and the degradation of organic materials. The P cycling in deep reservoir sediments is mainly controlled by the Fe, and there is a clear spatial distribution of this mechanism in deep reservoirs.

1. Introduction

Phosphorus (P) is an essential constituent element of the protoplasm of biological cells [1] and is also key for the metabolism of materials [2]. Therefore, it is considered an important factor that limits productivity in water ecosystems. The supply ratio of P to water has been changing due to increasing human activities, which can directly cause water eutrophication in rivers, lakes, and marshes, as well as the mass propagation of algae [3,4]. For a long time, the efforts towards reducing water eutrophication have focused on controlling the external input of P into the water without considering the internal release of P into water sediments [5,6,7]. A previous study showed that because the migration and transformation of P may occur in water environments, reducing external P inputs may even enhance the internal loading [8]. During these migration and transformation processes, the sediments play an important role as a source or sink.
P is transferred from water to sediment by the adsorption and sedimentation of suspended particles. Meanwhile, accumulative P in sediments is released into water under certain long-term conditions [9,10,11,12,13,14]. The total P (TP) content is not an accurate indication of the risk of P release in sediments since not all fractions of P can be released into the overlying water [15]. Bioavailable phosphorus (BAP) is P that is readily released from sediment and consumed by algae and phytoplankton [16]. Active solid phase P is the part of solid BAP that is re-supplied to the pore water. The available (or labile) P is defined as the easily changeable or mobile P fraction, which includes active solid phase P and pore water P. Accordingly, the diffusive process of P in pore water and the dynamic replenishment from the solid phase should be considered for an accurate evaluation of the available P in sediments. In this regard, traditional chemical extraction methods are not suitable because continuous extraction was developed according to the response of the P fractions to a chemical reagent and does not reflect the availability of P in sediments [17].
The release of P in sediments occurs at the sediment–water interface (SWI), while P in sediments is transferred into overlying water through pore water. Consequently, the accurate and effective sampling of interference-free pore water is key for studying the SWI. Dr. Davison and Dr. Zhang Hao developed a revolutionary technology, called diffusive gradients in thin films (DGT) technology [18,19]. The measured concentration by DGT (CDGT) can be regarded as the available (or labile) fraction [20]. As in situ passive sampling technology, DGT technology avoids complicated operation procedures and large errors during active sampling and achieves higher resolutions and shorter balance times compared to other methods, such as Peeper [21] and DET [22]. For this reason, DGT technology is now widely used for studying the release of P in the sediments of lakes and rivers. In terms of physical, chemical, and biological aspects, large-scale reservoirs formed by dam construction differ from natural rivers and lakes [23]. Numerous studies have shown that large-scale reservoirs have higher retention efficiency for phosphorus; deep water causes higher P loading, stronger P reactivity, faster P release rates, and higher pollution potential [24,25]. However, in large-scale deep reservoirs resulting from hydropower cascade development, a more complicated accumulative effect may exist for P in sediments due to the relationship between sediment and river discontinuity [26,27,28,29].
On the Lancang River, the Chinese section of the Mekong River, construction is planned for 14 cascade hydropower stations. Besides the inherent benefit of taking full advantage of water resources, cascade hydropower stations have attracted wide attention due to the resulting hydrological accumulative effect and the emissions of sediments and nutrients. In the Mekong River, over 90% of suspended sediments have been estimated to be retained in the upstream dam, leading to the accumulation of nutrients, which affects the downstream river [30]. The research on this topic has mainly been focused on the change in the run-off cycle of the Mekong River and sediment transportation due to hydropower cascade development [31,32,33,34,35]. Previous studies have shown that the biogenic substance cycle mechanisms of upstream and downstream reservoirs are significantly different under the influence of a cascade reservoir [36]; however, studies on the fractions and availability of P in sediments of large-scale deep reservoirs due to hydropower cascade development are scarce.
The aims of this study were to: (1) investigate the spatial difference of P fractions in sediments between two large-scale deep reservoirs; (2) evaluate the concentration of available P in sediments and the reactivity of the sediments during the replenishment of available P in a dissolved state; (3) reveal the release mechanism of internal P in the sediments of large-scale deep reservoirs.

2. Materials and Methods
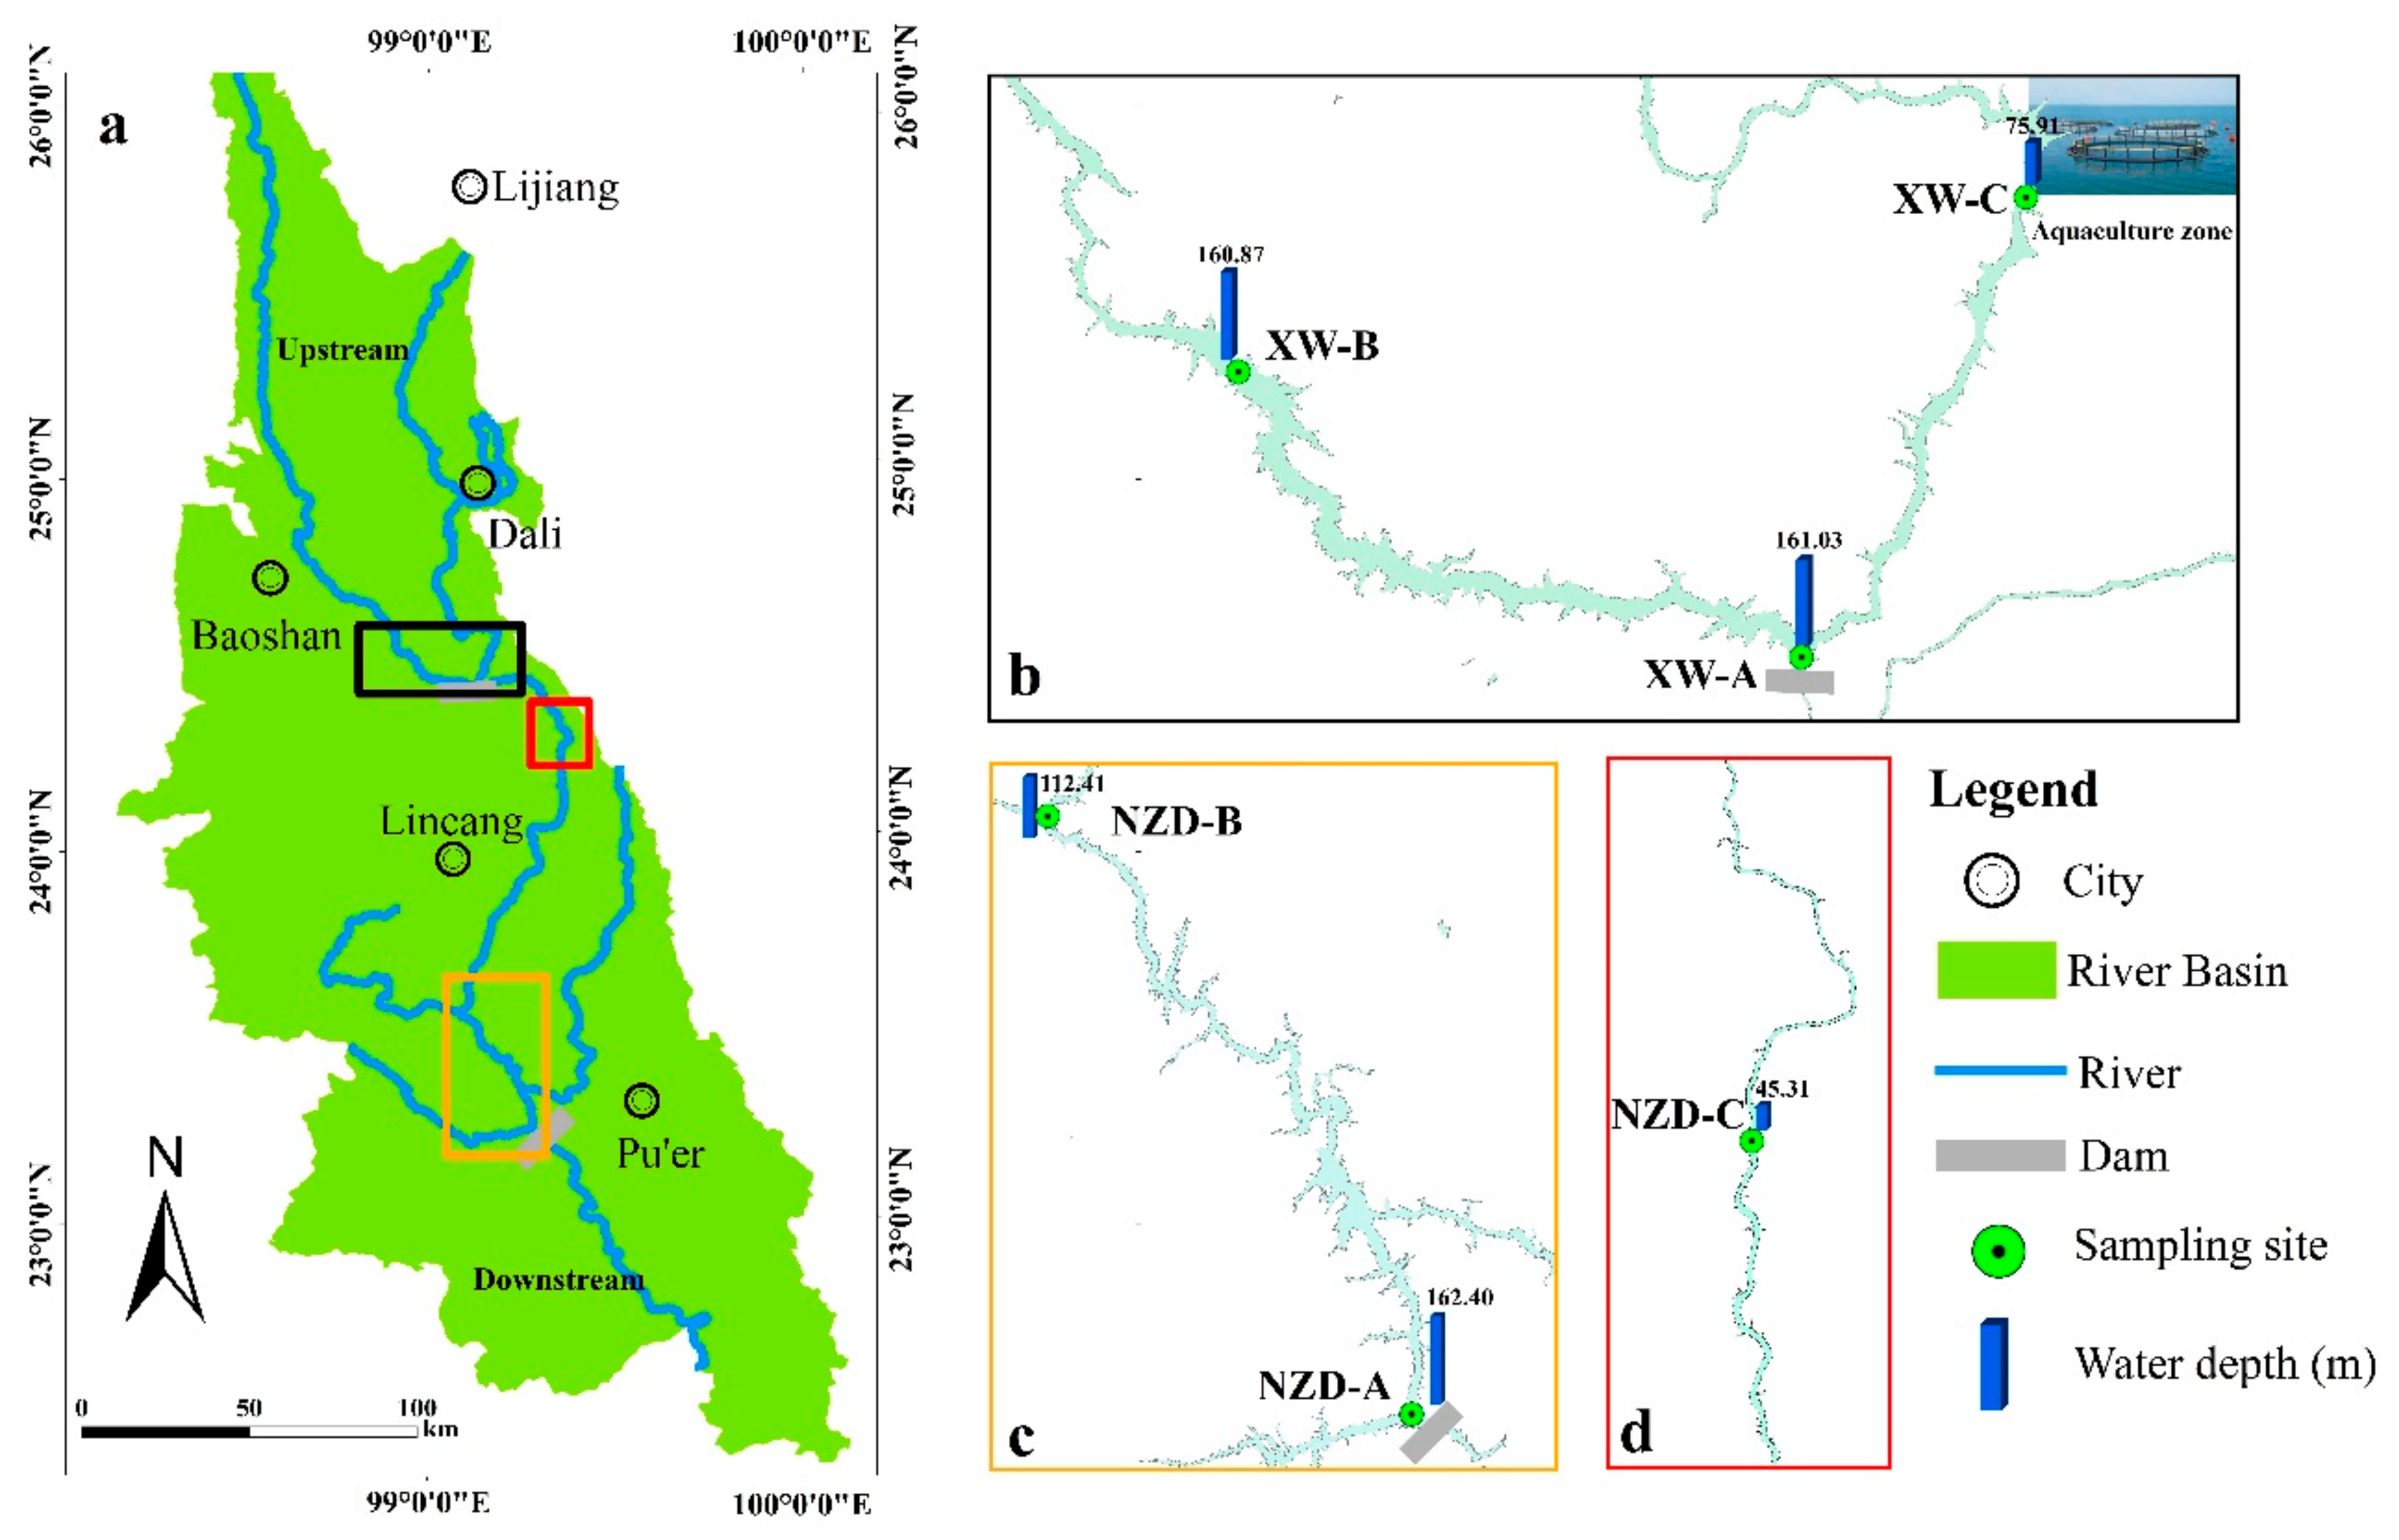
2.1. Survey Area

With a length of over 800 km, the middle and lower reaches of the Lancang River (from Gongguo Bridge to Nan’e Estuary) (Figure 1) in Yunnan Province (China) are critical locations for hydropower development due to convenient transportation, as well as the topography and geological conditions. In this area, 8 cascade hydropower stations are planned to be constructed, with a total storage capacity of 40 billion m3, an effective storage capacity of 23 billion m3, and a gross installed capacity of 15.2 million kW, corresponding to over 60% of the installed gross capacity. Among the planned two reservoirs and eight cascades, XW and NZD play an important role in the cascade hydropower development as the two main regulating reservoirs. As typical deep large-scale reservoirs, the XW and NZD reservoirs have long-term regulating capacities, total storage capacities of 14.56 and 22.4 billion m3, respectively, and water depths over 200 m.

2.2. Sample Collection

In December 2019, the sediments of the XW and NZD reservoirs were sampled at three sites each, as shown in Figure 1b–d. The sampling sites XW-A and XW-B were located in front of the dam and in the mainstream, respectively. XW-C was located in the aquaculture zone of the tributary. The sampling sites NZD-A, NZD-B, and NZD-C were located along the river line reaching the front of the dam of the NZD reservoir. The vertical profiles of the physicochemical characteristics of the sampling sites are shown in Figure A1.
The sediment cores were collected with a gravity sampler made of organic glass with a length of 100 cm and an inner diameter of 6 cm. They were then put into a DGT device (Easy Sensor Ltd., Nanjing, China) on-site to ensure the simultaneous diffusion of overlying water and sedimentary ions into the exposure windows (Figure 2). The interfacial position was marked, and the samples were then sealed with a rubber plug. The sampling device was wrapped with aluminum foil and kept for 24 h in a static state.
After disassembling the DGT device, the binding gel inside the DGT device was taken out and then separated into small samples of 5 mm using a ceramic knife. Each separate sample was placed into a polyethene tube, to which 1-mol/L NaOH solution and 1-mol/L HNO3 solution were added successively to elute P and Fe. Deionized water was used for cleaning between the above two steps, and inductively coupled plasma mass spectrometry (ICP-MS) was used to measure the P and Fe concentration in the eluant. The concentration of S in the binding gel was determined with a computer-imaging densitometry technique [37].
The sediment core depths from XW-A, XW-B, and XW-C were 8, 11, and 10 cm, respectively; the sediment core depths from the NZD reservoir were uniformly 11 cm. After taking out the DGT device, all sediment cores were separated with intervals of 1 cm on site, and then sealed in polyethene zip bags, kept in an insulation box at 4 °C, and delivered to the lab. Before analysis, all 62 sediment samples were frozen, dried, ground with an agate mortar, and then filtered through a 100-mesh nylon sieve. In addition, the temperature (Temp), dissolved oxygen (DO), pH value, and other parameters of the overlying water were measured with a YSI EXO2 multisensor sonde (Yellow Springs Instruments Inc., Yellow Springs, OH, USA).

2.3. P Fractions Analysis

The sample was calcined in a muffle furnace at 450 °C for 3 h, and 3.5 mol/L HCl solution was added to measure the TP [38]. To determine the fractions of sediment P, a modified chemical sequential extraction method [29,39] was applied as follows: (1) a NH4Cl solution was added to measure the loosely bound P (EX-P); (2) a Na2S2O4/NaHCO3 mixed solution was added to the residue to measure the reductant soluble P (BD-P); (3) a NaOH solution was added to the residue to measure the metal oxide-bound P (NaOH-P); (4) a HCl solution was added to the residue to determine the calcium-bound P (HCl-P) (Table 1). Phosphate in the above extraction solution was determined by the molybdenum blue/ascorbic acid method [40], and the residue was cleaned with a saturated NaCl solution. The difference between the TP and the P fractions extracted above was residual P (Res-P). In addition, the summation of EX-P, BD-P, and NaOH-P was used to estimate the content of BAP [29,41]. HCl-P and Res-P are stable and inert forms of P and can be regarded as inert P.

2.4. Calculations

The results from the ICP-MS measurements were used to calculate the concentration accumulated by the DGT binding gel. The CDGT can be expressed as follows:
C D G T = M × Δ g D × A × t M = C e V g e l + V e f e
where Ce is the concentration of the eluant, Vgel is the volume of the gel disc, Ve is the volume of the eluant, fe is the coefficient of elution, M (μg) is the accumulated element mass on the binding gel, Δg (cm) is the thickness of the diffusive layer, A (cm2) is the area of exposure window of the gel, D (cm2/s) is the coefficient of diffusive, and t (h) is the deployment time [20].
The vertical change of the CGDT in the vicinity of the SWI can be used to estimate the apparent diffusive flux across the SWI [42,43]. The apparent diffusive flux (F) of P across the SWI can be expressed as follows:
F = F W + F S = D W C D G T x w x = 0 φ D S C D G T x S x = 0
where FW and FS represent the fluxes in the overlying water and the sediment, respectively, F is the apparent flux across the SWI, and ( C D G T x w )(x=0) and ( C D G T x s )(x=0) represent the concentration gradient in the sediment and the overlying water, respectively. To accurately calculate the flux, layers 5 mm above and below the SWI were considered to calculate the concentration gradient, x w represents 5 mm from the sediment to the overlying water, x w represents 5 mm from the overlying water to the sediment. The porosity at the top 5 mm layer of sediment (φ) was 0.9 [44,45]. DW and DS represent the diffusive coefficients of phosphate in the overlying water and the sediment, respectively. DW is related to temperature, and DW and DS are correlated according to the following expression: DS = DW/ (if φ > 0.7, F = 1/φ3; if φ < 0.7, F = 1/φ2) [46,47].

2.5. Statistical Tests

A one-way ANOVA test was used to identify significant differences among different P fractions in the sediments at a 0.05 significance level. The correlation analysis was carried out by the Pearson correlation to provide a quantitative explanation of the relationship between P fractions and available P, Fe, S at significance levels of 0.01 and 0.05. Both the one-way ANOVA test and the correlation analysis were performed in SPSS 17.0.

3. Results and Discussion

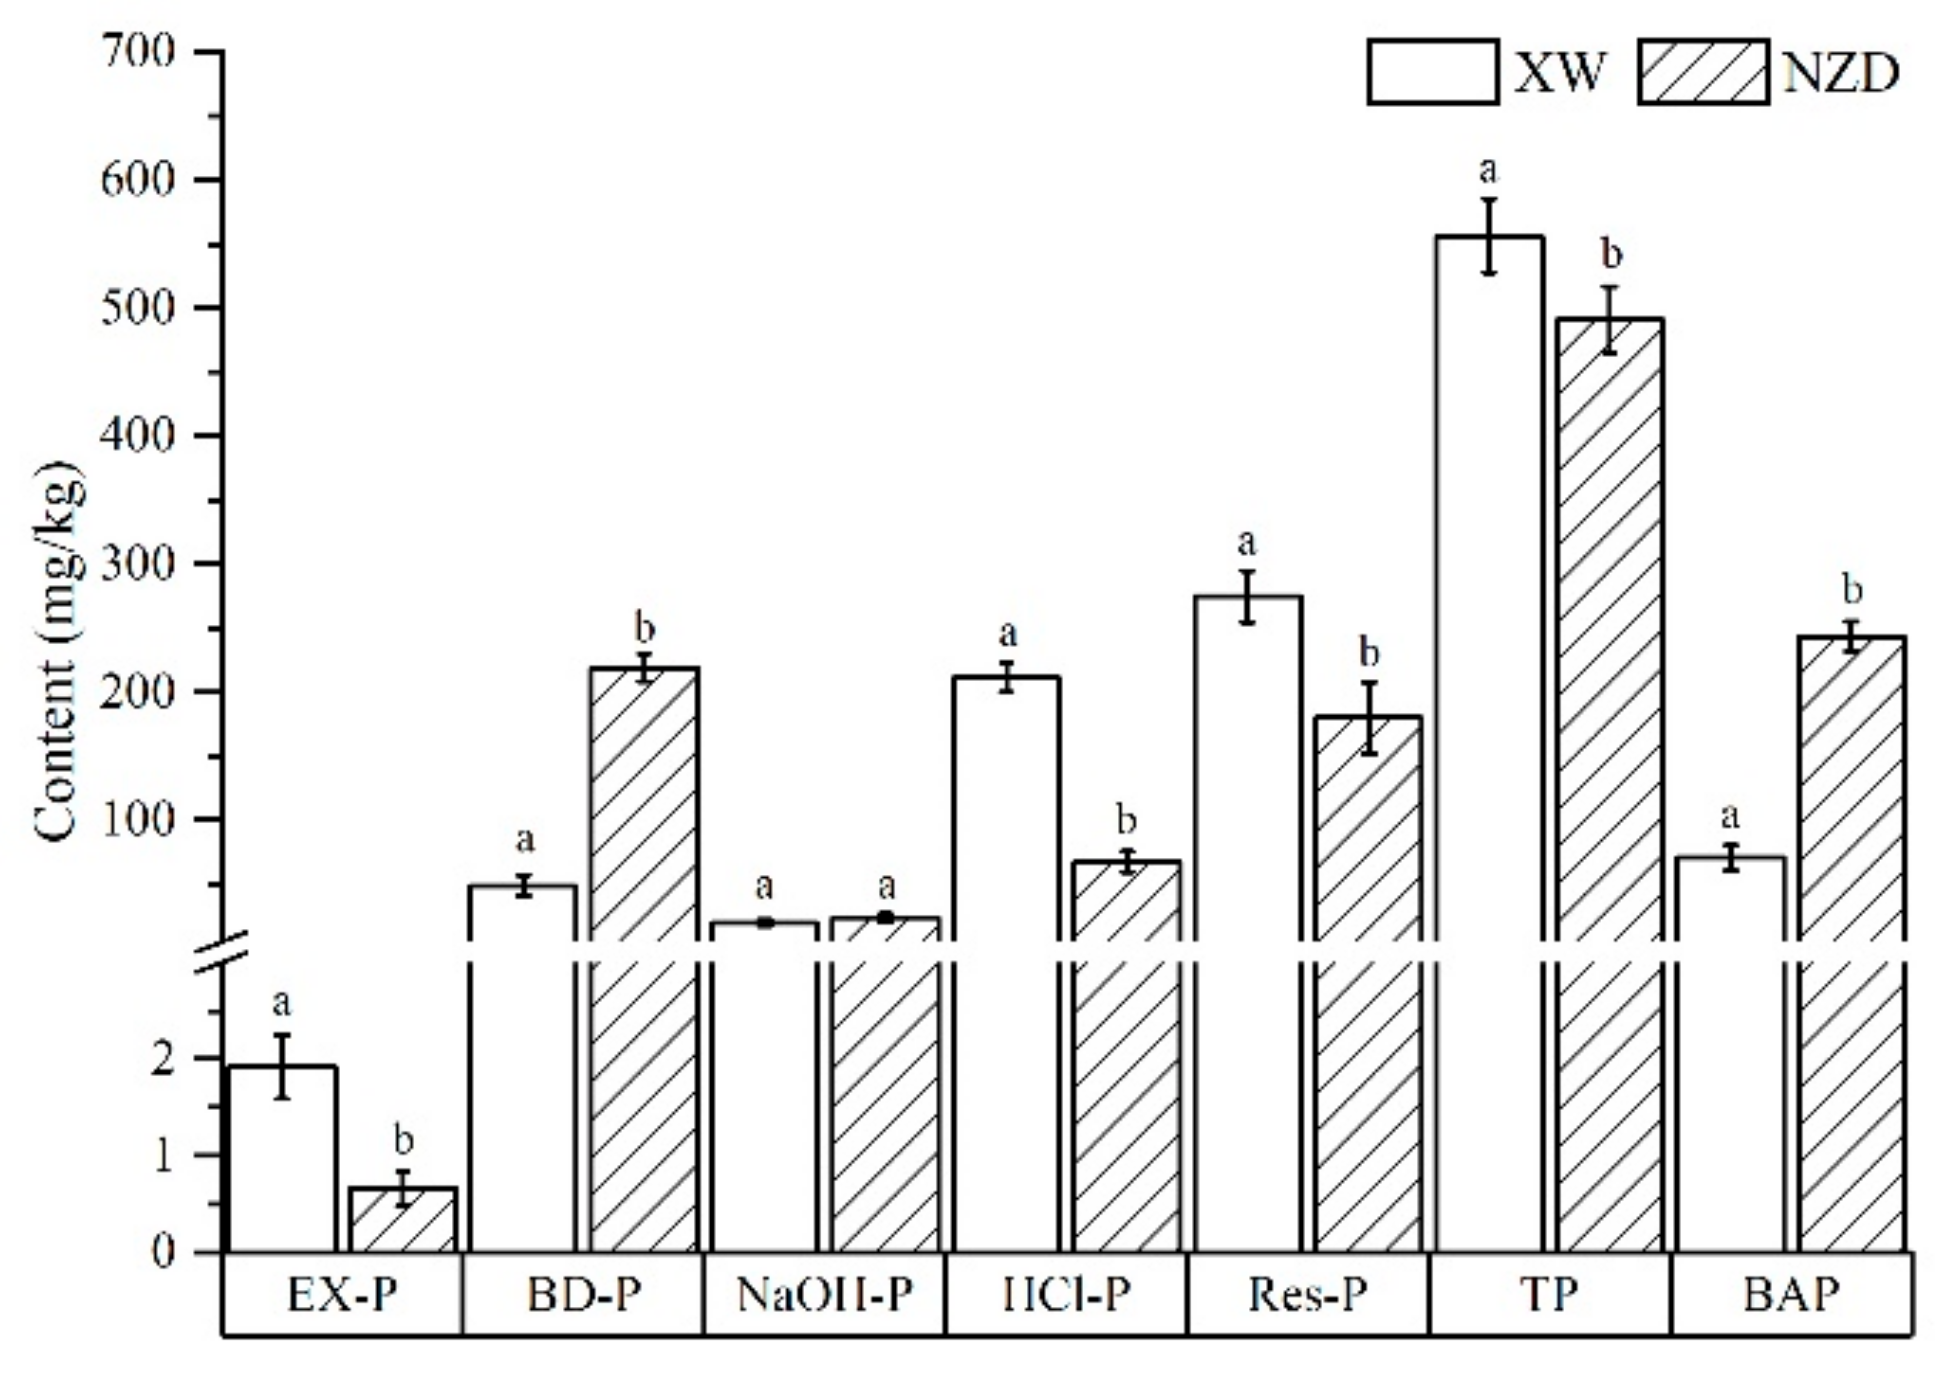
3.1. P Fractions in Sediment

As a result of the analysis of the sediment P (Table 2), the TP content in the XW reservoir was higher than that in the NZD reservoir, with average values of 555.5 ± 105.9 and 490.9 ± 94.5 mg/kg. This is simply because the XW reservoir is located upstream of the NZD reservoir, and phosphorus was trapped in the upstream reservoir sediment.
The sediment contents of the P fractions of the XW reservoir were in the order of Res-P > HCl-P > BD-P > NaOH-P >EX-P. In contrast, the sediment contents of the P fractions of the NZD reservoir were in the order of BD-P > Res-P > HCl-P > NaOH-P > EX-P. The BD-P content in the XW reservoir was lower than that in the NZD reservoir, with average values of 48.6 ± 29.8 and 218.0 ± 39.3 mg/kg, respectively. The BAP of the NZD reservoir was much higher than that of the XW reservoir, by about 3–6 times. The sediment of the XW reservoir showed low BAP content and high inert P content.
The accumulative process of internal P in sediments commonly involves sequential sedimentation, degradation, and accumulation steps. However, due to the influence of the nutrient input, hydrodynamic conditions, and biological and chemical conditions, the fractions of P may be different depending on the location [41,48]. According to a significant difference analysis of the P fractions in the sediment cores of the XW and NZD reservoirs using a one-way ANOVA test (Figure 3), the TP and inert P contents in the sediments of the XW reservoir were significantly higher than those in the NZD reservoir. The BD-P and BAP were significantly lower in the XW reservoir, and there was no significant difference in the NaOH-P between the reservoirs. These results are basically consistent with a previous study [36], which indicated that the seasonal variations of P fractions in the deep large reservoir are not obvious.

3.2. Available P in Sediment

Compared to the traditional extraction method, the content of available P in sediments can be accurately determined by measuring the P with DGT technology [20,49]. The CDGT-P comprises P in pore water and active solid phase P in sediments stemming from the migration of the BAP in sediments [49]. The CDGT-P decreased in the order of XW-C > XW-B > XW-A, which means it decreased with the direction of flow of sediments in the XW reservoir, and in the order of NZD-B > NZD-A > NZD-C in the sediments of the NZD reservoir (Figure 4b).
The environmental features of the overlying water can influence the migration of P in the sediments [50,51]. Compared to previous research results from the spring [36], the DO contents of the two reservoirs were lower, and there was no seasonal change in the pH and water temperature. In the XW and NZD reservoirs, the DO content in the overlying water varied between 0.9 and 7.8 mg/L (Table 2). Except for NZD-C, the other sampling sites were under hypoxic conditions, which can promote the release of P in the sediments [6,52]. The high DO content and low water depth in NZD-C resulted in an oxidizing condition that was unfavorable for the release of internal P [53,54]. The high temperature of the overlying water in the sediments of the NZD reservoir can increase the microbial activity, which is crucial for the migration of P, and the bacterial metabolism can significantly change the surrounding microenvironment [55,56]. The pH of the overlying water in the sediments of the XW and NZD reservoirs was determined to be 7.6–8.3 (Table 2). In general, a high or low pH will cause the migration of P [50]. The redox potential of the overlying water in the two reservoirs ranged from −80.5 to −43.2 mv. Reduction conditions favor the release of phosphorus in sediment, especially redox-sensitive phosphorus [37]. However, the DO, pH, and other environmental factors are also influenced by each other, resulting in a more complicated mechanism of the release of P in the sediments [57,58]. It should be noted that the CDGT-P in the sediments of XW-C was 3–4 times higher than that in other sampling sites, which was related to the release of P due to the degradation of organic fish feed [59,60].
Although the BAP content in the sediments of the NZD reservoir was high, the CDGT-P was significantly lower than that in the XW reservoir, and the minimum CDGT-P was found in the sediments of NZD-C. Due to P pollution in the aquaculture area, XW-C was an exception; its sediment CDGT-P was significantly higher than in the other sampling sites, with a maximum value of 1204.3 µg/L. The one-way ANOVA analysis for the CDGT-P in the columnar sediments of the XW and NZD reservoirs, after eliminating the interference of XW-C, revealed that there was no significant difference (p < 0.05). Section 1 and a previous study [36] showed that the BAP in the NZD was significantly higher than in the XW, and was due to the significant differences in the fractions of P and BAP in the sediments of the XW and NZD reservoirs resulting from the properties of the sediments, the water environment, sediment transportation, and input of external P. In terms of P fractions in the sediment, the risk of release in NZD was higher than in XW, which is not consistent with the result obtained for the CDGT-P in the sediments. This indicates that available P in the two reservoirs was not significantly influenced by BAP and may be from different sources.
In addition, the CDGT-P in the sediments of the XW and NZD reservoirs was consistent with the spatial distribution of BAP, indicating that the CDGT-P contains the supplementary part of BAP. The replenishment of active solid phase P into pore water was observed in each sampling site, albeit to largely different degrees. Although in the present study, we could not distinguish the replenishment of available P with active solid phase P in the sediments, the CDGT-P of the overlying water as a receptor of released internal P can indirectly reflect the P content in a dissolved state in pore water [20,56]. For the overlying water of the sediment cores in the XW and NZD reservoirs, the CDGT-P was 21.4–243.8 and 10.4–19.0 µg/L, respectively (Figure 4a). The CDGT-P in the sediments of XW-B was slightly higher than that of XW-A, whereas the CDGT-P in the overlying water of XW-B was significantly lower than that of XW-A, which indirectly indicates a low release of active solid phase P in the sediments. The CDGT-P in the sediments of NZD-C was significantly lower than that of NZD-A and NZD-B, but the CDGT-P in the overlying water was high, which indicates a high release of active solid phase P in the sediments. This means that the release of P in the sediments depends considerably on the location, and the migration of P happens easily, although the activity of P in the sediments of the XW reservoir was lower than that of the NZD reservoir. Compared to the NZD reservoir, the BAP content in the XW reservoir was lower, but the replenishment degree of active solid phase P in pore water was higher, resulting in P migration.
To gain more insight into the source of active available P in the sediments, a Pearson correlation analysis was performed for the fractions of P and CDGT-P in the sediment cores of the XW and NZD reservoirs (Table 3). According to the analysis, the CDGT-P in the sediments had a significant positive correlation with BD-P (r = 0.632 and 0.689, respectively, p < 0.01) and BAP (r = 0.571 and 0.708, respectively, p < 0.01). This indicates that an increase in BAP can promote the release of internal P. BD-P is the main component of BAP in the XW and NZD reservoirs (Table 2), and the correlation of the CDGT-P with BAP is probably mainly caused by its correlation with BD-P. BD-P is sensitive to the oxidization–reduction reaction, and numerous studies have suggested that available P in the sediments mainly comes from BD-P [58,60], which indicates that the release of P in the sediments is promoted by the oxygen-deficient and reduction conditions in the deep water of the XW and NZD reservoirs.
In the sediments of the XW reservoir, the CDGT-P had a significant positive correlation with Res-P (r = 0.597, p < 0.01), which was related to the content of organic materials, and the degradation of organic materials may result in the release of organic P [60,61,62]. The CDGT-P had a significant negative correlation with HCl-P (r = 0.644, p < 0.01); the deposition of phosphate and carbonate in the diagenetic process [44] can prevent the migration of phosphate radicals [63]. In addition, the CDGT-Fe and CDGT-S had significant positive correlations with BD-P and BAP, and the release of P in the sediment was influenced by the release of Fe and S; reactive solid phase phosphorus was the main source. This is consistent with previous findings in southwest China [25].

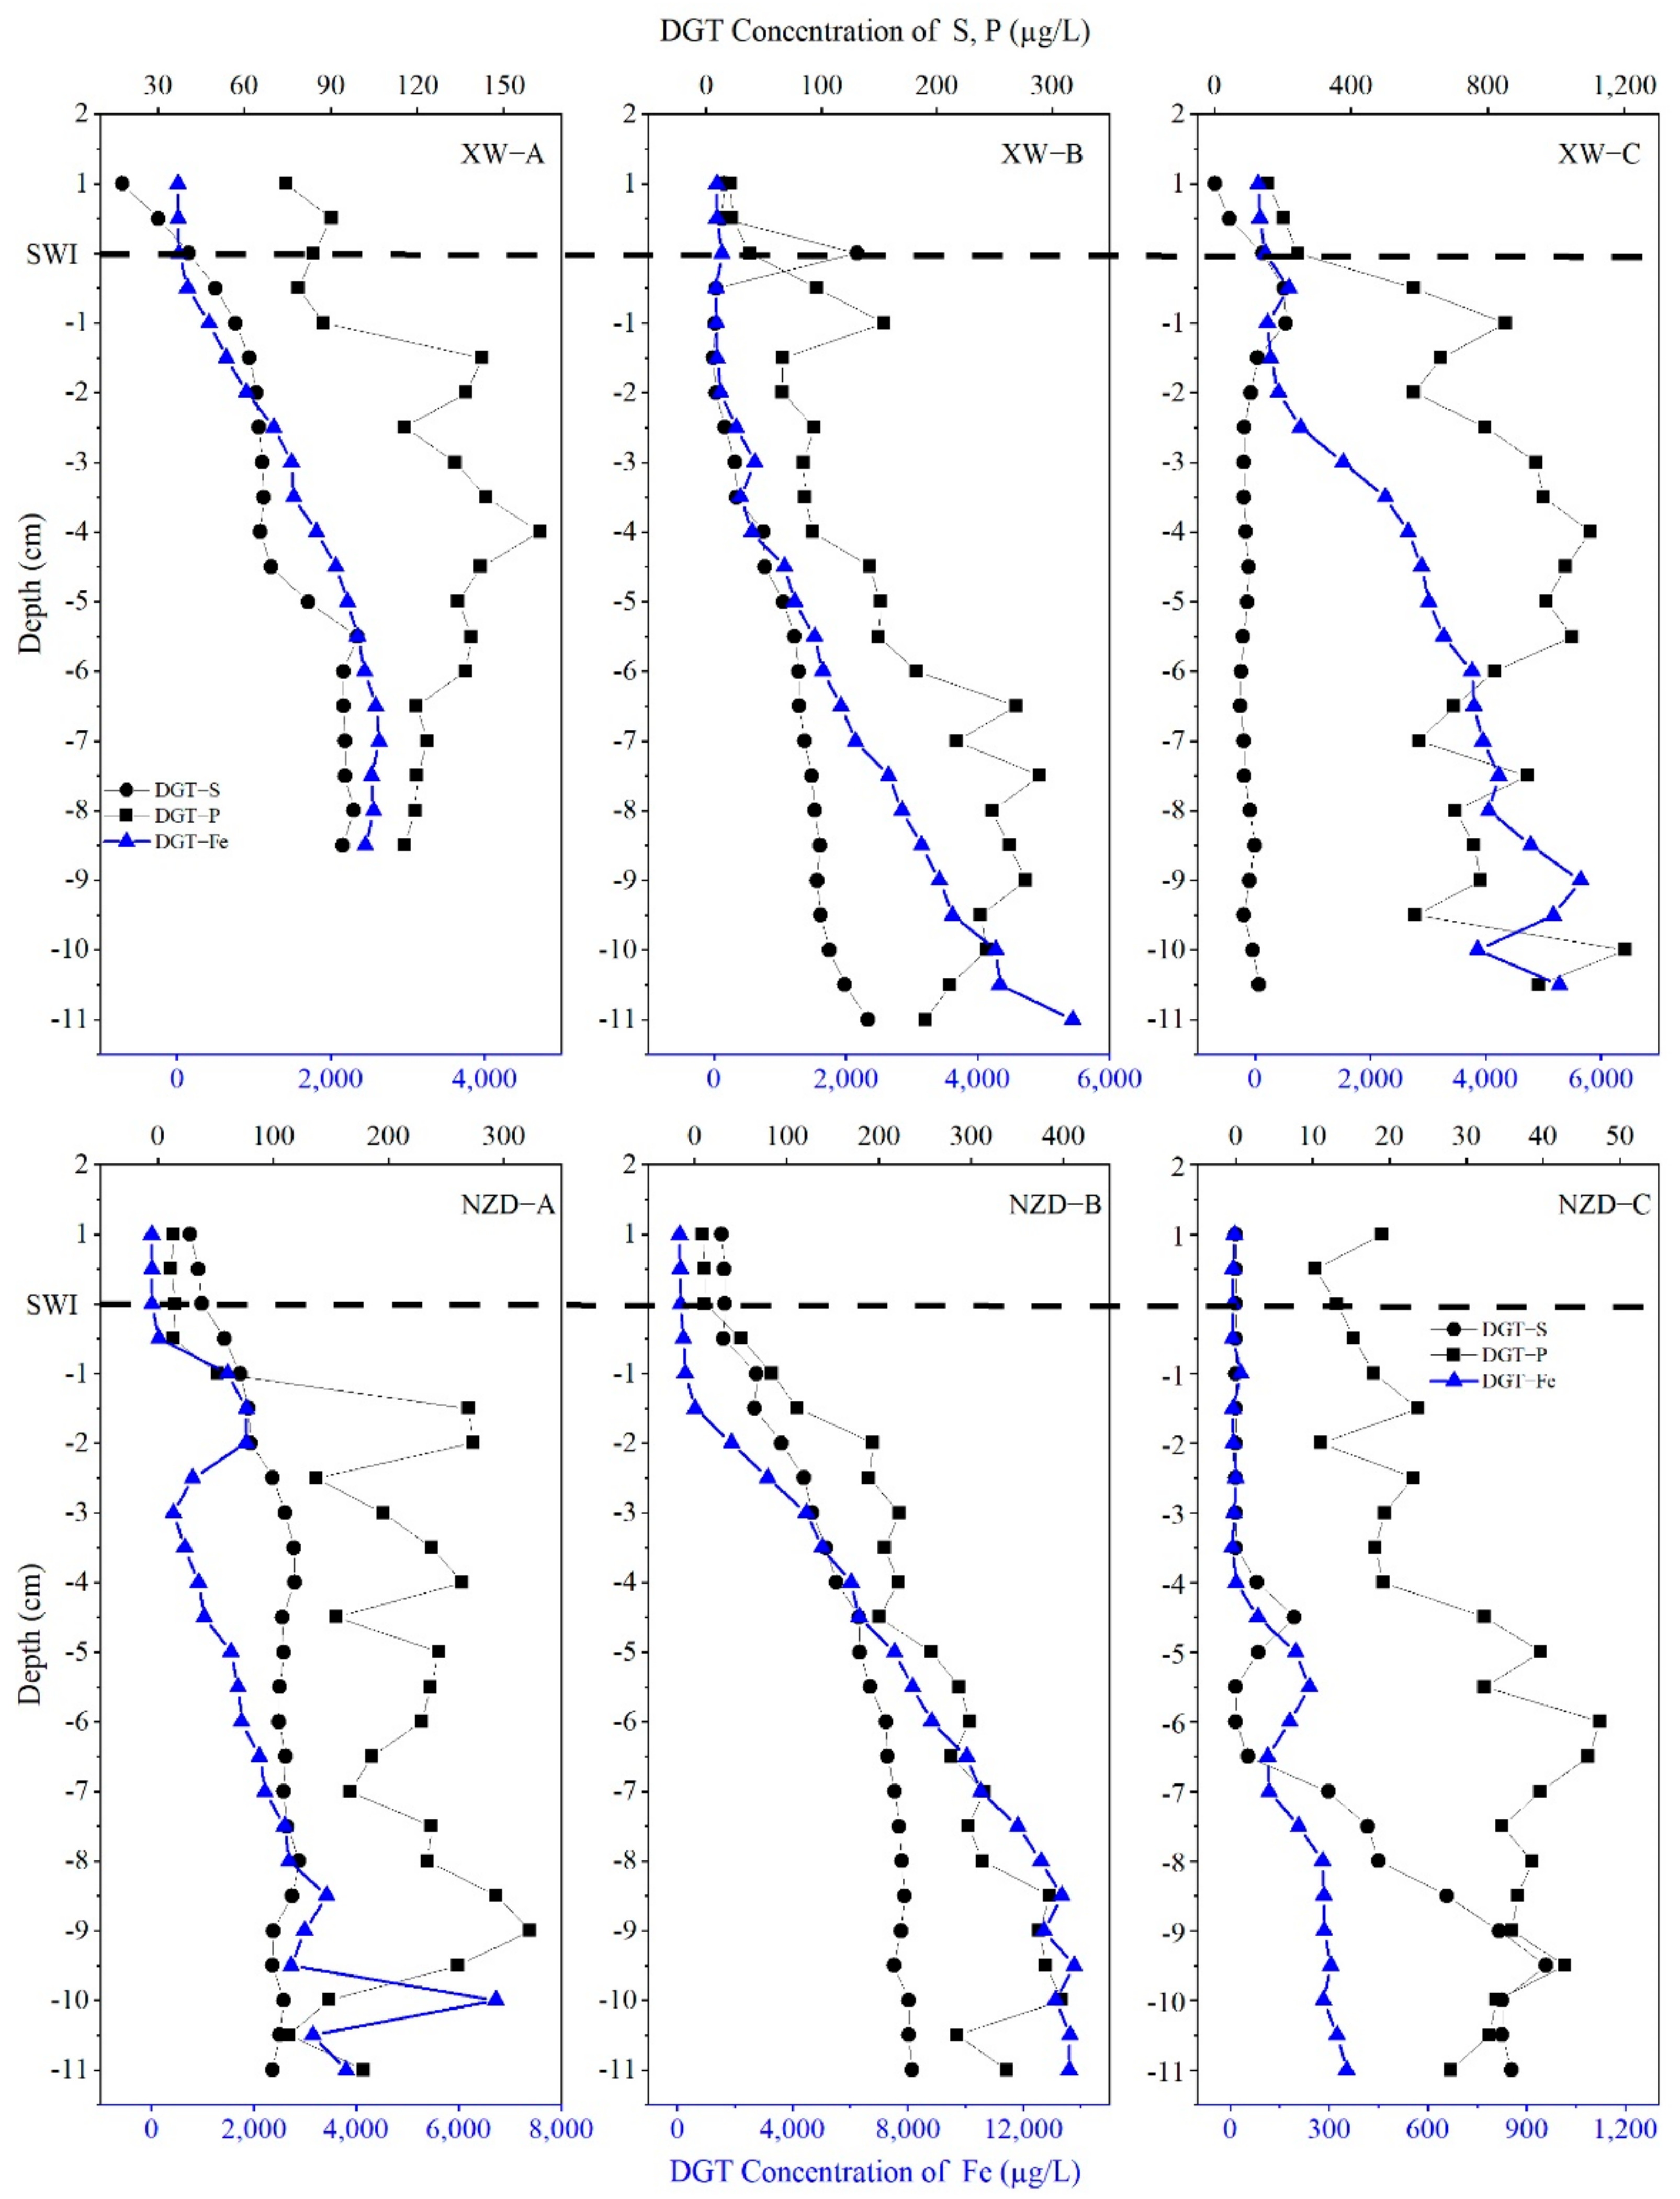
3.3. Vertical Distribution of Available P, Fe, and S in Sediment

Figure 5 shows the vertical profiles of the CDGT-Fe, CDGT-S, and CDGT-P in the sediments of the XW and NZD reservoirs. The CDGT-Fe and CDGT-S in the sediments of the XW reservoir were 31.3–6431.75 and 6.56–208.92 µg/L, respectively, following the order of XW-C > XW-B > XW-A. Meanwhile, the CDGT-Fe and CDGT-S in the sediments of the NZD reservoir were 6.12–13777.85 and 0–236.28 µg/L, respectively, decreasing in the order of NZD-B > NZD-A > NZD-C. The spatial distribution of the CDGT-Fe and CDGT-S in the sediments was consistent with that of the CDGT-P, indicating the influence of Fe and S on the release of P in the sediments.
In the sediments of XW-A and XW-B, the CDGT-Fe and CDGT-S tended to increase with depth, although the vertical variations differed for each sampling site. Thus, in the sediments of XW-A, the CDGT-Fe and CDGT-S exhibited a slight change below 6 cm, which was consistent with the distribution height of the CDGT-P. Both values increased as the depth from the SWI increased to 6 cm, but the CDGT-S tended to change significantly in the middle layer (2–5.5 cm), which may have been related to the combination between S2+ and Fe2+ and influenced the release of P. A significant oxidation–reduction interface can be seen in the sediments of XW-B; the CDGT-Fe and CDGT-S exhibited no significant change under strong oxidizing conditions at 3 cm below the SWI in the sediments, and they increased with the depth under reducing conditions to below 3 cm. It should be noted that the CDGT-Fe and CDGT-S had opposite changes to those of the CDGT-P below 8.5 cm. The CDGT-S in the sediments of XW-C reached its maximum value at the surface layer (208.92 µg/L), whereas the reduction rate of sulfate was at the maximum [64], and relatively stable at other depths. The CDGT-Fe increased with depth, whereas the CDGT-P fluctuated greatly. This indicates that the release of P in the sediments was not significantly controlled by Fe.
In general, the CDGT-Fe in the sediments of NZD-A increased with depth, and a sudden fluctuation occurred at the surface layer, which was related to the release due to the involvement of iron (oxyhydr) oxides in the degradation of organic materials. In addition, the CDGT-S exhibited a slight change with increasing depth. Meanwhile, the same change in the CDGT-Fe, CDGT-S, and CDGT-P with increasing depth was observed in the sediments of NZD-B, and a simultaneous release of Fe and P occurred. In NZD-C, an obvious oxidization–reduction interface could be seen in the sediments due to the low water depth, high DO value, and high penetration depth of DO. The CDGT-Fe did not change with the depth below SWI up to 4 cm, and the CDGT-S was negligible. The CDGT-Fe and CDGT-S increased with depths below 4 cm.

3.4. Release Mechanism of P in Sediment

In the XW and NZD reservoirs, the CDGT-Fe and CDGT-P within the sediment had similar trends of vertical variation. The linear regression analysis we performed for the CDGT-P and CDGT-Fe is shown in Figure 6. The correlation coefficients of the CDGT-Fe and CDGT-P in the XW and NZD reservoirs were lower than the shallow lakes and reservoirs [25,44]. This indicates that the release of P from sediments of deep water reservoirs may be influenced by other factors besides the reductive dissolution of iron-bound P.
According to linear regression analysis for the CDGT-Fe and CDGT-P in the sediments from six sampling sites (Figure 6), the CDGT-Fe and CDGT-P in the sediments can be fitted with one or two straight lines. The slope of the linear regression equation changes within −21.24 and 40.12, indicating the Fe/P ratio measured by the DGT technology. The slope values of XW-B, NZD-A, and NZD-C were lower than the other three sites, indicating less active iron (oxyhydr) oxides for retaining P and high risk for releasing P from the sediments [20]. In contrast, the slope values of XW-A and NZD-B were higher than the other sites, suggesting strong control of active iron (oxyhydr) oxides over labile P in the sediments.
In the sediments of NZD-B and NZD-C, CDGT-Fe and CDGT-P can be fitted with one straight line respectively, it indicates that the species of iron (oxyhydr) oxides bound to phosphate in the sediments are consistent in each site. As in XW-A, although two straight lines are required for fitting, the slope is almost equal [44]. The linear fitting slope differs greatly for the CDGT-Fe and CDGT-P in the sediments of XW-B and NZD-A because the content of iron (oxyhydr) oxides may be different in the top and bottom layers, while secondary iron and mixed iron mineral in the bottom layer may play an important role in regulating the release of P [65]. The CDGT-Fe and CDGT-P in the bottom sediments of XW-B have had a negative correlation because sulfate reduction and the combination with Fe2+ may promote the release of P. In addition, the high concentration of available P in the sediments of XW-C and the poor correlation between the CDGT-Fe and CDGT-P indicate that other factors can be responsible for the P release [66,67].

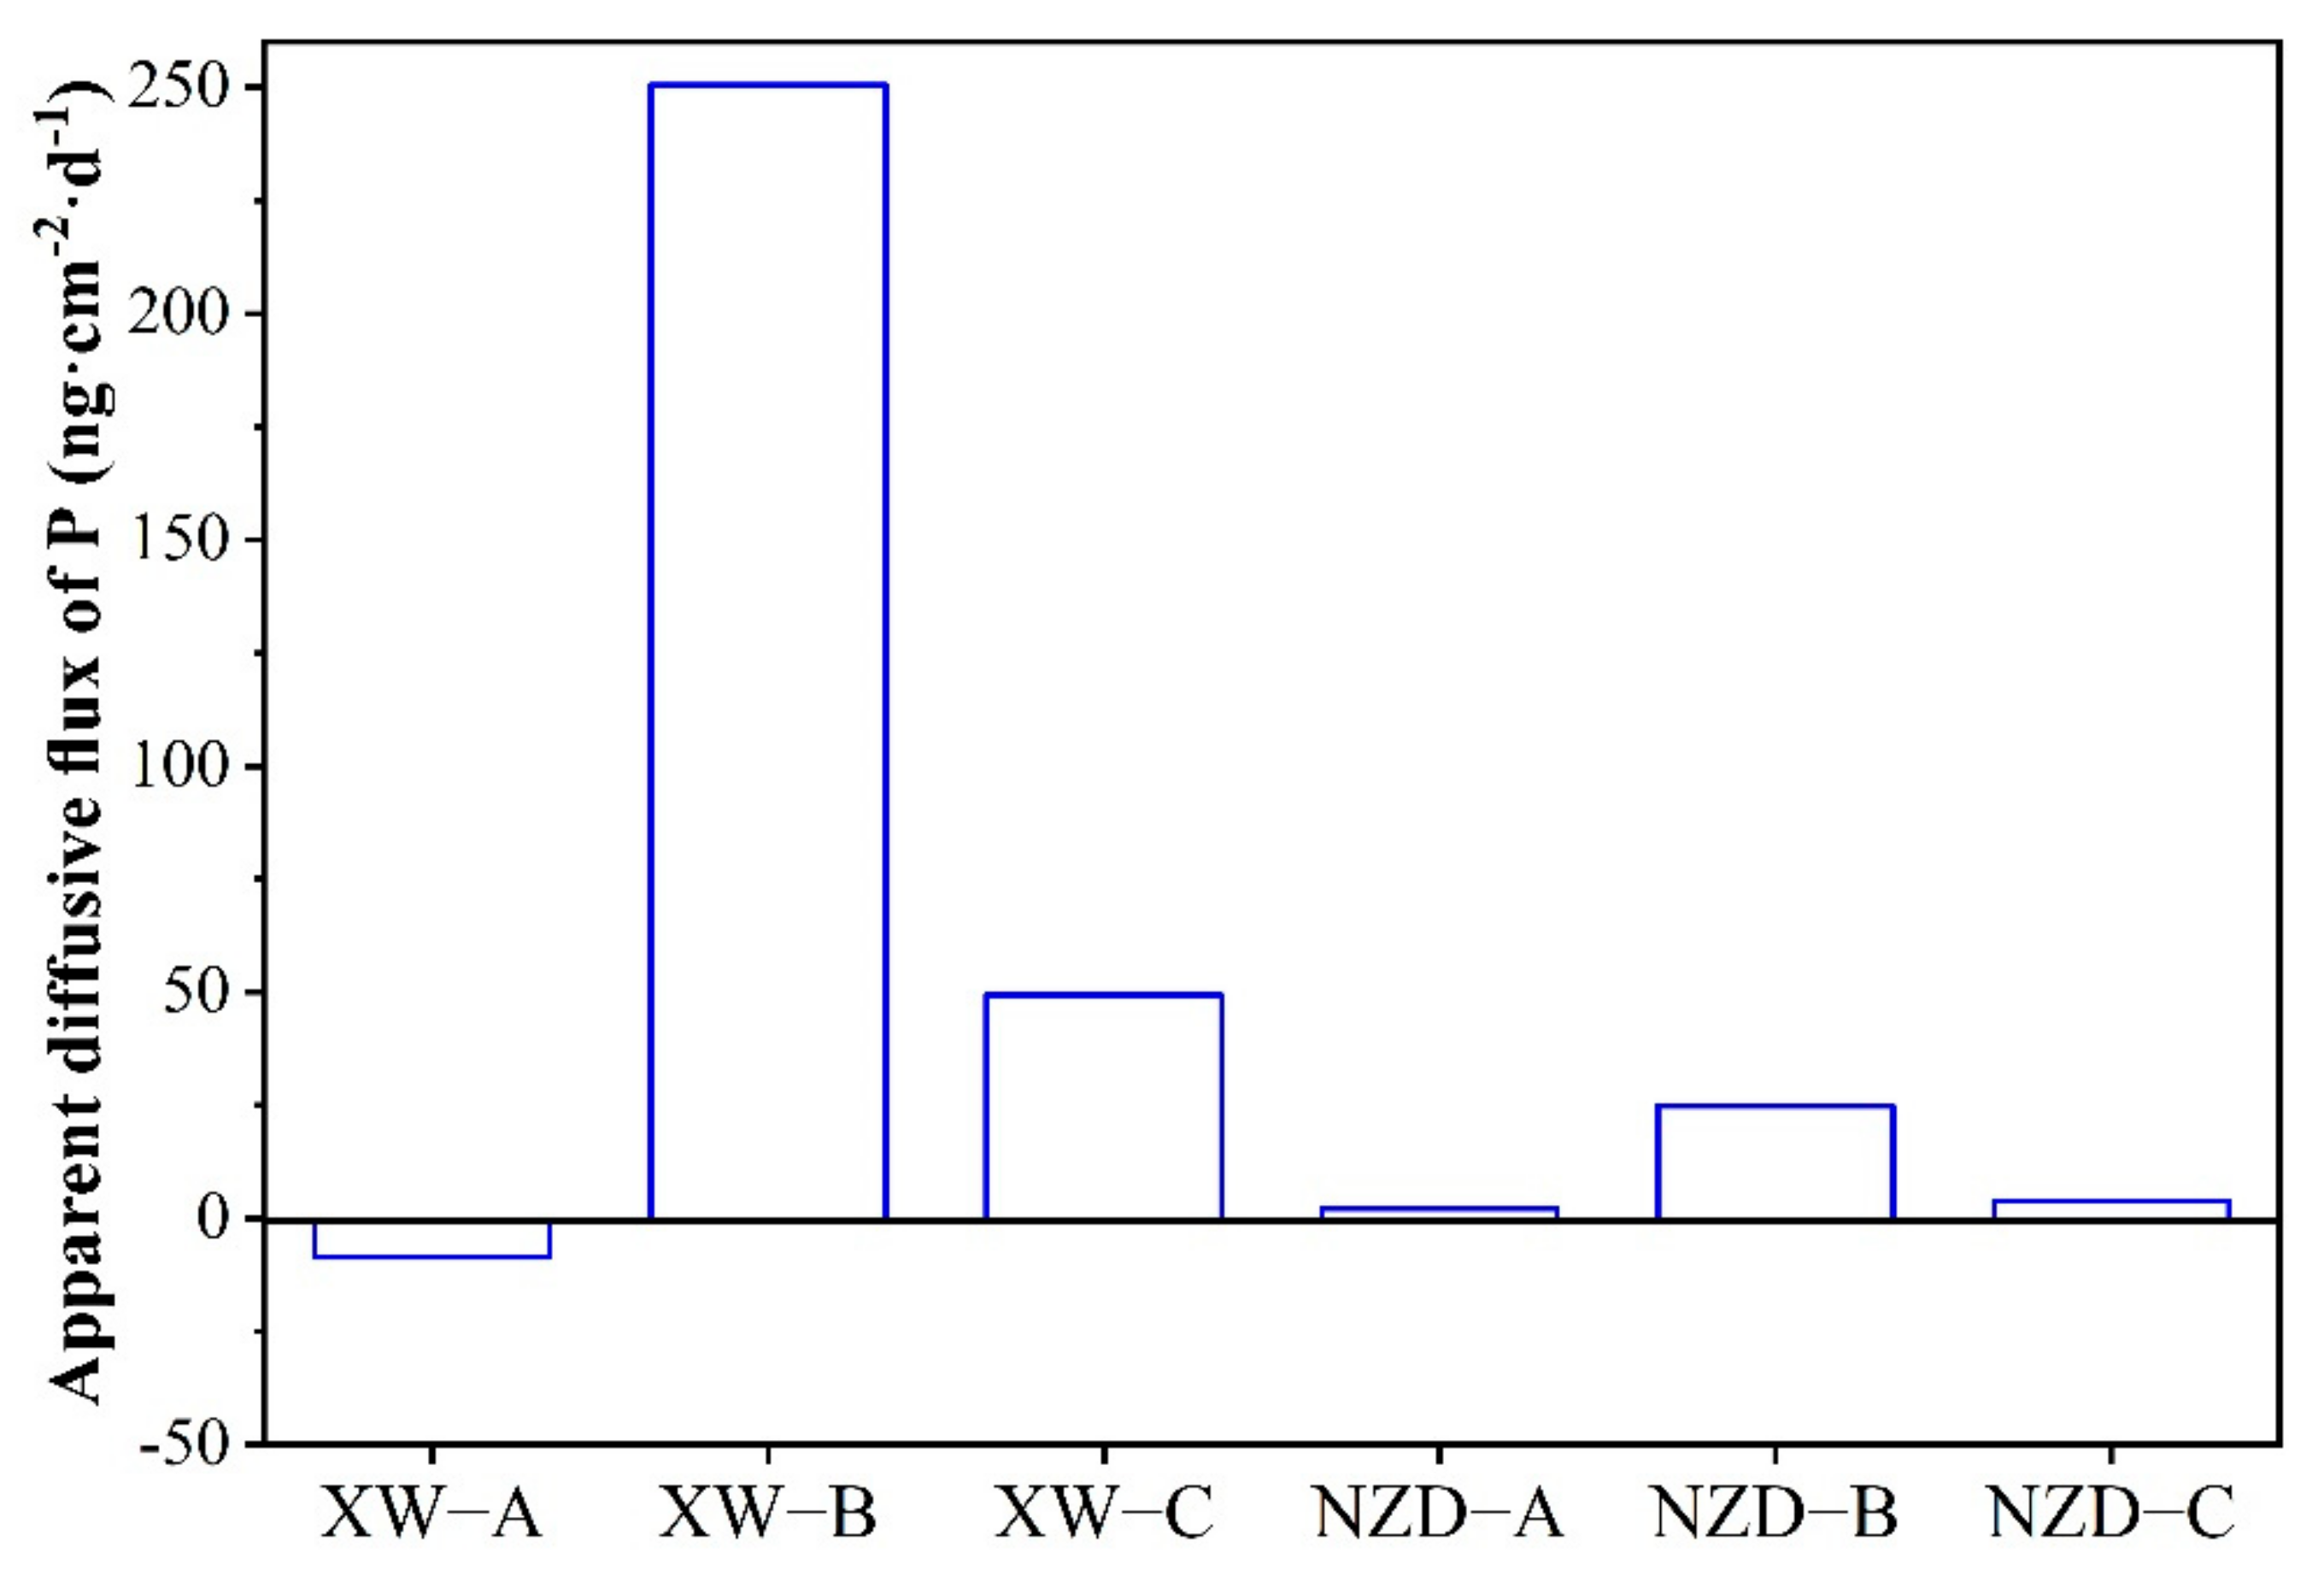
3.5. Apparent Diffusive Flux of P

Figure 7 shows the apparent release flux of P across the SWI in the sediments of the XW and NZD reservoirs. The flux value varies between −8.6 and 250.2 ng/cm2 d, and it has a positive value if P in the sediments was transferred to overlying water and a negative value in the contrary case. According to Figure 7, the release of P in the sediments of XW-B, XW-C, NZD-A, NZD-B, and NZD-C into overlying water across the SWI indicates that P came from the sediments, while the absorption of P in the overlying water of XW-A by the sediments across the SWI suggests that P was accumulated into the sediments. The highest flux occurred in the middle of the reservoir rather than in front of the dam; sediment resuspension caused by hydrodynamic disturbances may be responsible for the abnormal phenomena [25].

4. Conclusions

In this study, we investigated the fractions of P and the vertical changes of available P, Fe, and S in the sediments of two large-scale deep reservoirs in the lower reaches of the Lancang River. A significant difference was found in the P fractions of sediment between the XW and NZD reservoirs. Compared to the NZD reservoir, the BAP content in the XW reservoir was lower. In terms of P fractions in the sediment, the risk of release in XW was higher than in NZD, but the replenishment degree of active solid phase P into pore water was higher in XW. In addition, the available P had a significant positive correlation with the BAP. It was indicated that the migration of P caused by the replenishment of active solid phase P must be considered. The release of P in the sediments is influenced by the release of Fe and S and is mainly caused by the hypoxic and reduction environment in deep water. The Fe/P ratio measured by DGT technology reflects the control of active iron (oxyhydr) oxides over labile P in the sediments. In an aquaculture zone with high organic content, the release of P is mainly influenced by the degradation of organic materials. The P cycling in deep reservoir sediment is mainly controlled by Fe, and there is a clear spatial distribution of this mechanism in deep reservoirs.

Author Contributions

Z.M.: Writing—original draft, formal analysis. Y.C.: Writing—original draft, conceptualization. Y.W.: Conceptualization, methodology. Q.H., M.H., W.D. and J.F.: Investigation and formal analysis. All authors have read and agreed to the published version of the manuscript.

Funding

This research was funded by the National Natural Science Foundation of China (U1802241, U2040211, 92047204, HNKJ18-H23 and 11371117), Innovative Research Group of Hebei Natural Science Foundation (E2020402074), University Science and Technology Research Project of Hebei, China (ZD2019005), and Graduate Innovation Foundation of Hebei Province (CXZZSS2021090).

Institutional Review Board Statement

Not applicable.

Acknowledgments

The authors appreciate the editor and two anonymous reviewers for their constructive comments and suggestions for the revision of this paper.

Conflicts of Interest

The authors declare no conflict of interest.

Appendix A

Figure A1. The vertical profiles of the physicochemical characteristics of the sampling sites.
Water 13 02691 g0a1

References

  1. Conley, D.J.; Paerl, H.W.; Howarth, R.W.; Boesch, D.F.; Seitzinger, S.P.; Havens, K.E.; Christiane, L.; Likens, G.E. Ecology. Controlling eutrophication: Nitrogen and phosphorus. Science 2009, 323, 1014. [Google Scholar] [CrossRef]
  2. Elser, J.; Bracken, M.; Cleland, E.; Gruner, D.; Harpole, W.; Hillebrand, H.; Ngai, J.; Seabloom, E.; Shurin, J.; Smith, J. Global analysis of nitrogen and phosphorus limitation of primary producers in freshwater, marine and terrestrial ecosystems. Ecol. Lett. 2007, 10, 1135–1142. [Google Scholar] [CrossRef] [Green Version]
  3. Schindler, D.W. Eutrophication and recovery in experimental lakes: Implications for lake management. Science 1974, 184, 897–899. [Google Scholar] [CrossRef] [Green Version]
  4. Smith, V.H.; Tilman, G.D.; Nekola, J.C. Eutrophication: Impacts of excess nutrient inputs on freshwater, marine, and terrestrial ecosystems. Environ. Pollut. 1999, 100, 179–196. [Google Scholar] [CrossRef]
  5. Schindler, D.W.; Hecky, R.E.; Findlay, D.L.; Stainton, M.P.; Parker, B.R.; Paterson, M.J.; Beaty, K.G.; Lyng, M.; Kasian, S.E.M. Eutrophication of lakes cannot be controlled by reducing nitrogen input: Results of a 37-year whole-ecosystem experiment. Proc. Natl. Acad. Sci. USA 2008, 105, 11254–11258. [Google Scholar] [CrossRef] [PubMed] [Green Version]
  6. Søndergaard, M.; Jensen, J.P.; Jeppesen, E. Internal phosphorus loading in shallow Danish lakes. Hydrobiologia 1999, 408, 145–152. [Google Scholar] [CrossRef]
  7. Ni, Z.; Wang, S.; Wang, Y. Characteristics of bioavailable organic phosphorus in sediment and its contribution to lake eutrophication in China. Environ. Pollut. 2016, 219, S0269749116304754. [Google Scholar] [CrossRef]
  8. Søndergaard, M. Nutrient Dynamics in Lakes-With Emphasis on Phosphorus, Sediment and Lake Restoration; National Environmental Research Institute: Maharashtra, Denmark; University of Aarhus: Aarhus, Denmark, 2007. [Google Scholar]
  9. Søndergaard, M.; Jensen, J.P.; Jeppesen, E. Role of sediment and internal loading of phosphorus in shallow lakes. Hydrobiologia 2003, 506, 135–145. [Google Scholar] [CrossRef]
  10. Zhu, M.; Zhu, G.; Li, W.; Zhang, Y.; Zhao, L.; Gu, Z. Estimation of the algal-available phosphorus pool in sediments of a large, shallow eutrophic lake (Taihu, China) using profiled SMT fractional analysis. Environ. Pollut. 2013, 173, 216–223. [Google Scholar] [CrossRef]
  11. Ding, S.; Chen, M.; Gong, M.; Fan, X.; Qin, B.; Xu, H.; Gao, S.; Jin, Z.; Tsang, D.C.W.; Zhang, C. Internal phosphorus loading from sediments causes seasonal nitrogen limitation for harmful algal blooms. Sci. Total Environ. 2018, 625, 872–884. [Google Scholar] [CrossRef]
  12. House, W.A. Geochemical cycling of phosphorus in rivers. Appl. Geochem. 2003, 18, 739–748. [Google Scholar] [CrossRef]
  13. Marsden, M.W. Lake restoration by reducing external phosphorus loading: The influence of sediment phosphorus release. Freshw. Biol. 2010, 21, 139–162. [Google Scholar] [CrossRef]
  14. Pettersson, K. Mechanisms for internal loading of phosphorus in lakes. Hydrobiologia 1998, 373, 21–25. [Google Scholar] [CrossRef]
  15. Katsaounos, C.Z.; Giokas, D.L.; Leonardos, I.D.; Karayannis, M.I. Speciation of phosphorus fractionation in river sediments by explanatory data analysis. Water Res. 2007, 41, 406–418. [Google Scholar] [CrossRef]
  16. Zhu, Y.; Wu, F.; He, Z.; Guo, J.; Qu, X.; Xie, F.; Giesy, J.P.; Liao, H.; Gue, F. Characterization of organic phosphorus in lake sediments by sequential fractionation and enzymatic hydrolysis. Environ. Sci. Technol. 2013, 47, 7679–7687. [Google Scholar] [CrossRef]
  17. Condron, L.M.; Newman, S. Revisiting the fundamentals of phosphorus fractionation of sediments and soils. J. Soils Sediments 2011, 11, 830–840. [Google Scholar] [CrossRef]
  18. Davlson, W.; Zhang, H. In situ speciation measurements of trace components in natural waters using thin-film gels. Nature 1994, 367, 546–548. [Google Scholar] [CrossRef] [Green Version]
  19. Davison, W.; Zhang, H. Progress in understanding the use of diffusive gradients in thin films (DGT)-back to basics. Environ. Chem. 2012, 9, 1–13. [Google Scholar] [CrossRef]
  20. Ding, S.; Han, C.; Wang, Y.; Yao, L.; Wang, Y.; Xu, D.; Sun, Q.; Williams, P.N.; Zhang, C. In situ, high-resolution imaging of labile phosphorus in sediments of a large eutrophic lake. Water Res. 2015, 74, 100–109. [Google Scholar] [CrossRef]
  21. Hesslein, R.H. An in situ sampler for close interval pore water studies. Limnol. Oceanogr. 1976, 21, 912–914. [Google Scholar] [CrossRef]
  22. Fones, G.; Davison, W.; Grime, G. Development of constrained DET for measurements of dissolved iron in surface sediments at sub-mm resolution. Sci. Total Environ. 1998, 221, 127–137. [Google Scholar] [CrossRef]
  23. Mei, X.; Dai, Z.; Gelder, P.H.A.J.M.; Gao, J. Linking Three Gorges Dam and downstream hydrological regimes along the Yangtze River, China. Earth Space Sci. 2015, 2, 94–106. [Google Scholar] [CrossRef]
  24. Yao, X.; Zhang, Y.; Zhang, L.; Zhou, Y. A bibliometric review of nitrogen research in eutrophic lakes and reservoirs. J. Environ. Sci. 2018, 66, 274–285. [Google Scholar] [CrossRef] [PubMed]
  25. Chen, Q.; Chen, J.; Wang, J.; Guo, J.; Jin, Z.; Yu, P.; Ma, Z. In situ, high-resolution evidence of phosphorus release from sediments controlled by the reductive dissolution of iron-bound phosphorus in a deep reservoir, southwestern China. Sci. Total Environ. 2019, 666, 39–45. [Google Scholar] [CrossRef]
  26. Hart, D.D.; Johnson, T.E.; Bushawnewton, K.L.; Horwitz, R.J.; Bednarek, A.T.; Charles, D.F.; Kreeger, D.A.; Velinsky, D.J. Dam Removal: Challenges and Opportunities for Ecological Research and River Restoration We develop a risk assessment framework for understanding how potential responses to dam removal vary with dam and watershed characteristics, which can lead to more effe. Bioscience 2002, 52, 669–682. [Google Scholar] [CrossRef]
  27. Stanley, E.H.; Doyle, M.W. A Geomorphic Perspective on Nutrient Retention Following Dam Removal. Bioscience 2002, 52, 693–701. [Google Scholar] [CrossRef] [Green Version]
  28. Friedl, G.; Wüest, A. Disrupting biogeochemical cycles-Consequences of damming. Aquat. Sci. 2002, 64, 55–65. [Google Scholar] [CrossRef]
  29. Liu, Q.; Liu, S.; Zhao, H.; Deng, L.; Wang, C.; Zhao, Q.; Dong, S. The phosphorus speciations in the sediments up- and down-stream of cascade dams along the middle Lancang River. Chemosphere 2015, 120, 653–659. [Google Scholar] [CrossRef]
  30. Kummu, M.; Vans, O. Sediment-related impacts due to upstream reservoir trapping, the Lower Mekong River. Geomorphology 2007, 85, 275–293. [Google Scholar] [CrossRef]
  31. Wei, G.L.; Yang, Z.F.; Cui, B.S.; Bing, L.; He, C.; Bai, J.H.; Dong, S.K. Impact of Dam Construction on Water Quality and Water Self-Purification Capacity of the Lancang River, China. Water Resour. Manag. 2009, 23, 1763–1780. [Google Scholar] [CrossRef]
  32. Wang, C.; Liu, S.; Zhao, Q.; Deng, L.; Dong, S. Spatial variation and contamination assessment of heavy metals in sediments in the Manwan Reservoir, Lancang River. Ecotoxicol. Environ. Saf. 2012, 82, 32–39. [Google Scholar] [CrossRef]
  33. Zhao, Q.; Liu, S.; Deng, L.; Dong, S.; Yang, J.; Wang, C. The effects of dam construction and precipitation variability on hydrologic alteration in the Lancang River Basin of southwest China. Stoch. Environ. Res. Risk Assess. 2012, 26, 993–1011. [Google Scholar] [CrossRef]
  34. Yujun, Y.I.; Tang, C.; Yang, Z.; Chen, X.I. Influence of Manwan Reservoir on fish habitat in the middle reach of the Lancang River. Ecol. Eng. 2014, 69, 106–117. [Google Scholar]
  35. Fan, H.; He, D.; Wang, H. Environmental consequences of damming the mainstream Lancang-Mekong River: A review. Earth-Sci. Rev. 2015, 146, 77–91. [Google Scholar] [CrossRef]
  36. Mu, Z.; Wang, Y.; Wu, J.; Cheng, Y.; Lu, J.; Chen, C.; Zhao, F.; Li, Y.; Hu, M.; Bao, Y. The influence of cascade reservoir construction on sediment biogenic substance cycle in Lancang River from the perspective of phosphorus fractions. Ecol. Eng. 2020, 158, 106051. [Google Scholar] [CrossRef]
  37. Sun, Q.; Sheng, Y.; Yang, J.; Di Bonito, M.; Mortimer, R.J.G. Dynamic characteristics of sulfur, iron and phosphorus in coastal polluted sediments, north China. Environ. Pollut. 2016, 219, 588–595. [Google Scholar] [CrossRef]
  38. Ruban, V.; López-Sánchez, J.F.; Pardo, P.; Rauret, G.; Muntau, H.; Quevauviller, P. Harmonized protocol and certified reference material for the determination of extractable contents of phosphorus in freshwater sediments—A synthesis of recent works. Fresenius J. Anal. Chem. 2001, 370, 224–228. [Google Scholar] [CrossRef]
  39. Hupfer, M.; Gächter, R.G.; Giovanoli, R. Transformation of phosphorus species in settling seston and during early sediment diagenesis. Aquat. Sci. 1995, 57, 305–324. [Google Scholar] [CrossRef]
  40. Eaton, A.D.; Clesceri, L.S.; Greenberg, A.E.; Franson, M.A.H. Standard methods for the examination of water and wastewater. Am. J. Public Health Nations Health 1966, 56, 387–388. [Google Scholar]
  41. Zhou, A.M.; Wang, D.S.; Tang, H.X. Phosphorus fractionation and bio-availability in Taihu Lake (China) sediments. J. Environ. Sci. 2005, 17, 384–388. [Google Scholar]
  42. Tao, Y.; Dan, D.; Xuejiao, H.; Changda, H.; Guo, F.; Fengchang, W. Characterization of phosphorus accumulation and release using diffusive gradients in thin films (DGT)-linking the watershed to Taihu Lake, China. Sci. Total Environ. 2019, 673, 347–356. [Google Scholar] [CrossRef] [PubMed]
  43. Zhang, L. Estimation of releasing fluxes of sediment nitrogen and phosphorus in Fubao Bay in Dianchi Lake. Huan Jing Ke Xue = Huanjing Kexue 2008, 29, 114–120. [Google Scholar]
  44. Ding, S.; Wang, Y.; Wang, D.; Li, Y.Y.; Gong, M.; Zhang, C. In situ, high-resolution evidence for iron-coupled mobilization of phosphorus in sediments. Sci. Rep. 2016, 6, 24341. [Google Scholar] [CrossRef] [PubMed] [Green Version]
  45. Yue, G.; Lesven, L.; Gillan, D.; Sabbe, K.; Billon, G.; Galan, S.D.; Elskens, M.; Baeyens, W.; Leermakers, M. Geochemical behavior of trace elements in sub-tidal marine sediments of the Belgian coast. Mar. Chem. 2009, 117, 88–96. [Google Scholar]
  46. Li, Y.H. Diffusion of ions in seawater and deep sea sediments. Geochim. Cosmochim. Acta 1974, 38, 708. [Google Scholar]
  47. Ullman, W.J.; Aller, R.C. Diffusion coefficients in nearshore marine sediments. Limnol. Oceanogr. 1982, 27, 552–556. [Google Scholar] [CrossRef]
  48. Cavalcante, H.; Araújo, F.; Noyma, N.P.; Becker, V. Phosphorus fractionation in sediments of tropical semiarid reservoirs. Sci. Total Environ. 2018, 619–620, 1022–1029. [Google Scholar] [CrossRef]
  49. Zhang, C.; Ding, S.; Xu, D.; Tang, Y.; Ming, H.W. Bioavailability assessment of phosphorus and metals in soils and sediments: A review of diffusive gradients in thin films (DGT). Environ. Monit. Assess. 2014, 186, 7367–7378. [Google Scholar] [CrossRef]
  50. Jin, X.; Wang, S.; Pang, Y.; Wu, F.C. Phosphorus fractions and the effect of pH on the phosphorus release of the sediments from different trophic areas in Taihu Lake, China. Environ. Pollut. 2006, 139, 288–295. [Google Scholar] [CrossRef]
  51. Pedro, T.; Kimberley, S.; Fernando, P. Dynamics of phosphorus in sediments of a naturally acidic lake. Int. J. Sediment. Res. 2013, 28, 90–102. [Google Scholar] [CrossRef]
  52. Ting, D.S.; Appan, A. General characteristics and fractions of phosphorus in aquatic sediments of two tropical reservoirs. Water Sci. Technol. 1996, 34, 53–59. [Google Scholar]
  53. Rydin, E.; Huser, B.; Welch, E.B. Amount of phosphorus inactivated by alum treatments in Washington lakes. Limnol. Oceanogr. 2000, 45, 226–230. [Google Scholar] [CrossRef]
  54. Christophoridis, C.; Fytianos, K. Study of the conditions affecting the release of phosphorus from the top sediments of two lakes of Northern Greece. Proc. Int. Conf. Environ. Sci. Technol. 2005, 1, 222–231. [Google Scholar]
  55. Wang, J.; Chen, J.; Ding, S.; Guo, J.; Christopher, D.; Dai, Z.; Yang, H. Effects of seasonal hypoxia on the release of phosphorus from sediments in deep-water ecosystem: A case study in Hongfeng Reservoir, Southwest China. Environ. Pollut. 2016, 219, 858–865. [Google Scholar] [CrossRef]
  56. Xia, J.; Jin, X.; Yang, Y.; Li, L.; Wu, F. Effects of biological activity, light, temperature and oxygen on phosphorus release processes at the sediment and water interface of Taihu Lake, China. Water Res. 2008, 42, 2251–2259. [Google Scholar]
  57. Kang, M.; Peng, S.; Tian, Y.; Zhang, H. Effects of dissolved oxygen and nutrient loading on phosphorus fluxes at the sediment–water interface in the Hai River Estuary, China. Mar. Pollut. Bull. 2018, 130, 132–139. [Google Scholar] [CrossRef]
  58. Zhang, Y.; He, F.; Liu, Z.; Liu, B.; Zhou, Q.; Wu, Z.; Zhang, Y.; He, F.; Liu, Z.; Liu, B. Release characteristics of sediment phosphorus in all fractions of West Lake, Hang Zhou, China. Ecol. Eng. 2016, 95, 645–651. [Google Scholar] [CrossRef]
  59. Wang, S.; Jin, X.; Zhao, H.; Zhou, X.; Wu, F. Effects of organic matter on phosphorus release kinetics in different trophic lake sediments and application of transition state theory-ScienceDirect. J. Environ. Manag. 2008, 88, 845–852. [Google Scholar] [CrossRef]
  60. Doan, P.; Watson, S.B.; Markovic, S.; Liang, A.; Dittrich, M. Phosphorus retention and internal loading in the Bay of Quinte, Lake Ontario, using diagenetic modelling. Sci. Total Environ. 2018, 636, 39–51. [Google Scholar] [CrossRef]
  61. Ni, Z.; Wang, S.; Zhang, B.-T.; Wang, Y.; Li, H. Response of sediment organic phosphorus composition to lake trophic status in China. Sci. Total Environ. 2019, 652, 495–504. [Google Scholar] [CrossRef] [Green Version]
  62. Wang, S.; Jin, X.; Zhao, H.; Zhou, X.; Wu, F. Effect of organic matter on the sorption of dissolved organic and inorganic phosphorus in lake sediments. Colloids Surf. A Physicochem. Eng. Asp. 2007, 297, 154–162. [Google Scholar] [CrossRef]
  63. Kaiserli, A.; Voutsa, D.; Samara, C. Phosphorus fractionation in lake sediments—Lakes Volvi and Koronia, N. Greece. Chemosphere 2002, 46, 1147–1155. [Google Scholar] [CrossRef]
  64. Bottrell, S.H.; Mortimer, R.; Davies, I.M.; Harvey, S.M.; Krom, M.D. Sulphur cycling in organic-rich marine sediments from a Scottish fjord. Sedimentology 2010, 56, 1159–1173. [Google Scholar] [CrossRef]
  65. Zhao, Y.; Zhang, Z.; Wang, G.; Li, X.; Ma, J.; Chen, S.; Deng, H.; Annalisa, O.-H. High sulfide production induced by algae decomposition and its potential stimulation to phosphorus mobility in sediment. Sci. Total Environ. 2018, 650, 163–172. [Google Scholar] [CrossRef]
  66. Rao, A.M.F.; Malkin, S.Y.; Hidalgo-Martinez, S.; Meysman, F.J.R. The impact of electrogenic sulfide oxidation on elemental cycling and solute fluxes in coastal sediment. Geochim. Cosmochim. Acta J. Geochem. Soc. Meteorit. Soc. 2016, 172, 265–286. [Google Scholar] [CrossRef] [Green Version]
  67. Kraal, P.; Burton, E.D.; Rose, A.L.; Kocar, B.D.; Lockhart, R.S.; Grice, K.; Bush, R.T.; Tan, E.; Webb, S.M. Sedimentary iron–phosphorus cycling under contrasting redox conditions in a eutrophic estuary. Chem. Geol. 2015, 392, 19–31. [Google Scholar] [CrossRef]
Figure 1. Study area and sampling sites. (a) is Lancang River in Yunnan Province. (b) is Xiaowan reservoir. (c,d) are Nuozhadu reservoir.
Water 13 02691 g001
Figure 2. Layout of the DGT device.
Water 13 02691 g002
Figure 3. Contents of P fractions in the sediment cores of the XW and NZD reservoirs (different letters indicate a significant difference between the XW and NZD reservoirs with p < 0.05, the bar and the vertical lines represent the average values and standard deviations, respectively).
Water 13 02691 g003
Figure 4. Spatial distribution of (a) the CDGT-P in overlying water, (b) the CDGT-P in sediment cores, and (c) solid bioavailable phosphorus (BAP) in sediment cores.
Water 13 02691 g004
Figure 5. Vertical profiles of the P, Fe, and S concentrations measured with DGT (CDGT-P, CDGT-Fe, and CDGT-S, respectively).
Water 13 02691 g005
Figure 6. Linear regression analysis for the CDGT-P and CDGT-Fe in the sediments.
Water 13 02691 g006
Figure 7. Apparent diffusive flux of P across the sediment–water interface.
Water 13 02691 g007
Table 1. Extraction procedure used in the present work [29].
StepSequential Extraction MethodP Fractions
11 g of sediment added to 50 mL of 1 M NH4Cl at a pH of 7, shaken for 4 hEX-P
2Residual sample added to 0.11 M Na2S2O4/NaHCO3, shaken for 1 h at 40 °CBD-P
3Residual sample added to 0.1 M NaOH, shaken for 16 hNaOH-P
4Residual sample added to 0.5 M HCl, shaken for 16 hHCl-P
Table 2. Contents of the different fractions of P in the sediments and the environmental characteristics of the overlying water.
XW-AXW-BXW-CNZD-ANZD-BNZD-C
P fractions in sedimentsEX-P (mg/kg)1.37–4.90.1–4.00.5–4.20.05–1.60–2.260–2.0
BD-P (mg/kg)25.5–47.518.3–59.741.0–178.6218.4–281.3181.6–299.6137.7–267.3
NaOH-P (mg/kg)6–34.94.2–36.110.6–41.812.8–50.411.1–64.08.9–38.8
HCl-P (mg/kg)179.8–319.2140.9–281.2166.3–318.028.7–51.825.1–109.779.1–131.7
Res-P (mg/kg)174.9–320.8144.7–312.6196.1–536.231.1–318.04.4–506.347.6–372.5
BAP (mg/kg)35.7–82.223.3–99.958.6–224.6239.0–321.5194.7–323.0155.7–276.1
TP (mg/kg)463.6–592.2363.4–553.3552.7–927.0359.4–622.4331.7–784.1364.8–683.6
Overlying waterDO (mg/L)4.85.12.60.93.27.8
Temp (°C)13.713.816.517.517.718.1
Conductivity (µS/cm)435.2444.9436.1382.7389.6407.7
pH7.97.97.87.67.78.3
Redox potential (mv)−58.1−59.3−52.9−43.2−45.9−80.5
The sediment depth ranges of XW-A, XW-B, and XW-C are 0–8, 0–11, and 0–10 cm, respectively. The sediment depth range of NZD-A, NZD-B, and NZD-C is 0–11 cm.
Table 3. The correlation analysis of P fractions and the CDGT-P, CDGT-Fe, CDGT-S.
EX-PBD-PNaOH-PHCl-PRes-PTPBAP
XW (n = 29)CDGT-P−0.170.632 **0.250.320.597 **0.731 **0.571 **
CDGT-Fe−0.0760.3400.1050.1280.2850.3500.301
CDGT-s−0.0530.530 **0.1970.387 *0.440 *0.616 **0.478 **
NZD (n = 33)CDGT-P0.200.689 **0.29−0.644 **−0.30−0.180.708 **
CDGT-Fe0.3090.446 **0.244−0.230−0.1330.0170.477 **
CDGT-s0.1730.758 **0.356 *−0.613 **−0.368 *−0.2020.790 **
* indicate p < 0.05, ** indicate p < 0.01.
Publisher’s Note: MDPI stays neutral with regard to jurisdictional claims in published maps and institutional affiliations.

