Abstract
The fate of microplastics (MP) in seawater is heavily influenced by the biota: the density of MP particles can be changed due to biofouling, which affects sinking, or MP can be digested by zooplankton and transferred into fecal pellets with increased sinking rate. We hypothesize that seasonal production and degradation of organic matter, and corresponding changes in the plankton ecosystem affect the MP capacity for transportation and burying in sediments in different seasons. This is simulated with a coupled hydrodynamical-biogeochemical model that provides a baseline scenario of the seasonal changes in the planktonic ecosystem and changes in the availability of particulate and dissolved organic matter. In this work, we use a biogeochemical model OxyDep that simulates seasonal changes of phytoplankton (PHY), zooplankton (HET), dissolved organic matter (DOM) and detritus (POM). A specifically designed MP module considers MP particles as free particles (), particles with biofouling (), particles consumed by zooplankton () and particles in detritus, including fecal pellets ( A 2D coupled benthic-pelagic vertical transport model 2DBP was applied to study the effect of seasonality on lateral transport of MP and its burying in the sediments. OxyDep and MP modules were coupled with 2DBP using Framework for Aquatic Biogeochemical Modelling (FABM). A depletion of MP from the surface water and acceleration of MP burying in summer period compared to the winter was simulated numerically. The calculations confirm the observations that the “biological pump” can be one of the important drivers controlling the quantity and the distribution of MP in the water column.
1. Introduction
Microplastic pollution of the environment is one of the most urgent global problems in recent years [1,2]. Microplastic (MP) refers to plastic fragments less than 5 mm in size [3]. Currently, all the natural environments from poles to the equator, including the oceans, are contaminated by MP [4].
MP can enter the ocean directly as so-called primary MP (for example, the microbeads in abrasive cleaning and self-care products, fibres of polymeric materials) or can be formed as a result of fragmentation of larger plastic objects in sea water (secondary MP). Environmental conditions, mostly mechanical abrasion, UV radiation and oxygen promote weathering of larger plastics and breakup into minute pieces (so called secondary MP). Rivers are one of the dominant pathways for microplastics to reach the oceans [5]. In addition, MP particles enter the aquatic coastal environment in large numbers through municipal wastewater either as treated wastewater coming from wastewater treatment plants (WWTPs) [6] or as raw sewage through leakages or overflows in the sewer system. In the densely populated coastal zone of the Baltic Sea, for example, a high daily discharge of 4.9 fibres/L and 8.6 particles/L (>20 µm) to the water environment can be expected from one waste water treatment plant per day [7].
MP is diverse in size, chemical composition and morphology, however, the most common form of polymers in the marine environment are fibres [8,9]. One of the main characteristics of plastic, which determines its behavior in sea water, is density, which depends on the mixture of chemicals that constitutes each MP particle. In the ocean, polyethylene (PE), polypropylene (PP), polystyrene (PS), polyvinyl chloride (PVC), polyamide (PA), polyethylene terephthalate (PET) and polyvinyl alcohol (PVA) are the most common plastic polymers [10]. The density of the polymer determines the buoyancy of MP particles, their location in the water column and the possibility of interaction with biota [11]. Some of the listed plastics have a density higher than seawater and can begin to sink immediately after entering the ocean, while others will remain in the surface layer. The buoyancy of particles can be altered by biological processes, for example, biofouling, as well as partial degradation, fragmentation and leaching of additives.
Biogeochemical processes may to a large extent affect the physical properties of MP, primarily density and, therefore, buoyancy. Clearly, plastic with a higher density than seawater (for example, PVC) gradually sinks and reaches the bottom. However, less dense plastic, such as PE, is also found in marine sediments. This is possible due to ballasting, which means that biofouling and colonization by organisms of MP particles increase their weight, they acquire negative buoyancy and are retained in the water column when they reach equal density with sea water or sink to the bottom [12,13,14].
The study [15] indicates that the geometrical properties of the particles determine the biofouling time. According to the estimations in the study, fibres have the largest surface area for the given mass and are expected to spend about only 6–8 months in the euphotic zone before sinking due to biofouling, while spheres can remain in the upper layers up to 10–15 years.
A biofilm is formed within a few days, and in the following weeks, algal communities form on the surface of the MP [16]. Plastic can begin to sink in two weeks after it enters sea water, depending on the particle size, chemical composition, shape, roughness and environmental conditions. Study [14] that plastic began to sink within 7 weeks, however, it was shown that, during the submersion, the biofilm disappeared. Defouling can be the result of light limitation, grazing, dissolution of carbonates in acid waters or shredding caused by shear forces. Biofouling also occurs in deeper water but with different algae species and at a slower rate [17].
MP size makes it bioavailable for a wide range of marine organisms, which can ingest microplastics while feeding [10,18,19]. Many living organisms, including valuable commercial fish species, benthic organisms, and zooplankton, ingest MP during feeding, without distinguishing it from prey [9].
Many marine organisms exert limited selectivity between particles and capture anything of appropriate size [20]. If MP particles prevail in water, being comparable in size to natural prey, then for zooplankton there is no way to avoid their ingestion. As for the primary consumers, they may preferentially ingest particles of higher nutritional quality, such as MP carrying nutrient-rich biofilms [21].
In laboratory studies, it was demonstrated that MPs can cross trophic levels through predator-prey interactions: from one trophic level (mesozooplankton) to a higher level (macrozooplankton) [11,22] or from shellfish to crabs [23].
MP uptake by living organisms can lead to negative toxicological and physical effects, however, information on the effect of MP on marine populations in natural environments is still insufficient [24]. The impact of MP ingestion on marine biota probably depends on the particle sizes in relation to the organisms with which they interact. Large MPs (1–5 mm) can pose a threat to the nutrition and digestion of marine organisms [25]. Particles smaller than 20 µm are actively eaten by small invertebrates, however, they are also freely excreted by the digestive system [26].
Excretion of MP by the heterotrophic organisms can also be one of the mechanisms of vertical transport of plastic from the surface layer to deeper waters [27]. Low-density MP can be packed in fecal pellets and sink due to the total density change.
The majority of model studies consider MP within the Lagrangian approach as passive floating tracers which follow the global currents [28]. From these studies we know about the accumulation of plastic debris in five subtropical gyres and global patterns in the MP distribution. Still, Eulerian formulation can also be appropriate due to high known concentrations of MP in some regions.
A recent study, [29] used the NEMO model in Eulerian configuration for the global ocean to assess the three-dimensional distribution of the seven most common plastic types with positive and negative buoyancy. The plastic sources were set along the coastlines proportionately to the total population within 200 km of the sea. The simulations support the accumulation of positively buoyant plastic within the five garbage patches, while no evidence was found for the existence of the sixth gyre in the Barents Sea. MPs with negative buoyancy were transported by bottom currents and accumulated in the deepest layers following the bathymetry. In the experiments considering only neutrally buoyant particles, potentially ubiquitous occurrence of MP was shown. The work also suggests that the sediments can serve as a considerable sink for negatively buoyant MP.
Ref. [30] simulates the transport of several classes of microfibres of different buoyancy originating from wastewater effluent in Adventfjorden (Svalbard archipelago) with a hydrodynamic-drift model (FVCOM-FABM). It was shown that light fibres are retained in the upper layers and can leave the fjord in a short time, while the majority of heavy fibres settle at the bottom and accumulate in the inner fjord and along the northern shore.
However, only a limited number of model simulation studies have focussed on the role of the ecosystem and biogeochemical processes on the fate of MP in the marine environment.
One of these studies is a conceptual model that considers how the biological, physical and chemical mechanisms affect the transportation of macro- and microplastics within the estuary [31]. The processes that determine the position of plastic objects in the water column are described: mixing of salt and fresh water; wind forces, topography changes and the interaction of living organisms with plastic. The authors conclude that there is a lack of data to document the actual effect of biota on the distribution of plastic in the water column and the relative contribution of physical and biological processes to plastic transports.
The implications caused by biofilm growth on the particle surface were addressed by [17]. A theoretical model for simulating the biofouling process of MP was developed to predict how the biofouling would influence the sinking of MP. The model calculates the biofilm formation depending on the time, light limitation and the immersion of the particle at a given density, temperature, salinity and viscosity of sea water. The sinking rate is estimated based on particle size, density, which are affected by biofouling. The results indicate that the vertical movement of MP particles is influenced by biofouling and leads to a maximum concentration at intermediate depths, where the particles oscillate vertically without reaching the bottom. However, this model did not consider the seasonality of the development of phytoplankton communities, the spatial variability of the light attenuation and changes in the duration of daylight.
Ref. [32] combined the of biofouling model used by [17]) with a particle-tracking framework to study the global patterns of sinking of biofouled MP. The study suggests that the smallest fraction of MP (0.1 µm) started sinking within about 1 day after entering the ocean due to its large relative surface area and therefore greater impact of biofilm on its density. The largest particles can stay at the surface for more than 90 days in oligotrophic subtropical gyres. It is suggested, that together with physical processes, biological processes, especially during algal blooms can contribute to the vertical transport of MP.
In a recent study [33] within the CLAIM project (“Cleaning litter by developing & applying innovative methods in European seas”) of the Danish Meteorological Institute, three-dimensional transport dynamics of MP in the Baltic Sea was simulated taking into account biofouling. The MP particles were considered as spheres with a certain mass and density, carried out by currents and wave drift. The growth of biofilm on the MP particles as well as its effects on sedimentation were estimated. Resuspension was, however, not considered. The biofilm growth season was determined by the concentration of available phytoplankton (chl -a). The weathering of macroplastic into smaller fragments was not taken into account. Three size categories of MP were considered: small (5 μm), medium (43 μm) and large (300 μm). The MP were calculated in terms of concentrations, the shores and rivers were taken as sources. The hydrodynamic model considers the advection of passive tracers (MP) together with the average flow, including the effects of wind, currents and waves. Particles heavier than sea water sink and reach the seafloor. Lighter particles float on the surface until biofouling increases their density and they also begin to sink. The concentration of MP in the waters of the river runoff is set constant in time. As a hydrodynamic model, the 3D baroclinic model of the ocean and sea ice HBM is used coupled with the model of tracers’ advection. The results showed that in the absence of biofouling, low-density MP will accumulate on the surface. When biofouling is taken into account the MP reaches neutral buoyancy within 13 days for the medium sized category and within 19 days for the large sized category. The seasonal dynamics of MP under the influence of various processes were established: the biofilm growth from May to October, sedimentation in the summer period and increased mixing in the winter. The highest concentrations were achieved below the surface and near the bottom, the least amount of MP was in the water column.
One of the major problems of the coastal MP pollution is the fate of the MP fibers released from the coast and the wastewater treatment plants. There is a lack of data on how seasonal changes in biota and organic matter affect the spreading of the particles with different density, and to what degree MP particles are settling out from the water column and accumulate in the sediments. The existing models consider MP as particles of certain densities that can be transported with currents and sink with certain vertical velocity. However, how their density changes due to the interaction with biota and organic matter is usually not included.
This study was aimed at explaining the observed distribution of microplastics in the marine environment: why denser plastics can be found in the water column and even float on the surface, while lighter ones are found in sediments.
In this work we first elaborate on a tool allowing to model transformation of MP in connection with biota and organic matter and, secondly, we apply the model to numerically predict the spatial distribution of MP in the water column and sediments after being discharged into the aquatic environment. We have used documented concentrations of MP (fibres) in the treated wastewater from a large WWTP with discharge to the Bekkelaget basin in the Inner Oslofjord (Figure 1) from a previous work [34] as an example in this study.
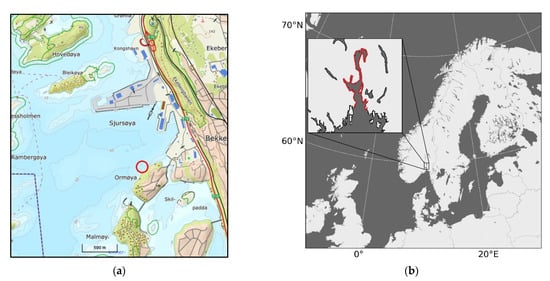
Figure 1.
Location of the Oslofjord on the map (a) and the position of the treatment plant in the Bekkelaget basin of the Oslofjord (b). The discharge point for the Bekkelaget WWTP at 50 m deep is marked by red ring.
2. Methods
2.1. Model Description
This work is based on a combination of 2-Dimensional benthic-pelagic transport model 2DBP, biogeochemical model OxyDep and MP transformation model BioPlast. These modules are integrated into an existing modular platform (Framework for Aquatic Biogeochemical Modeling, FABM; [35]), and is therefore coded as a set of reusable components.
2.1.1. Transport Model
Compared to 3D models, the 2D approach is much less computationally demanding and facilitates implementation of complex biogeochemical models as well as extensive numerical experimentation. Here, we also added several explicitly highly resolved layers in the sediment.
The 2-Dimensional Benthic-Pelagic model (2DBP) simulates vertical and horizontal transport of matter in the water column and upper sediments [36] (Figure 2). The domain of this 2D model is a vertical transect that has grid points in the water column and in the sediments. Vertical grid resolution varies from meters in the water column to several cm in the Bottom Boundary Layer (BBL) and increases from less than 1 mm below the sediment-water interface (SWI) to several cm deeper in the sediments. In the horizontal direction, 2DBP has variable resolution increasing from smaller steps (assumed 25 m in this study) in the area of interest to larger steps (100 m in this study) at the periphery. Processes of horizontal advection, horizontal turbulence, vertical turbulence, sinking of particles and sedimentation (burial) are parameterized in the water column and processes of molecular diffusion, bioturbation and bioirrigation are parameterized in the sediments.
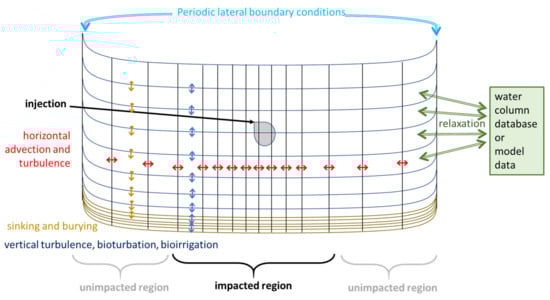
Figure 2.
Scheme of 2dimensional Benthic-Pelagic Model 2DBP.
Since the horizontal coverage of the model is relatively small (10 km), we assume that the horizontal current velocity is constant along the transect but changes with time. For convenience, we impose periodic boundary conditions, i.e., the left boundary of the model domain is linked to the right boundary. Additionally, the water column concentrations may be relaxed (following an approach described in [37]) towards “climate” data from a database or another model, possibly to account for exchange across the transect. This relaxation is also imposed uniformly along the transect length. The processes of vertical transport are described in [38].
The system of equations describing the dynamics of the model state variables is given by:
where u is the horizontal current velocity, wCi is the sinking rate, KL is the horizontal turbulence coefficient, KZ is the vertical turbulence coefficient, τ is a relaxation time, RCi is the biogeochemical sources-minus-sinks term, Ci is the concentration of the ith model state variable and Ci* is the concentration in the array for relaxation (climatic data).
Here, the transport model represents a 5500 m transect through a point of discharge of MP in the center of this transect at the depth of 30 m. 2DBP was forced by model outputs for the seasonal dynamics of temperature, salinity, vertical turbulence, irradiance and current velocity from an application of the hydrodynamical model ROMS [39]). This model domain covers the entire Oslo fjord and is called the FjordOs model [40]. Data are taken from a position in the basin shown in Figure 1 (N 59.873°, E 10.737°). The data from the FjordOs model were given at 42 layers from 0 to 63 m depth, and in 2DBP there were five more layers added in the BBL (with spatial resolution logarithmically increasing above SWI from 3.5 cm to 20 cm) and five more depths in the sediments (with spatial resolution increasing from 1 mm to 20 mm).
2.1.2. Coupled Biogeochemical and Microplastic Models
To parameterize the principal features of seasonal variability of the living organisms and organic matter, that can in some ways affect the MP transformation (i.e., density change) a biogeochemical module is needed. In this work we use a modified model OxyDep [37], a simplified version of Bottom RedOx Model [38], that considers plankton functional groups, dissolved and particulate organic matter, nutrient and dissolved oxygen. OxyDep gives a simple and generalized parameterization of principal biogeochemical processes, occurring in the water column and at the water/bottom interface, with a special emphasize on processes in oxygen-deficient conditions, that can occur in the sediments and in some situations in the bottom water.
OxyDep (Figure 3) describes dynamics of 6 state variables (in N-units):
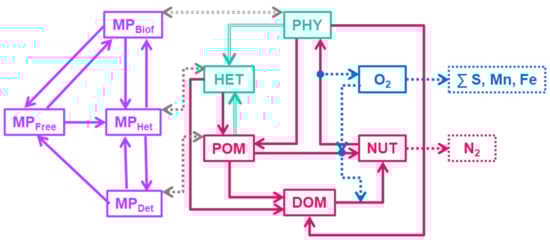
Figure 3.
Flow-chart of the OxyDep model (PHY, HET, POM, DOM, NUT, OXY) and the BioPlast model (, , , )
- PHY—all phototrophic organisms (phytoplankton and bacteria). PHY grows due to photosynthesis, loses inorganic matter due to respiration, and loses organic matter in dissolved (DOM) and particulate (POM) forms due to metabolism and mortality. PHY growth is limited by irradiance, temperature, and NUT availability.
- HET—heterotrophs are able to consume PHY and POM, produce DOM and POM and respirate NUT.
- NUT—represents oxidized forms of nutrients (i.e., NO3 and NO2 for N), that do not need additional oxygen for nitrification.
- DOM—dissolved organic matter. DOM includes all kinds of labile dissolved organic matter and reduced forms of inorganic nutrients i.e., NH4.
- POM—particular organic matter (less labile than DOM). Temperature affects DOM and POM mineralization.
- OXY—dissolved oxygen.
In the BioPlast model, the microplastic variable represents fibres collected from the treated effluent at the Bekkelaget WWTP on a sieve with nominal pore size of 300 µm. The fibres had an average and median length of 1485 µm and 1179 µm, respectively) and the typical fibre weight was 7.8 × 10⁻⁷ mg/item as calculated from the average 3D size and average density of the dominating polymer in each collected fibre (derived from [34]). These synthetic microfibers are initially injected in the modelled domain without biofilm to be then further exposed to biofouling. At this stage any degradation is neglected. When reaching some significant concentration, it can be ingested by zooplankton and then move to the detritus form through the egestion or sequestered in dead zooplankton.
BioPlast describes dynamics of 4 state variables (mg/m3):
- —free MP particles,
- —particles with biofouling,
- —MP ingested by heterotrophs,
- —MP in detritus.
When possible, we use in OxyDep and BioPlast models first-order kinetics for the processes rates parameterization and standard modeling approaches (i.e., for dependence on temperature). Consumption of substrate by living organisms is parameterized with non-linear squared saturation (sigmoid) functions that use concentration of substrate or availability of substrate, i.e., ratio between substrate and its consumer’s concentrations (Figure 4).
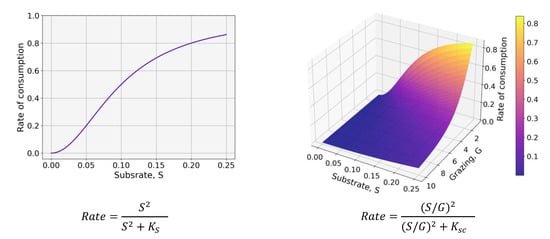
Figure 4.
Dependences of rate of consumption on concentration of Substrate S (left) and availability of substrate as ratio between substrate and Grazer, G (right).
OxyDep and BioPlast parametrizations are provided in Supplementary Materials.
2.2. Initialization
Boundary Conditions
At the upper boundary, the surface fluxes of the modelled chemical constituents were assumed to be zero, except for OXY.
OXY exchange was given by an equation:
where is the wind coefficient, is the concentration of oxygen saturation as a function of temperature t, according to (Neumann et al. 2002). Simulations were carried out based on a mean wind speed of 2 m s−1.
At the lower boundary of 5 cm below the sediment-water interface, a constant concentration of DOM = 3500 µM was prescribed.
To represent turbulent mixing along the transect, we assumed a horizontal diffusion coefficient KL = 0.05 m2/s, based on evaluating the empirical formula from [41] at the 25 m horizontal scale. To represent turbulent mixing perpendicular to the transect, we assumed a constant relaxation time τ = 10,000 s (0.11 d). This latter is consistent with the assumption that KL = 0.05 m2/s also in the perpendicular direction, assuming a cross-transect thickness L = 25 m (τ~L2/KL). Water column relaxation was applied only to the NUT, OXY and MP free, with surrounding concentrations based on the observational climatological data or set to zero in the case of . Relaxation was neglected for living biomass and organic matter variables based on the assumption that the concentration in the surrounding water would be close to that within the transect. As a climatological dataset, we used the monthly data for nutrients and oxygen concentrations in Oslo Fjord, Norway that were extracted from WOA18 database [42] and interpolated to obtain daily values. Furthermore, a rolling mean with 7 days window was used to smooth the data series. These data were used as relaxation database to account for exchange across the computational transect.
Injection of MP:
According to observations, daily supply of microplastic particles with size from 300 µm to 5 mm in Oslofjord is estimated as particles/day (mainly fibers) or 0.05–0.2 mg/day during dry weather and particles/day or mg/day during days with rainfall [34].
Given the wastewater discharge we can estimate the number of microfibers the discharge contains: .
Using these calculations, we assumed the discharge rate of MP is approximately 0.001 mg/s. In the model all MP state variables were calculated in mg/m3.
The release of MP was set from model day 366 to day 2191 (5 years) at a rate of mg/sec.
3. Results and Discussion
3.1. Biogeochemical Dynamics
At the first stage, we validated 2DBP+OxyDep model against the available data. The model was spun up from vertically homogeneous initial conditions for 50 model years with repeated year forcing and boundary conditions. After this time, a quasi-stationary solution with seasonally forced oscillations of the biogeochemical variables had been reached (Figure 5) that was compared with the existing observational data. The model parameters were “tuned” during running multiple spin-ups to let the model reproduce the spatial and temporal dynamics of simulated variables close to the observed dynamics (Figure 5 and Figure 6).
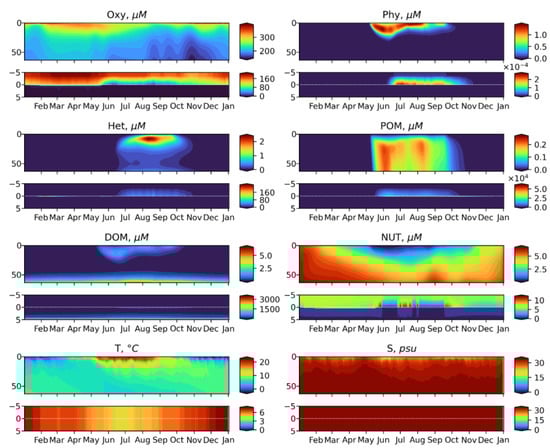
Figure 5.
Simulated seasonal dynamics of the OxyDep state variabiles in the water column from the surface to 60 m (upper panels) and at the sediment water interface (SWI) from 5 cm in the sediments to 5 cm above the sediments (lower panels): Phy, Het, DOM, POM, NUT, Oxy, shown together with Temperature and Salinity dynamics prescribed from ROMS.
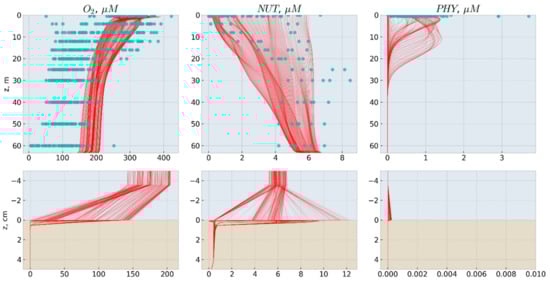
Figure 6.
Modelled seasonal changes of the vertical distributions of dissolved oxygen (O2, µM), nitrate and nitrite (NUT, µM N), and phytoplankton (PHY, µM N) shown as red lines and results of observations from WOA18 database [42] shown as blue circles. The top row—water column, the bottom row—bottom layer and sediments.
As shown in Figure 5 and Figure 6, the simplified OxyDep model plausibly reproduces seasonal biogeochemical dynamics in the Oslo Fjord. The phytoplankton blooming in May-September gradually depletes inorganic oxidized nitrogen down to 20 m. During May-July, the produced organic matter mostly sediments out from the water column as POM and accumulates at the water-sediments interface, where it decomposes consuming oxygen. In July-August, the produced organic matter is grazed by zooplankton as both the live phytoplankton Phy and POM. Seasonal cycle is closed by the winter convective mixing combined with substantial seasonal reduction of insolation.
The simulated ranges of changes of dissolved oxygen, nitrate and nitrite, and phytoplankton correspond to the available observations data (Figure 6). Concentration of modeled PHY of 1 µM N corresponds to 3.78 µg Chl-a/l. The modeled HET maximum of 2 µM N would correspond to 2800 mg WW/m3, assuming a nitrogen content of 1% of the wet weight zooplankton biomass [43].
The model predicts seasonal changes in the oxygen penetration depth in the sediments, that can be observed in different parts of the Oslo Fjord, some of which (i.e., Bunnesfjord) are seasonally anoxic.
3.2. Microplastics Dynamics
At the first stage we calculated fate of the MP of neutral buoyancy (zero vertical velocity) without any degradation released at the depth 30 m for 5 years from the model date 1 January 2018 to 31 December 2022 (Figure 7). The goal was to demonstrate that the modeled MP transformations are conservative.
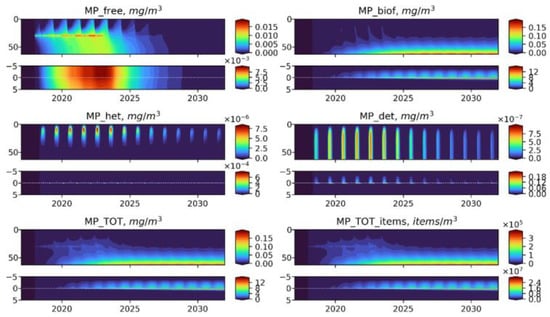
Figure 7.
Long-term dynamics of BioPlast state variables and total MP in mg/m3 and items/m3 with neutral buoyancy (w = 0 m/day) for 15 years (2017–2032) with the MPfree discharge at 30 m depth in 2018–2022. Upper panels show the profiles variability for virgin MP (), biofouled MP (), MP ingested by heterotrophs (), MP in detritus (), total mass concentrations of MP () and total abundance of MP () in the water column (0–60 m) and lower panels show the sediment water interface (5 cm in the sediments to 5 cm above).
Seasonal dynamics are observed for all groups of MP variables both in the water column and in bottom sediments. An increase in and at the discharge point depth in 2018–2022 was followed by a period of stabilization. Significantly, free MP of neutral buoyancy in the cold season are evenly distributed throughout the entire water column. The great bulk of MP is subject to biofouling during the summer blooms of Phy and eventually is transferred to the bottom layer and buried in the sediments. A relatively small part of free and biofouled MP is consumed by zooplankton and egested with detritus, however, rather high concentrations of are formed at the bottom.
Furthermore, the model runs with MP of positive and negative buoyancy were carried out. The results of simulations are shown on the Figure 8 and Figure 9.
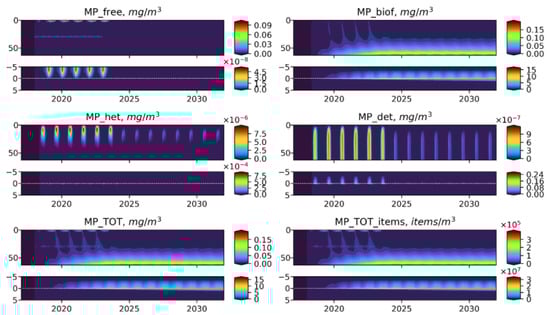
Figure 8.
Long-term dynamics of BioPlast state variables and total MP in mg/m3 and items/m3 with positive buoyancy (w = −0.5 m/d) for 15 years (2017–2032) with the discharge at 30 m depth in 2018–2022. Upper panels show the profiles variability for virgin MP (), biofouled MP (), MP ingested by heterotrophs (), MP in detritus (), total mass concentrations of MP () and total abundance of MP () in the water column (0–60 m) and lower panels show the sediment water interface (5 cm in the sediments to 5 cm above).
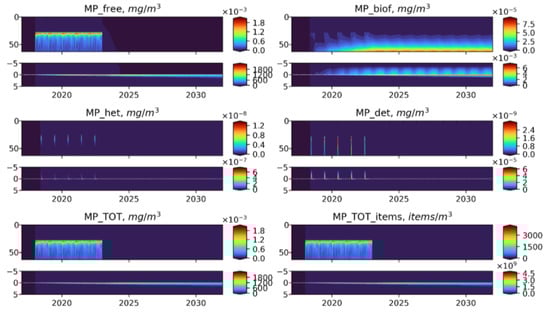
Figure 9.
Long-term dynamics of BioPlast state variables and total MP in mg/m3 and items/m3 with negative buoyancy (w = 20 m/d) for 15 years (2017–2032) with the discharge at 30 m depth in 2018–2022. Upper panels show the profiles variability for virgin MP (), biofouled MP (), MP ingested by heterotrophs (), MP in detritus (), total mass concentrations of MP () and total abundance of MP () in the water column (0–60 m) and lower panels show the sediment water interface (5 cm in the sediments to 5 cm above).
As one would expect, the free MP particles of positive buoyancy are concentrated in the near-surface zone (Figure 8), but their further fate is similar to neutrally buoyant MPs, while the negatively buoyant MP immediately begins to sink (Figure 9). Sinking particles quickly leave the photic zone, which prevents its biofouling and makes them inaccessible for ingestion by heterotrophic organisms. These MPs accumulate at the bottom and are buried in the sediments without any biofilm. The amount of microplastic at the bottom in the biofouled form is three orders of magnitude less than in virgin form.
The modeled here weight concentration and abundance of MPs in the upper layers of water, bottom water and the sediments can be compared with the observations data (Table 1).

Table 1.
Comparison of the modeled total MP and observed estimates of subsurface MP abundance.
The modelling results were comparable within an order of magnitude with field observations in the Arctic region and adjacent areas. However, only a few works contain data on weight concentration of MP in the water column [48,49].
Simulated seasonal changes of MP state variables during the period of discharge of MP with different buoyancy are shown on the Figure 10, Figure 11, Figure 12.
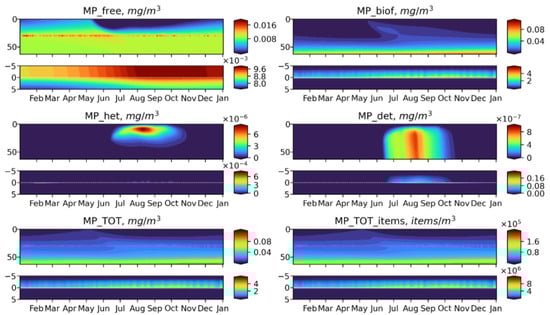
Figure 10.
Seasonal dynamics of BioPlast state variables and total MP in mg/m3 and items/m3 during the 6th model year (2022) with neutral buoyancy (w = 0 m/d) MP discharge at 30 m depth for 5 years (2018–2022). Upper panels show the profiles variability for virgin MP (), biofouled MP (), MP ingested by heterotrophs (), MP in detritus (), total mass concentrations of MP () and total abundance of MP () in the water column (0–60 m) and lower panels show the sediment water interface (5 cm in the sediments to 5 cm above).
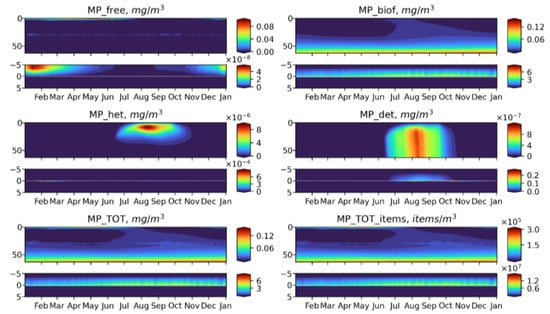
Figure 11.
Seasonal dynamics of BioPlast state variables and total MP in mg/m3 and items/m3 during the 6th model year (2022) with positive buoyancy (w = −0.5 m/d). MP discharge at 30 m depth for 5 years (2018–2022). Upper panels show the profiles variability for virgin MP (), biofouled MP (), MP ingested by heterotrophs (), MP in detritus (), total mass concentrations of MP () and total abundance of MP () in the water column (0–60 m) and lower panels show the sediment water interface (5 cm in the sediments to 5 cm above).
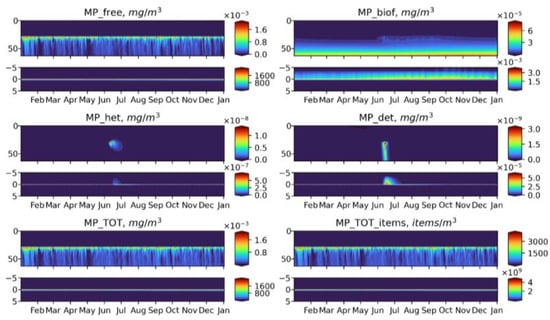
Figure 12.
Seasonal dynamics of BioPlast state variables and total MP in mg/m3 and items/m3 during the 6th model year (2022) with negative buoyancy (w = 20 m/d). MP discharge at 30 m depth for 5 years (2018–2022). Upper panels show the profiles variability for virgin MP (), biofouled MP (), MP ingested by heterotrophs (), MP in detritus (), total mass concentrations of MP () and total abundance of MP () in the water column (0–60 m) and lower panels show the sediment water interface (5 cm in the sediments to 5 cm above).
Neutrally buoyant MPs are distributed over the entire water column, reaching the maximum concentration at the discharge point. Such a uniform distribution can be explained by the fact that the model does not adequately reproduce the effect of stratification. This is further discussed in the Model Limitations section. In a summer, MP is exposed to biofouling in the upper layers and then accumulates in the biofouled form in the bottom layer and on the bottom surface. At the end of the MP discharge period makes up the greatest part of total MP. The similar pattern exhibits floating MP, apart from the fact that its free form concentrates in the surface layer, where it is intensively biofouled during phytoplankton blooms. MP of negative buoyancy tend to behave in a completely different way It starts to sink immediately and quickly reaches the bottom so that the biota does not have time to affect it in the water column at least to some extent, and most of MPs accumulates in the sediments in a virgin form. Only during the bloom period, a small share of the heavy MP can be biofouled or injected in the water column (Figure 12), but its fraction is about six orders of magnitude lower than that of the floating or neutral buoyancy MP.
3.3. Microplastics Fluxes
Long-term dynamics of different forms of MP integrated over the model domain in the numerical experiments for neutrally, positively and negatively buoyant particles demonstrates that the total amount of MP is conservative (Figure 13).
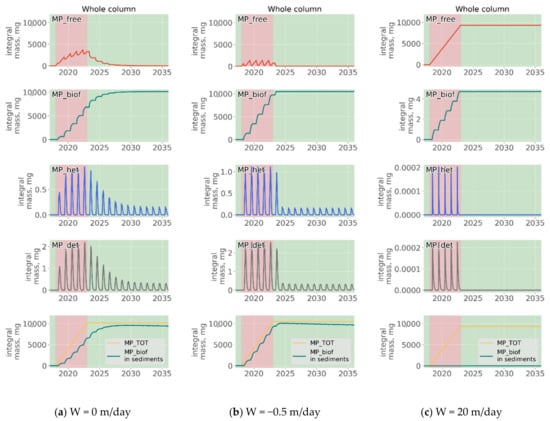
Figure 13.
Long-term development of the MP stocks integrated over the entire model domain during the experiments with discharge of MP of neutral (a), positive (b) and negative (c) buoyancy without any degradation released from the depth 30 m for 5 years starting from the model date 1 January 2018 to 31 December 2022.
From the start of the injection at 2018 total amount of MP gradually increases. At the end of 2022 year total mass of MP in all forms in the whole model domain reaches 10,000 mg and stays stable during the remaining period. Remarkably, the ratio between the content of MP in different forms varies according to buoyancy of its virgin form (). MP of negative buoyancy mainly remain unaffected by biogeochemical processes due to their rapid sinking and leaving the photic zone. In contrast, nearly all mass of floating MP is exposed to biofouling and further transported to sediments. The total mass of MP in Het and detritus is extremally small in all experiments and varies significantly depending on seasonal changes in organic matter production processes. Still, it can be seen that MP content in Het is much greater for positively buoyant particles, since they stay longer in the upper layer being available for ingestion by zooplankton.
3.4. Model Limitations
Some shortcomings in the results are due to a number of assumptions that were made in the model. In the presented model, only fibers of a certain size are considered, their structure, porosity, etc. are not taken into account, although in nature the composition of microplastics is extremely diverse in shape and size. However, such properties determine the effect of biofouling on buoyancy and, as a result, the residence time of the particles. Photo-, bio- and mechanical degradation of fibers are also ignored, which are negligible at the considered time interval due to its extremely slow degradation rates. In real conditions, all particles in different forms have different rates of sinking and ascent due to their density, shape and degree of biofouling. At this stage, to simplify the interpretation of the results, we set constant vertical velocities for the main MP variables. Finally, we assume that the rate of biofouling Equation (S26) in Supplementary Materials is proportional to the growth rate of phytoplankton Equations (S3)–(S6) in Supplementary Materials. In general, the primary biofilm is usually organic matter and biopolymers and is formed very quickly (several days to several weeks) depending on the surface properties of the particle. Subsequently, typical biofilm-forming bacteria or other colonizers attach and form microorganism’s community. This may occur far below the photic zone, and these processes are not reproduced in present model.
With this numerical experimental setup and initial conditions, we did not consider the effect of stratification on the distribution of MPs. However, studies show (Choy et al. 2020) that stratification can significantly affect the distribution and residence time of MPs in the water column and thus its bioavailability. Biogeochemical processes are considered here, as the main drivers of vertical transport in the water column. But, under natural conditions, these processes can lead to vertical movement of particles only to a certain layer, and not to the bottom, and contribute to the accumulation of some fraction of MP in the water column. Despite this, we believe that the model, within its limits, qualitatively reproduces the main phenomena that determine the vertical transport of microplastics, its seasonal dynamics and MP components fluxes. At this stage, it is complicated to quantitatively reproduce the fluxes from one group of MP to another, since there is insufficient data on the rate of such fluxes and their wide variety. These processes was studied by examining the components of total microplastics individually and in interaction with the ecosystem. The model describes the credible pathways for microfibres transport through biofouling in the summer period and their slow sinking, some of which can be ingested by zooplankton and get into detritus.
3.5. Influence of the Depth of the Discharge Point
Figure 14 summarizes the model findings for the MPs particles initially released as the floating, neutral and sinking ones. We show the seasonal variability of (that corresponds to MP detected during the observations) in the case of release at 30 m depth (left column), discussed above and at 3 m depth. Change of the release point from 30 m to 3 m doesn’t affect qualitatively the features of seasonal variability of the floating and neutral MPs, but for the denser MPs the differences arise. In case of a release at 30 m (below the pycnocline), heavy MP sinks down rapidly and cannot be captured and significantly slowed by biota and organic matter, but in case of a release at 3 m depth it can be partially trapped in the surface layer during the production period that can be explained by density decrease of the sinking MP and by intensive turbulence in the upper mixed layer. That account for numerous observations of high dense MPs in a water column during the field studies [44]. For the floating MPs, the shift of the discharge from below the pycnocline to the upper mixed layer led to a less pronounced effect of the summer “purification” of the surface layer from MPs, and the same held true for the neutrally buoyant MPs.
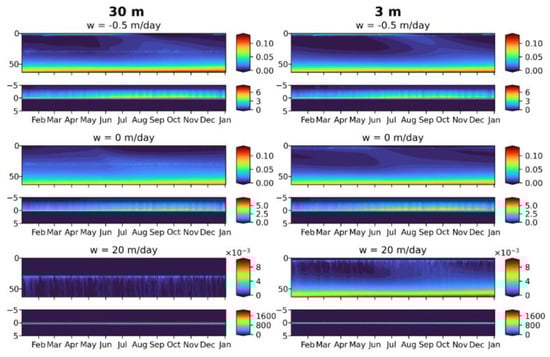
Figure 14.
Seasonal variability of the total microplastics () in case of release at 30 m depth (left column) and 3 m depth (right column) for floating MP (upper row), neutral MP (middle row) and sinking MP (bottom row).
4. Conclusions
In this study, a model approach was used to describe the seasonal processes of transfer and transformation of microplastics at a qualitative level. An assemblage of the OxyDep, 2DBP and BioPlast models was applied for simulation of the fate of microplastic particles with differing sinking rates; the differences were determined by the biogeochemical processes of synthesis and decay of organic matter, ingestion and excretion by zooplankton and transports with detritus. As confirmed by numerical experiments:
- Biogeochemical cycling leads to seasonality in the vertical and horizontal transporting of MP of neutral buoyancy from its source, with higher accumulation in the sediment during the summer-autumn period, while cleaning of the upper water layers resembles the winter period. That means that MP of neutral buoyancy could be transported to a smaller distance in summer, compared with winter.
- Biogeochemical processes are responsible for transports of light density floating MP into the deep layers and the sediments.
- High density MPs are affected by the biogeochemical processes to a very small degree and tend to accumulate in the sediments close to the source point.
Thus, we confirm that the “biological pump” can be one of the important drivers controlling the quantity and the distribution of MP in the water column. The biological pump can deplete MP from the surface water and accelerate MP burying in summer period compared to the winter. The key mechanisms were reproduced, however, for a more accurate description of these processes, a larger amount of experimental and observational data is required to parameterize the interactions of biota with microplastics.
Supplementary Materials
The following are available online at https://www.mdpi.com/article/10.3390/w13192690/s1, The code is available online at https://github.com/BottomRedoxModel/ (git tag v0.2).
Author Contributions
Conceptualization, A.B., E.Y.; methodology, A.B., E.Y.; software, A.B., E.Y.; validation, A.B., E.Y.; visualization, A.B.; resources, C.V., A.S.; writing—original draft preparation, A.B., E.Y., O.S.; writing—review and editing, All. All authors have read and agreed to the published version of the manuscript.
Funding
The reported study was funded by Russian Foundation for Basic Research according to the research projects 19-55-80004 20-35-90056. This work was funded by the Norwegian Ministry of Climate and Environment project RUS-19/0001 “Establish regional capacity to measure and model the distribution and input of microplastics to the Barents Sea from rivers and currents (ESCIMO)” and “Model-based mapping of marine litter and microplastic in the Barents Sea (MAMBA)”; the Ministry of Science and Higher Education of Russia, theme 0128-2021-0001; E.Y. was supported by Russian Science Foundation Grant 21-77-30001; O.A. was supported by the Swedish Agency for Marine and Water Management through their grant 1:11—Measures for the marine and water environment.
Conflicts of Interest
The authors declare no conflict of interest.
References
- Kershaw, P.J. Marine Plastic Debris and Microplastics: Global Lessons and Research to Inspire Action and Guide Policy Change; UNEP: Nairobi, Kenya, 2016; p. 192. [Google Scholar]
- Ross, N.L. The ‘Plasticene’ Epoch? Elements 2018, 14, 291. [Google Scholar] [CrossRef] [Green Version]
- GESAMP. Guidelines for the Monitoring and Assessment of Plastic Litter in the Ocean. Kershaw, P.J., Turra, A., Galgani, F., Eds.; GESAMP: London, UK, 2019. [Google Scholar]
- Horton, A.A.; Dixon, S.J. Microplastics: An introduction to environmental transport processes. Wiley Interdiscip. Rev. Water 2018, 5, e1268. [Google Scholar] [CrossRef] [Green Version]
- Jambeck, J.R.; Ji, Q.; Zhang, Y.-G.; Liu, D.; Grossnickle, D.M.; Luo, Z.-X. Plastic waste inputs from land into the ocean. Science 2015, 347, 764–768. [Google Scholar] [CrossRef]
- Lusher, A.L.; Hurley, R.R.; Vogelsang, C. Microplastics in sewage sludge: Captured but released? In Microplastics in Water and Wastewater; IWA Publishing: London, UK, 2017; pp. 85–100. [Google Scholar]
- Talvitie, J.; Heinonen, M.; Pääkkönen, J.P.; Vahtera, E.; Mikola, A.; Setälä, O.; Vahala, R. Do wastewater treatment plants act as a potential point source of microplastics? Preliminary study in the coastal Gulf of Finland, Baltic Sea. Water Sci. Technol. 2015, 72, 1495–1504. [Google Scholar] [CrossRef] [PubMed]
- Bagaev, A.; Mizyuk, A.; Khatmullina, L.; Isachenko, I.; Chubarenko, I. Anthropogenic fibres in the Baltic Sea water column: Field data, laboratory and numerical testing of their motion. Sci. Total Environ. 2017, 599-600, 560–571. [Google Scholar] [CrossRef] [PubMed]
- Lusher, A. Microplastics in the Marine Environment: Distribution, Interactions and Effects. In Marine Anthropogenic Litter; Springer International Publishing: Cham, Switzerland, 2015; pp. 245–307. [Google Scholar] [CrossRef] [Green Version]
- Avio, C.G.; Gorbi, S.; Regoli, F. Plastics and microplastics in the oceans: From emerging pollutants to emerged threat. Mar. Environ. Res. 2017, 128, 2–11. [Google Scholar] [CrossRef] [PubMed]
- Wright, S.L.; Thompson, R.C.; Galloway, T.S. The physical impacts of microplastics on marine organisms: A review. Environ. Pollut. 2013, 178, 483–492. [Google Scholar] [CrossRef] [PubMed]
- Kaiser, D.; Kowalski, N.; Waniek, J.J. Effects of biofouling on the sinking behavior of microplastics. Environ. Res. Lett. 2017, 12, 124003. [Google Scholar] [CrossRef] [Green Version]
- Lobelle, D.; Cunliffe, M. Early microbial biofilm formation on marine plastic debris. Mar. Pollut. Bull. 2011, 62, 197–200. [Google Scholar] [CrossRef]
- Ye, S.; Andrady, A.L. Fouling of floating plastic debris under Biscayne Bay exposure conditions. Mar. Pollut. Bull. 1991, 22, 608–613. [Google Scholar] [CrossRef]
- Chubarenko, I.; Bagaev, A.; Zobkov, M.; Esiukova, E. On some physical and dynamical properties of microplastic particles in marine environment. Mar. Pollut. Bull. 2016, 108, 105–112. [Google Scholar] [CrossRef]
- Fazey, F.M.C.; Ryan, P.G. Biofouling on buoyant marine plastics: An experimental study into the effect of size on surface longevity. Environ. Pollut. 2016, 210, 354–360. [Google Scholar] [CrossRef]
- Kooi, M.; Van Nes, E.H.; Scheffer, M.; Koelmans, A.A. Ups and Downs in the Ocean: Effects of Biofouling on Vertical Transport of Microplastics. Environ. Sci. Technol. 2017, 51, 7963–7971. [Google Scholar] [CrossRef] [Green Version]
- Courtene-Jones, W.; Quinn, B.; Gary, S.F.; Mogg, A.O.M.; Narayanaswamy, B.E. Microplastic pollution identified in deep-sea water and ingested by benthic invertebrates in the Rockall Trough, North Atlantic Ocean. Environ. Pollut. 2017, 231, 271–280. [Google Scholar] [CrossRef] [Green Version]
- Beur, L.L.; Henry, L.A.; Kazanidis, G.; Hennige, S. Baseline assessment of marine litter and microplastic ingestion by cold-water coral reef benthos at the east mingulay marine protected area (Sea of the Hebrides, western Scotland). Front. Mar. Sci. 2019, 6, 1–13. [Google Scholar] [CrossRef]
- Moore, C.J. Synthetic polymers in the marine environment: A rapidly increasing, long-term threat. Environ. Res. 2008, 108, 131–139. [Google Scholar] [CrossRef] [PubMed]
- Rummel, C.D.; Jahnke, A.; Gorokhova, E.; Kühnel, D.; Schmitt-Jansen, M. Impacts of biofilm formation on the fate and potential effects of microplastic in the aquatic environment, Environ. Sci. Technol. Lett. 2017, 4, 258–267. [Google Scholar] [CrossRef] [Green Version]
- Setälä, O.; Fleming-Lehtinen, V.; Lehtiniemi, M. Ingestion and transfer of microplastics in the planktonic food web. Environ. Pollut. 2014, 185, 77–83. [Google Scholar] [CrossRef] [PubMed]
- Watts, A.J.R.; Lewis, C.; Goodhead, R.M.; Beckett, S.J.; Moger, J.; Tyler, C.R.; Galloway, T.S. Uptake and retention of microplastics by the shore crab carcinus maenas. Environ. Sci. Technol. 2014, 48, 8823–8830. [Google Scholar] [CrossRef]
- Botterell, Z.L.R.; Beaumont, N.; Dorrington, T.; Steinke, M.; Thompson, R.C.; Lindeque, P.K. Bioavailability and effects of microplastics on marine zooplankton: A review. Environ. Pollut. 2019, 245, 98–110. [Google Scholar] [CrossRef] [PubMed]
- Codina-García, M.; Militão, T.; Moreno, J.; González-Solís, J. Plastic debris in Mediterranean seabirds. Mar. Pollut. Bull. 2013, 77, 220–226. [Google Scholar] [CrossRef] [PubMed]
- Lee, K.W.; Shim, W.J.; Kwon, O.Y.; Kang, J.H. Size-dependent effects of micro polystyrene particles in the marine copepod tigriopus japonicus. Environ. Sci. Technol. 2013, 47, 11278–11283. [Google Scholar] [CrossRef] [PubMed]
- Cole, M.; Lindeque, P.K.; Fileman, E.; Clark, J.; Lewis, C.; Halsband, C.; Galloway, T.S. Microplastics alter the properties and sinking rates of zooplankton faecal pellets. Environ. Sci. Technol. 2016, 50, 3239–3246. [Google Scholar] [CrossRef] [PubMed] [Green Version]
- Lebreton, L.C.M.; Greer, S.D.; Borrero, J.C. Numerical modelling of floating debris in the world’s oceans. Mar. Pollut. Bull. 2012, 64, 653–661. [Google Scholar] [CrossRef] [PubMed]
- Mountford, A.S.; Morales Maqueda, M.A. Eulerian Modeling of the Three-Dimensional Distribution of Seven Popular Microplastic Types in the Global Ocean. J. Geophys. Res. Ocean. 2019, 124, 8558–8573. [Google Scholar] [CrossRef]
- Herzke, D.; Ghaffari, P.; Sundet, J.H.; Tranang, C.A.; Halsband, C. Microplastic fiber emissions from wastewater effluents: Abundance, transport behavior and exposure risk for biota in an arctic fjord. Front. Environ. Sci. 2021, 9, 1–14. [Google Scholar] [CrossRef]
- Vermeiren, P.; Muñoz, C.C.; Ikejima, K. Sources and sinks of plastic debris in estuaries: A conceptual model integrating biological, physical and chemical distribution mechanisms. Mar. Pollut. Bull. 2016, 113, 7–16. [Google Scholar] [CrossRef]
- Lobelle, D.; Kooi, M.; Koelmans, A.A.; Laufkötter, C.; Jongedijk, C.E.; Kehl, C.; van Sebille, E. Global modeled sinking characteristics of biofouled microplastic. J. Geophys. Res. Ocean. 2021, 126, e2020JC017098. [Google Scholar] [CrossRef]
- Murawski, J.; She, J. Fate and dynamic of marine microplastics in the baltic sea CLAIM: Project overview H2020 Innovation Action. In Proceedings of the 22nd EGU General Assembly, Online, 4–8 May 2020; pp. 1–22. [Google Scholar] [CrossRef]
- Vogelsang, C.P.S.; Singdahl-Larsen, C.; Kristiansen, T.; Staalstrøm, A.; Buenaventura, N.T.; Latcheman, D. Microplastic particles in to and out from Bekkelaget wastewater treatment plant over a year; NIVA Report 7541-2020: Oslo, Norwey, 2020. [Google Scholar]
- Bruggeman, J.; Bolding, K. A general framework for aquatic biogeochemical models. Environ. Model. Softw. 2014, 61, 249–265. [Google Scholar] [CrossRef] [Green Version]
- Yakushev, E.V.; Wallhead, P.; Renaud, P.E.; Ilinskaya, A.; Protsenko, E.; Yakubov, S.; Pakhomova, S.; Sweetman, A.K.; Dunlop, K.; Berezina, A.; et al. Understanding the biogeochemical impacts of fish farms using a benthic-pelagic model. Water 2020, 12, 2384. [Google Scholar] [CrossRef]
- Yakushev, E.V.V.; Kuznetsov, I.S.S.; Podymov, O.I.I.; Burchard, H.; Neumann, T.; Pollehne, F. Modeling the influence of oxygenated inflows on the biogeochemical structure of the Gotland Sea, central Baltic Sea: Changes in the distribution of manganese. Comput. Geosci. 2011, 37, 398–409. [Google Scholar] [CrossRef]
- Yakushev, E.V.; Protsenko, E.A.; Bruggeman, J.; Wallhead, P.; Pakhomova, S.V.; Yakubov, S.K.; Bellerby, R.G.J.; Couture, R.-M. Bottom RedOx Model (BROM v1.1): A coupled benthic–pelagic model for simulation of water and sediment biogeochemistry. Geosci. Model Dev. 2017, 10, 453–482. [Google Scholar] [CrossRef] [Green Version]
- Haidvogel, D.B.H.; Arango, P.W.; Budgell, B.D.; Cornuelle, E.; Curchitser, E.D.; Lorenzo, K.; Fennel, W.R.; Geyer, A.J.; Hermann, L.; Lanerolle, J.; et al. Ocean forecasting in terrain-following coordinates: Formulation and skill assessment of the Regional Ocean Modeling System. J. Comput. Phys. 2008, 227, 3595–3624. [Google Scholar] [CrossRef]
- Staalstrøm, A.; Røed, L.P. Vertical mixing and internal wave energy fluxes in a sill fjord. J. Mar. Syst. 2016, 159, 15–32. [Google Scholar] [CrossRef] [Green Version]
- Okubo, A. Remarks on the use of “diffusion diagrams” in modeling scale-dependent diffusion. Deep. Res. Oceanogr. Abstr. 1976, 23, 1213–1214. [Google Scholar] [CrossRef]
- Hernan, E.G.; Katharine, W.W.; Christopher, R.P.; Igor, S.; Timothy, P.B.; Ricardo, A.L.; Melissa, M.Z.; Alexey, V.M.; Olga, K.B.; Dan, S. World Ocean Atlas 2018. Vol. 4: Dissolved Inorganic Nutrients (Phosphate, Nitrate and Nitrate+Nitrite, Silicate); National Centers for Environmental Information (NCEI): Silver Spring, MD, USA, 2019. [Google Scholar]
- Menden-Deuer, S.; Lessard, E.J. Carbon to volume relationships for dinoflagellates, diatoms, and other protist plankton. Limnol. Oceanogr. 2000, 45, 569–579. [Google Scholar] [CrossRef] [Green Version]
- Yakushev, E.; Gebruk, A.; Osadchiev, A.; Pakhomova, S.; Lusher, A.; Berezina, A.; van Bavel, B.; Vorozheikina, E.; Chernykh, D.; Kolbasova, G.; et al. Microplastics distribution in the Eurasian Arctic is affected by Atlantic waters and Siberian rivers. Commun. Earth Environ. 2021, 2, 1–11. [Google Scholar] [CrossRef]
- Lusher, A.L.; Tirelli, V.; O’Connor, I.; Officer, R. Microplastics in Arctic polar waters: The first reported values of particles in surface and sub-surface samples. Sci. Rep. 2015, 5, 1–9. [Google Scholar] [CrossRef] [Green Version]
- Lönnstedt, O.M.; Eklöv, P. Environmentally relevant concentrations of microplastic particles influence larval fish ecology. Science 2016, 352, 1213–1216. [Google Scholar] [CrossRef]
- Uddin, S.; Fowler, S.W.; Uddin, M.F.; Behbehani, M.; Naji, A. A review of microplastic distribution in sediment profiles. Mar. Pollut. Bull. 2021, 163, 111973. [Google Scholar] [CrossRef]
- Zobkov, M.B.; Esiukova, E.E.; Zyubin, A.Y.; Samusev, I.G. Microplastic content variation in water column: The observations employing a novel sampling tool in stratified Baltic Sea. Mar. Pollut. Bull. 2019, 138, 193–205. [Google Scholar] [CrossRef] [PubMed]
- Uurasjärvi, E.; Pääkkönen, M.; Setälä, O.; Koistinen, A.; Lehtiniemi, M. Microplastics accumulate to thin layers in the stratified Baltic Sea. Environ. Pollut. 2021, 268, 115700. [Google Scholar] [CrossRef] [PubMed]
Publisher’s Note: MDPI stays neutral with regard to jurisdictional claims in published maps and institutional affiliations. |
© 2021 by the authors. Licensee MDPI, Basel, Switzerland. This article is an open access article distributed under the terms and conditions of the Creative Commons Attribution (CC BY) license (https://creativecommons.org/licenses/by/4.0/).