Article

Estimating the Leaf Water Status and Grain Yield of Wheat under Different Irrigation Regimes Using Optimized Two- and Three-Band Hyperspectral Indices and Multivariate Regression Models

1
Agricultural Engineering, Evaluation of Natural Resources Department, Environmental Studies and Research Institute, University of Sadat City, Minufiya 32897, Egypt
2
Department of Plant Production, College of Food and Agriculture Sciences, King Saud University, KSA, P.O. Box 2460, Riyadh 11451, Saudi Arabia
3
Department of Agronomy, Faculty of Agriculture, Suez Canal University, Ismailia 41522, Egypt
4
Chair of Plant Nutrition, Department of Plant Sciences, Technical University of Munich, Emil-Ramann-Str. 2, D-85350 Freising-Weihenstephan, Germany
5
Sustainable Development of Environment and Its Projects Management Department, Environmental Studies and Research Institute, University of Sadat City, Minufiya 32897, Egypt
6
Agricultural Engineering Department, Faculty of Agriculture, Mansoura University, Mansoura 35516, Egypt
7
Agricultural Engineering, Surveying of Natural Resources in Environmental Systems Department, Environmental Studies and Research Institute, University of Sadat City, Minufiya 32897, Egypt
*
Author to whom correspondence should be addressed.
Water 2021, 13(19), 2666; https://doi.org/10.3390/w13192666
Submission received: 12 July 2021 / Revised: 21 September 2021 / Accepted: 22 September 2021 / Published: 27 September 2021
(This article belongs to the Special Issue Applications of Remote Sensing in Agricultural Water Management)

Abstract

:
Spectral reflectance indices (SRIs) often show inconsistency in estimating plant traits across different growth conditions; thus, it is still necessary to develop further optimized SRIs to guarantee the performance of SRIs as a simple and rapid approach to accurately estimate plant traits. The primary goal of this study was to develop optimized two- and three-band vegetation- and water-SRIs and to apply different multivariate regression models based on these SRIs for accurately estimating the relative water content (RWC), gravimetric water content (GWCF), and grain yield (GY) of two wheat cultivars evaluated under three irrigation regimes (100%, 75%, and 50% of crop evapotranspiration (ETc)) for two seasons. Results showed that the three plant traits and all SRIs showed significant differences (p < 0.05) between the three irrigation treatments for each wheat cultivar. The three-band water-SRIs (NWIs-3b) showed the best performance in estimating the three plant traits for both cultivars (R2 > 0.80), and RWC and GWCF under 75% ETc (R2 ≥ 0.65). Four out of six three-band vegetation-SRIs (NDVIs-3b) performed better than any other SRIs for estimating GY under 100% ETc and 50% ETC, and RWC under 100% ETc (R2 ≥ 0.60). All types of SRIs demonstrated excellent performance in estimating the three plant traits (R2 ≥ 0.70) when the data of all growth conditions were combined and analyzed together. The NWIs-3b coupled with Random Forest models predicted the three plant traits with satisfactory accuracy for the calibration (R2 ≥ 0.96) and validation (R2 ≥ 0.93) datasets. The overall results of this study elucidate that extracting an optimized NWIs-3b from the full spectrum data and combined with an appropriate regression technique could be a practical approach for managing deficit irrigation regimes of crops through accurately, timely, and non-destructively monitoring the water status and final potential yield.

1. Introduction

Wheat is the most important cereal crop worldwide, with a total production of more than 700 million metric tons of grain per year [1]. However, water stress, which is caused by insufficient freshwater supply, is a major destructive environmental stress factor that threatens the sustainability of the world’s wheat production, particularly in arid and semiarid regions. Moreover, the current climate change, which is associated with high evapotranspiration and temperature, and low precipitation simultaneously, further exacerbate the present food and water security situation in these regions [2,3,4]. It also leads to unprecedented competition for freshwater between various water-consuming sectors. Unfortunately, this competition has led to a decrease in the amount of freshwater allocated to the agriculture sector due to its high share of water consumption, which consumes 70–80% of the total freshwater resources in arid and semiarid regions [1]. Therefore, there is an urgent need to apply feasible crop water management strategies that achieve maximum agricultural water productivity (MAWP; a maximum crop yield per unit of irrigation water applied) [5,6]. Shifting the crop irrigation strategies from the paradigm of full irrigation to appropriate deficit irrigation regimes that tend to decrease water loss to minimum levels is one reasonable approach to achieve MAWP. Generally, deficit irrigation practice is the most applicable approach when irrigation water supplies are limited or irrigation costs are high [7,8,9].
When plants are grown under deficit irrigation regimes, this water deficit will act directly on the leaf/plant water status, which is fundamental to several plant functions. Any changes in normal plant functions lead to substantial changes in several morpho-physiological plant characteristics, such as photosynthesis efficiency, chlorophyll content, stomatal behavior, vegetation vigor, dry mass accumulation, and green leaf area [9,10,11,12,13]. Therefore, the accurate estimation and monitoring of different plant water status indicators is crucial to effectively manage deficit irrigation and sustaining crop production under such conditions. Generally, the water status of the plant can be estimated directly through the leaf water potential, gravimetric water content (GWCF), relative water content (RWC), and equivalent water thickness (EWT), or indirectly through analysis of plant growth or physiological responses [14,15]. Although the estimation of the plant water status through different direct and indirect indicators is accurate and reliable, the measurements of these traits using traditional methods of field-based plant sampling are generally time-consuming, destructive, tedious, and inappropriate for tracking the dynamic changes for real-time evaluation of plant water status over a large scale [16,17,18,19]. Therefore, it is imperative to develop tools that enable accurate estimation and monitor plant water status indicators rapidly, non-destructively, and cost-effectively for the precision management of deficit irrigation regimes.
Recently, proximal remote sensing has been regarded as the most promising tool for non-destructively and rapidly assessing plant water status indicators in a timely manner. This tool is based on the variation in spectral signatures of the canopy of the electromagnetic spectrum (400–2500 nm), which is strongly associated with several biophysical and biochemical plant characteristics [20,21,22,23,24]. For instance, the spectral signatures of the canopy in the near-infrared (NIR; 700–1300 nm) region are closely associated with the changes that occur in the canopy water status, because the water bands in this region can penetrate deeper into the canopy, thereby allowing to estimate the water status of plants [10,25,26]. The wavebands within the shortwave-infrared (SWIR; 1300–2500 nm) region are less sensitive to noises caused by the leaf internal structure and therefore the water absorption bands in this region are also effective to detect and monitor the changes that occur in the plant water status [11,27]. The wavelengths in the red-edge region (700–750 nm) contain useful information about above-ground biomass accumulation [28]. Therefore, remote sensing features can be applied to effectively manage deficit irrigation and immediately adopt irrigation measures through tracking the changes that occur in plant traits associated with the plant water status and biomass accumulation.
There are several single spectral bands located in the NIR and SWIR regions, such as 760, 970, 1100, 1200, 1400, 1450, 1600, 1730, 1950, 2100, 2250, and 2500, found to be effective in estimating different plant trait indicators of various crops under varying crop growth conditions [29,30,31,32]. However, the effectiveness of these single wavebands for estimating plant traits is strongly affected by several factors other than the plant water content, such as the crop growth stages, canopy structure, water regime levels, years, crop species, and weather conditions [33,34]. These limitations can be overcome by the establishment of different spectral reflectance indices (SRIs). Each SRI includes 2–3 effective wavelengths from the full spectrum and these wavelengths were found to be effective for tracking changes in plant traits associated with the plant water status.
Previous studies have used the two-band SRIs in estimating several plant traits related to the plant water status, such as the GWCF, RWC, canopy water mass, and EWT [9,11,18,35,36]. The water index (WI), which incorporates two bands at 970 and 900 nm, the normalized water stress index-1 (NWI-1), which incorporates two bands at 970 and 850 nm, and the moisture stress index (MSI), which incorporates two bands at 1600 and 820 nm, are examples of SRIs that are effective to indirectly estimate plant traits related to the plant water status as well as crop production for various crops grown under different environmental conditions [16,26]. Interestingly, the photochemical reflectance index (PRI) and normalized difference vegetation index (NDVI) showed also a significant relationship with different plant water status indicators, although the former index includes two wavelengths from the VIS region (531 and 570 nm) and the latter index includes one wavelength from the VIS region (680 nm) and one from the NIR region (900 nm) [37,38,39]. However, the relationships between the different SRIs and plant traits are often inconsistent due to the impact of several factors, such as crop types, years, environmental conditions, and growth stages, on the algorithms of the SRIs and corresponding sensitive band combinations [11,40,41]. Therefore, extracting the sensitive wavelengths from the full spectrum range and formulating them in suitable SRI algorithms is a necessary step to adopt the SRIs as an efficient and simple approach to estimate plant traits. This step can help to obtain optimized SRIs. These optimized SRIs can improve the accuracy and robustness of the plant traits estimation by identifying the optimal wavelength combinations to some degree [42,43]. In general, the optimized two-band SRIs are usually extracted from the full range of the spectrum (350–2500 nm) using 2-D correlograms. To the best of our knowledge, there is little information available that has evaluated the new three-band SRIs using 3-D correlograms to estimate the water status and grain yield of wheat under different irrigation regimes and arid conditions.
Because the full VIS-SWIR spectrum (350–2500 nm) or part of it provides much more information than individual SRIs, new modeling frameworks, such as data-driven modeling using random forest (RF), and conventional regression models, such as partial least square regression (PLSR) and multiple linear regression (MLR), need to be used to effectively estimate plant traits. The RF is robust against overfitting and has been successfully applied to regression problems with several datasets [44,45]. The RF algorithm’s key advantage is that it is not limited to variable distributions, is not vulnerable to outliers and noises, and is a high-dimensional data-sensitive method [46]. This model has been widely used to develop regression models and for the prediction of successful outcomes [47,48]. Multivariate integration methods, such as PLSR and MLR, have been proposed to resolve the strong multi-collinearity and noisy variables in VIS-SWIR spectrum data and to efficiently assess the measured plant traits [49,50]. Both methods combine a large number of SRIs or spectral bands into a single index to enhance plant traits prediction. Therefore, by using these methods, the different plant traits can be accurately estimated through several SRIs or wavebands. Several studies have reported that the SRI’s coupled with these methods can achieve accurate estimation of different biophysical plant traits [19,47,51,52]. For example, Yang et al. [47] reported that combining optimized SRIs with an RF model had better performance in estimating potato above-ground biomass (AGB) at different growth stages separately or across all growth stages together. Wang et al. [51] and Niu et al. [52] also reported that the SRI’s coupling with machine learning models such as RF, support vector regression (SVR), and artificial neural network (ANN) had better performances in estimating AGB of wheat and maize at different growth stages. On the contrary, Wang et al. [28] found that the combined PLSR model with two-band SRIs failed to accurately estimate maize AGB. Yang et al. [47] also reported that when using the full-spectrum bands as input variables for the RF model, this combination exhibited relatively high root mean square errors and low coefficients of determination for the training and testing datasets, as compared with the combination of optimized SRIs with RF. All of these findings indicate that the number and type of input variables had significantly impacted the performance of the different predictive models in the estimation of biophysical plant traits.
There is little information available to compare the advantages of the RF, PLSR, and MLR models based on different types of SRIs to predict the leaf water status and grain yield of wheat under different irrigation regimes. Therefore, the primary purposes of this study were (1) to compare the performance of the different two-band and three-band SRIs in estimating the plant water status indicators (RWC and GWCF) and grain yield of wheat under different growth conditions (cultivars, irrigation regimes, and seasons) and (2) to compare the performance of these different SRIs coupled with the RF, PLSR, and MLR models in predicting three plant traits.

2. Materials and Methods

2.1. Plant Materials, Experimental Site, Conditions and Design, Agronomic Practices, and Irrigation Treatments

The drought-sensitive cultivar Gimeza 9 and the drought-tolerant cultivar Gimeza 10 [53] were used as plant materials in this study. The two spring wheat cultivars were planted at the Research Station of the University of Sadat City, Egypt (30°2′41.2″ N and 31°14′8.2″ E), during two consecutive growing seasons (2017/2018 and 2018/2019). The different monthly agro-climatological data, which were collected from the weather station of the Agricultural Research Station in El-Nubaria Province, El-Behira Governorate (located 20 km from the experimental site), are presented in Table 1.
Sandy loam (70.3% sand, 21.4% silt, and 8.3% clay) with a bulk density of 1.52 g cm−3 is the main soil texture of the experimental site. The field capacity, wilting point, and available water content of the soil were 0.298 m3 m−3, 0.143 m3 m−3, and 0.152 m3 m−3, while the electrical conductivity of soil and irrigation water were 1.23 and 1.31 dS m−1, respectively. These physicochemical properties of soil were determined based on soil samples collected from the experimental field before the start of the experiment.
The two wheat cultivars were evaluated under three drip irrigation regimes (100%, 75%, and 50% of the estimated crop evapotranspiration (ETc)). Therefore, the experiments were laid out in a randomized complete block with a split-plot arrangement using six replicates. Irrigation treatments and cultivars were randomly distributed in the main plot and the subplot, respectively. The different treatments of the experiment and the replication resulted in 36 plots. Each plot was 4 m long and 2 m wide and consisted of 12 rows spaced 15 cm apart. The irrigation water was applied through the drip irrigation system by supplying each plot with four lateral drip lines spaced 50 cm between each other, with a 30 cm emitter spacing and 4 l h−1 discharge rate. A total of 210, 90, and 100 kg ha−1 ammonium nitrate (33.5% N), super-phosphate (15.5% P2O5), and potassium sulfate (48% K2O), respectively, were applied for all treatments. The entire amount of phosphorus and potassium was applied basally before sowing, while the amount of nitrogen was applied in three equal doses at the sowing, middle of tillering, and booting growth stages. The seeds of each cultivar were sown on 15 November 2017, and 13 November 2018, and were harvested on 28 April in both seasons.
The software v.8 of FAO CROPWAT was used to estimate the irrigation time and calculate the quantity of irrigation water used for the full irrigation regime (100 % ETc). The reference evapotranspiration (ETo) was calculated by using the modified FAO Penman–Monteith equation stated by Allen et al. [54]. The wheat crop coefficient (Kc), which represents the ratio of ETc to ETo, was modified based on the wind velocity and relative humidity data calculated at the 2 m height of the study area. Finally, the ETo and Kc values were applied to the following equation to determine the water requirement for the 100% ETc treatment:
ETc = ETo × Kc
The amount of irrigation for 100% ETc was reduced by 25% and 50% for the 75% ETc and 50% ETc treatments, respectively. The three irrigation regimes were started at the end of tillering and lasted until harvesting. The cumulative amount of irrigation for 100%, 75%, and 50% ETc were 470, 377 and 285 mm in the first season and 490, 380 and 290 mm in the second season, respectively.

2.2. Plant Traits Measurements

At Zadoks growth stage 65 (middle anthesis growth stage), 20 of the youngest fully expanded leaves were randomly selected from each plot to determine the leaf water status (gravimetric water content on fresh weight basis (GWCF) and relative water content (RWC)). The twenty leaves were cut and immediately weighed to obtain their fresh weight (FW). Then the blades of the twenty leaves were soaked in deionized water at 25.0 °C until they were fully turgid, and then weighed to obtain the turgid weight (TW). Then the blades were put into a paper bag and placed in an oven at 80 °C for 48 hours and weighed again to obtain the dry weight (DW). The GWCF and RWC were calculated according to the following equations:
GWCF = (FW−DW) / FW × 100
RWC = (FW−DW) / (TW−DW) × 100
At the maturity stage, an area of 2.7 m2 from each subplot was harvested by hand and threshed. Then the grain yield (GY) was weighed and expressed as Mg ha−1 after the water content of the seeds was adjusted to 14%.

2.3. Spectral Reflectance Measurements

Canopy spectral reflectance of both cultivars was measured synchronously with leaf water status indicators under a clear sky in a nadir orientation within ±2 h of solar noon. The spectral data were collected using a passive handheld field spectrometer (tec5, Oberursel, Germany). This device has an optical fiber with a 12° field of view and consists of two optics. The upper one is used as a reference to quantify the incoming light, while the lower one records the vegetation and ground reflectance. The sensors can measure the canopy reflectance at 256 bands with a spectral detection range from 302 to 1148 nm. The bandwidth resolution of the sensor is 2 nm. The reflectance of the canopy was measured by holding the sensor in the nadir position at approximately 1.0 m above the canopy. The reflectance of the canopy was obtained after calibrating the spectrometer unit readings with a calibration factor obtained from a grey reference standard. This calibration was done every 30 min. The spectral reflectance of each plot was measured 6 times, with the average taken for each plot.

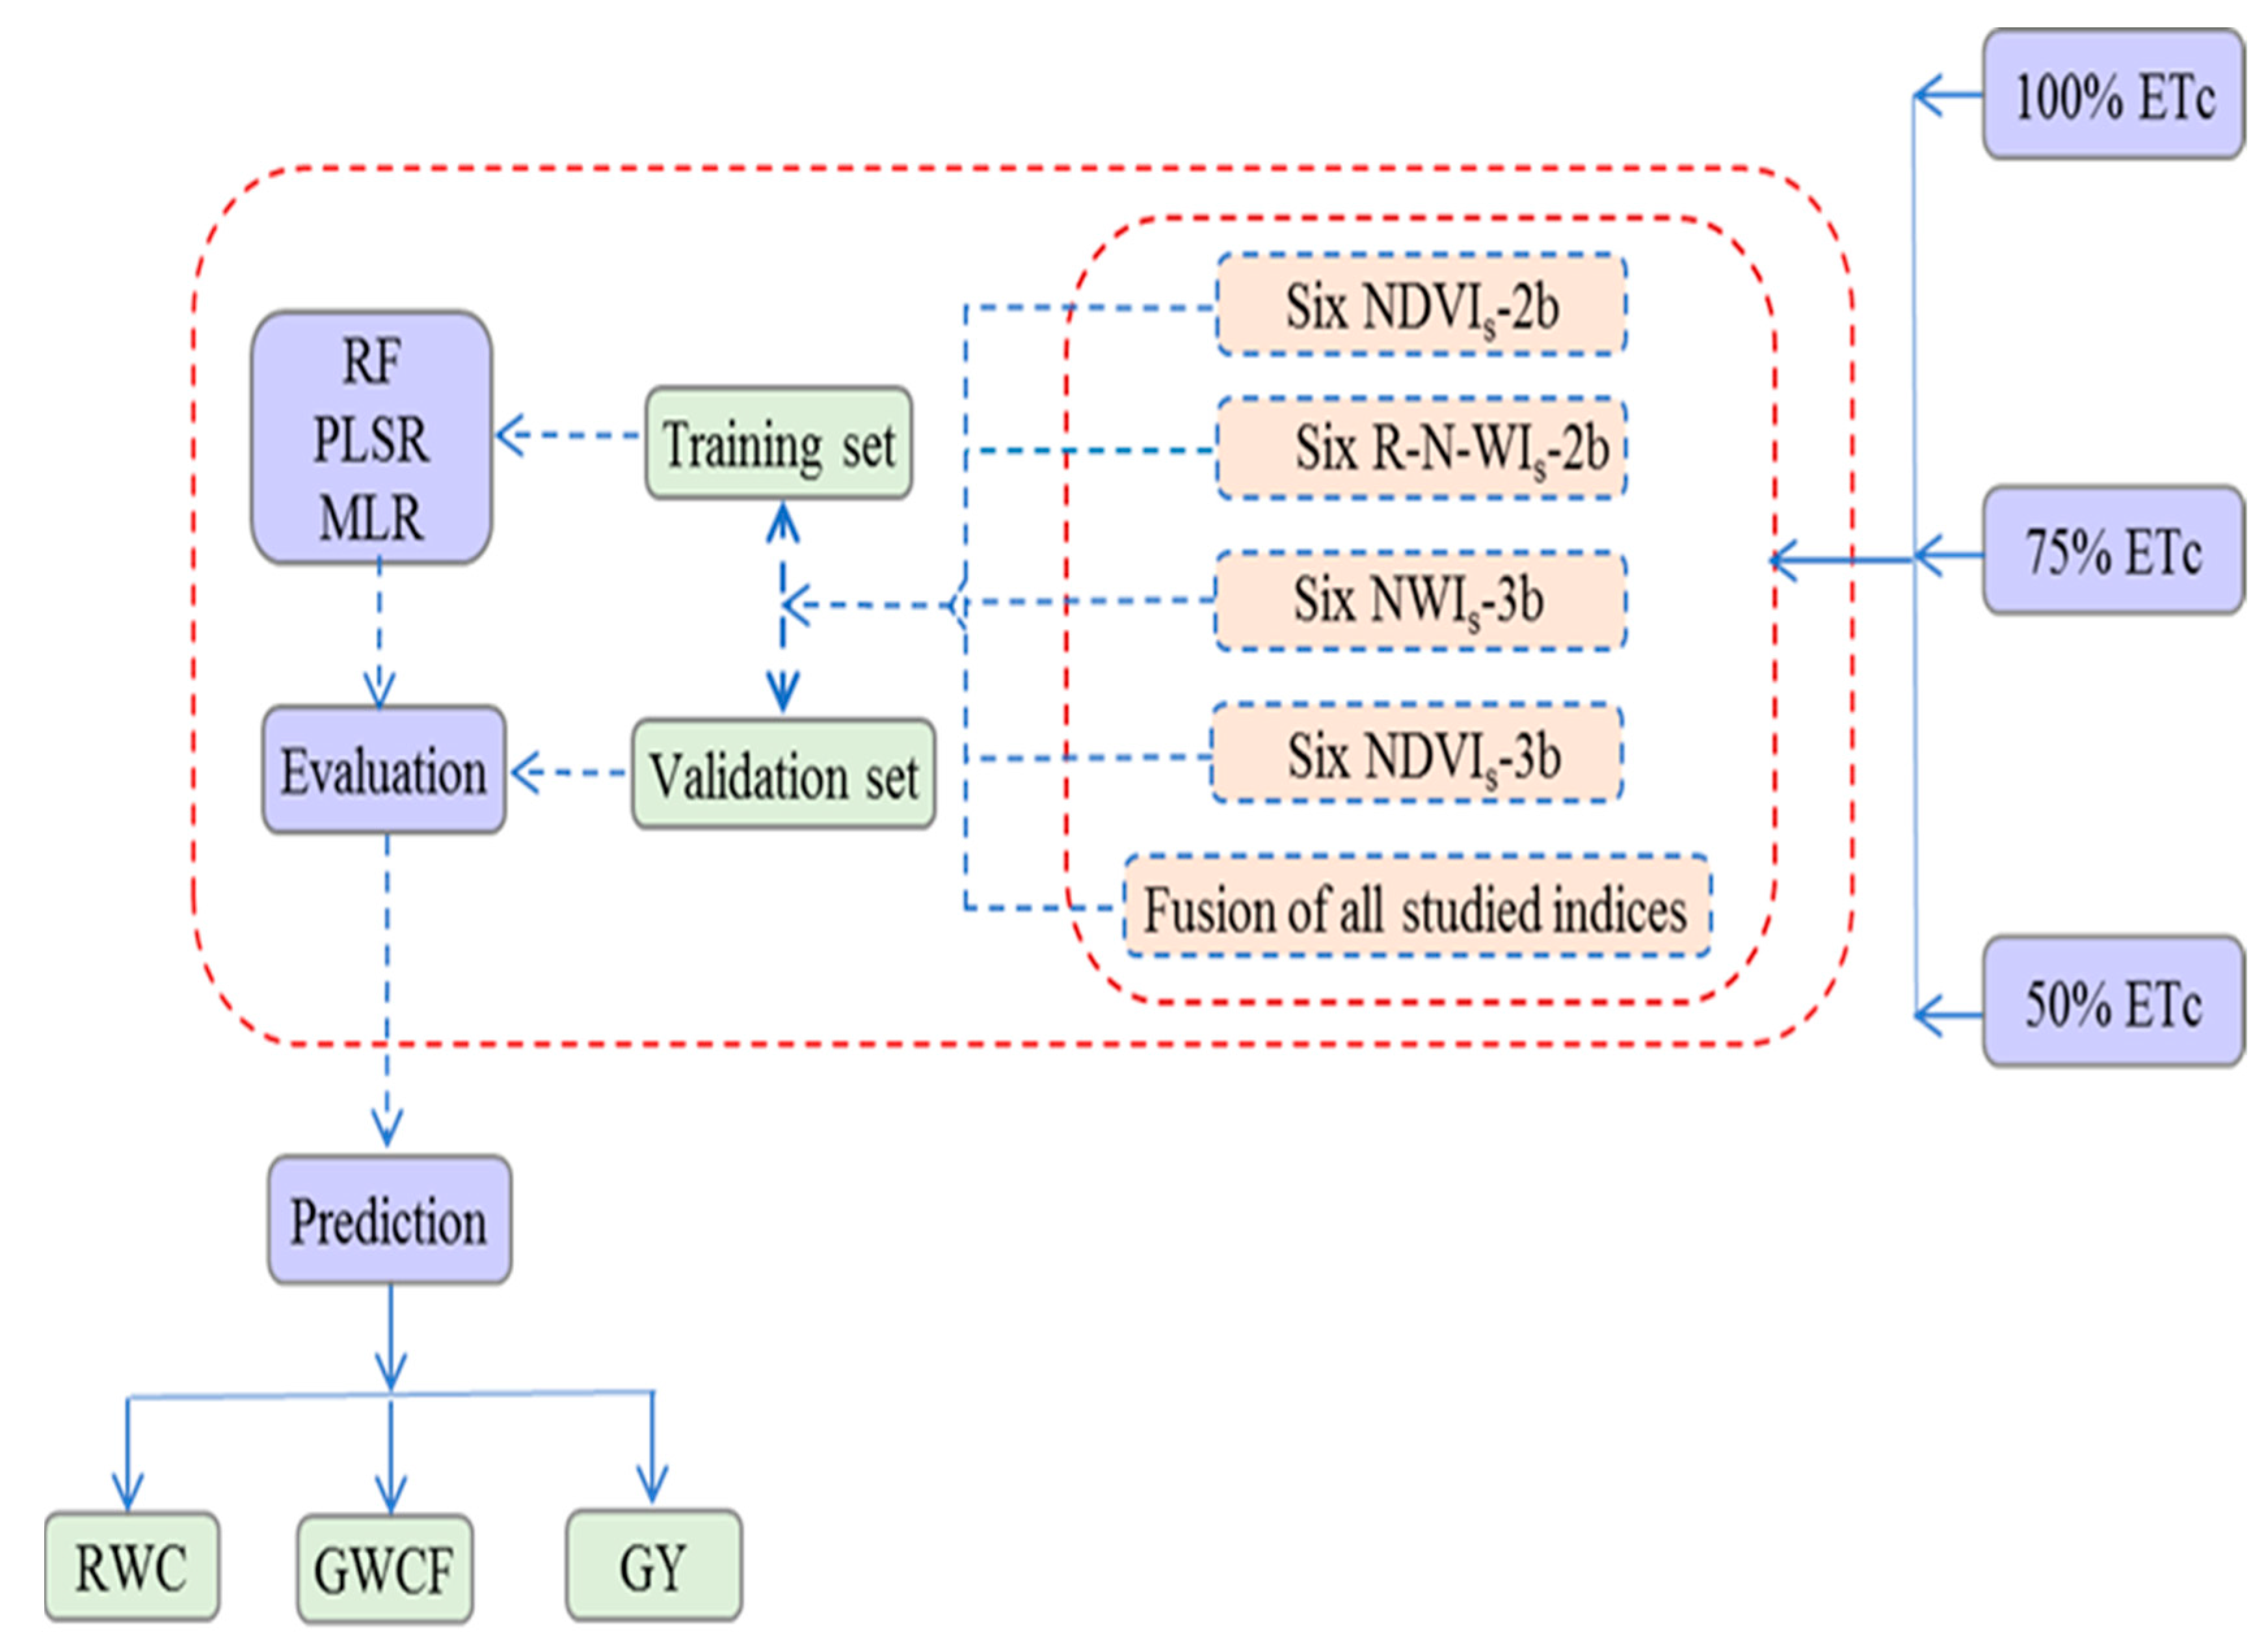
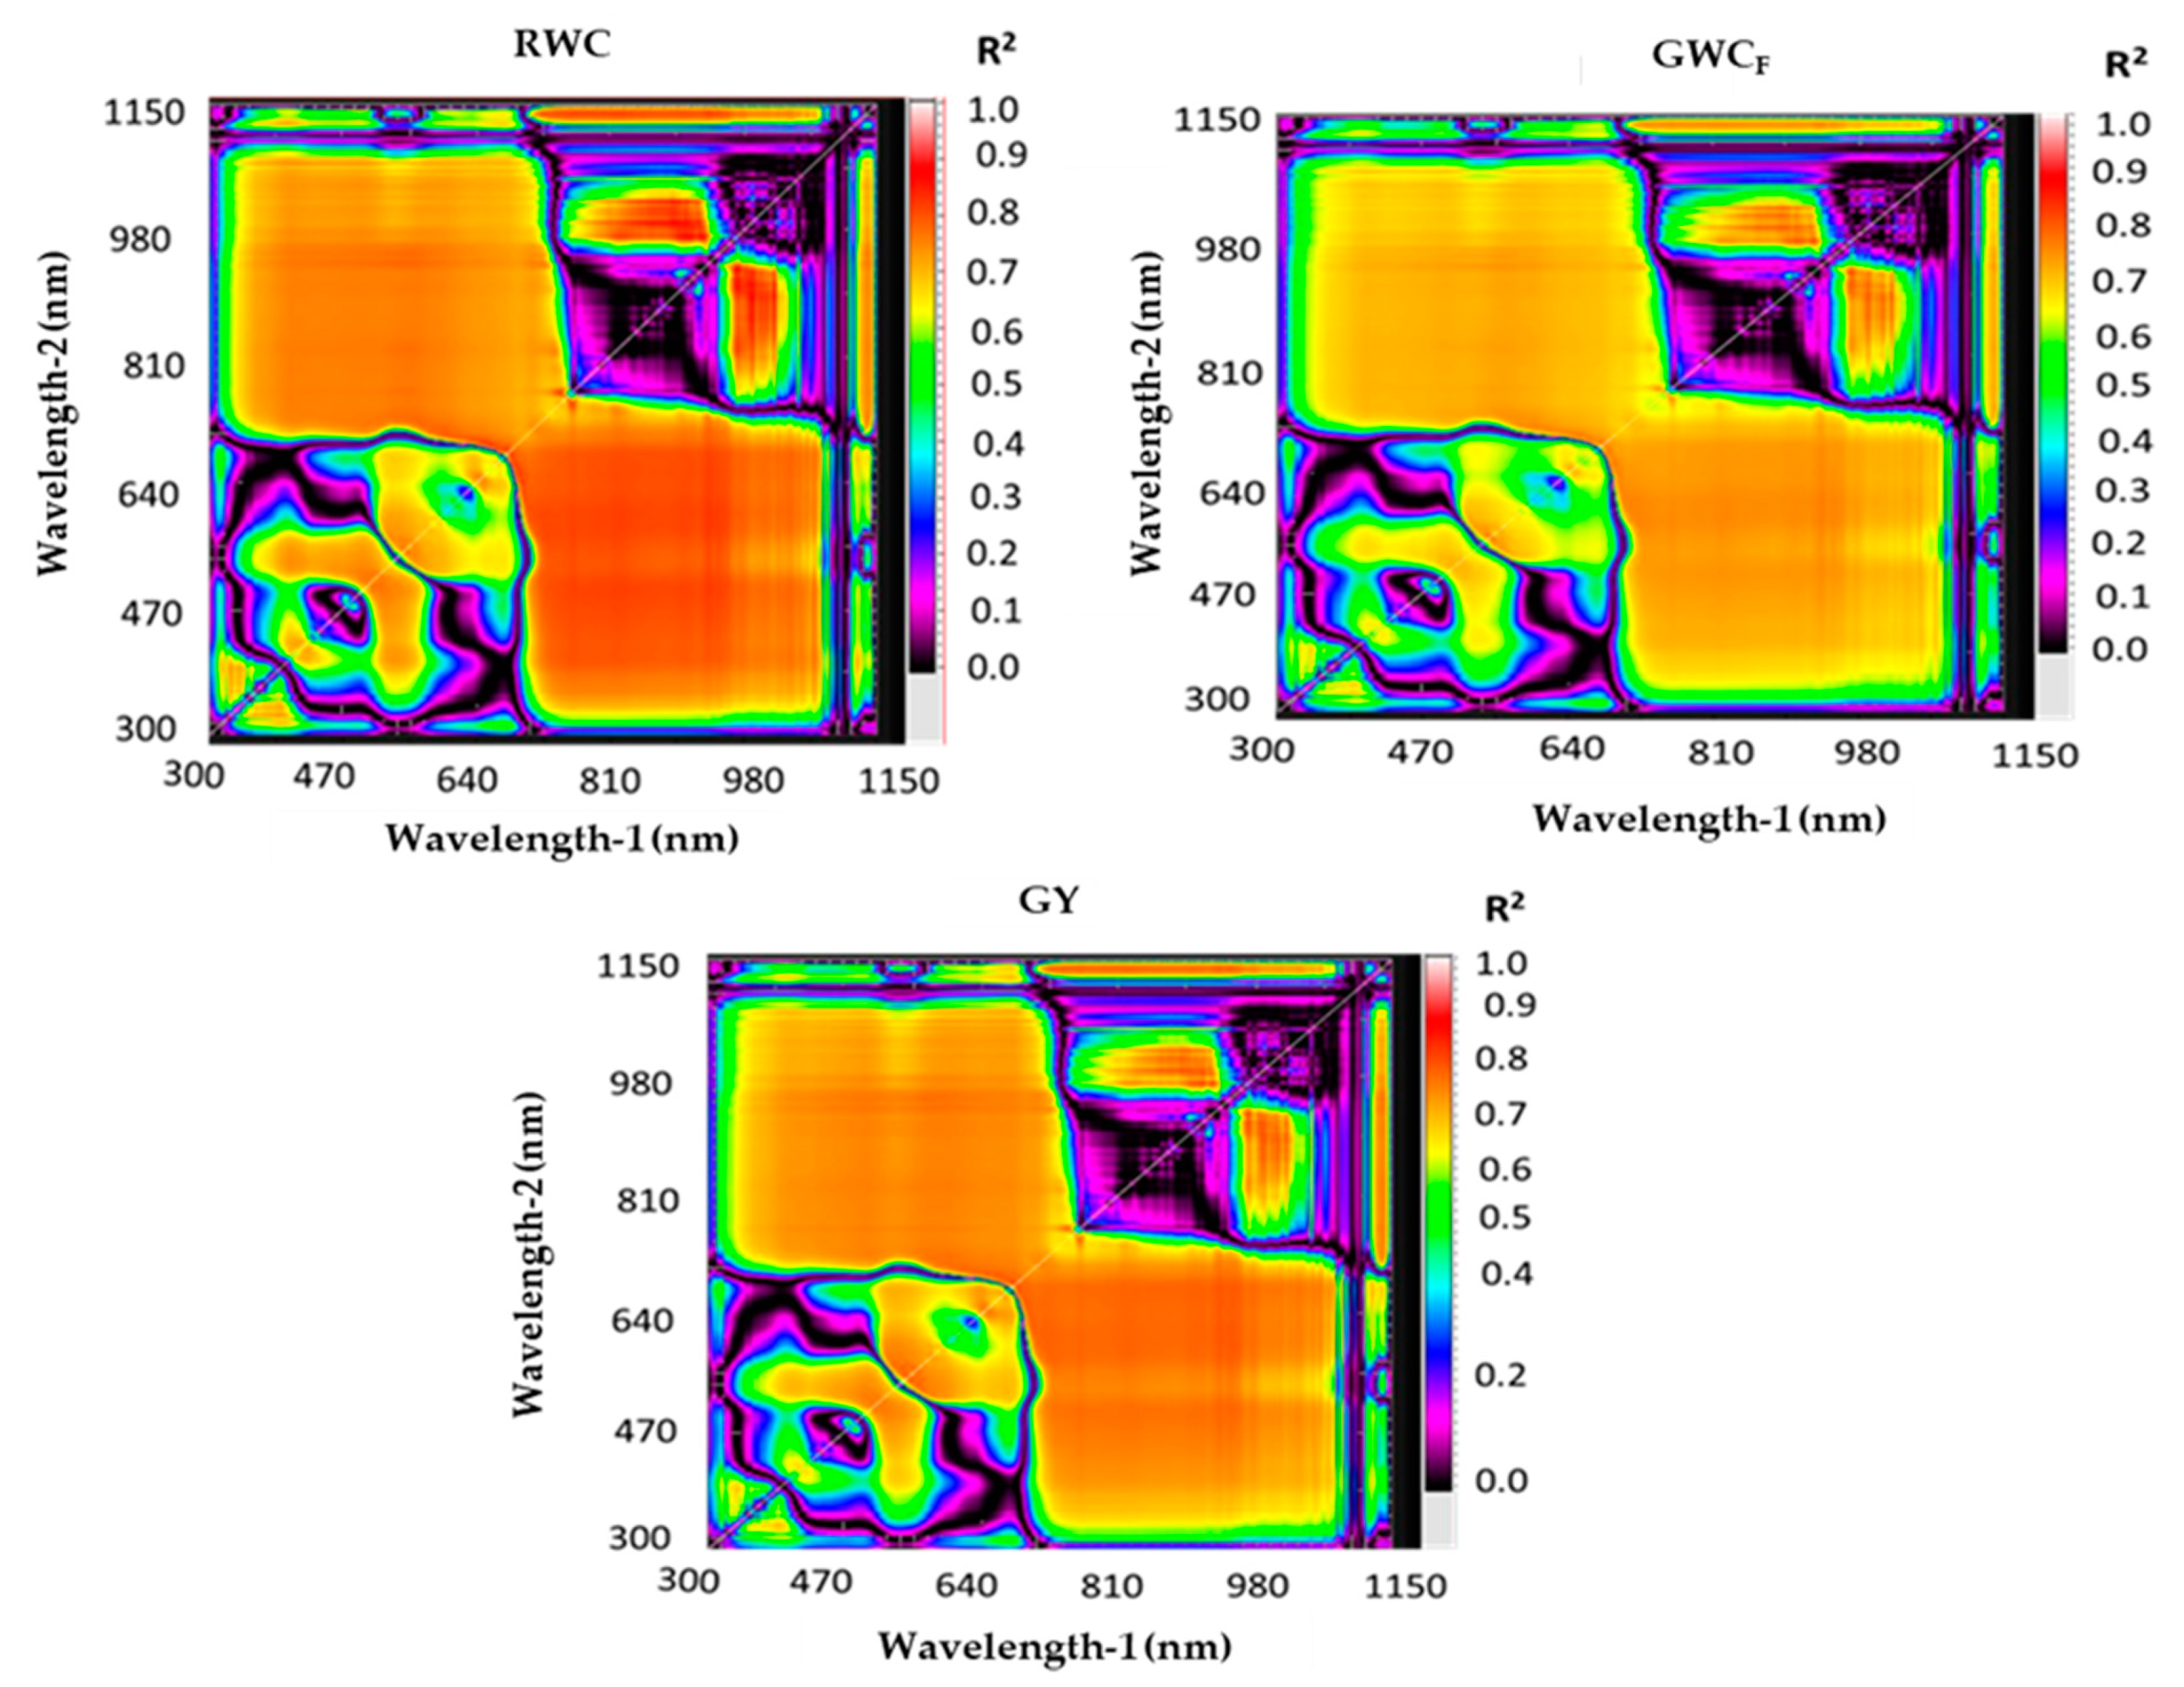
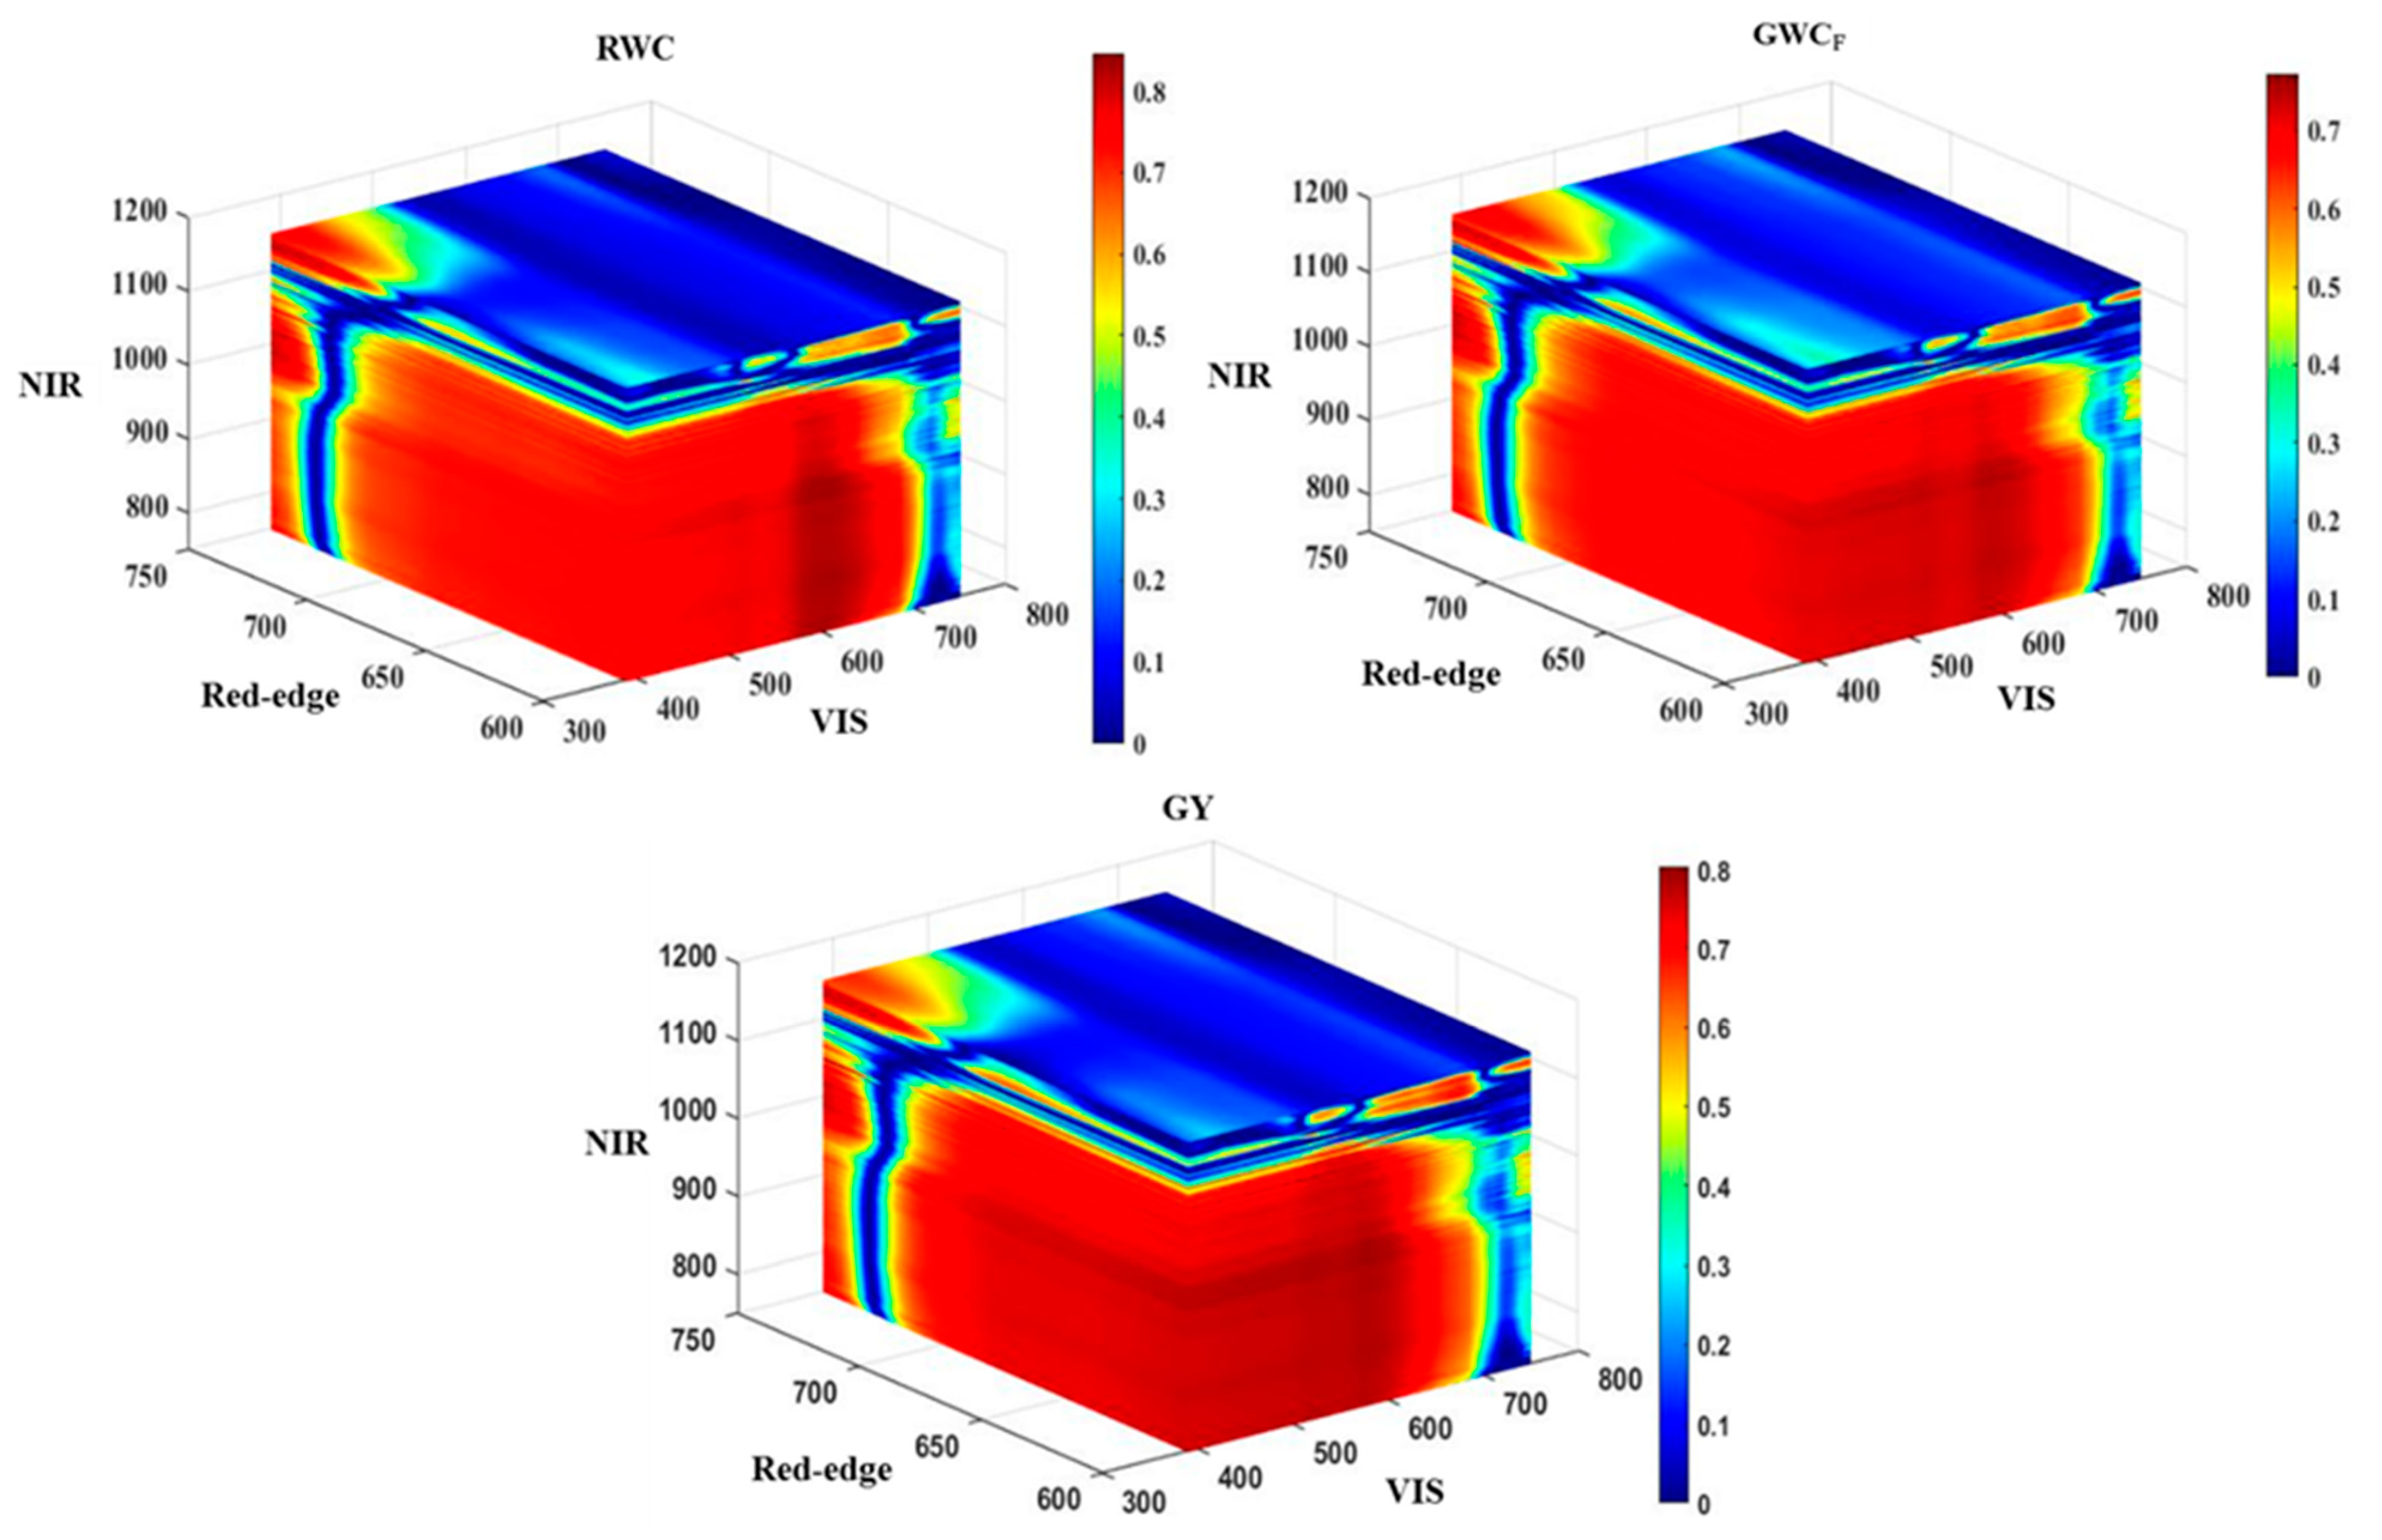
Selection of Newly Constructed and Published Spectral Reflectance Indices

To make the data processing easier to understand, Figure 1 shows a general flowchart of the methodology proposed for indirectly estimating the leaf water status and grain yield.
Nine published and fifteen newly constructed spectral reflectance indices (SRIs) were tested in this study and are shown in Table 2. The published SRIs were selected based on their sensitivity to changes in the plant water content, biomass, leaf pigmentation, and leaf/tissue structure. The formula and references of these SRIs are shown in Table 2.
The new two-band and three-band vegetation- and water-SRIs were constructed using 2-D and 3-D correlogram maps, respectively (Figure 2, Figure 3 and Figure 4). These maps were established using the pooled data of the irrigation regimes, cultivars, replications, and seasons (n = 72). The 2-D correlogram maps show the coefficient of determination (R2) for the sequential linear regression between plant traits and possible combinations between any two wavelengths in the full spectrum range (302–1148 nm; Figure 2). The 3-D correlogram maps show the R2 values for the sequential linear regression between plant traits and possible combinations between any three wavelengths from the NIR region only (700–1148 nm; Figure 3) or one from the VIS (400–700 nm), one from the red-edge (680–780 nm), and one from the NIR (700–1148 nm) regions (Figure 4). The two–band SRIs were constructed as a ratio index (RI = R1/R2), whereas the three-band SRIs were constructed as a normalized difference index (NDI = (NIR3 – NIR1 – NIR2)/(NIR3 + NIR1 + NIR2) or (NIR–VIS)/(NIR + VIS)/(NIR/Red-edge) (Table 2). The different 2-D correlogram maps were established using the lattice package (R Foundation for Statistical Computing, 2013) in R statistics v.3.0.2, whereas MATLAB 7.0 (The Mathworks, Inc., Natick, Massachusetts, USA) was used to create the different 3-D correlogram maps.

2.4. Statistical Analysis

2.4.1. Random Forest Regression (RF)

RF, which is based on regression trees or multiple classifications, can be used to evaluate the relationship between multiple independent variables and a dependent variable. It divides the dataset into several nodes within a homogeneous subset called a regression tree (ntree), using recursive partitioning, and then averaging the results of all the trees. Without stopping the picking of the input variables at each node, each tree is grown to its maximum size based on a bootstrap sample from the training data set. RF utilizes randomness in the regression phase in each tree by choosing a random subset of the variables (mtry) to estimate the split at each node [62]. The leave-one-out validation method (LOOV) was used to optimize the two parameters (mtry and ntree) in the model and lower the root mean squared error (RMSE) of cross-validation (RMSECV).
The ntree value was checked between 1 and 30, whereas the mtry value was evaluated using the different number of features. All features were organized, and the best features were selected based on variable importance statistics after the model was trained with the optimal parameters [63]. During all iterations, the outputs were collected, and different options for the best features combination were evaluated to find the best one with the lowest RMSECV.

2.4.2. Partial Least Squares Regression (PLSR)

PLSR, which is based on stepwise regression and multiple linear regression, is an effective tool that can easily deal with data in which the number of input variables is much greater than the number of target variables, as well as the collinearity and noise in the data of the input variables are strong [64,65]. In this study, leave-one-out cross-validation (LOOCV) was used to determine the number of latent factors (ONLFs) and the best ONLF is that yielding the largest R2 and the smallest RMSE. Random 10-fold cross-validation was applied to the datasets to increase the robustness of the results. The PLSR was conducted using Unscrambler 10.2 software (CAMO Software AS, Oslo).

2.4.3. Multiple Linear Regressions (MLR)

MLR is a regression method that calibrates the relationship between a dependent variable (plant traits) and multiple independent variables (SRIs). This method does regressions between each plant trait and several SRIs several times, and in each time removing the weakest correlated SRIs. In the end, this method selects the SRIs that most contributes to plant traits. The MLR was analyzed using Sigma Plot (v. 11.0, SPSS, Chicago, IL, USA).

2.4.4. Data Analysis

The response of the different plant traits and SRIs of wheat cultivars for the three drip irrigation regimes were tested using the combined analysis of variance appropriate for a split-plot design, with the irrigation regime and cultivar considered as the main factor and sub-factor, respectively. The significant differences between the mean values of plant traits and SRIs among the irrigation regimes for each cultivar were compared using Duncan’s test at the p ≤ 0.05 significance level. This statistical analysis was performed using SPSS (v. 12.0, SPSS Inc., Chicago, IL, USA). The relationships between the plant traits and different types of SRIs were examined for each cultivar, each season, each drip irrigation regime, and across all growth conditions using simple linear regression. The significance of all relationships was tested by R2 at a significance level of p ≤ 0.05, 0.01, and 0.001. This analysis was performed using Sigma Plot.
The performance of the different models of RF, PLSR, and MLR, and the different types of SRIs, were evaluated by comparing the values of the R2 and RMSE. A lower RMSE and higher R2 indicate a better precision and accuracy of the different models.

3. Results and Discussion

3.1. Response Measured Traits of Wheat Cultivars to Different Irrigation Regimes

The two indicators of the leaf water status (RWC and GWCF) could play a vital role to overcome the negative impacts of deficit irrigation on crop production. This is because the two indicators can be used as a guide to determine irrigation thresholds and the implementation of the right irrigation scheduling. The RWC, which is expressed as a fraction of the water volume for the leaf at full turgidity, can reflect the immediate response of the plant water status to soil moisture deficit at the cellular level [66]. The GWCF, which measures the absolute water content based on the fresh mass of leaves or whole crop canopy, is likely to show plant stress over a longer period [15]. For that, regular estimation of both indicators of plant water status could play a vital role in reducing the negative impacts of deficit irrigation conditions on GY and maximizing the water productivity of the irrigation water by taking the right decisions regarding irrigation scheduling. Here, the reduction in the final GY was accompanied by parallel reductions in RWC and GWCF, with the three plant traits showing significant variations (p < 0.05) among the three drip irrigation regimes (Table 3). The low-irrigation regime (50% ETc) resulted in a significant decrease in the three plant traits when compared with the other two irrigation regimes (75% and 100% ETc). The 50% ETc decreased the RWC, GWCF, and GY by 22.2%, 13.2%, and 30.5% for Gimeza 10 and by 22.0%, 14.5%, and 36.5% for Gimeza 9 when compared with the 100% ETc treatment as well as by 12.2%, 8.4%, and 21.7% for Gimeza 10 and by 12.4%, 8.9%, and 26.8% for Gimeza 9 when compared with the 75% ETc treatment, respectively (Table 3). These findings confirm that RWC and GWCF could be used as direct indicators to assess the response degree and adaption of different wheat cultivars to different irrigation regimes. These results are in agreement with previous studies reporting that when wheat plants are exposed to water stress, it leads to a significant reduction in plant traits that are closely related to the plant water status and production [11,16,26,67,68]. However, the relative importance of the different plant water status indicators in determining efficient irrigation scheduling depends on the ability to assess these indicators in real-time and in a fast and economical manner, which is difficult to do on a large scale using ordinary methods. Therefore, remote assessment of different plant water status indicators is an alternative approach that allows rapid, non-destructive, and easy frequent evaluation of large-scale fields; this approach will be presented and discussed in the following section.

3.2. Response of Spectral Reflectance Indices to Different Irrigation Regimes

Generally, water stress causes significant changes in several biophysical and biochemical characteristics of vegetation canopies. Fortunately, these changes lead to dramatic changes in the spectral signatures that are reflected from the canopy at particular wavelengths within the full spectrum [11,21,69,70]. It was found that water stress had direct and indirect effects on the spectral reflectance of the plant canopy. The indirect effects are linked to the changes that occur in several leaf and canopy properties, such as leaf pigments, internal leaf structure, and biomass, which lead to substantial changes in the spectral signature in the VIS and NIR regions. The direct effect is related to changes that occur in the canopy water content itself, which gives rise to changes in spectral reflectance in the SWIR region and specific wavelengths in the NIR region that can penetrate deeper into the leaves [16,71]. Based on all the aforementioned evidence, in this study, we evaluated the response of different SRIs, which incorporate different wavelengths from the VIS, red-edge, and NIR regions, to different irrigation regimes. The results showed that all tested SRIs showed significant differences (p < 0.05) between the three irrigation regimes for both cultivars. Furthermore, the mean values of all the SRIs that belong to the normalized difference vegetation index based on two-band (NDVIs-2b), normalized water indices based on three-band (NWIs-3b), and normalized difference vegetation index based on three-band (NDVIs-3b), except NDVIs-3b-1 and NDVIs-3b-2, showed a continuous decrease from the 100% ETc to the 50% ETc treatments as the measured plant traits. Contrarily, the mean values of all SRIs that belong to ratio and normalized water indices based on two-band (R-N-WIs-2b), except the RWI-1, showed a continuous increase from the 100% ETc to the 50% ETc treatments (Table 3). These results indicate that the different SRIs of both cultivars are also sensitive to various irrigation regimes, as shown by the plant water status indicators and GY. These results also reveal that different irrigation regimes caused significant changes in the canopy’s spectral reflectance at the VIS, red-edge, and NIR regions of the light spectrum. Therefore, the constructed SRIs, based on the effective wavelengths selected from these three parts of the spectrum could be effective for indirectly assessing the plant water status and GY under different irrigation regimes. Additionally, these results also confirm that it is possible to assess the plant water status by the SRIs that incorporate not only the wavelengths related to water information of plants, such as the red-edge and NIR wavelengths, but also by the wavelengths that carry information about the chlorophyll status, biomass accumulation, photosynthetic efficiency, and other aspects of vegetation canopy health, such as the VIS wavelengths. Overall, the red-edge and NIR wavelengths were found to be sensitive to the vegetation water content and dry matter accumulation [28,72]. This is because the wavelengths of two parts of the spectrum are mainly influenced by the plant characteristics that are closely associated with the plant water content, such as the internal leaf structure and leaf biochemical compounds, and some specific wavelengths in the NIR region can penetrate deeper into the leaves. Because there is a circular relationship between the leaf water content, leaf cell turgor, cell volume, and chlorophyll content [73], the SRIs included wavelengths from VIS, which could also effectively track changes in the plant water status [18,68,74]. Therefore, these observations indicate that it is possible to indirectly assess the indicators of plant water status and GY under different irrigation regimes and growth conditions through the simple tool of SRIs that are constructed based on specific wavelengths selected from the VIS, red-edge, and NIR regions, which will be presented and discussed in the following section.

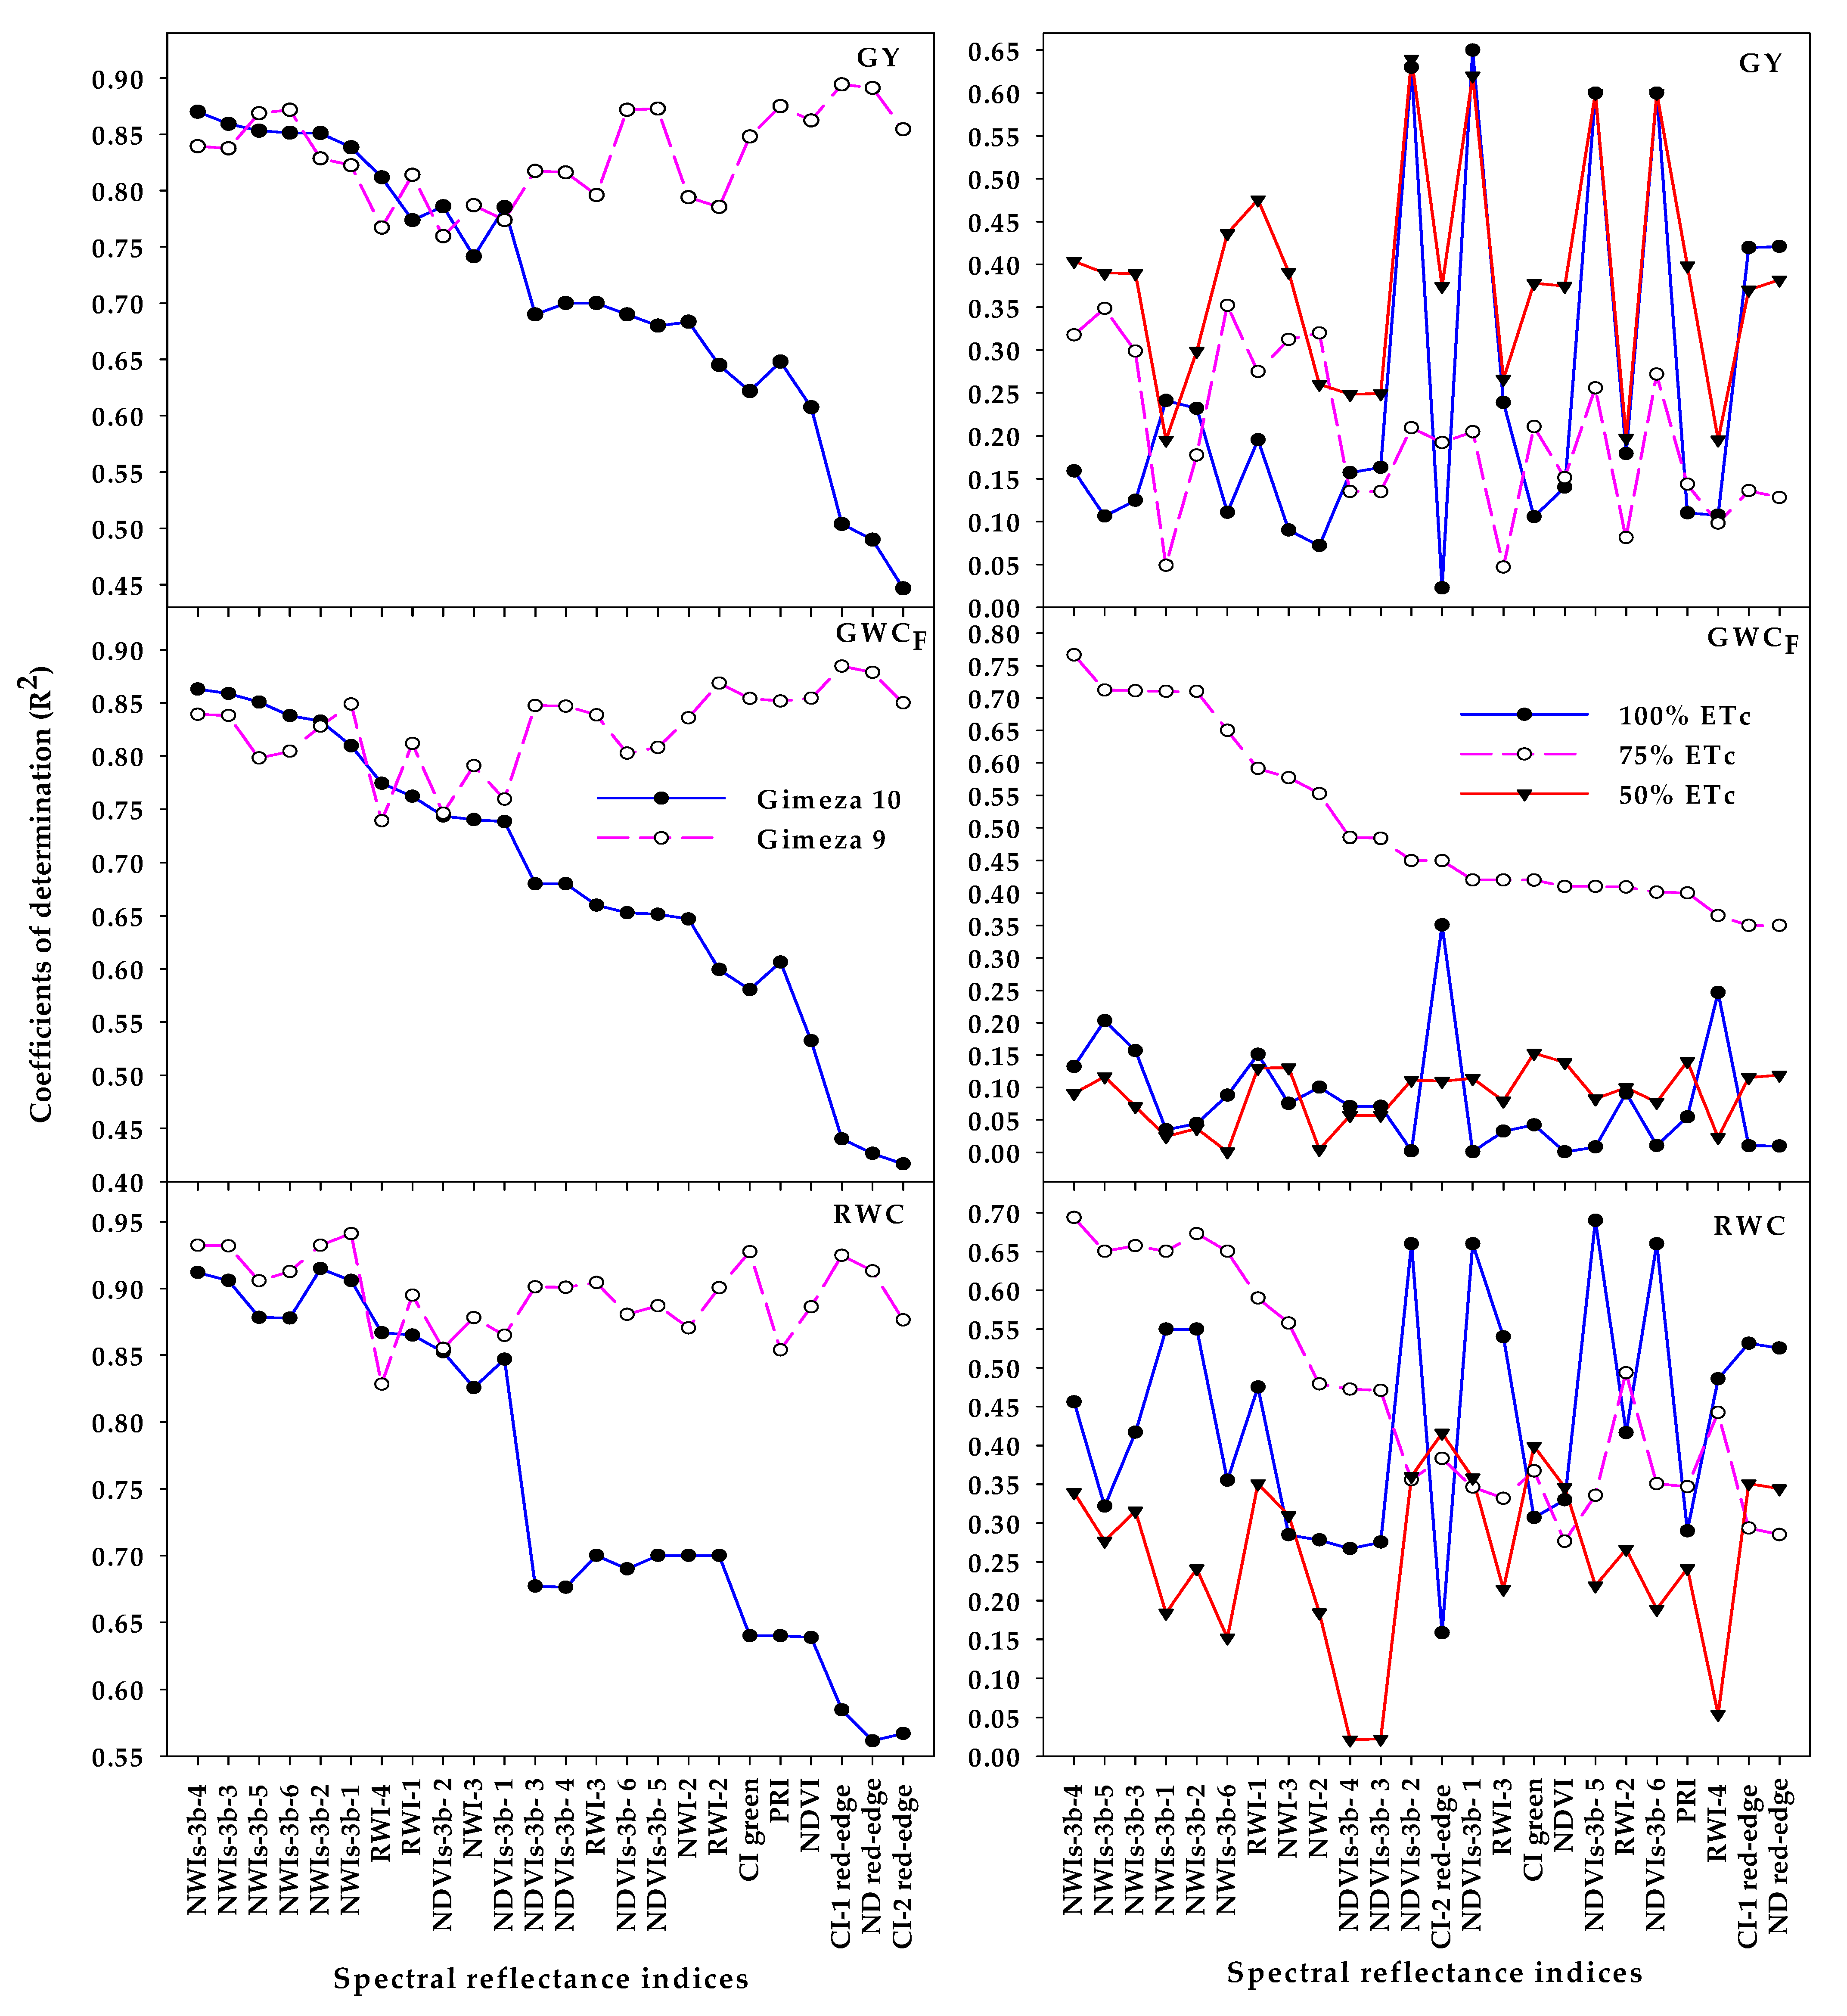
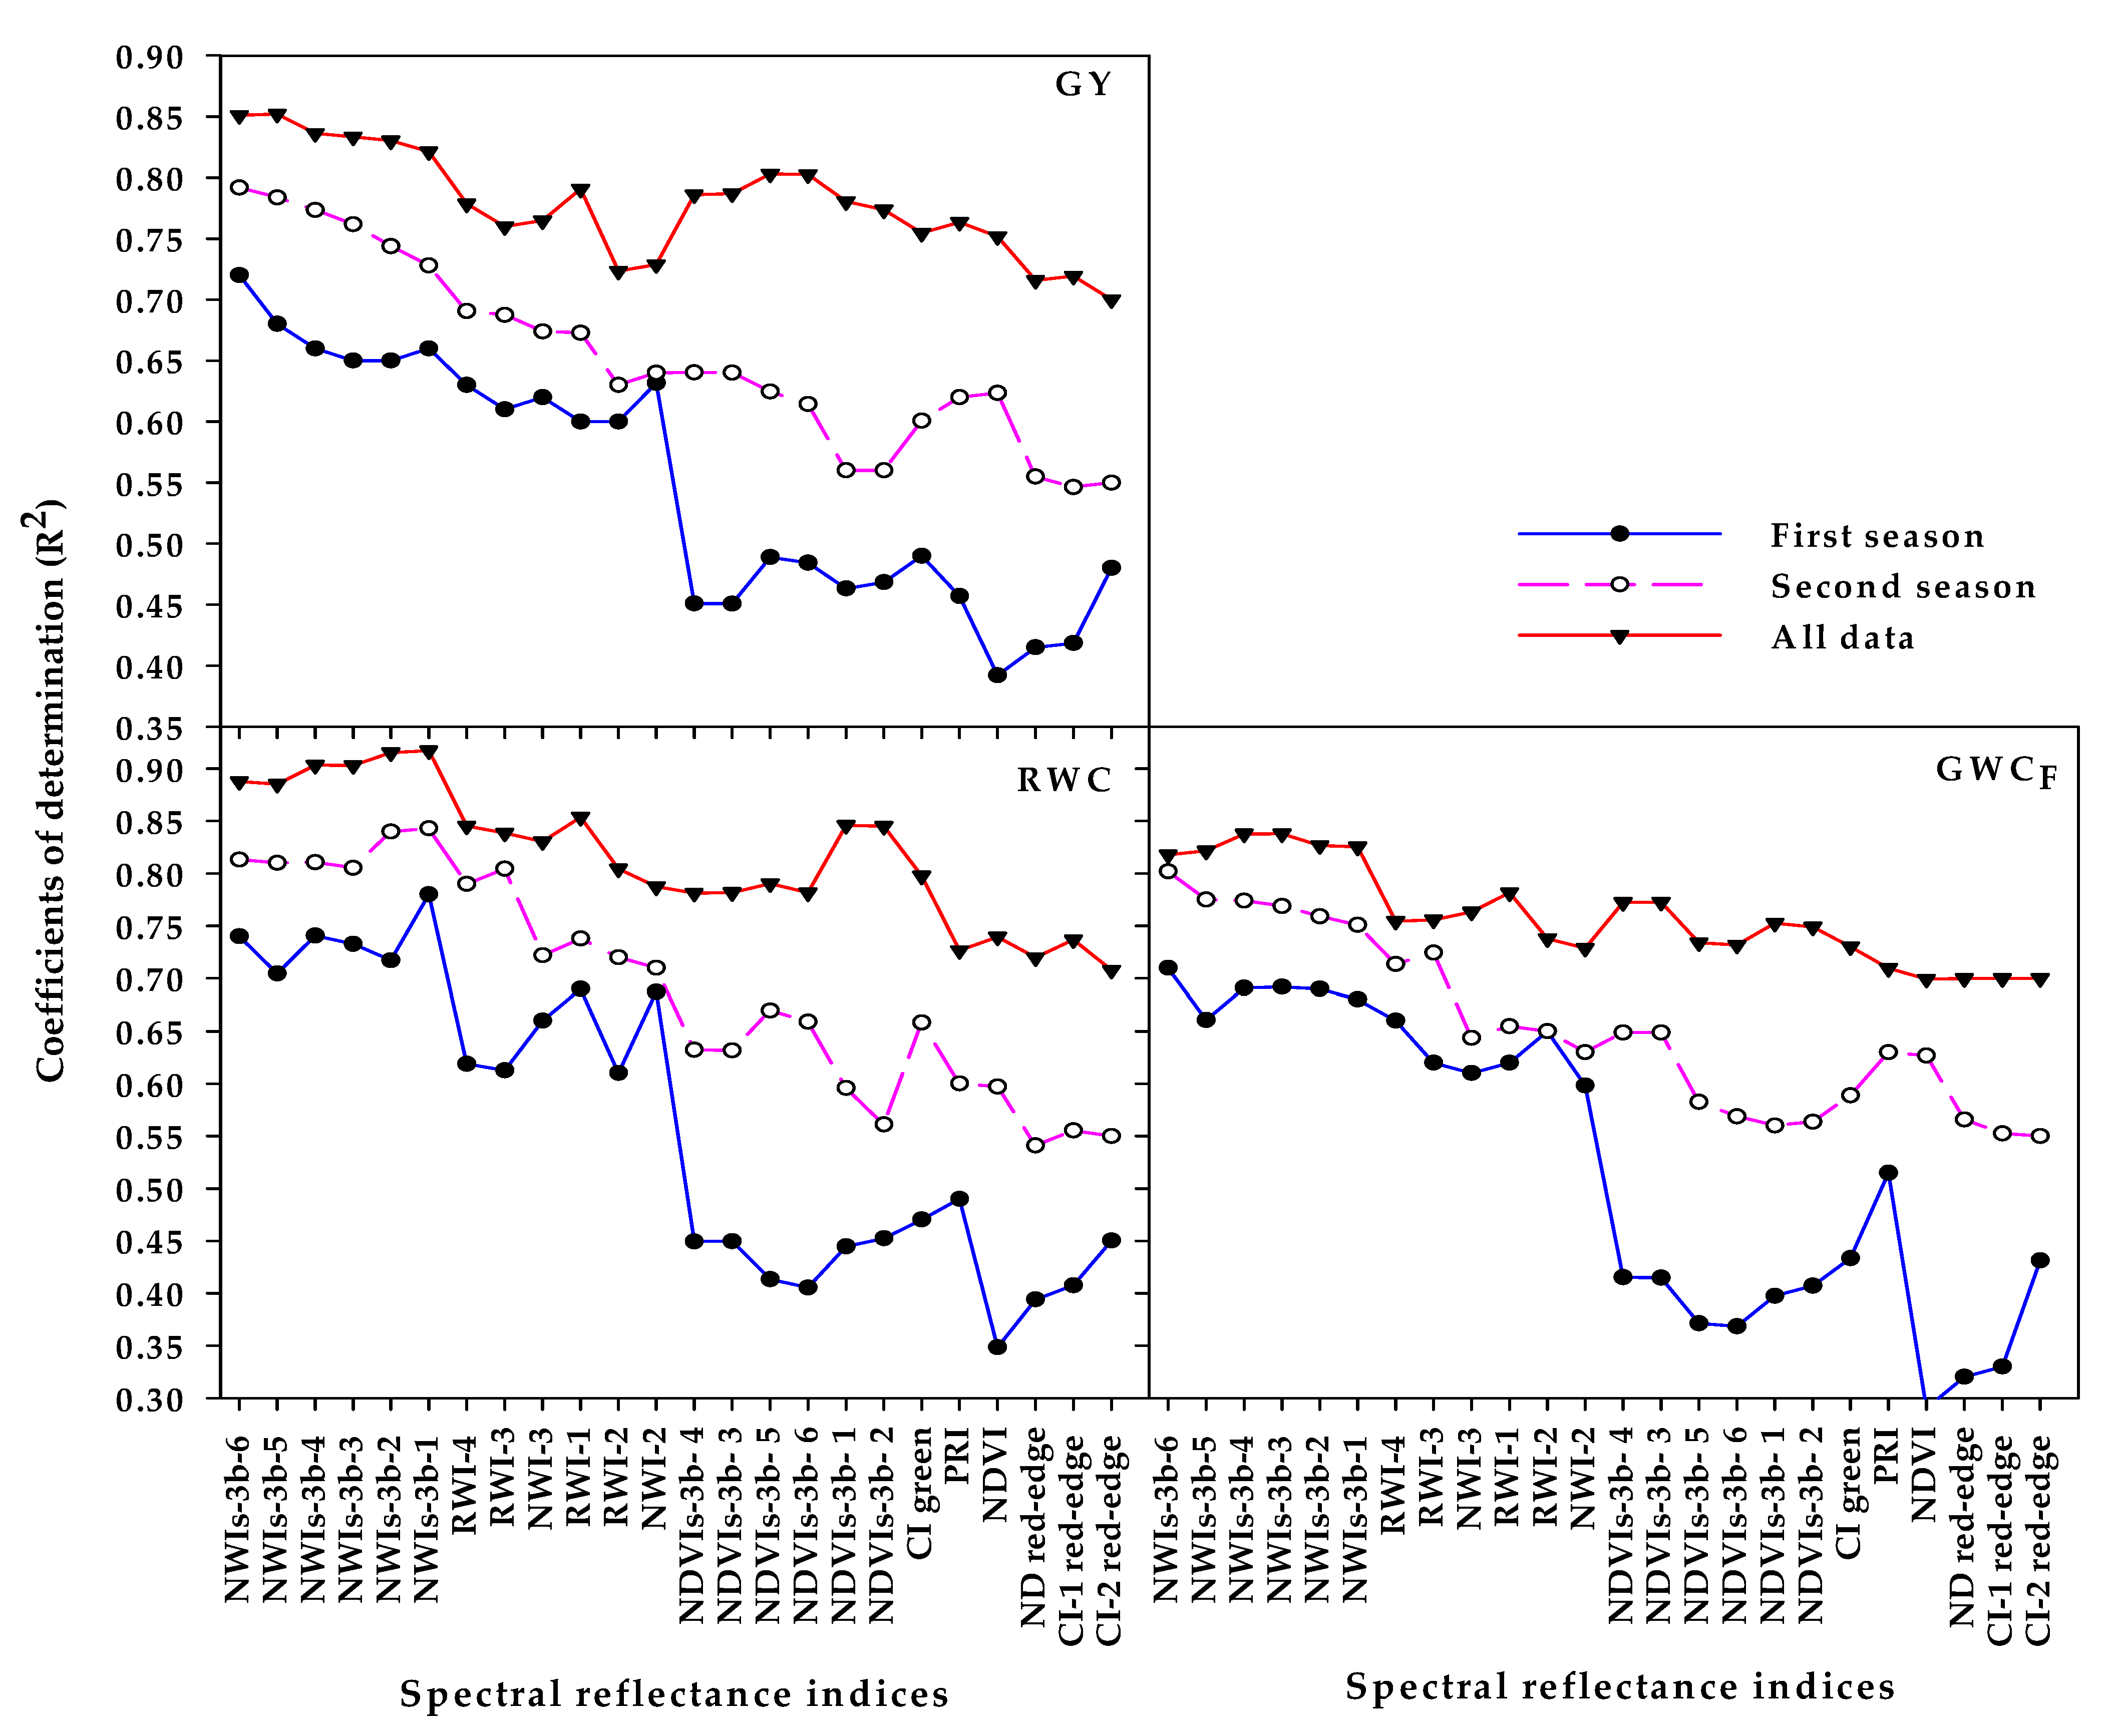
3.3. Ability of Different SRIs for Indirect Assessment of Plant Water Status Indicators and Production under Different Growth Conditions

In this study, two forms of SRIs (vegetation- and water-SRIs) were established based on the best two- or three-band wavelengths within the full spectrum range (Table 2). Generally, the form of the vegetation-SRIs is usually constructed from wavelengths of VIS and red-edge regions and therefore is effective to track the changes in several aspects of the vegetation canopy related to growth and health, such as the pigment content, photosynthetic efficiency, and biomass accumulation [9,68,75,76]. However, the form of water-SRIs is usually formulated based on the wavelengths from the red-edge and NIR regions and thus is effective to track the changes in the internal leaf structure, leaf biochemical compounds, and leaf water content [10,11,16,19,67]. In addition to the form of SRIs, the SRIs are also constructed based on two or three bands. Previous studies have reported that the SRIs constructed from the three-band wavelengths were more effective and accurate to assess the measured plant traits than those constructed from the two-band ones. This is because the three-band SRIs display less saturation and are less sensitive to several plant characteristics, such as the internal leaf structure and leaf biochemical compounds [12,77,78,79,80,81,82,83,84,85,86,87,88,89]. Furthermore, the mathematical formulas of the SRIs, which are often a simple ratio, normalized difference, or mixed between both, play also a vital role in the efficiency of SRIs for accurately estimating plant traits under different growth conditions [12,80,81]. Therefore, in this study, all the previous aspects were taken into consideration when the ability of different SRIs to assess the plant water status indicators and GY were tested for each cultivar (n = 36), irrigation regime (n = 24), season (n = 36), and across all data (n = 72).
Regarding the relationship between different SRIs and three plant traits for each cultivar, all SRIs belonging to NWIs-3b, two indices belonging to NDVIs-3b (NDVIs-3b-1 and NDVIs-3b-2), and three indices belonging to R-N-WIs-2b RWIs (RWI-1, RWI-4, and NWI-3) showed a strong relationship with the three plant traits (RWC, GWCF, and GY) (R2 > 0.80) for both cultivars (Figure 5). However, the other SRIs, especially those belonging to NDVIs-2b, still exhibited a strong relationship with the three traits (R2 ≥ 0.85) for the drought-sensitive cultivar Gimeza 9, whereas they showed a moderate relationship (R2 = 0.42–0.64) with the same traits for the drought-tolerant cultivar Gimeza 10 (Figure 5).
These results indicate that, in general, (1) the three-band SRIs performed better than the two-band SRIs for estimating the leaf water status indicators and GY of both cultivars; (2) the water-SRIs consisting of the NIR and red-edge wavelengths enabled an accurate estimation of the plant traits in both cultivars compared with the vegetation-SRIs consisting of VIS wavelengths; and (3) the ability of NDVIs-2b for the accurate estimation of plant traits seemed to be highly genotype-dependent, where these types of indices were able to estimate the pant traits satisfactorily for the drought-sensitive cultivar but they only moderately assessed them well for the drought-tolerant cultivar. These findings also agree with findings of Gutierrez et al. [16], Yao et al. [77], and Elsayed et al. [19], who reported that the water-SRIs correlated well with plant traits associated with the plant water status and production irrespective of growth conditions, while the efficiency of the vegetation-SRIs for detecting plant traits seems to be growth condition- and genotype-dependent. The main reason for this may be that the VIS bands of the vegetation-based indices are very sensitive to a high leaf area index (LAI) and become only effective to assess plant traits when LAI < 3 and with a significant variation in the chlorophyll content between treatments. In contrast, the NIR bands of the water-based indices can penetrate into the more dense vegetation fraction of the canopy and effectively detect changes in cell structure and leaf anatomy that are significantly associated with the leaf water content [19,46,61,71,82].
The ability of different SRIs to assess three plant traits seems also to be irrigation-regime dependent. All the SRIs belonging to NWIs-3b exhibited a moderate to strong relationship with GWCF and RWC (R2 ≥ 0.65) under the moderate irrigation regime (75% ETc), whereas all types of SRIs examined failed to assess both traits under full (100% ETc) and severe (50% ETc) irrigation regimes, except four SRIs belonging to NDVIs-3b (NDVIs-3b-1, NDVIs-3b-2, NDVIs-3b-5, and NDVIs-3b-6), which showed a moderate relationship with RWC (R2 = 0.66–0.69) under 100% ETc (Figure 5). All types of SRIs examined exhibited a weak relationship (R2 = 0.02–0.48) with GY under the three irrigation regimes, except the four SRIs that belong to NDVIs-3b (NDVIs-3b-1, NDVIs-3b-2, NDVIs-3b-5, and NDVIs-3b-6), which showed a moderate relationship (R2 = 0.60–0.64) with GY under full (100% ETc) and severe (50% ETc) irrigation regimes (Figure 5). These results indicate that, in general, the water-SRIs, particularly those based on the three-band, were much more effective for estimating the leaf water status indicators than the vegetation-SRIs, especially under moderate irrigation regimes. Some leaf water status indicators, such as the RWC, can be estimated under full irrigation regimes using vegetation-SRIs that are based on a three-band index. Importantly, these results also confirm that any indices that combine the VIS, red-edge, and NIR wavelengths are more effective in estimating plant traits under different growth conditions than those indices that combine wavelengths from only one or two regions of the spectrum. Generally, the indices based on wavelengths from one region of the spectrum make it difficult to estimate plant traits accurately because such indices are sensitive to complex growth conditions such as the growth stage, genotypes, canopy characteristics, and the environment. However, the indices combining the wavelengths from the three regions of the spectrum display less saturation as well as react less sensitive to a variety of plant characteristics, such as the internal leaf structure and leaf biochemical compounds [12,32,77,79,83,84]. This may explain why the SRIs based on three bands were more accurate to estimate the three plant traits than the SRIs based on two bands, particularly when the relationship between the SRIs and plant traits were assessed for each irrigation regime separately. Therefore, in previous studies, based on two-band SRIs, various three-band SRIs have been developed to involve extra-sensitive spectral bands and have been used to estimate the plant traits under different growth conditions [77,78,79].
Figure 6 shows that all types of the SRIs examined showed strong relationships with three plant traits (R2 = 0.70–0.92) when the data of seasons, varieties, and irrigation regimes were combined and analyzed together. When the data of varieties and irrigation regimes were analyzed together for each season, the SRIs belonging to NWI2-3b were the best indices to accurately estimate the three plant traits in both seasons (R2 ranging from 0.65 to 0.74 in the first season and from 0.73 to 0.84 in the second season), followed by the SRIs belonging to R-N-WIs-2b, which showed a moderate to strong relationship with the three plant traits (R2 ranging from 0.60 to 0.69 in the first season and from 0.63 to 0.80 in the second season; Figure 6). The SRIs belonging to NDVIs-3b and 2b exhibited a moderate relationship with the three plant traits in the second season (R2 = 0.55–0.67), whereas they showed a weak relationship with the same plant traits in the first season (R2 = 0.29–0.49; Figure 6). These results indicate that irrespective of the type of SRIs, the efficiency of the SRIs for indirectly estimating plant traits can be improved by combining the data of all different growth conditions and analyzed together. The reasons for this could be that combining contrasting environmental growth conditions (seasons, cultivars, and irrigation regimes) could eliminate the negative impacts of soil background reflectance, high biomass accumulation, and high LAI on the canopy spectral properties, as well as could increase the degree of responsiveness of plant traits and spectral reflectance to contrasting environmental growth conditions. Similarly, previous studies have reported that the pooled data of diverse environmental growth conditions provide additional improvement in the accurate estimation of plant traits by SRIs [9,32,67,83,84,85].

3.4. Performance of Different Models to Predict the Measured Traits

Although the SRIs represent a very simple approach for indirectly estimating plant traits, they represent the relationships of the spectral reflectance value at a few wavelengths and disregard the majority of the information contained in hyperspectral information. These very limited numbers of wavelengths often alter the performance of SRIs for estimating the plant traits across different growing environmental conditions. This is because the combined few wavelengths in specific formulas increase the sensitivity of SRIs to different vegetation physical and biochemical proprieties rather than the target traits [70,77,83,84]. Therefore, recent studies have demonstrated that the SRIs coupled with the development of data-driven models, such as RF or multivariate regression models such as PLSR and MIR, can improve the accurate estimation of plant traits as compared to the usage of individual SRIs [41,48,50,52,84,85]. However, the numbers and types of input variables in these models can significantly influence their performance in estimating the plant traits. For example, Wang et al. [51], Niu et al. [52], and Yang et al. [41] reported that the optimized SRIs were more suitable as input variables in the RF, PLSR, and MLR models than the full-spectrum bands and some published SRIs based on two-band wavelengths, such as the NDVI, modified soil-adjusted vegetation index, and the simple ratio vegetation index, in the estimation of the aboveground biomass (AGB) of potato and maize crops at a single growth stage or across different growth stages. In this study, the four groups of SRIs individually or combined were used as input variables in the RF, PLSR, and MLR models for the estimation of the three plant traits. The results in Table 4 show that, in general, the three predictive models coupled with the different groups of SRIs individually or combined estimated the three plant traits satisfactorily in both calibration (R2 ranging from 0.83 to 0.98 in the RF model, from 0.73 to 0.91 in the PLSR model, and from 0.71 to 0.93 in the MLR model) and validation (R2 ranging from 0.72 to 0.90 in the RF model, from 0.63 to 0.85 in the PLSR model, and from 0.67 to 0.88 in the MLR model) datasets. Most importantly, the three models (RF, PLSR, and MLR) coupled with NWIs-3b had the best performance in the estimation of the three plant traits in both the calibration and validation datasets, followed by the models coupled with all types of SRIs together. The main reason for this result might be that the SRIs that belong to NWIs-3b include several wavelengths that are sensitive to the dry matter accumulation and leaf water status. Additionally, these SRIs contain some reference wavelengths that are insensitive to plant characteristics, and those wavelengths are helpful to increase the efficiency of sensitive wavelengths to track the changes in vegetation biomass and water content [29,86,87]. This may explain why the coupling of NWIs-3b with the three models showed a better performance in the estimation of the three plant traits in both calibration and validation datasets as compared with the other types of SRIs. Similarly, Yang et al. [41] reported that the type of SRIs significantly influenced the performance of RF models for estimating the AGB of potato crops across different growth stages.
Additionally, the results also indicate that RF models offer a more accurate estimation of the three plant traits in both calibration (R2 = 0.83–0.98) and validation (R2 = 0.72–0.90) datasets than those from the PLSR (R2 = 0.73–0.91 in calibration and R2 = 0.63–0.85 in the validation datasets) and MLR (R2 = 0.71–0.93 in calibration and R2 = 0.67–0.88 in the validation datasets) models (Table 4). This finding indicates that the performance of different models in the estimation of plant traits can be different. Similarly, Wang et al. [51] and Niu et al. [52] reported that the RF model coupled with SRIs offers a more accurate estimation of the AGB of wheat at different growth stages than those of support vector regression (SVR), artificial neural network (ANN), and MLR models. However, Wang et al. [28] found that the PLSR model coupled with some published SRIs failed to improve the accurate estimation of maize AGB. In contrast, Elsayed et al. [67] found that the PLSR coupled with published NWI2-2b, e.g., NWI-1, NWI-2, NWI-3, and NWI-4, had the best performance in predicting the RWC, GWCF, and GY of a wheat crop under different water irrigation regimes. Garriga et al. [70] also reported that the different machine learning models (SVR, RF, ANN, and MLR) required only 4–9 influential wavelengths from the full spectrum to improve the carbon isotope discrimination (∆13C) and GY estimation accuracy in different bread wheat grown under two contrasting irrigation regimes. These results confirm that selecting the suitable SRIs as input variables in the different algorithms models plays a vital role in the performance of these models in the estimation of plant traits under different environmental growth conditions.

3.5. Application of Hyperspectral Data for Simulated Satellite Data

The most important application of identifying the suitable wavelengths for constructed the two- and three-band SRIs is to design effective multispectral sensors for effective water management in precision agriculture, particularly in large-scale fields. This might further help to advance deficit irrigation regulation in the field crops under arid and semiarid conditions through the operational monitoring of the growth, water status, and GY. In this study, there are many three-band SRIs that combine the VIS, red-edge, and NIR wavelengths, and were effective for estimating the plant water status indicators and GY under different growth conditions. Interestingly, many studies have reported that there are several satellite-derived indices, especially those based on VIS/red-edge, NIR/VIS, and NIR/red-edge, that can achieve accurate estimation of different field measured agronomic traits, such as AGB [44,88], GY [89,90], and plant water status indicators [91,92]. Additionally, Herrmann et al. [93] reported that the satellite-derived indices have been shown to provide almost comparable results as hyperspectral data. These results indicate that using some two- and three-band SRIs tested in this study as a reference for satellite and drone observations could fill the scale gaps between drone, satellite, and ground-based observations, and therefore improve our ability to advance deficit irrigation regulation in wheat at regional and larger spatial scales. In terms of cost, the combined technique of satellite and ground-based data will be far less expensive than sample-point observations.

4. Conclusions

To investigate the performance of SRIs as a simple approach for the indirect estimation of plant traits, the relationships of different types of vegetation- and water-SRIs based on two- and three-band wavelengths with three plant traits (RWC, GWCF, and GY) were evaluated under different growth conditions (cultivars, irrigation regimes, and seasons). The main finding was that all SRIs belonging to NWIs-3b, which were constructed in this study using 3-D correlogram maps, had the best performance in the estimation of three plant traits for both cultivars (R2 > 0.80) as well as RWC and GWCF under 75% ETc (R2 ≥ 0.65). Four out of six NDVIs-3b indices provided a more accurate estimation of the three plant traits for the drought-sensitive cultivar Gimeza 9 than they did for the drought-tolerant cultivar Gimeza 10, of the RWC under 100% ETC, and of the GY under 100% ETc and 50% ETC. All types of SRIs provided a more efficient and accurate estimation of the three plant traits when the data of all different growth conditions were combined and analyzed together. The results also demonstrate that the three algorithm models (RF, PLSR, and MLR) based on NWIs-3b as input variables had the best performance in the estimation of the three plant traits in both the calibration and validation datasets, followed by the algorithm models based on all types of SRIs together. Finally, this study indicates that the three-band water-SRIs coupled with machine learning algorithms could provide a highly useful approach for a robust and accurate estimation of the water status and production of spring wheat under different growth conditions.

Author Contributions

Conceptualization, S.E., S.E.-H., M.F. and M.M.I.; methodology, S.E., S.E.-H., O.E. and H.H.I.; software, O.E. and Y.H.D.; validation, S.E.-H., S.E., M.M.I., U.S. and M.F; formal analysis, S.E.-H., S.E., O.E. and Y.H.D.; investigation, S.E.-H., S.E., H.H.I. and U.S.; resources, S.E., S.E.-H. and Y.H.D.; data curation, H.H.I., S.E. and M.M.I.; writing—original draft preparation, S.E.-H., S.E.; writing—review and editing, S.E.-H., S.E. and U.S.; visualization, S.E.-H. and S.E.; supervision, S.E.-H., S.E., M.M.I. and Y.H.D.; project administration, S.E., S.E.-H. and M.F.; funding acquisition, S.E.-H. and Y.H.D.; All authors have read and agreed to the published version of the manuscript.

Funding

This research was funded by the Researchers Supporting Project, number RSP-2021/375, King Saud University, Riyadh, Saudi Arabia.

Institutional Review Board Statement

Not applicable.

Informed Consent Statement

Not applicable.

Data Availability Statement

All data are presented within the article.

Acknowledgments

The authors acknowledge the Researchers Supporting Project (RSP-2021/375), King Saud University, Riyadh, Saudi Arabia.

Conflicts of Interest

The authors declare no conflict of interest.

References

  1. FAOSTAT. Food and Agriculture Organization of the United Nations Statistics Database. 2020. Available online: http://www.fao.org/faostat/en/#data/QC (accessed on 21 June 2020).
  2. Hirich, A.; Fatnassi, H.; Ragab, R.; Choukr-Allah, R. Prediction of climate change impact on corn grown in south Morocco using the saltmed model. Irrig. Drain. 2016, 65, 9–18. [Google Scholar] [CrossRef]
  3. Lei, Y.; Zhang, H.; Chen, F.; Zhang, L. How rural land use management facilitates drought risk adaptation in a changing climate- A case study in arid northern China. Sci. Total Environ. 2016, 550, 192–199. [Google Scholar] [CrossRef]
  4. IPCC. Climate Change 2020: Synthesis Report. Contribution of Working Groups I, II and III to the Fifth Assessment Report of the Intergovernmental Panel on Climate Change; IPCC: Geneva Switzerland, 2020; p. 151. [Google Scholar]
  5. Fereres, F.; Soriano, M.A. Deficit irrigation for reducing agricultural water use. J. Exp. Bot. 2007, 58, 147–159. [Google Scholar] [CrossRef] [PubMed] [Green Version]
  6. El-Hendawy, S.E.; Schmidhalter, U. Optimal coupling combinations between irrigation frequency and rate for drip-irrigated maize grown on sandy soil. Agric. Water Manag. 2010, 97, 439–448. [Google Scholar] [CrossRef]
  7. Geets, S.; Kirk, R. Deficit Irrigation as an on-Farm Strategy to Maximize Crop Water Productivity in Dry Areas. Agric. Water Manag. 2009, 96, 1275–1284. [Google Scholar] [CrossRef] [Green Version]
  8. Chartzoulakis, K.; Maria, B. Sustainable Water Management in Agriculture under Climate Change. Agric. Sci. Proc. 2015, 4, 88–95. [Google Scholar] [CrossRef] [Green Version]
  9. Elmetwalli, A.H.; El-Hendawy, S.E.; Al-Suhaibani, N.; Alotaibi, M.; Tahir, M.U.; Mubushar, M.; Hassan, W.M.; El-Sayed, S. Potential of hyperspectral and thermal proximal sensing for estimating growth performance and yield of soybean exposed to different drip irrigation regimes under arid conditions. Sensors 2020, 20, 6569. [Google Scholar] [CrossRef]
  10. Romero, A.P.; Alarcón, A.; Valbuena, R.I.; Galeano, C.H. Physiological assessment of water stress in potato using spectral information. Front. Plant Sci. 2017, 8, 1608. [Google Scholar] [CrossRef]
  11. El-Hendawy, S.E.; Al-Suhaibani, N.; Elsayed, S.; Hassan, W.M.; Dewir, Y.H.; Refay, Y.; Abdella, K.A. Potential of the existing and novel spectral reflectance indices for estimating the leaf water status and grain yield of spring wheat exposed to different irrigation rates. Agric. Water Manag. 2019, 217, 356–373. [Google Scholar] [CrossRef]
  12. El-Hendawy, S.; Elsayed, S.; Al-Suhaibani, N.; Alotaibi, M.; Tahir, M.U.; Mubushar, M.; Attia, A.; Hassan, W.M. Use of Hyperspectral Reflectance Sensing for Assessing Growth and Chlorophyll Content of Spring Wheat Grown under Simulated Saline Field Conditions. Plants 2021, 10, 101. [Google Scholar] [CrossRef] [PubMed]
  13. Bohman, B.J.; Rosen, C.J.; Mulla, D.J. Evaluation of variable rate nitrogen and reduced Irrigation management for potato production. Agron. J. 2019, 111, 2005–2017. [Google Scholar] [CrossRef]
  14. Jones, H.G. Monitoring plant and soil water status: Established and novel methods revisited and their relevance to studies of drought tolerance. J. Exp. Bot. 2007, 58, 119–130. [Google Scholar] [CrossRef] [PubMed] [Green Version]
  15. Elsayed, S.; Mistele, B.; Schmidhalter, U. Can changes in leaf water potential be assessed spectrally? Funct. Plant Biol. 2011, 38, 523–533. [Google Scholar] [CrossRef] [PubMed]
  16. Gutierrez, M.; Reynolds, M.P.; Raun, W.R.; Stone, M.L.; Klatt, A.R. Spectral water indices for assessing yield in elite bread wheat genotypes in well irrigated, water stressed, and high temperature conditions. Crop Sci. 2010, 50, 197–214. [Google Scholar] [CrossRef]
  17. Zhang, L.; Zhou, Z.; Zhang, G.; Meng, Y.; Chen, B.; Wang, Y. Monitoring the leaf water content and specific leaf weight of cotton (Gossypium hirsutum L.) in saline soil using leaf spectral reflectance. Eur. J. Agron. 2012, 41, 103–117. [Google Scholar] [CrossRef]
  18. Zhang, F.; Zhou, G. Estimation of vegetation water content using hyperspectral vegetation indices: A comparison of crop water indicators in response to water stress treatments for summer maize. BMC Ecol. 2019, 19, 18. [Google Scholar] [CrossRef] [Green Version]
  19. Elsayed, S.; El-Hendawy, S.; Khadr, M.; Elsherbiny, O.; Al-Suhaibani, N.; Dewir, Y.H.; Tahir, M.U.; Mubushar, M.; Darwish, W. Integration of spectral reflectance indices and adaptive neuro-fuzzy inference system for assessing the growth performance and yield of potato under different drip irrigation regimes. Chemosensors 2021, 9, 55. [Google Scholar] [CrossRef]
  20. Nguy-Robertson, A.; Gitelson, A.; Peng, Y.; Vina, A.; Arkebauer, T.; Rundquist, D. Green leaf area index estimation in maize and soybean: Combining vegetation indices to achieve maximal sensitivity. Agron. J. 2012, 104, 1336–1347. [Google Scholar] [CrossRef] [Green Version]
  21. Bayat, B.; van der Tol, C.; Verhoef, W. Remote Sensing of Grass Response to Drought Stress Using Spectroscopic Techniques and Canopy Reflectance Model Inversion. Remote Sens. 2016, 8, 557. [Google Scholar] [CrossRef] [Green Version]
  22. Elsayed, S.; Barmeier, G.; Schmidhalter, U. Passive reflectance sensing and digital image analysis allows for assessing the biomass and nitrogen status of wheat in early and late tillering stages. Front. Plant Sci. 2018, 9, 1478. [Google Scholar] [CrossRef]
  23. Ge, Y.; Atefi, A.; Zhang, H.; Miao, C.; Ramamurthy, R.K.; Sigmon, B.; Yang, J.; Schnable, J.C. High-throughput analysis of leaf physiological and chemical traits with VIS–NIR–SWIR spectroscopy: A case study with a maize diversity panel. Plant Methods 2019, 15, 1–12. [Google Scholar] [CrossRef] [PubMed] [Green Version]
  24. Elmetwalli, A.H.; Tyler, A.N.; Moghanm, F.S.; Alamri, S.A.M.; Eid, E.M.; Elsayed, S. Integration of Radiometric Ground-Based Data and High-Resolution QuickBird Imagery with Multivariate Modeling to Estimate Maize Traits in the Nile Delta of Egypt. Sensors 2021, 21, 3915. [Google Scholar] [CrossRef]
  25. Winterhalter, L.; Mistele, B.; Jampatong, S.; Schmidhalter, U. High throughput phenotyping of canopy water mass and canopy temperature in well-watered and drought-stressed tropical maize hybrids in the vegetative stage. Eur. J. Agron. 2011, 35, 1, 22–32. [Google Scholar] [CrossRef]
  26. Elsayed, S.; Rischbeck, P.; Schmidhalter, U. Comparing the performance of active and passive reflectance sensors to assess the normalized relative canopy temperature and grain yield of drought-stressed barley cultivars. Field Crop Res. 2015, 177, 148–160. [Google Scholar] [CrossRef]
  27. Chen, D.; Huang, J.; Jackson, T.J. Vegetation water content estimation for corn and soybeans using spectral indices from MODIS near- and short-wave infrared bands. Remote Sens. Environ. 2005, 98, 225–236. [Google Scholar] [CrossRef]
  28. Wang, C.; Nie, S.; Xi, X.H.; Luo, S.Z.; Sun, X.F. Estimating the biomass of maize with hyperspectral and LiDAR data. Remote Sens. 2017, 9, 11. [Google Scholar] [CrossRef] [Green Version]
  29. Bowyer, P.; Danson, F.M. Sensitivity of remotely sensed spectral reflectance to variation in live fuel moisture content. Remote Sens. Environ. 2004, 92, 297–308. [Google Scholar] [CrossRef]
  30. Seelig, H.D.; Hoehn, A.; Stodieck, L.S.; Klaus, D.M.; Adams, W.W., III; Emery, W.J. Relations of remote sensing leaf water indices to leaf water thickness in cowpea, bean, and sugar beet plants. Remote Sens. Environ. 2008, 112, 445–455. [Google Scholar] [CrossRef]
  31. Wang, J.; Xu, R.; Yang, S. Estimation of plant water content by spectral absorption features centered at 1450 nm and 1940 nm regions. Environ. Monit. Assess. 2009, 157, 459–469. [Google Scholar] [CrossRef] [PubMed]
  32. El-Hendawy, S.E.; Al-Suhaibani, N.; Hassan, W.; Dewir, Y.H.; El-Sayed, S.; Al-Ashkar, I.; Abdella, K.A.; Schmidhalter, U. Evaluation of wavelengths and spectral reflectance indices for high throughput assessment of growth, water relations and ion contents of wheat irrigated with saline water. Agric. Water Manag. 2019, 212, 358–377. [Google Scholar] [CrossRef]
  33. Junttila, S.; Vastaranta, M.; Liang, X.; Kaartinen, H.; Kukko, A.; Kaasalainen, S.; Holopainen, M.; Hyyppä, H.; Hyyppä, J. Measuring leaf water content with dual-wavelength intensity data from terrestrial laser scanners. Remote Sens. 2017, 9, 8. [Google Scholar] [CrossRef] [Green Version]
  34. Rapaport, T.; Hochberg, U.; Cochavi, A.; Karnieli, A.; Rachmilevitch, S. The potential of the spectral ‘water balance index’ (WABI) for crop irrigation scheduling. New Phytol. 2017, 216, 741–757. [Google Scholar] [CrossRef] [Green Version]
  35. Clevers, J.G.; Kooistra, L.; Schaepman, M.E. Estimating canopy water content using hyperspectral remote sensing data. Int. J. Appl. Earth Obs. 2010, 12, 119–125. [Google Scholar] [CrossRef]
  36. Qi, Y.; Dennison, P.; Jolly, W.; Kropp, R.; Brewer, S. Spectroscopic analysis of seasonal changes in live fuel moisture content and leaf dry mass. Remote Sens. Environ. 2014, 150, 198–206. [Google Scholar] [CrossRef] [Green Version]
  37. Peñuelas, J.; Garbulsky, M.F.; Filella, I. Photochemical reflectance index (PRI) and remote sensing of plant CO2 uptake. New Phytol. 2011, 191, 596–599. [Google Scholar] [CrossRef] [PubMed]
  38. Cheng, X.J.; Wang, D. Estimating canopy water content in wheat based on new vegetation water index. Spctrosc. Spectral Anal. 2014, 34, 3391–3396. [Google Scholar]
  39. Dangwal, N.; Patel, N.R.; Kumari, M.; Saha, S.K. Monitoring of water stress in wheat using multispectral indices derived from Landsat-TM. Geocarto Int. 2015, 31, 682–693. [Google Scholar] [CrossRef]
  40. Stroppiana, D.; Boschetti, M.; Brivio, P.A.; Bocchi, S. Plant nitrogen concentration in paddy rice from field canopy hyperspectral radiometry. Field Crop. Res. 2009, 111, 119–129. [Google Scholar] [CrossRef]
  41. Yang, H.; Li, F.; Wang, W.; Yu, K. Estimating above-ground biomass of potato using random forest and optimized hyperspectral indices. Remote Sens. 2021, 13, 2339. [Google Scholar] [CrossRef]
  42. Mariotto, I.; Thenkabail, P.S.; Huete, A.; Slonecker, E.T.; Platonov, A. Hyperspectral versus multispectral crop-productivity modeling and type discrimination for the HyspIRI mission. Remote Sens. Environ. 2013, 139, 291–305. [Google Scholar] [CrossRef]
  43. Rivera, J.P.; Verrelst, J.; Delegido, J.; Veroustraete, F.; Moreno, J. On the semi-automatic retrieval of biophysical parameters based on spectral index optimization. Remote Sens. 2014, 6, 4927–4951. [Google Scholar] [CrossRef] [Green Version]
  44. Zhu, X.; Liu, D. Improving forest aboveground biomass estimation using seasonal Landsat NDVI time-series. ISPRS J. Photogramm. 2015, 102, 222–231. [Google Scholar] [CrossRef]
  45. Cao, L.; Pan, J.; Li, R.; Li, J.; Li, Z. Integrating airborne LiDAR and optical data to estimate forest aboveground biomass in arid and semi-arid regions of China. Remote Sens. 2018, 10, 532. [Google Scholar] [CrossRef] [Green Version]
  46. Prasad, A.M.; Iverson, L.R.; Liaw, A. Newer classification and regression tree techniques: Bagging and random forests for ecological prediction. Ecosystems 2006, 9, 181–199. [Google Scholar] [CrossRef]
  47. Yang, R.; Zhang, G.; Liu, F.; Lu, Y.; Yang, F.; Yang, F.; Yang, M.; Zhao, Y.; Li, D. Comparison of boosted regression tree and random forest models for mapping topsoil organic carbon concentration in an alpine ecosystem. Ecol. Indic. 2016, 60, 870–878. [Google Scholar] [CrossRef]
  48. Elsherbiny, O.; Fan, Y.; Zhou, L.; Qiu, Z. Fusion of feature selection methods and regression algorithms for predicting the canopy water content of rice based on hyperspectral data. Agriculture 2021, 11, 51. [Google Scholar] [CrossRef]
  49. Hansen, P.M.; Schjoerring, J.K. Reflectance measurement of canopy biomass and nitrogen status in wheat crops using normalized difference vegetation indices and partial least squares regression. Remote Sens. Environ. 2003, 86, 542–553. [Google Scholar] [CrossRef]
  50. Sharabian, V.R.; Noguchi, N.; Ishi, K. Significant wavelengths for prediction of winter wheat growth status and grain yield using multivariate analysis. Eng. Agric. Environ. Food 2014, 7, 14–21. [Google Scholar] [CrossRef]
  51. Wang, L.; Zhou, X.; Zhu, X.; Dong, Z.; Guo, W. Estimation of biomass in wheat using random forest regression algorithm and remote sensing data. Crop J. 2016, 4, 212–219. [Google Scholar] [CrossRef] [Green Version]
  52. Niu, Y.X.; Zhang, L.Y.; Zhang, H.H.; Han, W.T.; Peng, X.S. Estimating above-ground biomass of maize using features derived from UAV-based RGB imagery. Remote Sens. 2019, 11, 1261. [Google Scholar] [CrossRef] [Green Version]
  53. Al-Kordy, M.A.; Shokry, A.M.; Al-Hejin, A.M.M.; Al-Ahmadi, A.A.; Edris, S.; Ramadan, A.M.; Gadalla, N.O.; El-Domyati, F.M.; Bahieldin, A. Detection of wheat (Triticum aestivum) cultivars with contrasting performance under abiotic stresses. Life Sci. J. 2013, 10, 2. [Google Scholar]
  54. Allen, R.G.; Pereira, L.S.; Raes, D.; Smith, M. Crop Evapotranspiration Guidelines for Computing Crop Water Requirements; Irrigation and Drainage Paper 56; FAO of the United Nations: Rome, Italy, 1998. [Google Scholar]
  55. Peñuelas, J.; Pinol, J.; Ogaya, R.; Filella, I. Estimation of plant water concentration by the reflectance Water Indices WI (R900/R970). Int. J. Remote Sens. 1997, 18, 2869–2875. [Google Scholar] [CrossRef]
  56. Gitelson, A.A.; Merzlyak, M.N. Signature analysis of leaf reflectance spectra: Algorithm development for remote sensing. J. Plant Physiol. 1996, 148, 493–500. [Google Scholar] [CrossRef]
  57. Gitelson, A.A.; Viña, A.; Ciganda, V.; Rundquist, D.C.; Arkebauer, T.J. Remote estimation of canopy chlorophyll content in crops. Geophys Res. Lett. 2005, 32. [Google Scholar] [CrossRef] [Green Version]
  58. Li, F.; Mistele, B.; Hu, Y.; Yue, X.; Yue, S.; Miao, Y.; Chen, X.; Cui, Z.; Meng, Q.; Schmidhalter, U. Remotely estimating aerial N status of phenologically differing winter wheat cultivars grown in contrasting climatic and geographic zones in China and Germany. Field Crops Res. 2012, 138, 21–32. [Google Scholar] [CrossRef]
  59. Rouse, J.W.; Haas, R.H.; Schell, J.A.; Deering, D.W.; Harlan, J.C. Monitoring the Vernal Advancements and Retrogradation; Texas A & M University: College Station, TX, USA, 1974. [Google Scholar]
  60. Peñuelas, J.; Filella, I.; Biel, C.; Serrano, L.; Savé, R. The reflectance at the 950–970 nm region as an indicator of plant water status. Int. J. Remote Sens. 1993, 14, 1887–1905. [Google Scholar] [CrossRef]
  61. Babar, A.; Reynolds, M.; Van Ginkel, M.; Klatt, R.; Raun, R.; Stone, M. Spectral reflectance to estimate genetic variation for in-season biomass, leaf chlorophyll, and canopy temperature in wheat. Crop Sci. 2006, 46, 1046. [Google Scholar] [CrossRef]
  62. Strobl, C.; Boulesteix, A.-L.; Kneib, T.; Augustin, T.; Zeileis, A. Conditional variable importance for random forests. BMC Bioinform. 2008, 9, 307. [Google Scholar] [CrossRef] [Green Version]
  63. Breiman, L. Random forests. Mach. Learn. 2001, 45, 5–32. [Google Scholar] [CrossRef] [Green Version]
  64. Wold, S.; Sjöström, M.; Eriksson, L. PLS-regression: A basic tool of chemometrics. Chemom. Intell. Lab. Syst. 2001, 58, 109–130. [Google Scholar] [CrossRef]
  65. Haenlein, M.; Kaplan, A.M.A. Beginner’s guide to partial least squares analysis. Underst. Stat. 2004, 3, 283–297. [Google Scholar] [CrossRef]
  66. Rossini, M.; Fava, F.; Cogliati, S.; Meroni, M.; Marchesi, A.; Panigada, C.; Giardino, C.; Busetto, L.; Migliavacca, M.; Amaducci, S.; et al. Assessing canopy PRI from airborne imagery to map water stress in maize. ISPRS J. Photogramm. Remote Sens. 2013, 86, 168–177. [Google Scholar] [CrossRef]
  67. Elsayed, S.; Elhoweity, M.; Ibrahim, H.H.; Dewir, Y.H.; Migdadic, H.M.; Schmidhalter, U. Thermal imaging and passive reflectance sensing to estimate the water status and grain yield of wheat under different irrigation regimes. Agric. Water Manag. 2017, 189, 98–110. [Google Scholar] [CrossRef]
  68. El-Hendawy, S.E.; Al-Suhaibani, N.; Al-Ashkar, I.; Alotaibi, M.; Tahir, M.U.; Solieman, T.; Hassan, W.M. Combining genetic analysis and multivariate modeling to evaluate spectral reflectance indices as indirect selection tools in wheat breeding under water deficit stress conditions. Remote Sens. 2020, 12, 1480. [Google Scholar] [CrossRef]
  69. Ranjan, R.; Sahoo, R.; Chopra, U.; Pramanik, M.; Singh, A.; Pradhan, S. Assessment of water status in wheat (Triticum aestivum L.) using ground based hyperspectral reflectance. Proc. Natl. Acad. Sci. India Sect. B Biol. Sci. 2015, 87, 377–388. [Google Scholar] [CrossRef]
  70. Garriga, M.; Romero-Bravo, S.; Estrada, F.; Méndez-Espinoza, A.M.; González-Martínez, L.; Matus, I.A.; Castillo, D.; Lobos, G.A.; Del Pozo, A. Estimating carbon isotope discrimination and grain yield of bread wheat grown under water-limited and full irrigation conditions by hyperspectral canopy reflectance and multilinear regression analysis. Int. J. Remote Sens. 2021, 42, 2848–2871. [Google Scholar] [CrossRef]
  71. Zhang, Q.; Li, Q.; Zhang, G. Rapid determination of leaf water content using VIS/NIR spectroscopy analysis with wavelength selection. Int. J. Spectrosc. 2012, 27, 93–105. [Google Scholar] [CrossRef]
  72. El-Hendawy, S.E.; Alotaibi, M.; Al-Suhaibani, N.; Al-Gaadi, K.; Hassan, W.; Dewir, Y.H.; Emam, M.A.E.-G.; Elsayed, S.; Schmidhalter, U. Comparative performance of spectral reflectance indices and multivariate modeling for assessing agronomic parameters in advanced spring wheat lines under two contrasting irrigation regimes. Front. Plant Sci. 2019, 10, 1537. [Google Scholar] [CrossRef]
  73. Scoffoni, C.; Vuong, C.; Diep, S.; Cochard, H.; Sack, L. Leaf shrinkage with dehydration: Coordination with hydraulic vulnerability and drought tolerance. Plant Physiol. 2014, 164, 1772–1788. [Google Scholar] [CrossRef] [PubMed] [Green Version]
  74. Kovar, M.; Brestic, M.; Sytar, O.; Barek, V.; Hauptvogel, P.; Zivcak, M. Evaluation of hyperspectral reflectance parameters to assess the leaf water content in soybean. Water 2019, 11, 443. [Google Scholar] [CrossRef] [Green Version]
  75. Wu, C.Y.; Niu, Z.; Tang, Q.; Huang, W.J. Estimating chlorophyll content from hyperspectral vegetation indices: Modeling and validation. Agric. Forest Meteorol. 2008, 148, 1230–1241. [Google Scholar] [CrossRef]
  76. Saberioon, M.M.; Amin, M.S.M.; Anuar, A.R.; Gholizadeh, A.; Wayayok, A.; Khairunniza-Bejo, S. Assessment of rice leaf chlorophyll content using visible bands at different growth stages at both the leaf and canopy scale. Int. J. Appl. Earth Obs. Geoinf. 2014, 32, 35–45. [Google Scholar] [CrossRef]
  77. Yao, X.; Jia, W.; Si, H.; Guo, Z.; Tian, Y.; Liu, X.; Tian, Y.; Liu, X.; Cao, W.; Zhu, Y. Exploring novel bands and key index for evaluating leaf equivalent water thickness in wheat using hyperspectra influenced by nitrogen. PLoS ONE 2014, 9, e96352. [Google Scholar]
  78. Wang, W.; Yao, X.; Yao, X.F.; Tian, Y.C.; Liu, X.J.; Ni, J.; Cao, W.X.; Zhu, Y. Estimating leaf nitrogen concentration with three-band vegetation indices in rice and wheat. Field Crops Res. 2012, 129, 90–98. [Google Scholar] [CrossRef]
  79. Li, F.; Li, D.; Elsayed, S.; Hu, Y.; Schmidhalter, U. Using optimized three-band spectral indices to assess canopy N uptake in corn and wheat. Eur. J. Agron. 2021, 127, 126286. [Google Scholar] [CrossRef]
  80. Lu, S.; Lu, X.; Zhao, W.; Liu, Y.; Wang, Z.; Omasa, K. Comparing vegetation indices for remote chlorophyll measurement of white poplar and Chinese elm leaves with different adaxial and abaxial surfaces. J. Exp. Bot. 2015, 66, 5625–5637. [Google Scholar] [CrossRef] [PubMed] [Green Version]
  81. Lu, S.; Lu, F.; You, W.; Wang, Z.; Liu, Y.; Omasa, K. A robust vegetation index for remotely assessing chlorophyll content of dorsiventral leaves across several species in different seasons. Plant. Methods 2018, 14, 2–15. [Google Scholar] [CrossRef] [PubMed] [Green Version]
  82. Elazab, A.; Bort, J.; Zhou, B.; Serret, M.D.; Nieto-Taladriz, M.T.; Araus, J.L. The combined use of vegetation indices and stable isotopes to predict durum wheat grain yield under contrasting water conditions. Agric. Water Manag. 2015, 158, 196–208. [Google Scholar] [CrossRef]
  83. Ustin, S.L.; Gamon, J.A. Remote sensing of plant functional types. New Phytol. 2010, 186, 795–816. [Google Scholar] [CrossRef]
  84. Garriga, M.; Romero-Bravo, S.; Estrada, F.; Escobar, A.; Matus, I.A.; del Pozo, A. Assessing wheat traits by spectral reflectance: Do we really need to focus on predicted trait-values or directly identify the elite genotypes group? Front. Plant Sci. 2017, 8, 280. [Google Scholar] [CrossRef] [Green Version]
  85. Feng, M.; Guo, X.; Wang, C.; Yang, W.; Shi, C.; Ding, G.; Zhang, X.; Xiao, L.; Zhang, M.; Song, X. Monitoring and evaluation in freeze stress of winter wheat (Triticum aestivum L.) through canopy hyperspectrum reflectance and multiple statistical analysis. Ecol. Indic. 2018, 84, 290–297. [Google Scholar] [CrossRef]
  86. Glenn, E.P.; Huete, A.R.; Nagler, P.L.; Nelson, S.G. Relationship between remotely-sensed vegetation indices, canopy attributes and plant physiological processes: What vegetation indices can and cannot tell us about the landscape. Sensors 2008, 8, 2136–2160. [Google Scholar] [CrossRef] [PubMed] [Green Version]
  87. Kanke, Y.; Tubana, B.; Dalen, M.; Harrell, D. Evaluation of red and red-edge reflectance-based vegetation indices for rice biomass and grain yield prediction models in paddy fields. Precis. Agric. 2016, 17, 507–530. [Google Scholar] [CrossRef]
  88. Li, C.; Zhou, L.; Xu, W. Estimating Aboveground Biomass Using Sentinel-2 MSI Data and Ensemble Algorithms for Grassland in the Shengjin Lake Wetland, China. Remote Sens. 2021, 13, 1595. [Google Scholar] [CrossRef]
  89. Al-Gaadi, K.A.; Hassaballa, A.A.; Tola, E.; Kayad, A.G.; Madugundu, R.; Alblewi, B.; Fahad Assiri, F. Prediction of potato crop yield using precision agriculture techniques. PLoS ONE 2016, 11, e0162219. [Google Scholar]
  90. Prey, L.; Schmidhalter, U. Simulation of satellite reflectance data using high-frequency ground based hyperspectral canopy measurements for in-season estimation of grain yield and grain nitrogen status in winter wheat. ISPRS J. Photogramm. Remote Sens. 2019, 149, 176–187. [Google Scholar] [CrossRef]
  91. Marusig, D.; Petruzzellis, F.; Tomasella, M.; Napolitano, R.; Altobelli, A.; Nardini, A. Correlation of field-measured and remotely sensed plant water status as a tool to monitor the risk of drought-induced forest decline. Forests 2020, 11, 77. [Google Scholar] [CrossRef] [Green Version]
  92. Varghese, D.; Radulović, M.; Stojković, S.; Crnojević, V. Reviewing the potential of sentinel-2 in assessing the drought. Remote Sens. 2021, 13, 3355. [Google Scholar] [CrossRef]
  93. Herrmann, I.; Pimstein, A.; Karnieli, A.; Cohen, Y.; Alchanatis, V.; Bonfil, D.J. LAI assessment of wheat and potato crops by VENμS and Sentinel-2 bands. Rem. Sens. Environ. 2011, 115, 2141–2151. [Google Scholar] [CrossRef]
Figure 1. Flowchart showing a general overview of the methodology proposed for indirectly estimating the leaf water status and grain yield.
Water 13 02666 g001
Figure 2. Two-dimensional (2-D) correlogram maps showing the coefficients of determination (R2) between all the wavelength combinations in the full spectrum range (302–1148 nm) and the relative water content (RLWC), gravimetric water content on a fresh weight basis (GWCF), and grain yield (GY) using the pooled data of the wheat cultivars, seasons, irrigation regimes, and replications.
Water 13 02666 g002
Figure 3. Three-dimensional (3-D) correlogram maps showing the coefficients of determination (R2) between all possible three-band combinations in the range of 700 to 1148 nm (wavelength of red-red and NIR regions) and the relative water content (RLWC), gravimetric water content on a fresh weight basis (GWCF), and grain yield (GY) using the pooled data of the wheat cultivars, seasons, irrigation regimes, and replications.
Water 13 02666 g003
Figure 4. Three-dimensional (3-D) correlogram maps showing the coefficients of determination (R2) between all the possible three-band combinations in the VIS (400–700 nm), red-edge (680–780 nm), and NIR (700–1148 nm) and the relative water content (RLWC), gravimetric water content on a fresh weight basis (GWCF), and grain yield (GY) using the pooled data of wheat cultivars, seasons, irrigation regimes, and replications.
Water 13 02666 g004
Figure 5. Coefficients of determination (R2) for the relationship between different spectral reflectance indices (SRIs) and the relative leaf water content (RWC), gravimetric water content on a fresh weight basis (GWCF), and the grain yield (GY), for each cultivar and each irrigation water regime. The full names of the different SRIs are listed in Table 2.
Water 13 02666 g005
Figure 6. Coefficients of determination (R2) for the relationship between the different spectral reflectance indices (SRIs) and the relative leaf water content (RWC), gravimetric water content on a fresh weight basis (GWCF), and the grain yield (GY), for each season and across all data. The full names of the different SRIs are listed in Table 2.
Water 13 02666 g006
Table 1. Monthly agro-climatological data at Sadat City during the two growing seasons.
YearMonthTemperature (°C)Relative Humidity (%) Wind Speed
(m s–1)
Total Solar Radiation (MJ m–2 day–1)
MinimumMaximum
2017/2018November15.224.058.43.416.5
December12.120.563.53.614.7
January7.617.661.23.716.5
February11.720.260.63.519.1
March13.028.651.54.123.6
April17.032.758.44.927.6
2018/2019November13.824.469.24.116.4
December12.020.769.85.114.7
January8.718.967.85.316.2
February11.822.067.05.719.1
March13.929.861.06.123.6
April17.532.969.26.427.6
Table 2. Description of the different spectral reflectance indices tested in this study.
Spectral Reflectance Indices (SRIs)FormulaReferences
Normalized difference vegetation index based on two-band (NDVIs-2b)
Photochemical reflectance index (PRI)(R531 − R570)/(R531 + R570)[55]
Normalized difference red-edge (ND red-edge )(R750 − R710)/(R750 + R710)[56]
Green chlorophyll index (CI green )(R750/R550 ) – 1[57]
Red-edge chlorophyll index-1 (CI-1 red-edge )(R750/R710 ) – 1[57]
Red-edge chlorophyll index-2 (CI-2 red-edge)R800/R740 – 1[58]
Normalized difference vegetation index (NDVI)(R800 − R680)/(R800+ R680)[59]
Ratio and normalized water indices based on two-band (R-N-WIs-2b)
Ratio water index-1 (RWI-1 (900970))R900/R970[60]
Ratio water index-2 (RWI-2 (976-888))R976/R888This work
Ratio water index-3 (RWI-3 (974-904))R974/R904This work
Ratio water index-4 (RWI-4 (988-896))R988/R895This work
Normalized water index-2 (NWI-2)(R970 − R850)/(R970 + R850)[61]
Normalized water index-3 (NWI-3)(R970 − R920)/(R970 + R920)[61]
Normalized water indices based on three-band (NWIs-3b)
NWIs-3b-1 (906,974,1020)(R906 − R974 − R1020)/(R906 + R974 + R1020)This work
NWIs-3b-2 (906,1020,972)(R906 − R1020 − R972)/(R906 + R1020 + R972)This work
NWIs-3b-3 (908,1018,970)(R908 − R1018 − R970)/(R908 + R1018 + R970)This work
NWIs-3b-4 (906,970,1018)(R906 − R970 − R1018)/(R906 + R970 + R1018)This work
NWIs-3b-5 (916,970,1018)(R916 − R970 − R1018)/(R916 + R970 + R1018)This work
NWIs-3b-6 (916,1018,972)(R916 − R1018 − R972)/(R916 + R1018 + R972)This work
Normalized difference vegetation index based on three-band (NDVIs-3b)
NDVIs-3b-1 (936,692,652)(R936 − R692)/(R936 + R692)/ (R936/R652)This work
NDVIs-3b-2 (936,692,648)(R936 − R692)/(R936 + R692)/ (R936/R648)This work
NDVIs-3b-3 (1096,602,750)(R1096 − R602)/(R1096 + R602)/ (R1096/R750)This work
NDVIs-3b-4 (1096,600,750)(R1096 − R600)/(R1096 + R600)/ (R1096/R750)This work
NDVIs-3b-5 (1146,496,726)(R1146 − R496)/(R1146 + R496)/ (R1146/R726)This work
NDVIs-3b-6 (1146,496,724)(R1146 − R496)/(R1146 + R496)/ (R1146/R724)This work
Table 3. Comparison of the mean values of the relative water content (RWC), gravimetric water content on a fresh weight basis (GWCF), grain yield (GY), and twenty-four spectral reflectance indices of the wheat cultivars among three irrigation regimes for each wheat cultivar across two seasons.
TraitsGimeza 10Gimeza 9
100% Etc75% ETc50% ETc100% ETc75% ETc50% ETc
Plant traits
RWC (%)80.8a71.6b62.9c77.8a69.3b60.7c
GWCF (%)78.1a74.0b67.8c77.0a72.2b65.8c
GY(Mg ha−1)7.83a6.95b5.44c7.56a6.56b4.80c
Normalized difference vegetation index based on two-band (NDVIs-2b)
PRI−0.073a−0.080b−0.091c−0.079a−0.085b−0.105c
ND red-edge0.326a0.290b0.266b0.313a0.273b0.207c
CI green2.570a2.249b2.031c2.519a2.051b1.643c
CI-1 red-edge0.966a0.818b0.729b0.911a0.753b0.522c
CI-2 red-edge0.157a0.140b0.132b0.164a0.128b0.108c
NDVI0.661a0.614b0.555c0.638a0.582b0.463c
Ratio and normalized water indices based on two-band (R-N-WIs-2b)
RWI-11.117a1.088b1.072c1.105a1.073b1.053c
RWI-20.893c0.914b0.928a0.901c0.926b0.946a
RWI-30.900c0.923b0.937a0.909c0.933b0.952a
RWI-4 0.893c0.918b0.939a0.907c0.928b0.946a
NWI-2−0.056c−0.042b−0.036a−0.049c−0.035b−0.025a
NWI-3−0.051c−0.040b−0.033a−0.047c−0.033b−0.026a
Normalized water indices based on three-band (NWIs-3b)
NWIs-3b-1 −0.292a−0.303b−0.312c−0.297a−0.308b−0.315c
NWIs-3b-2 −0.292a−0.303b−0.312c−0.297a−0.309b−0.316c
NWIs-3b-3 −0.294a−0.304b−0.313c−0.299a−0.310b−0.317c
NWIs-3b-4 −0.293a−0.304b−0.313c−0.299a−0.309b−0.317c
NWIs-3b-5 −0.294a−0.304b−0.313c−0.299a−0.309b−0.317c
NWIs-3b-6 −0.295a−0.305b−0.314c−0.299a−0.310b−0.318c
Normalized difference vegetation index based on three-band (NDVIs-3b)
NDVIs-3b-10.128c0.136b0.144a0.131c0.142b0.149a
NDVIs-3b-20.130c0.138b0.145a0.133c0.144b0.150a
NDVIs-3b-30.612a0.550b0.473c0.585a0.507b0.416c
NDVIs-3b-40.612a0.550b0.473c0.585a0.507b0.418c
NDVIs-3b-50.961a0.879b0.771c0.924a0.808b0.662c
NDVIs-3b-60.867a0.803b0.707c0.836a0.741b0.618c
Mean values followed by the same letter are not statistically different from one another based on a Duncan’s test at a p ≤ 0.05 significance level.
Table 4. Results of coefficient of determination (R2) and root mean square error (RMSE) of the calibration (Cal.), and ten-fold cross-validation (Val.) for the random forest (RF), partial least square regression (PLSR), and multiple linear regression (MLR) models of the relationship between the spectral reflectance index types and relative water content (RWC), gravimetric water content on a fresh weight basis (GWCF), and grain yield (GY) of wheat cultivars across all growth conditions (cultivars, irrigation regimes, and seasons).
SRIs TypesPlant TraitsFRPLSR MLR
Best ParametersCalibration (cal.)Validation (val.)PCsCalibration (cal.)Validation (val.)Calibration (cal.)Validation (val.)
R2calRMSEcalR2valRMSEvalR2calRMSEcalR2valRMSEvalR2calRMSEcalR2valRMSEval
NDVIs-2bRWCntree = 3, ntry = 6 0.85 ***0.0160.77 **0.02510.80 **0.0340.75 **0.0350.81 ***0.0320.78 **0.035
GWCFntree = 1, ntry = 30.83 ***0.0180.72 **0.01910.73 **0.0240.66 **0.0250.71 **0.0230.67 **0.027
GYntree = 3, ntry = 5 0.83 ***0.2860.73 **0.42310.76 **0.5510.69 **0.5830.80 **0.5210.73 **0.589
R-N-WIs-2bRWCntree = 2, ntry = 40.94 ***0.0170.85 ***0.02810.86 ***0.0270.76 **0.0290.89 ***0.0280.81 ***0.041
GWCFntree = 49, ntry = 3 0.95 ***0.0100.77 **0.02010.79 **0.0210.63 **0.0220.80 **0.0230.69 **0.026
GYntree = 1, ntry = 60.91 ***0.2790.77 **0.45610.79 **0.5100.73 **0.5390.82 ***0.5210.73 **0.589
NWIs-3bRWCntree = 2, ntry = 4 0.98 ***0.0110.90 ***0.01910.91 ***0.0220.85 ***0.0230.91 ***0.0230.88 ***0.026
GWCFntree = 2, ntry = 10.96 ***0.0080.85 ***0.01210.84 ***0.0190.80 **0.0200.83 ***0.0200.75 **0.023
GYntree = 3, ntry = 1 0.98 ***0.1390.87 ***0.29210.85 ***0.4390.82 ***0.4720.85 ***0.4860.79 **0.517
NDVIs-3bRWCntree = 6, ntry = 5 0.91 ***0.0180.79 **0.02910.80 **0.0330.75 **0.0340.86 ***0.0310.77 **0.034
GWCFntree = 2, ntry = 2 0.88 ***0.0160.73 **0.01920.78 **0.0220.69 **0.0230.80 **0.0230.71 **0.025
GYntree = 1, ntry = 50.90 ***0.3480.75 **0.43430.82 ***0.4750.70 **0.5640.82 ***0.5220.73 **0.597
All group of SRIs RWCntree = 13, ntry = 2 0.97 ***0.0140.87 ***0.01940.89 ***0.0240.83 ***0.0300.93 ***0.0250.83 ***0.035
GWCFntree = 1, ntry = 50.93 ***0.0130.79 **0.01740.83 ***0.0190.76 **0.0220.82 ***0.0210.76 **0.029
GYntree = 2, ntry = 30.95 ***0.2530.80 **0.37930.84 ***0.4520.78 **0.5340.85 ***0.5190.79 **0.531
**, ***: indicate significance at p ≤ 0.01 and 0.001, respectively. The full names of different types of SRIs are listed in Table 2.
Publisher’s Note: MDPI stays neutral with regard to jurisdictional claims in published maps and institutional affiliations.

