Article

Impacts of Feedwater Quality Change on the Oldest Continuously Operated Brackish-Water Reverse Osmosis Desalination Plant in the United States

Emergent Technologies Institute, U.A. Whitaker College of Engineering, Florida Gulf Coast University, 16301 Innovation Lane, Fort Myers, FL 33913, USA
*
Author to whom correspondence should be addressed.
Water 2021, 13(19), 2654; https://doi.org/10.3390/w13192654
Submission received: 25 August 2021 / Revised: 20 September 2021 / Accepted: 22 September 2021 / Published: 26 September 2021
(This article belongs to the Special Issue Groundwater Flow Modeling in Coastal Aquifers)

Abstract

:
Brackish groundwater is abundant in many coastal zones of the world. The water can be economically treated with low-pressure reverse osmosis. A key issue is the stability of the feedwater pumped from groundwater systems. Commonly, groundwater solute-transport models are used to evaluate the long-term changes in salinity with time that impact brackish-water reverse osmosis (BWRO) desalination system process design. These models are run to assess changes over a 20- to 40-year period. The City of Cape Coral, Florida operates two regional BWRO facilities with the South Plant being the oldest continuously operated system in the world. This facility has a capacity of 68,182 m3/d and can treat raw water with a total dissolved solids (TDS) concentration up to 4000 mg/L. Two solute transport models were constructed to evaluate future salinity change in the groundwater source. The first model conducted in 1991 produced a range of probable changes with a high, most probable (mid), and low range. Actual data confirm the low range of the model produced an accurate result (within 15%) and that the 4000 mg/L threshold would not be exceeded until beyond 2031. The second modeling effort conducted in 2014 suggested that the 4000 mg/L TDS threshold would be reached in 2018, which did not happen. The use of real data and regression analyses for all wells suggests that the 4000 mg/L TDS concentration will not be exceeded until after 2060. Once the TDS threshold is reached, the plant would require a process change to allow treatment of higher TDS water. The current analysis shows that plant process design modification would not be required for up to 40 years into the future. The standard conceptual model assuming predominantly upward recharge during pumping was accurate with the addition of an enhanced zone of leakage caused by a fracture zone or a fault. A key issue that contributed to the success of the facility was the use of groundwater solute transport modeling prior to the final design of the membrane process during plant expansions.

1. Introduction

Limited supplies of freshwater occur in many regions of the world, wherein rapid population growth in combination with the occurrence of sparse water resources necessitate the development and use of alternative water sources, particularly in coastal areas [1]. In many areas of the United States and other global regions, saline groundwater occurs in abundance within a number of regional aquifer systems [2]. Where the quality of water in a saline-water aquifer has a salinity of less than about 8000 mg/L, it can be economically treated using the brackish-water reverse osmosis (BWRO) desalination process [3]. In southern Florida, the use of BWRO desalination technology has become common with about 40 facilities currently being operated [4,5].
The City of Cape Coral (City) in southwestern Florida currently utilizes low-pressure reverse osmosis membranes for desalination of brackish groundwater from the Lower Hawthorn Aquifer, which is the uppermost unit in the Floridan Aquifer System [6,7,8,9]. This facility has been in continuous operation since 1976, which makes it the currently oldest, continuously operated BWRO plant in the United States [10,11].
Two brackish-water reverse osmosis (BWRO) desalination facilities are used to supply all of the drinking water to the City. The combined production capacity of the two facilities is 113,637 m3/d. The South BWRO facility actually contains two BWRO plants operated simultaneously with a combined capacity of 68,182 m3/d.
The South Reverse Osmosis Plant (SRO) operates efficiently to treat feedwater with a total dissolved solids (TDS) concentration of less than 4000 mg/L (upper limit of current process design). According to past solute transport modeling of the aquifer tapped for feedwater, the water quality will become more saline over time and will exceed 4000 mg/L [12,13]. A general conceptual model that describes how the production aquifer recharges is shown in Figure 1. Note that pumping of the production aquifer causes higher salinity water from deeper aquifers to move upwards into the production aquifer over a long period. Therefore, in the future, the City will experience a progression of low- to higher-pressure RO membrane system and will need to utilize a combination of pretreatment strategies, energy recovery, and possible blending of less saline water to lower the TDS concentration. Generally, the higher the membrane feedwater pressure on the RO membranes, the greater amount of energy will be required for the RO process. As the BWRO treatment water recovery efficiencies decline over time due to higher chloride and TDS concentrations in the feedwater, the higher-pressure RO system will require more raw water wells to produce the same amount of finished potable water than is currently being produced.
Increased concentration of TDS also has other impacts on the operation of a BWRO facility. As the TDS concentration increases, the optimal operation of the plant declines [14,15]. The reduced efficiency in the treatment process can cause some select ions to pass through the membranes at undesirable concentrations [16], and increased use of chemicals is required to control potential scaling of the membranes with calcium carbonate [17]. A decline in treatment efficiency also increases energy consumption [18,19], which results in higher overall treatment costs [3].
Figure 1. General model of groundwater flow during aquifer pumping showing the upwards recharge of the pumped aquifer Drendal [20].
Water 13 02654 g001
The primary objective of this research is to evaluate the rate of change in water quality of the production wells using actual data and to project the future timeframe when a change in the process design will be necessary to maintain the facility capacity. In addition, the projections made on future water quality changes based on collected data are compared to past water quality projections made using solute-transport modeling of the aquifer system. This is a rare opportunity to “audit” the original models to assess the conceptual model used and if it is correctly applied to the aquifer system being used.

2. Background

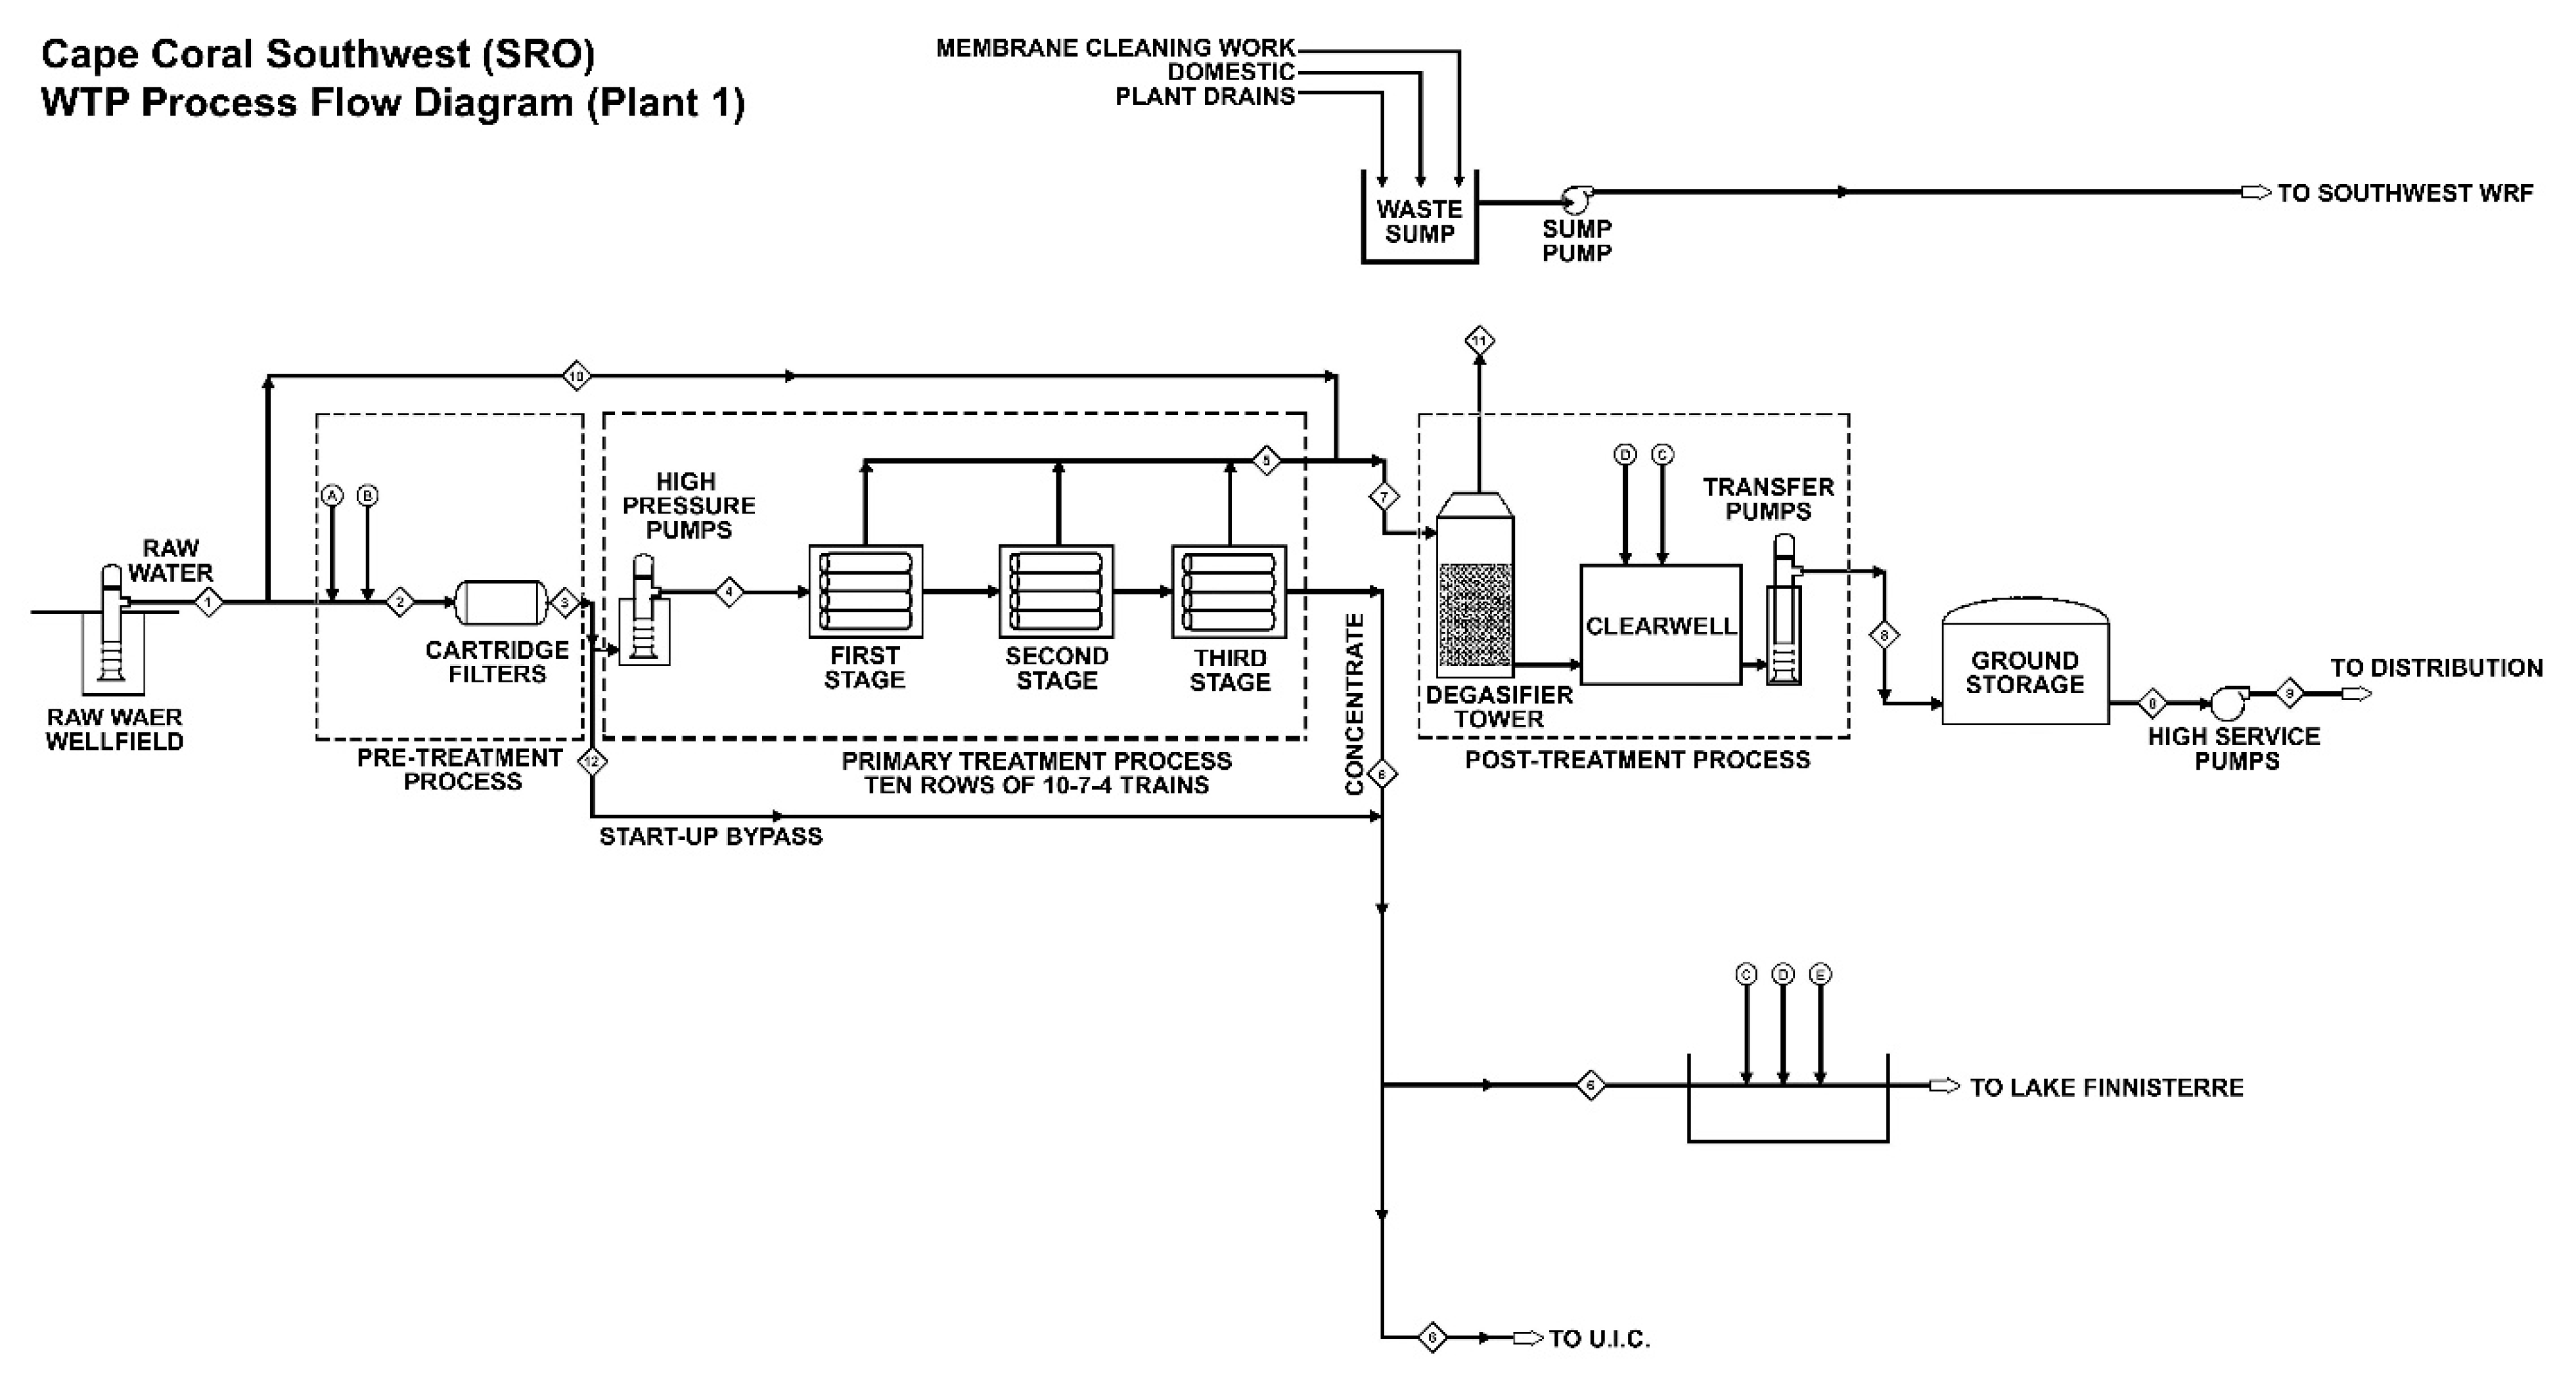
2.1. Description of the BWRO Facility

A critical aspect of the design and operation of any BWRO plant is the coordination between the quality of the raw water supply with its variation in time and the process design of the desalination plant [21,22,23]. Most of the BWRO plants located in Florida use brackish water extracted from close to the top of the Floridan Aquifer System [17,18,19]. Most commonly, the TDS in the upper part of the Florida Aquifer System is relatively low and increases in concentration with depth in the aquifer system [21,24,25,26]. The confining units within the Floridan Aquifer System below the uppermost confining unit are relativity thin and leaky. When the production aquifer (Lower Hawthorn Aquifer) is pumped, it is recharged primarily from the bottom upwards (Figure 1). Since the aquifers underlying the pumped aquifer contain higher concentrations of TDS, the production aquifer exhibits an increase in salinity with time [21,22,23,24,25].
The BWRO process design of the South Plant consists of a groundwater intake (wells), followed by pretreatment with the addition of sulfuric acid and polyacrylic acid (antiscalant), followed by cartridge filters to remove any particulates and, then, a three-stage BWRO process using 11 bar (160 psi) of pressure (Figure 2). A blend of raw water (about 19%) is added to the permeate to raise the hardness and TDS and to improve treatment efficiency. The combined permeate and blend water is, then, degassed to remove hydrogen sulfide, and the pH is adjusted upwards. The conversion efficiencies for plants 1 and 2 are 75% and 80%, respectively. With consideration of the added blend of raw water, the overall treatment efficiency is 81%. Again, the current design maximum for the feedwater TDS is 4000 mg/L. The concentrate is pumped into a deep injection well for disposal.

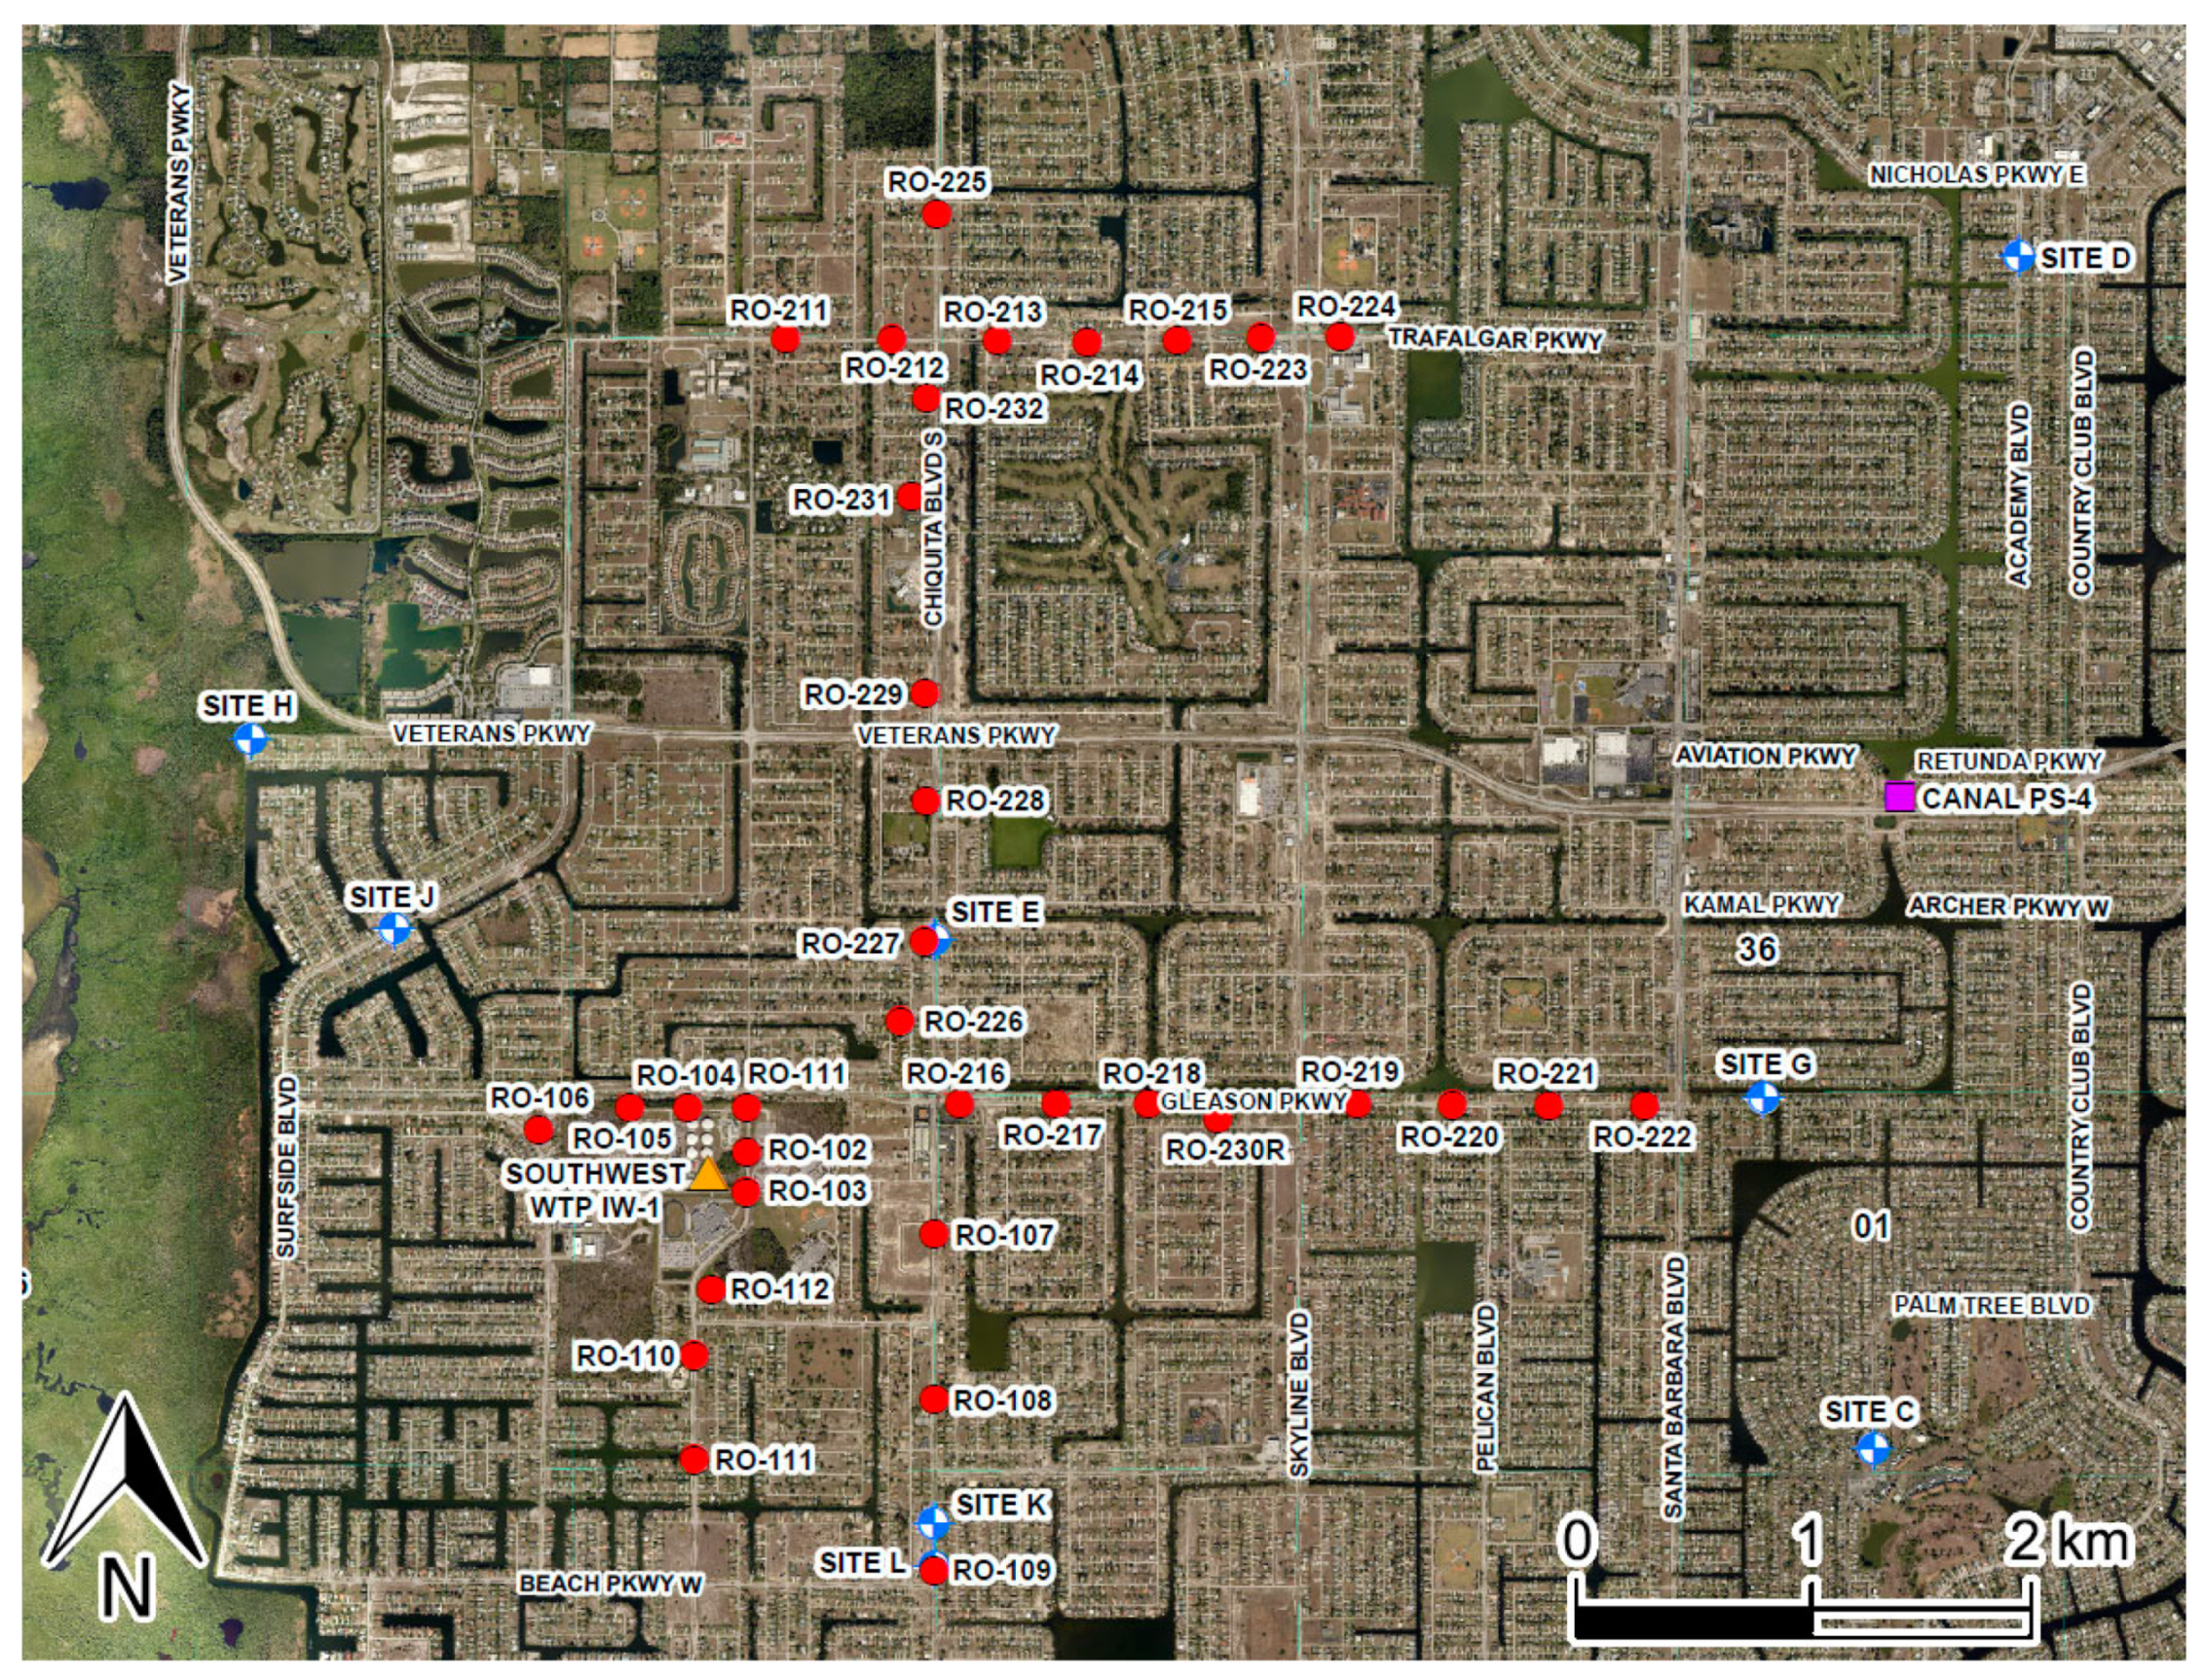
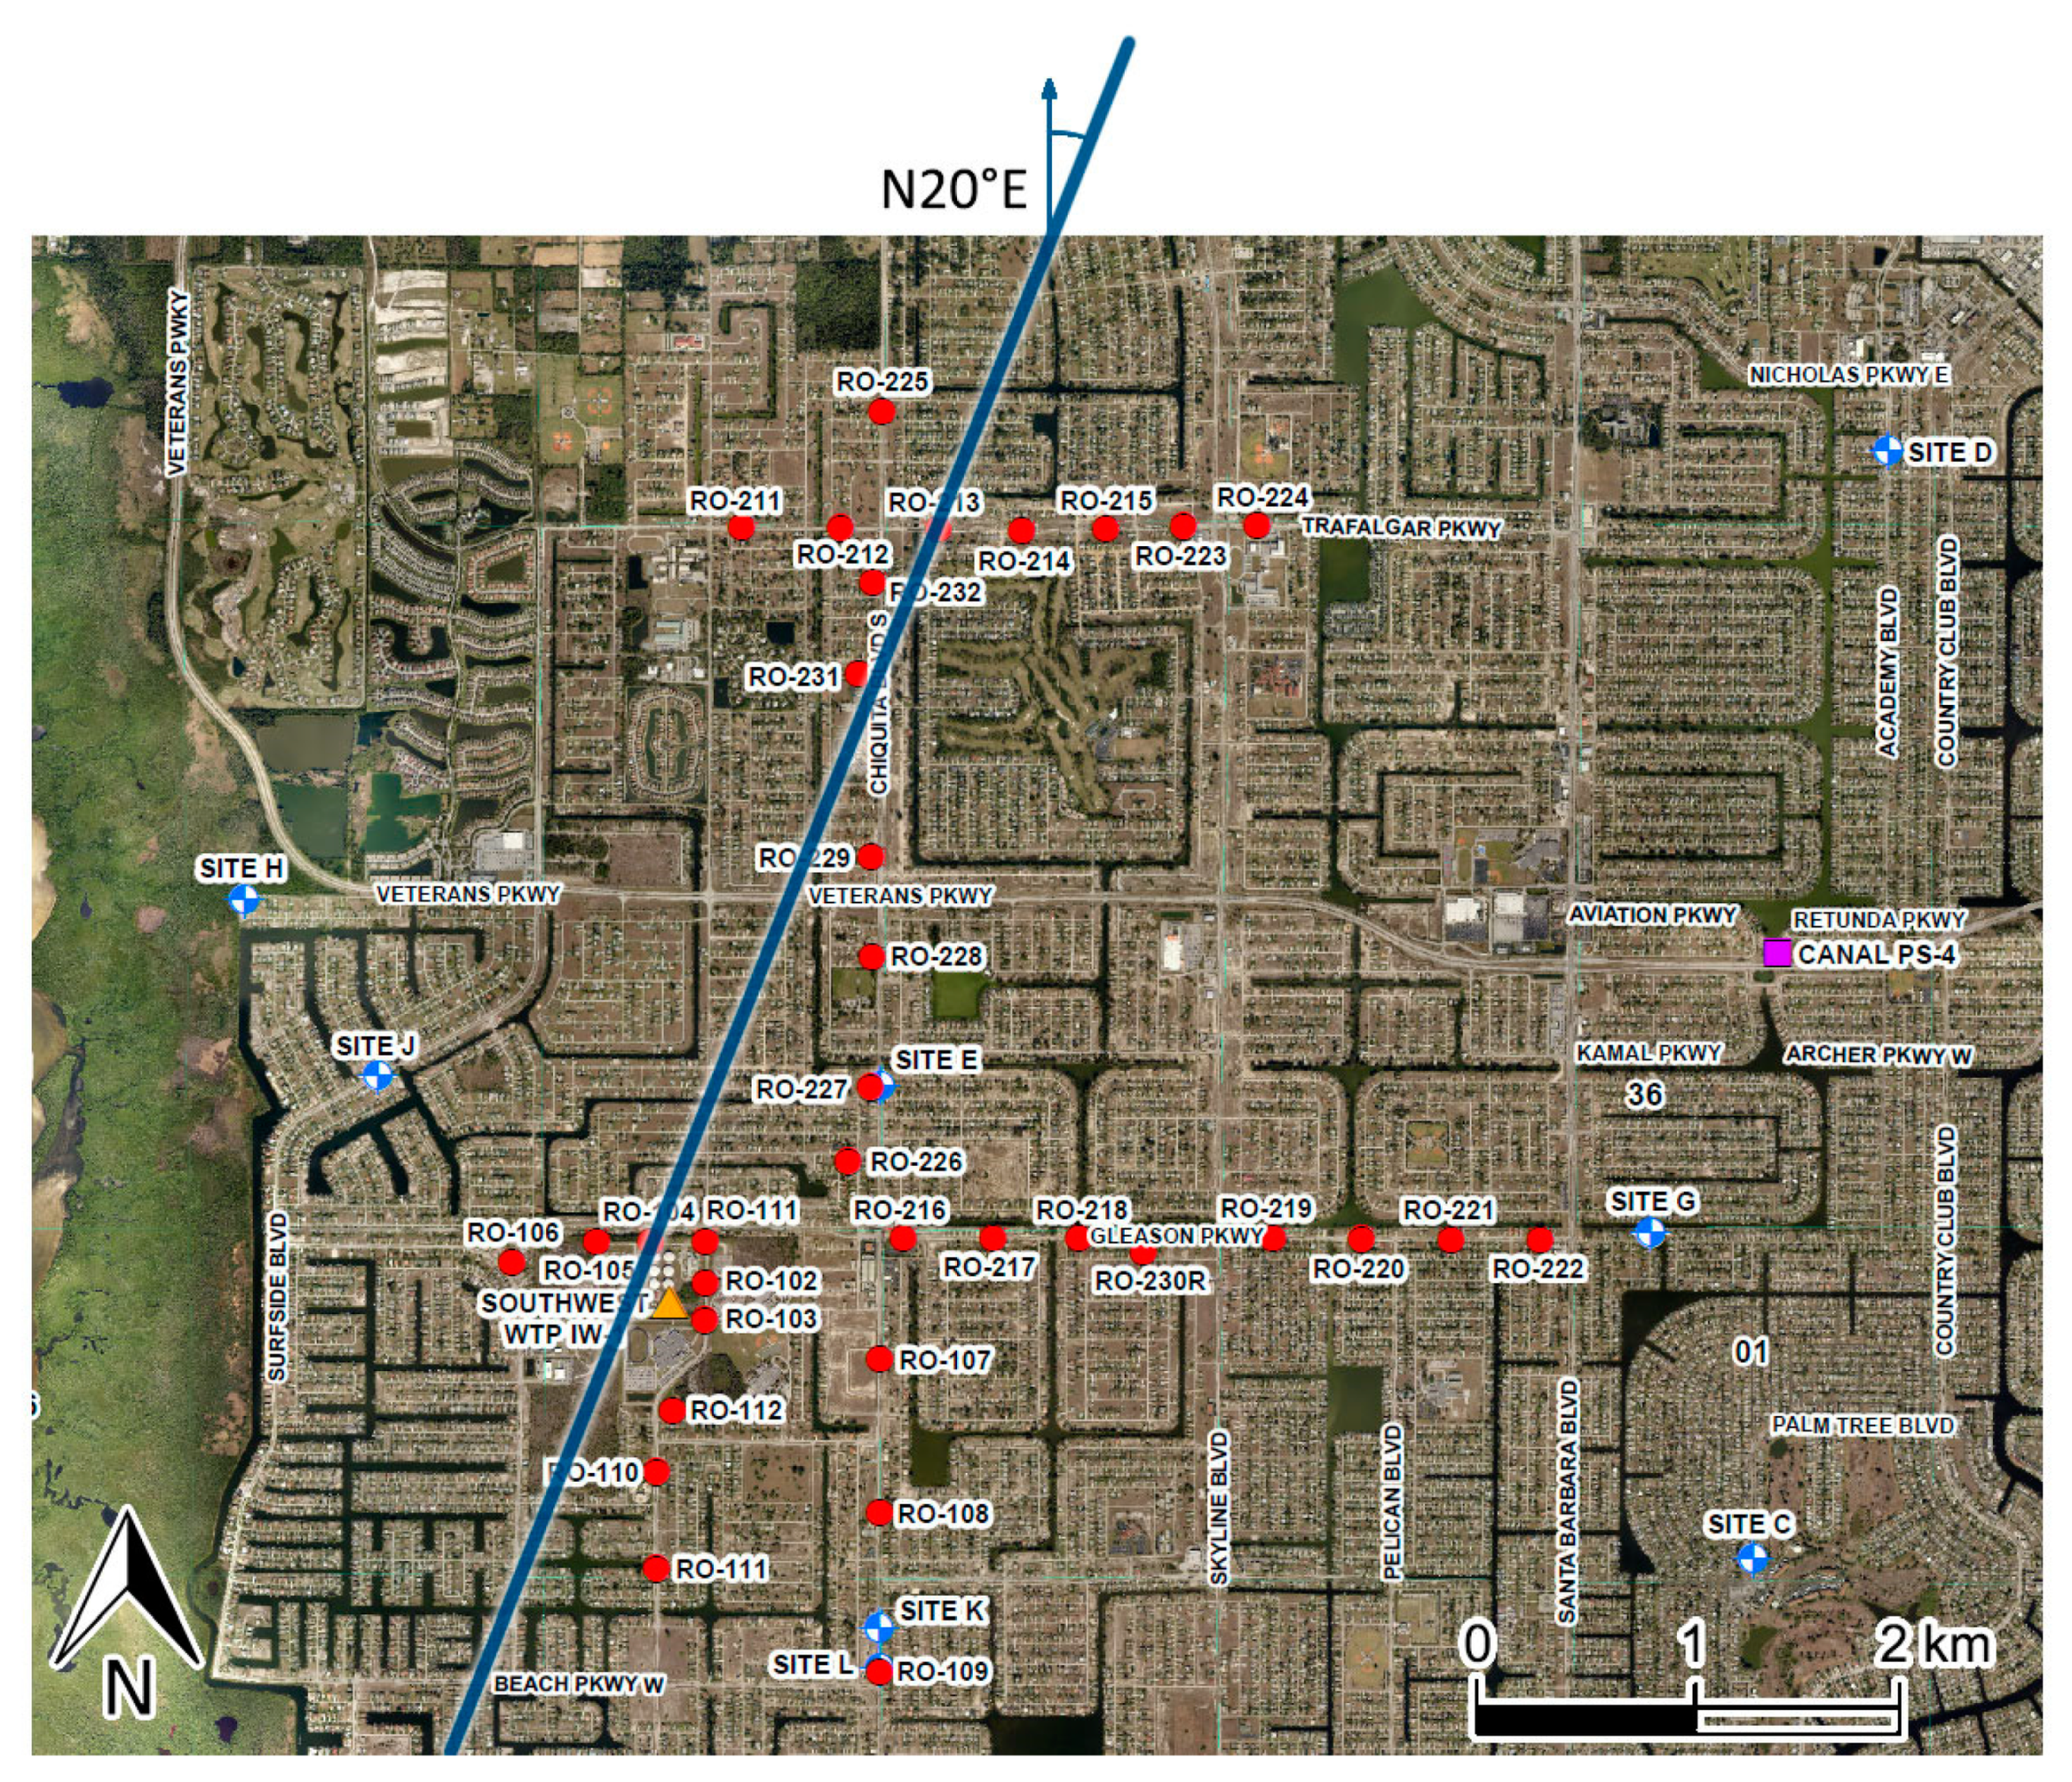
2.2. Description of the Feedwater Wellfield

The BWRO facility is a combination of two separate plants that receive raw water from production wells, located in the South Wellfield. Plants 1 and 2 are supplied by a total of 34 production wells with 12 required for plant 1 and 22 for plant 2. Well locations are shown in Figure 3, and the well construction details are given in Table 1.

2.3. Water Use Permit for the Feedwater Supply

The raw water use and production wells are regulated by the South Florida Water Management District (SFWMD) under Water Use Permit (WUP) number 36-00046-W. The permit was issued to the City on 19 October 2009, modified on 13 May 2014, and expires on 22 October 2029. The annual raw water allocation for the City wellfields is limited to 54,229,809 m3/year. The production rates of the brackish-water production wells range from 946 L per minute to 2839 L per minute. The two brackish BWRO plants, North (NRO) and South (SRO), have a combined production capacity of 115,833 m3/day. This drinking water capacity is adequate to supply raw water within the SFWMD WUP guidelines.
Currently, two of the production wells that supply brackish water to the SRO are out of service due to high TDS and chloride concentrations. Some of the production wells in the City North and South Wellfields are experiencing high dissolved chloride and TDS concentrations. The City is developing an updated comprehensive hydrogeologic model of the wellfields to evaluate the pumping impacts on the aquifer system to determine remedial alternatives to address deteriorating water quality. Additionally, under normal operating conditions, and over time, the brackish-water production wells gradually lose a portion of their capacity and require acidification of the interface with the aquifer to regain specific capacity. The cause of the loss of capacity is the precipitation of CaCO3 on the wall of the open hole caused by degassing of the aquifer during pumping (CO2 loss leading to oversaturation with CaCO3). The City is required to remain in compliance with WUP limiting conditions as set forth in Table 2.

3. Hydrogeology of the Floridan Aquifer System and Water Quality
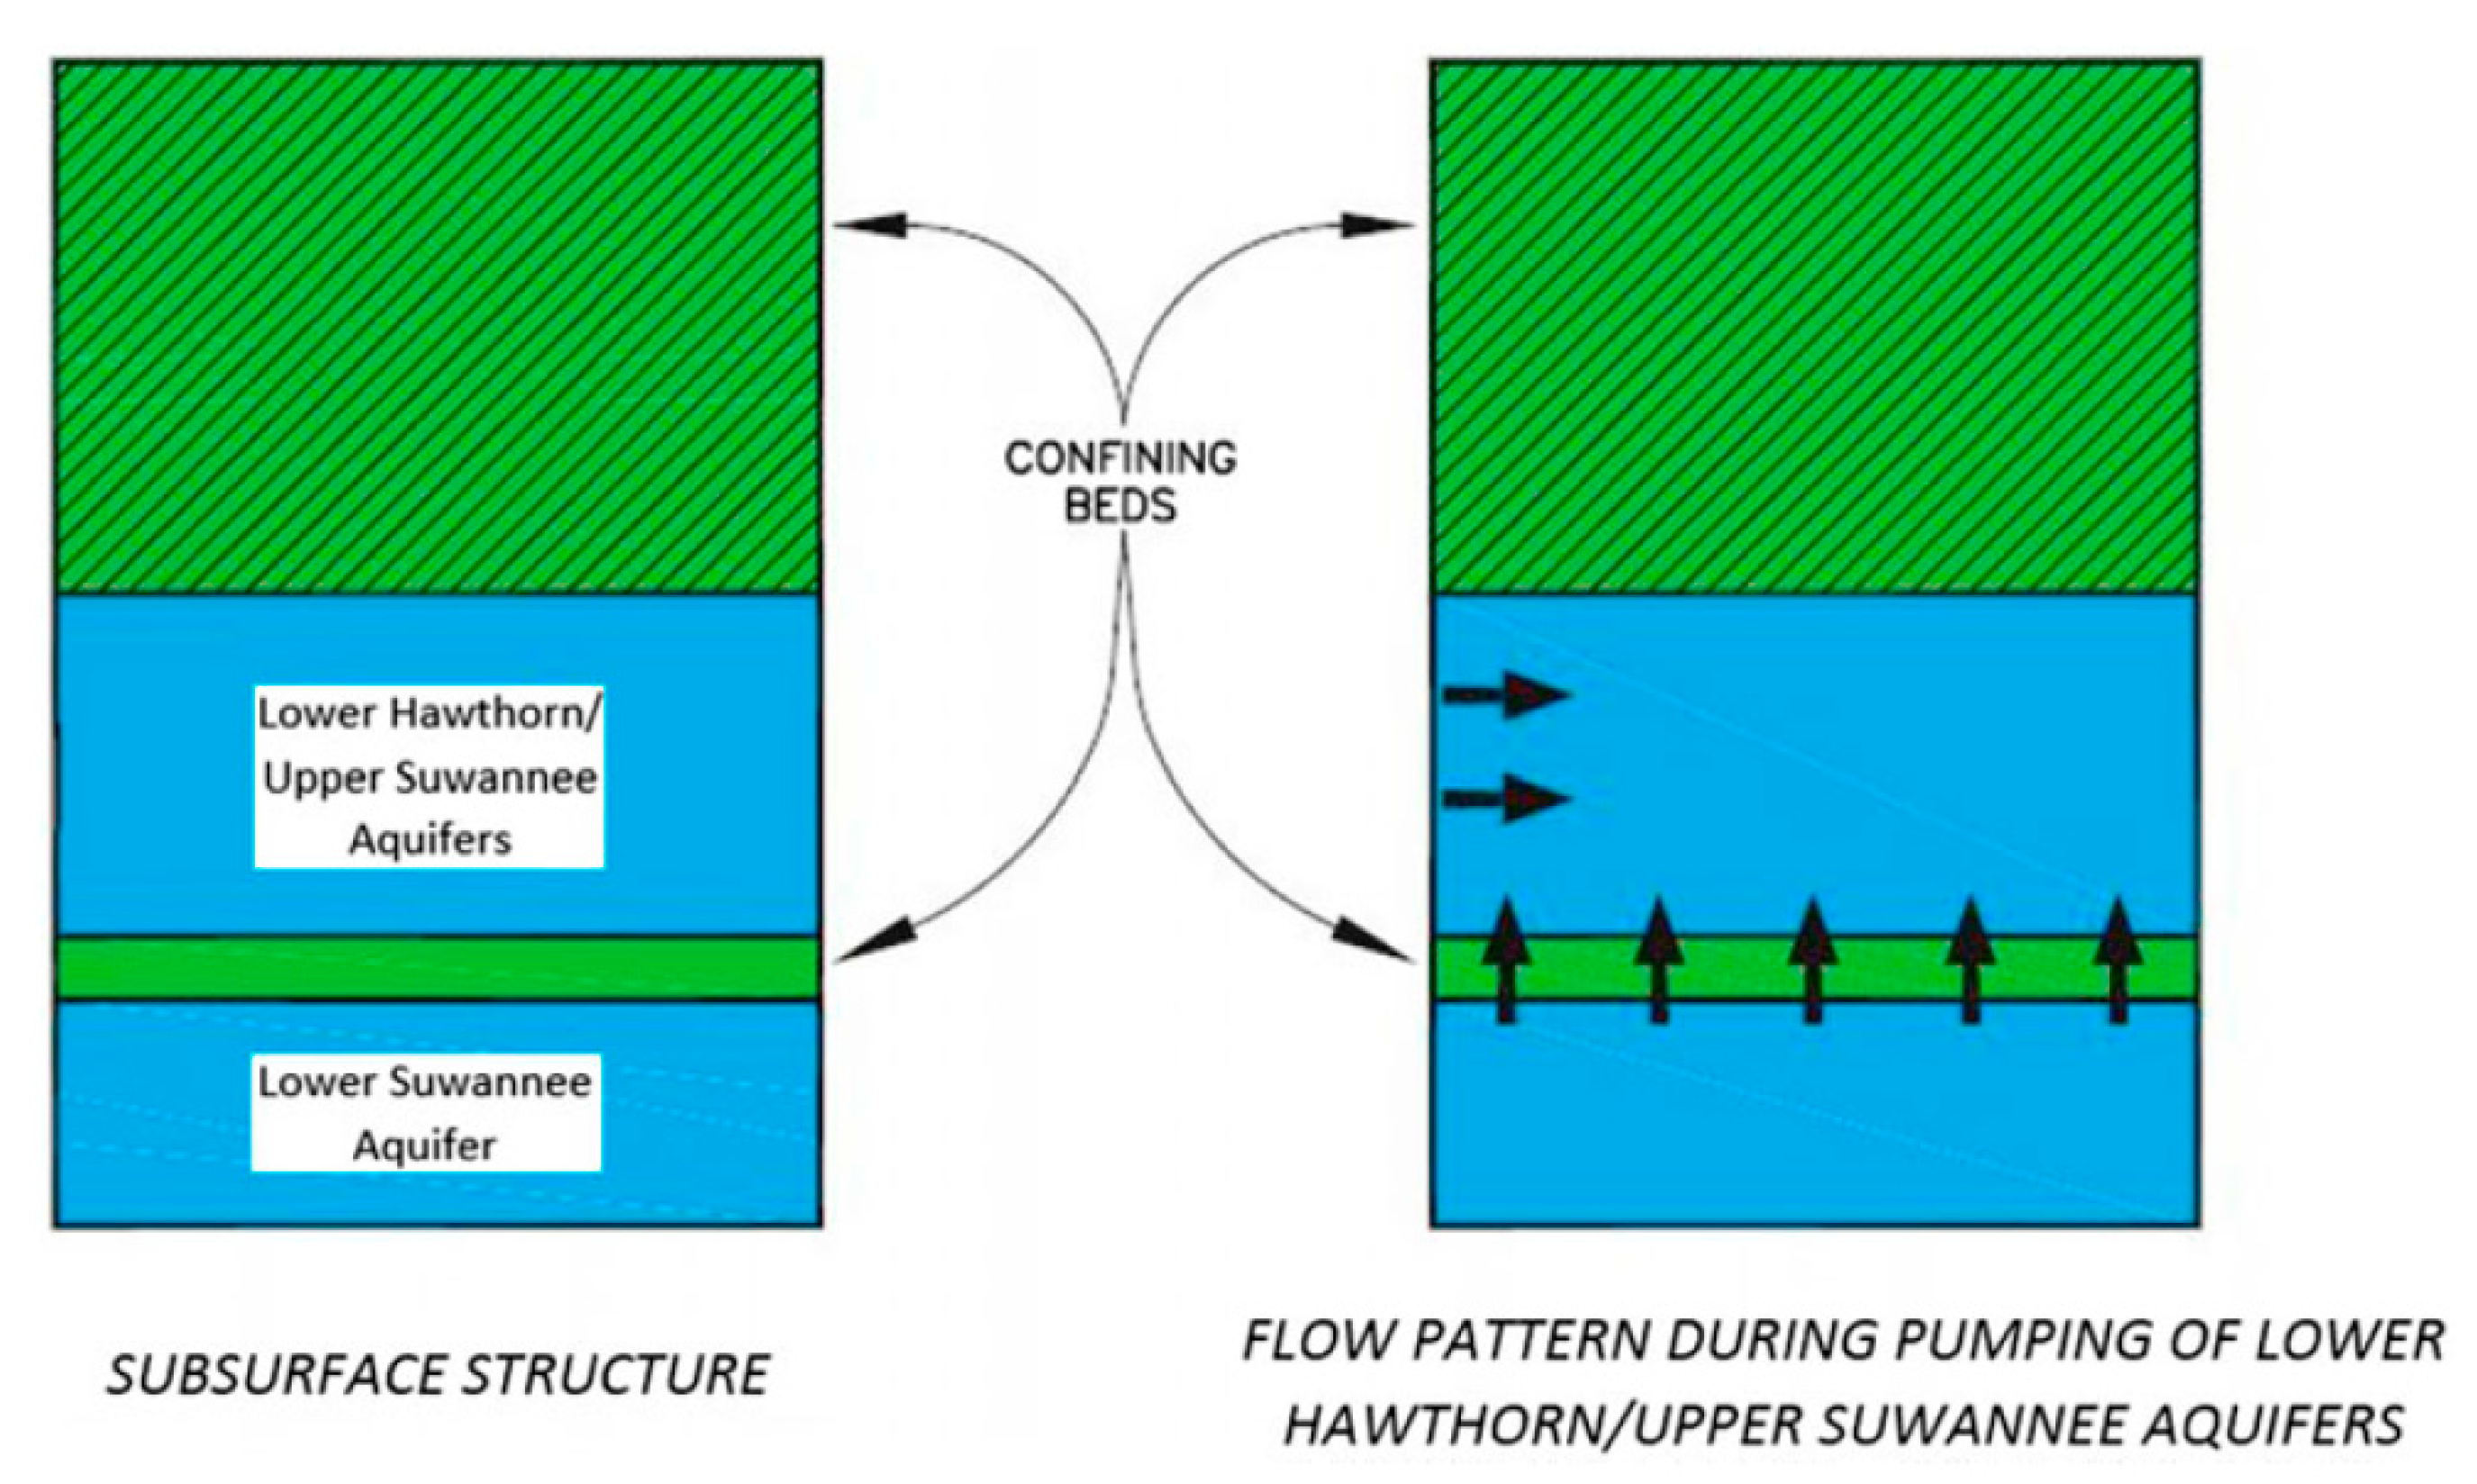
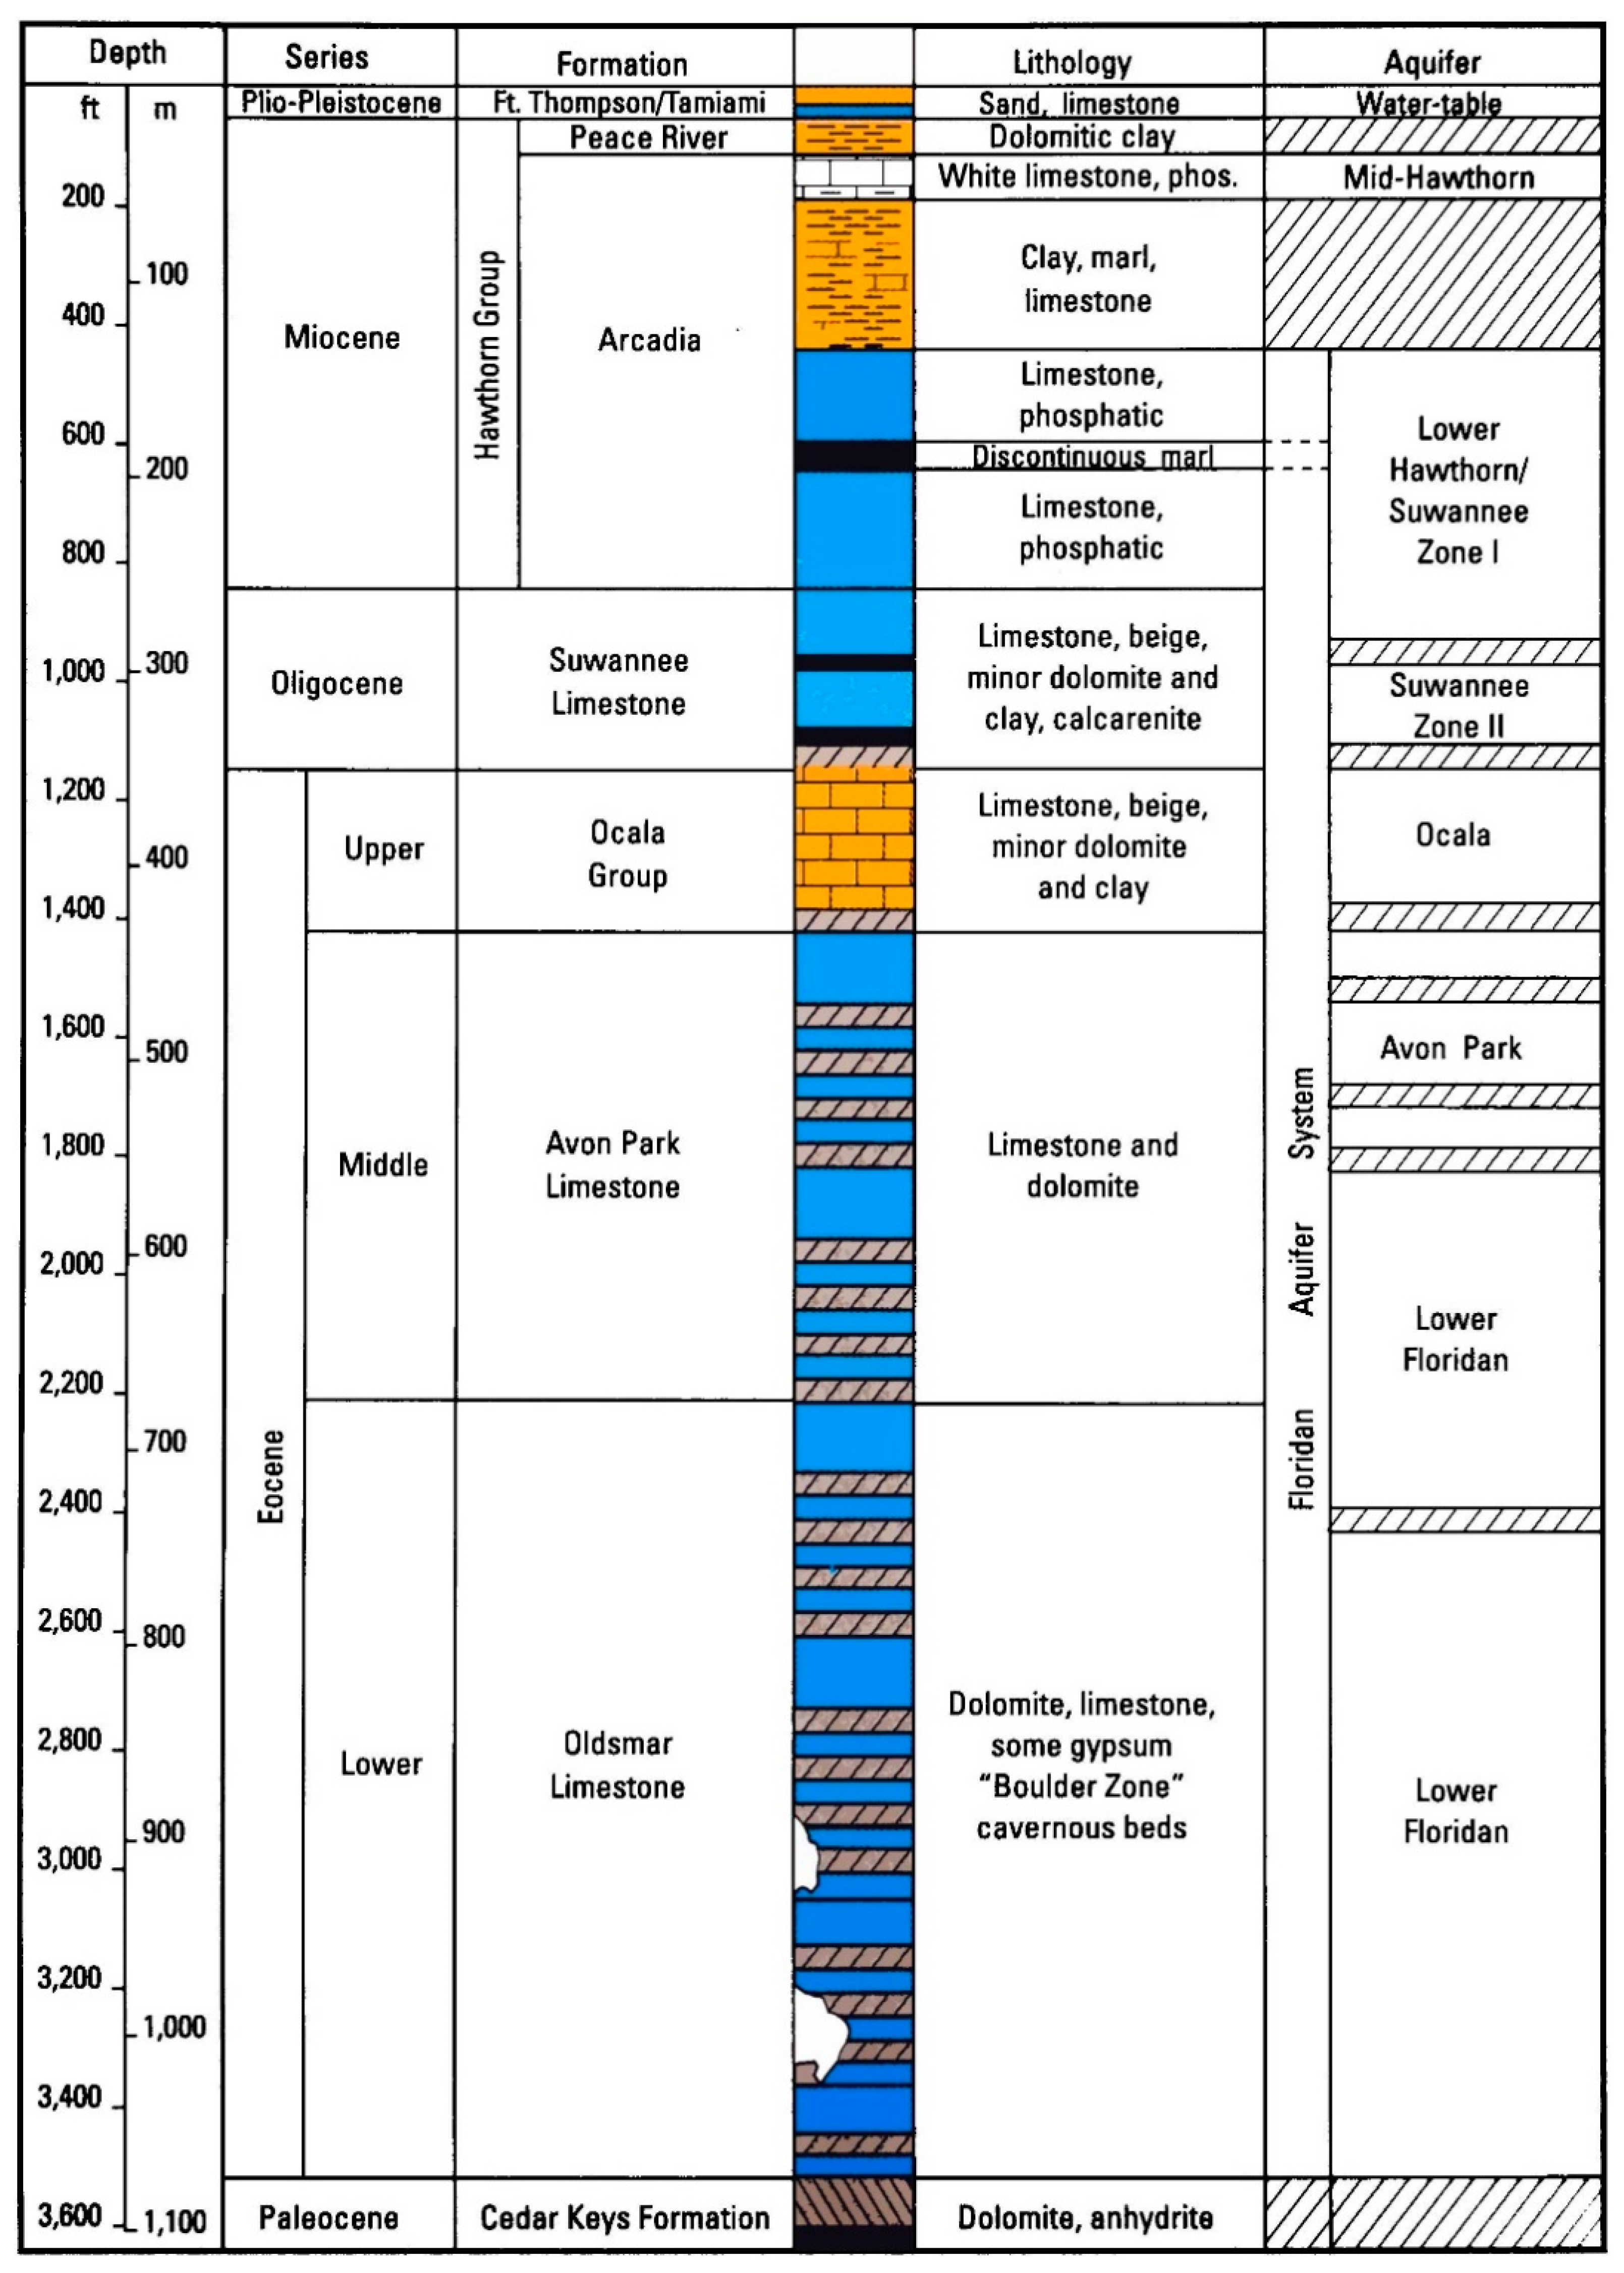
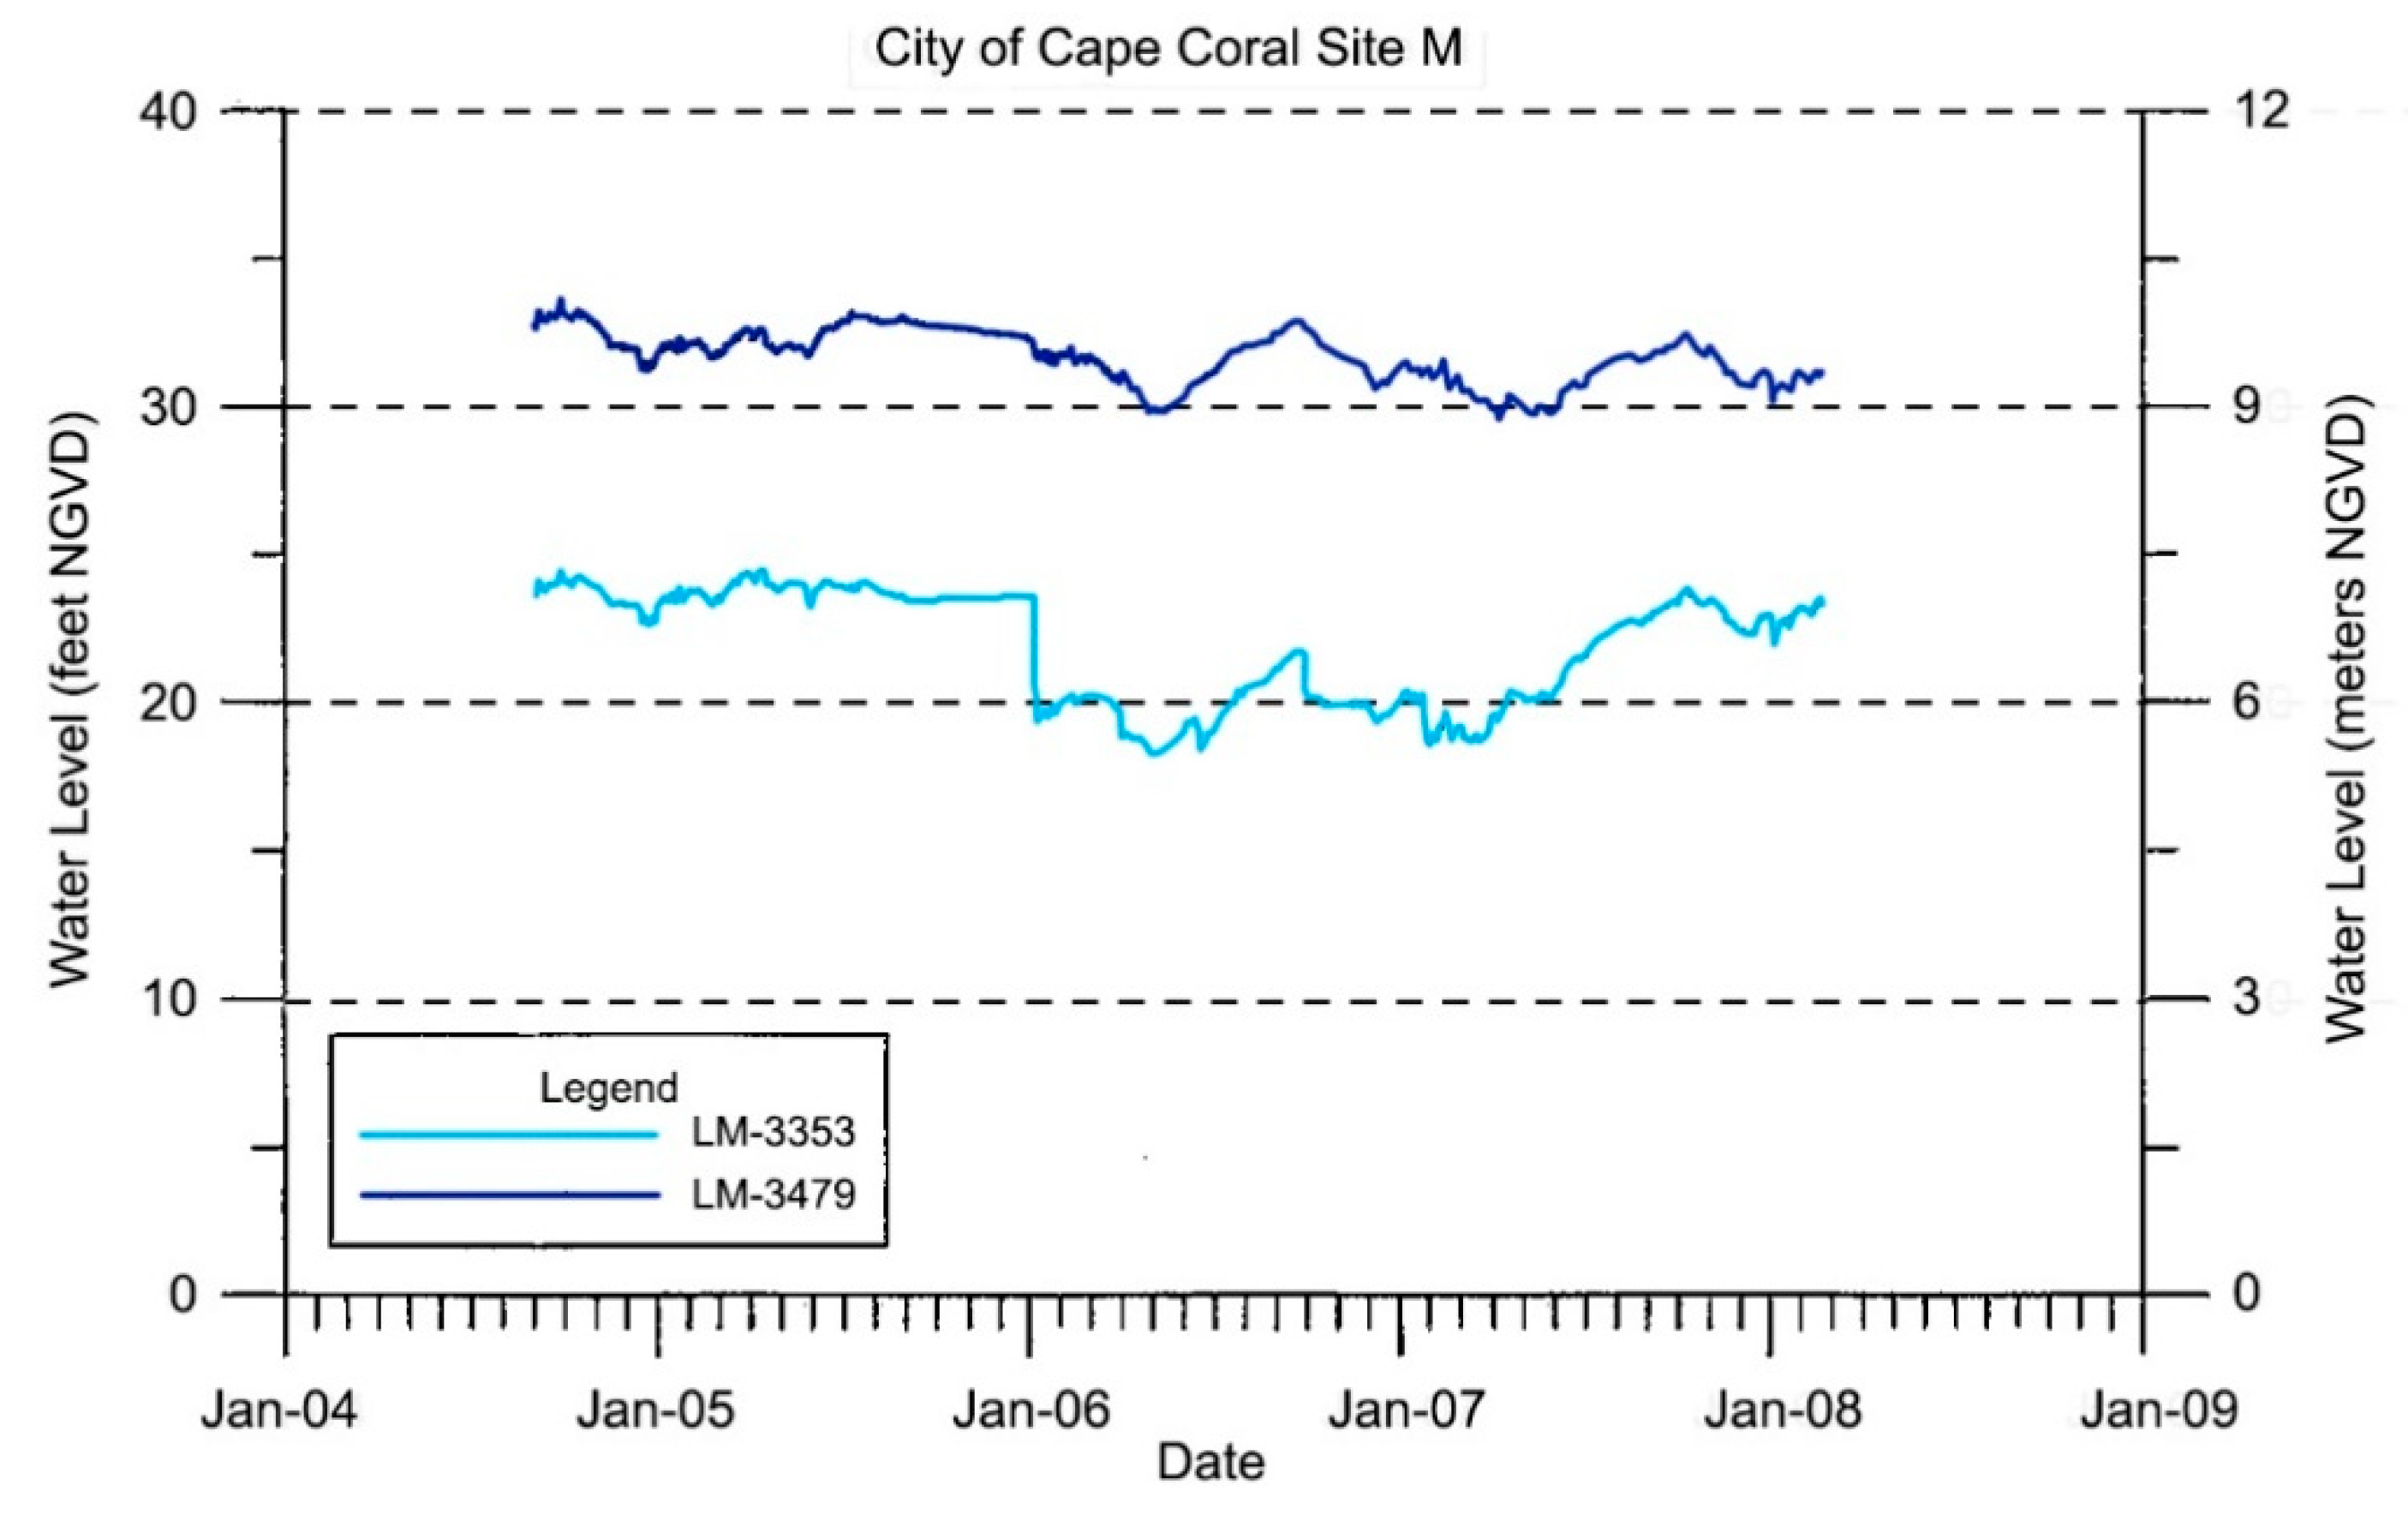
3.1. Hydrogeology

The geology and hydrogeology of Lee County, including the City of Cape Coral, have been described in a number of publications by the Florida Geological Survey [6,7,9,27], the U.S. Geological Survey [7,28,29], the South Florida Water Management District [8,30], and in the literature [21]. In addition, consultant studies have provided detailed analysis of the subsurface geology of Cape Coral [12,31,32,33]. Additionally, descriptions of the geology and hydrogeologic features have been provided to the City for the South and North Wellfield expansion in completion reports [26,34,35,36].
The three regional aquifer systems underlying southern Florida include the Surficial Aquifer System, the Intermediate Aquifer System (or confining unit), and the Florida Aquifer System [37]. In southeastern Florida, the Floridan Aquifer System is easily subdivided into the upper, middle, and lower parts [38]. These units are not subdivided and are discrete hydraulic units that are well-defined based on the local hydrogeology.
However, beneath the City of Cape Coral and in many areas of southwestern Florida, there are a larger number of subdivisions with the Florida Aquifer System with up to eight poorly defined aquifers (Figure 4). Regional models created by the South Florida Water Management District and the U. S. Army Corps of Engineers have tended to group the aquifers in southwest Florida to match the divisions in southeastern Florida to create a simplified model [39,40,41]. Unfortunately, the regional model created has issues with model calibration in southwestern Florida based on the simplification [12]. The subdivisions of the Floridan Aquifer System shown in Figure 4 were used in the initial planning model created for the City [12].
The primary aquifer used by the City to obtain feedwater is the Lower Hawthorn Aquifer (Figure 4 and Figure 5). Note that the Lower Hawthorn Aquifer has a minimal separation from the upper Suwannee Aquifer, so these aquifers are essentially acting as a single aquifer (Figure 4). A map showing the depth to the top of the Lower Hawthorn Aquifer is shown in Figure 6. There is more than 30 m of relief found on the top of the aquifer. There is also a considerable variation in water quality within the Lower Hawthorn Aquifer (Figure 7). In 2009, the dissolved chloride concentration varied greater than 200 mg/L and a number of abnormally high values were found particularly in the northern part of the City and in the east near the southern Cape Coral Bridge across the Caloosahatchee River (Figure 7). A known fault occurs at this location where very high-temperature and high-salinity water is moving upward from the deeper part of the Florida Aquifer System [6].
The salinity of water in the Floridan Aquifer System increases with depth [12,21]. The dissolved chloride concentration profile that was used to create the solute transport model used for planning in the City is shown in Figure 8. Note that water occurring below the Lower Suwannee aquifer would likely require a seawater membrane to be used to produce potable water. The dissolved chloride concentration in the Ocala Aquifer increases to above 10,000 mg/L. True seawater with a dissolved chloride concentration of about 19,500 mg/L does not occur until a depth near 550 m below surface within the Avon Park Aquifer.
Pumping of the Lower Hawthorn Aquifer has lowered the predevelopment potentiometric surface of the aquifer by up to 30 m in parts of the City (Figure 9). This lowering of water levels has two impacts to the operation of the City wellfields, including increasing the rate of upward movement of higher salinity water within the leaky aquifer system and capturing a greater amount of the regional flow through the aquifer, particularly in the northeastern part of the City. The greater head loss causes a higher rate of increase in feedwater salinity, while the greater capture of regional flow reduces the rate of feedwater quality change. Some recently collected water level data show that decline is not continuous throughout the City (Figure 10).

3.2. South RO Wellfield Dissolved Chloride and TDS Data Analysis

In 2009, MWH conducted a solute-transport model to assess future changes in groundwater quality [13]. Projections for individual production well TDS concentrations for the South Wellfield in the Lower Hawthorn were provided for the years 2014, 2024, and 2060 (Figure 11). Unfortunately, few details were provided on the model, the boundary conditions, the calibration, and the sensitivity analyses conducted. In addition, the method applied to the individual wells is unclear in the report.

4. Materials and Methods

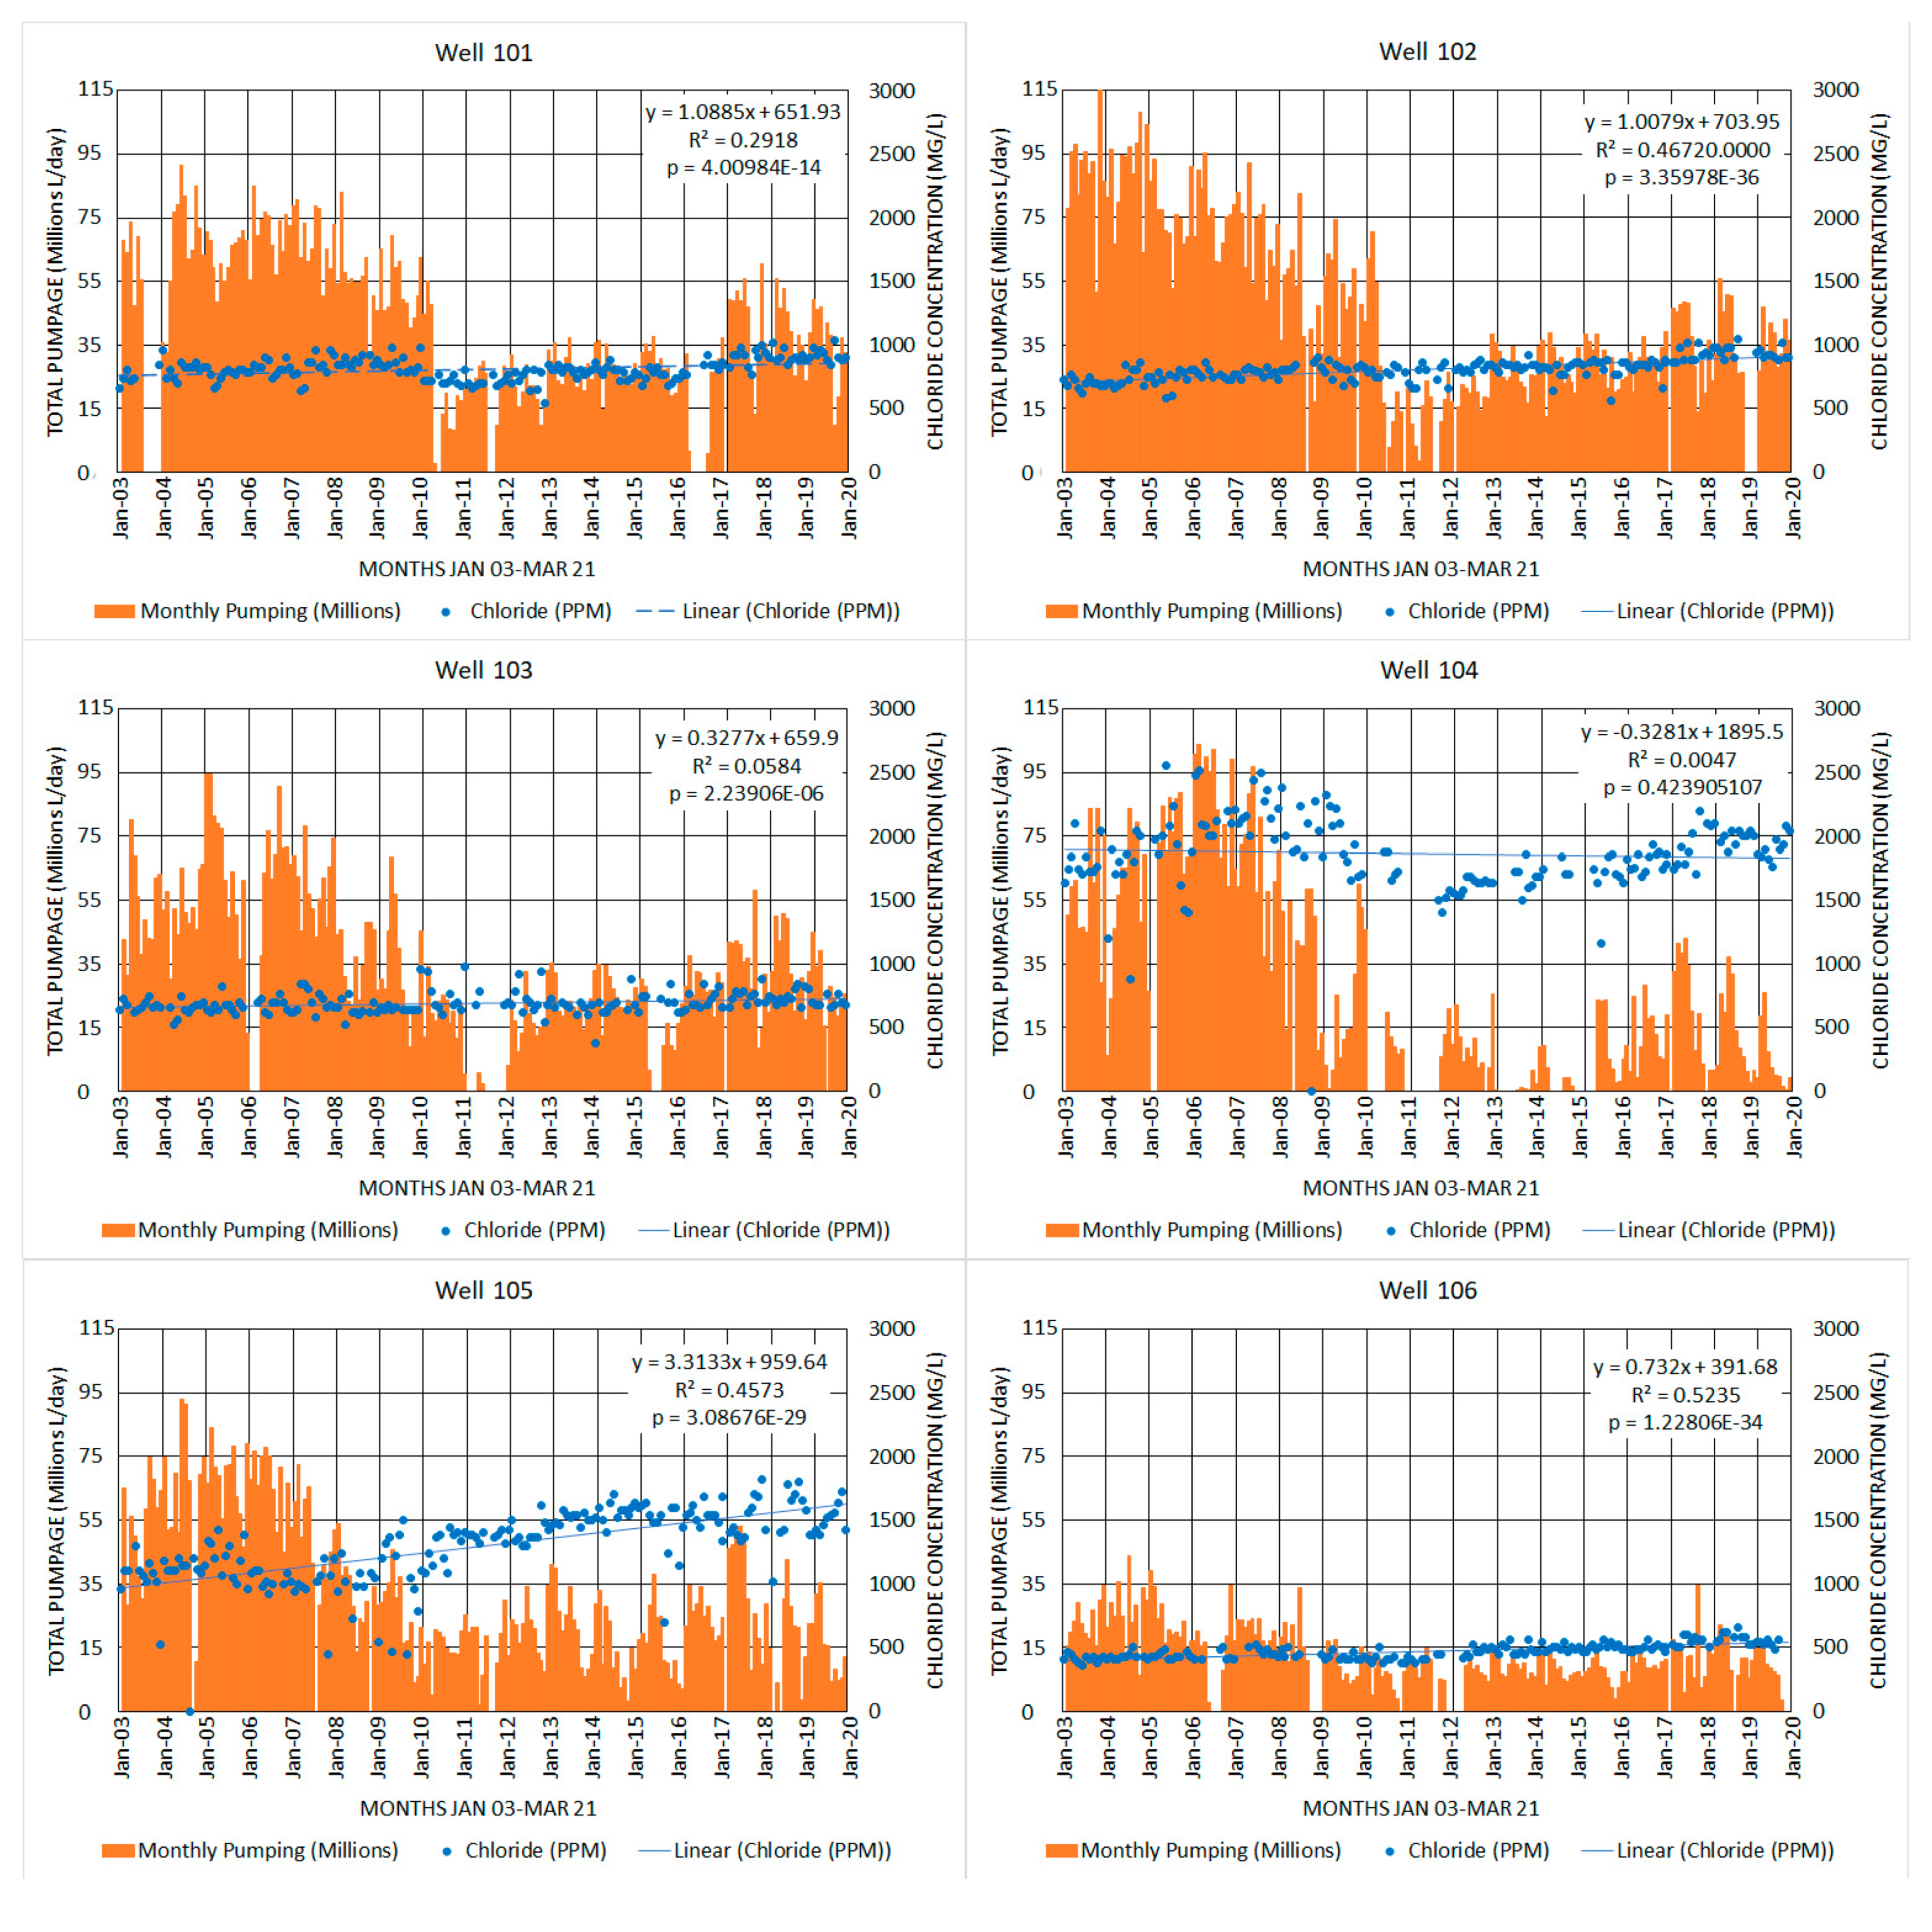
4.1. Collection of Water Quality and Pumping Data from South Cape Coral Production Wells

Well data were obtained from the City of Cape Coral Utilities Department South Wellfield operating reports. Pumping rates and monthly chloride concentrations were obtained beginning January 2003 through March 2021 (219 months). The data are based on historical monthly pumping reports from the City of Cape Coral. The well data containing monthly influent dissolved chloride concentration and pumping rates in millions of liters per day were plotted for each raw water production well. The pumping data were plotted as a bar graph showing cumulative monthly pumpage, and the dissolved chloride concentration was shown as a scatter plot.

4.2. Statistical Treatment of the Dissolved Chloride Data

A linear regression was found to be the best fit to the data, but other functions were also evaluated to ascertain if they yielded a better fit to the data (e.g., log, semilog, parabolic, hyperbolic, etc.). A linear regression analysis was conducted on the time versus dissolved chloride data. An R2 value was calculated to determine the quality of the best fit to the calculated linear regression equation, and a p-value was calculated to reveal the statistical validity of the regression equation.
Some outlier dissolved chloride and pumping data were removed based on either sampling or recording errors in the data. Some well data were not available due to wells being out of service because of high concentrations of chloride being encountered or maintenance.

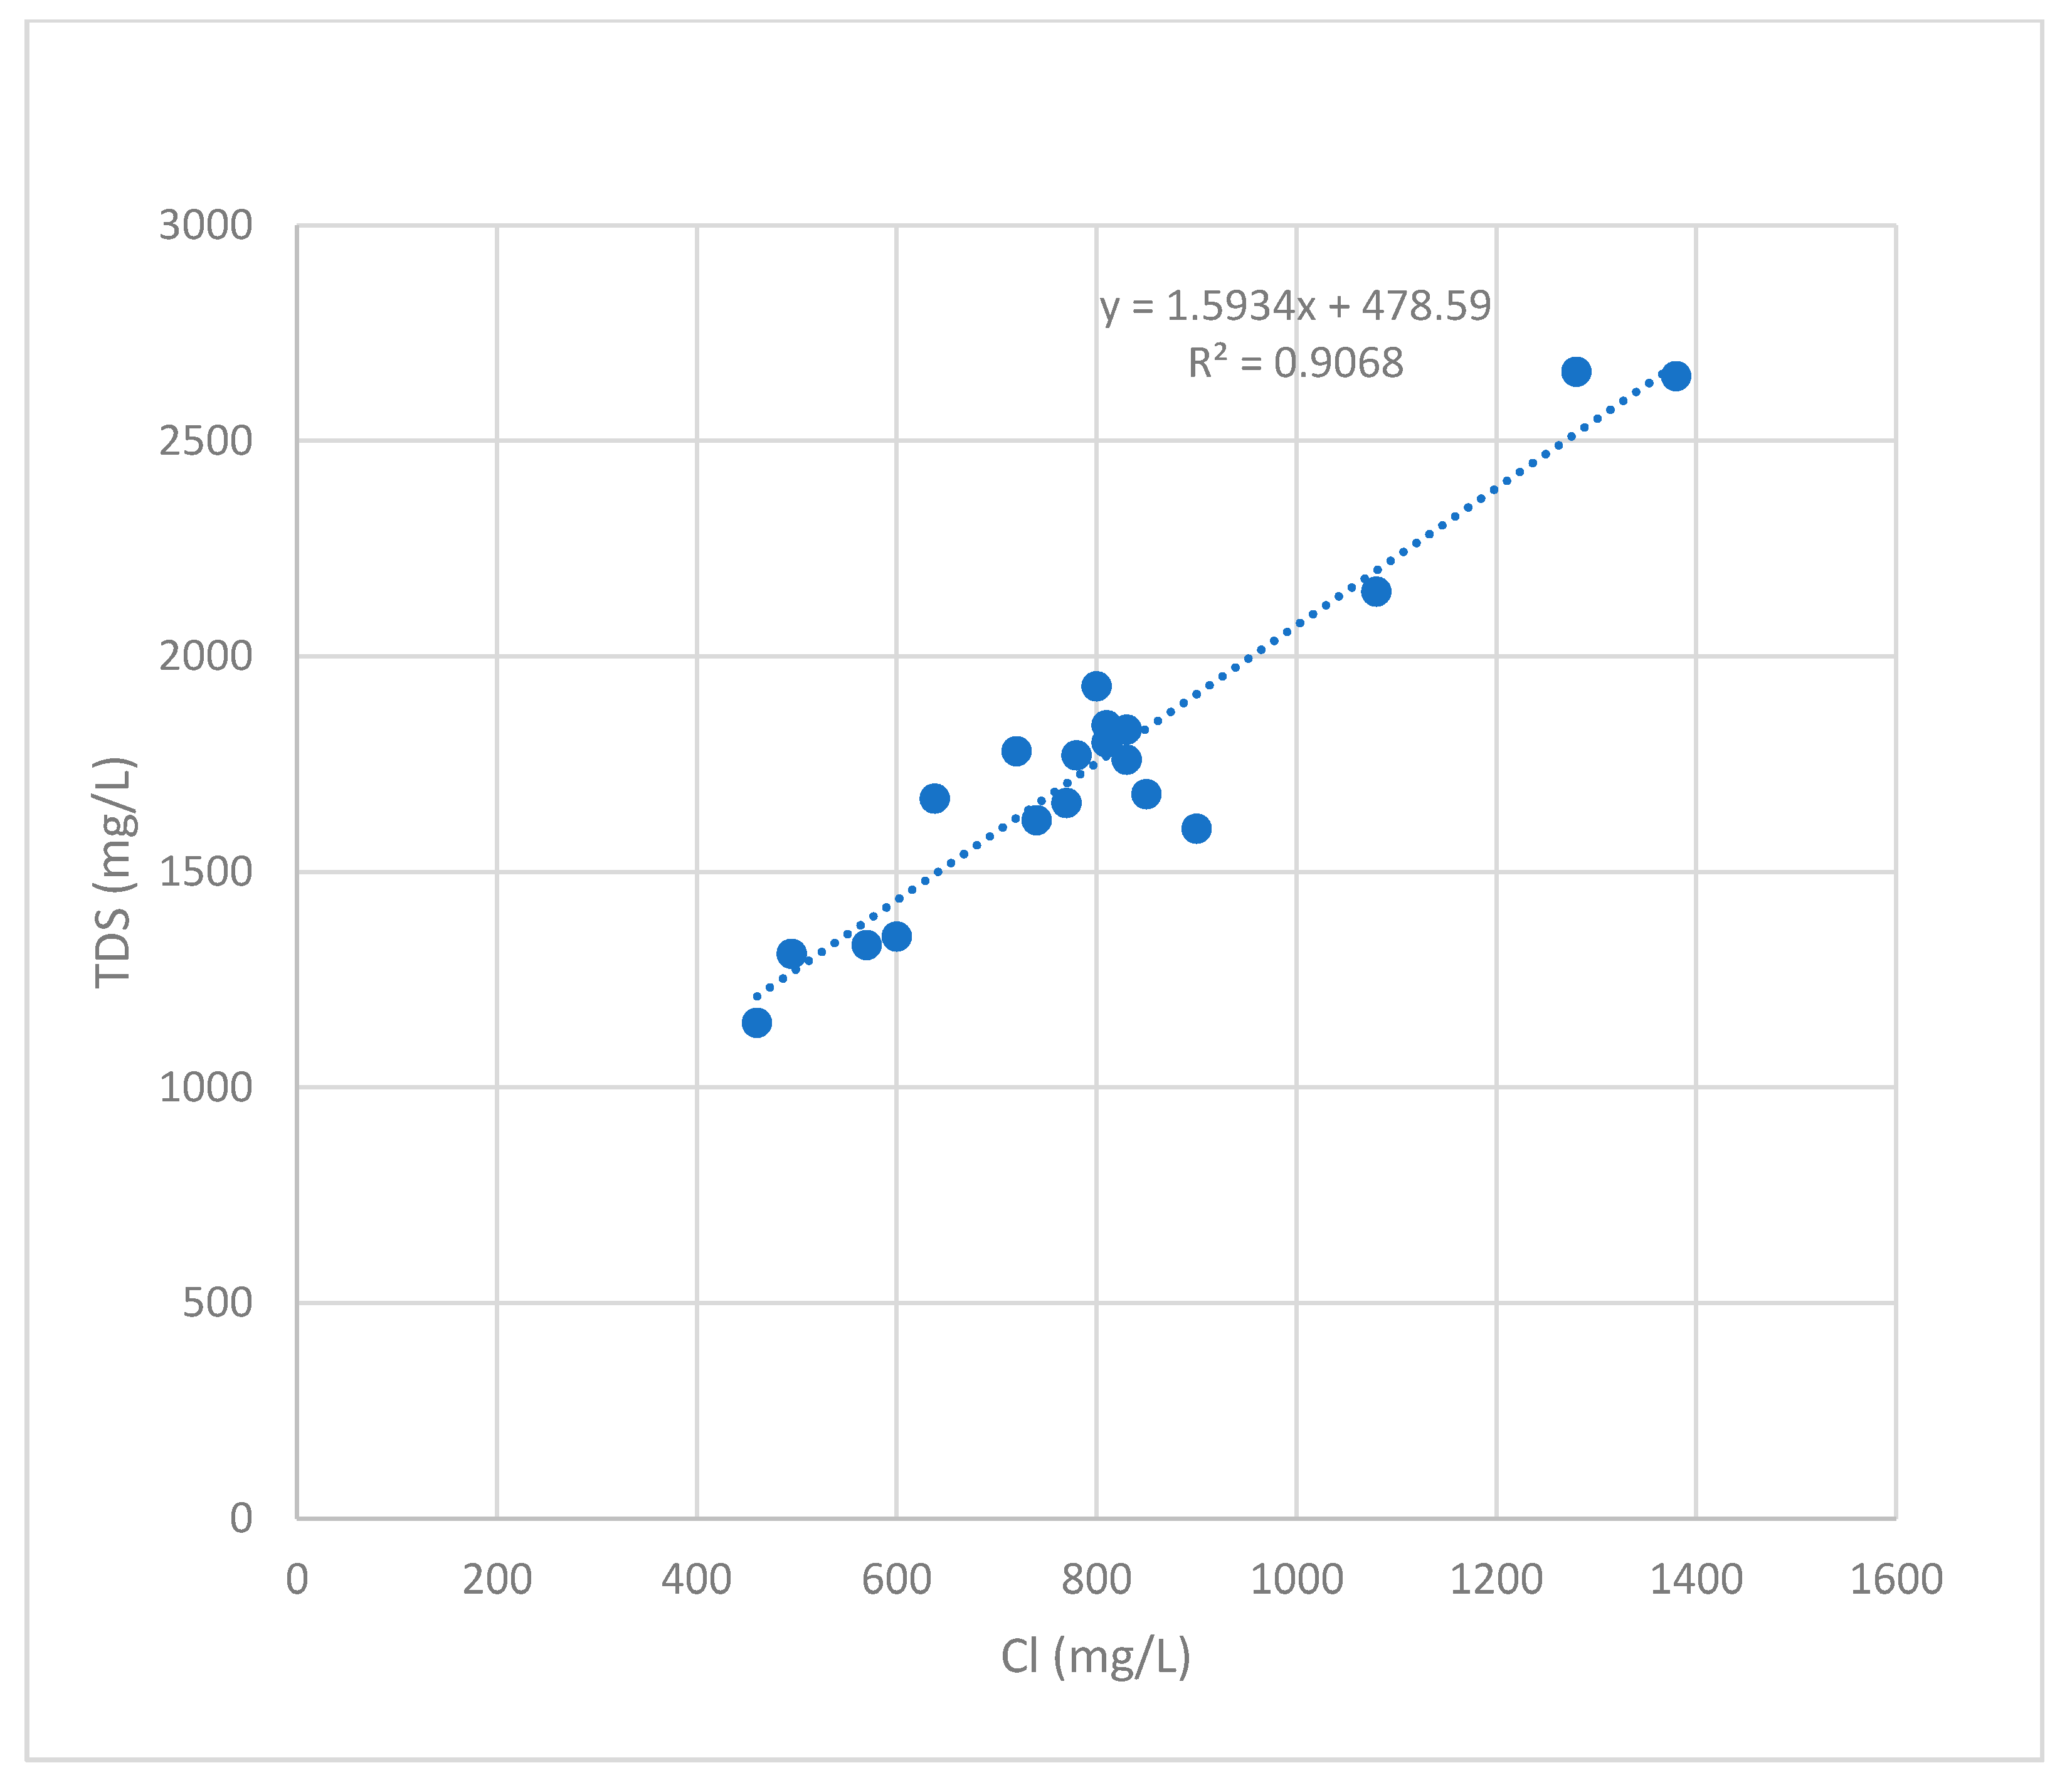
4.3. Relationship between Dissolved Chloride Concentration and Total Dissolved Solids (TDS)

The ratios between various cations and anions in normal seawater are very constant. However, in brackish groundwater, the interaction between the rock and water changes the ratios. Therefore, the relationship between dissolved chloride concentration and TDS must be established for each aquifer based on the collection of actual data. The relationship for the brackish water beneath the City was established for data collected on the North Wellfield (Figure 12) [42].

5. Results

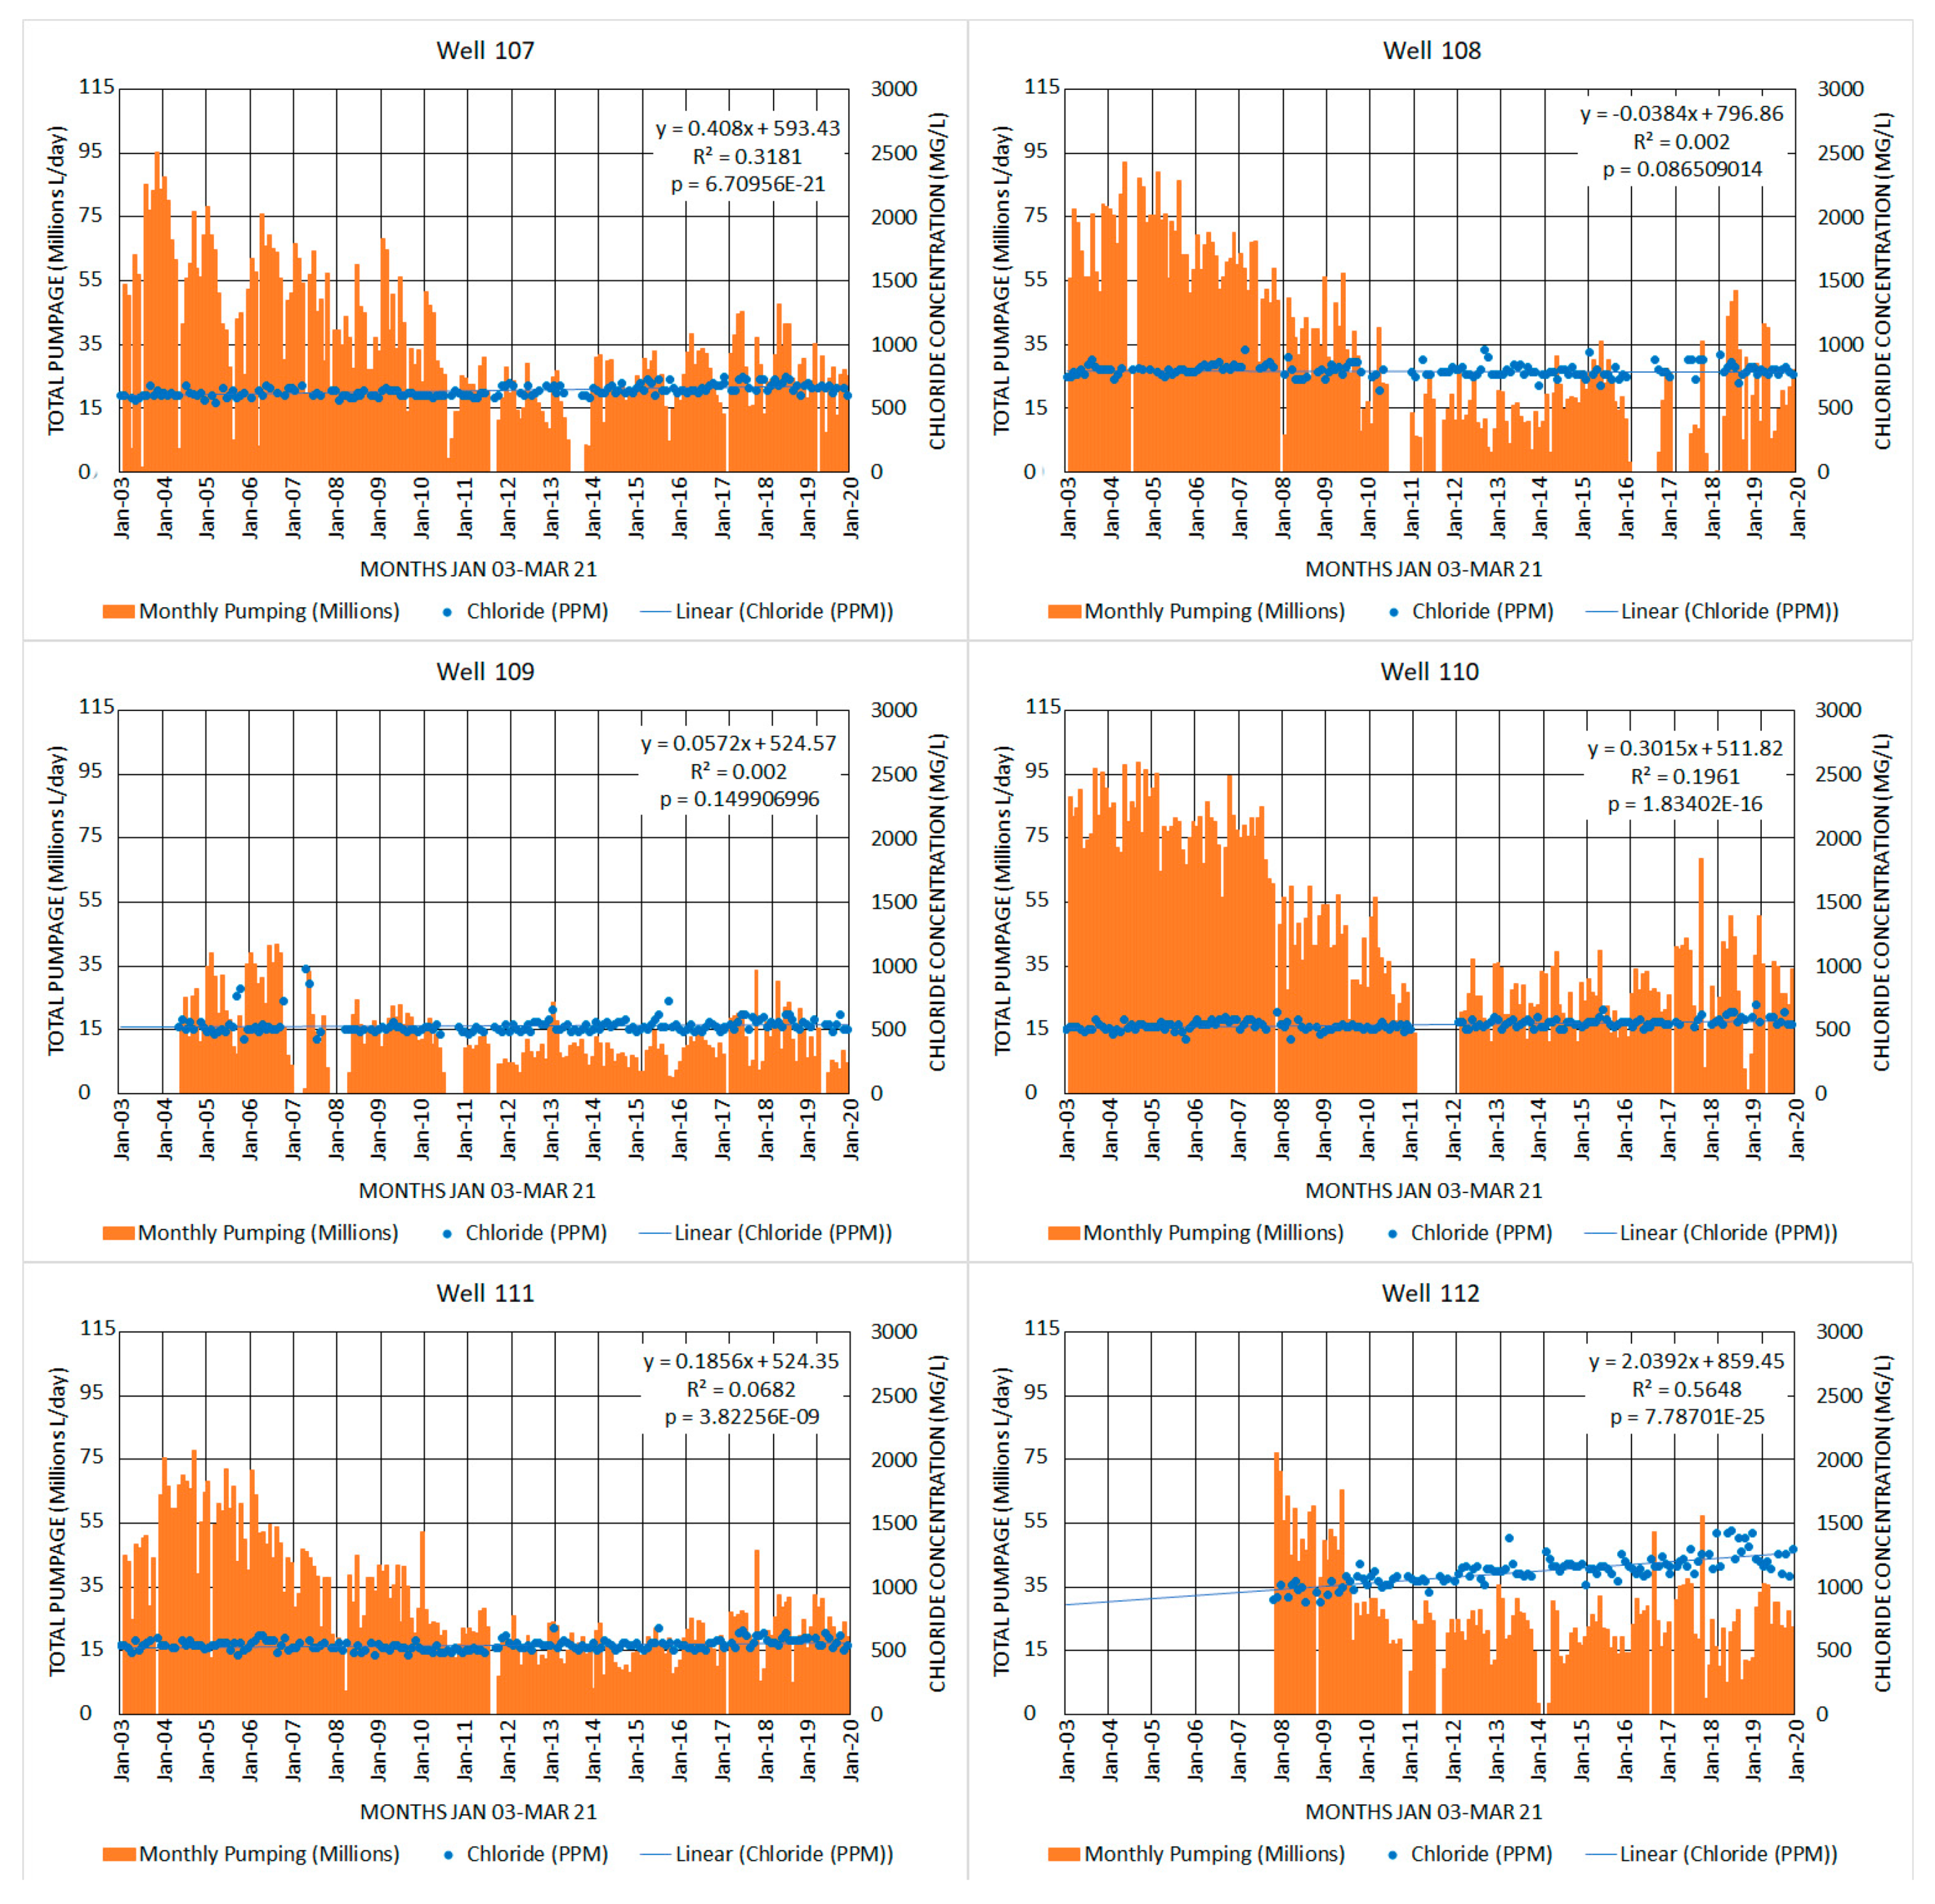
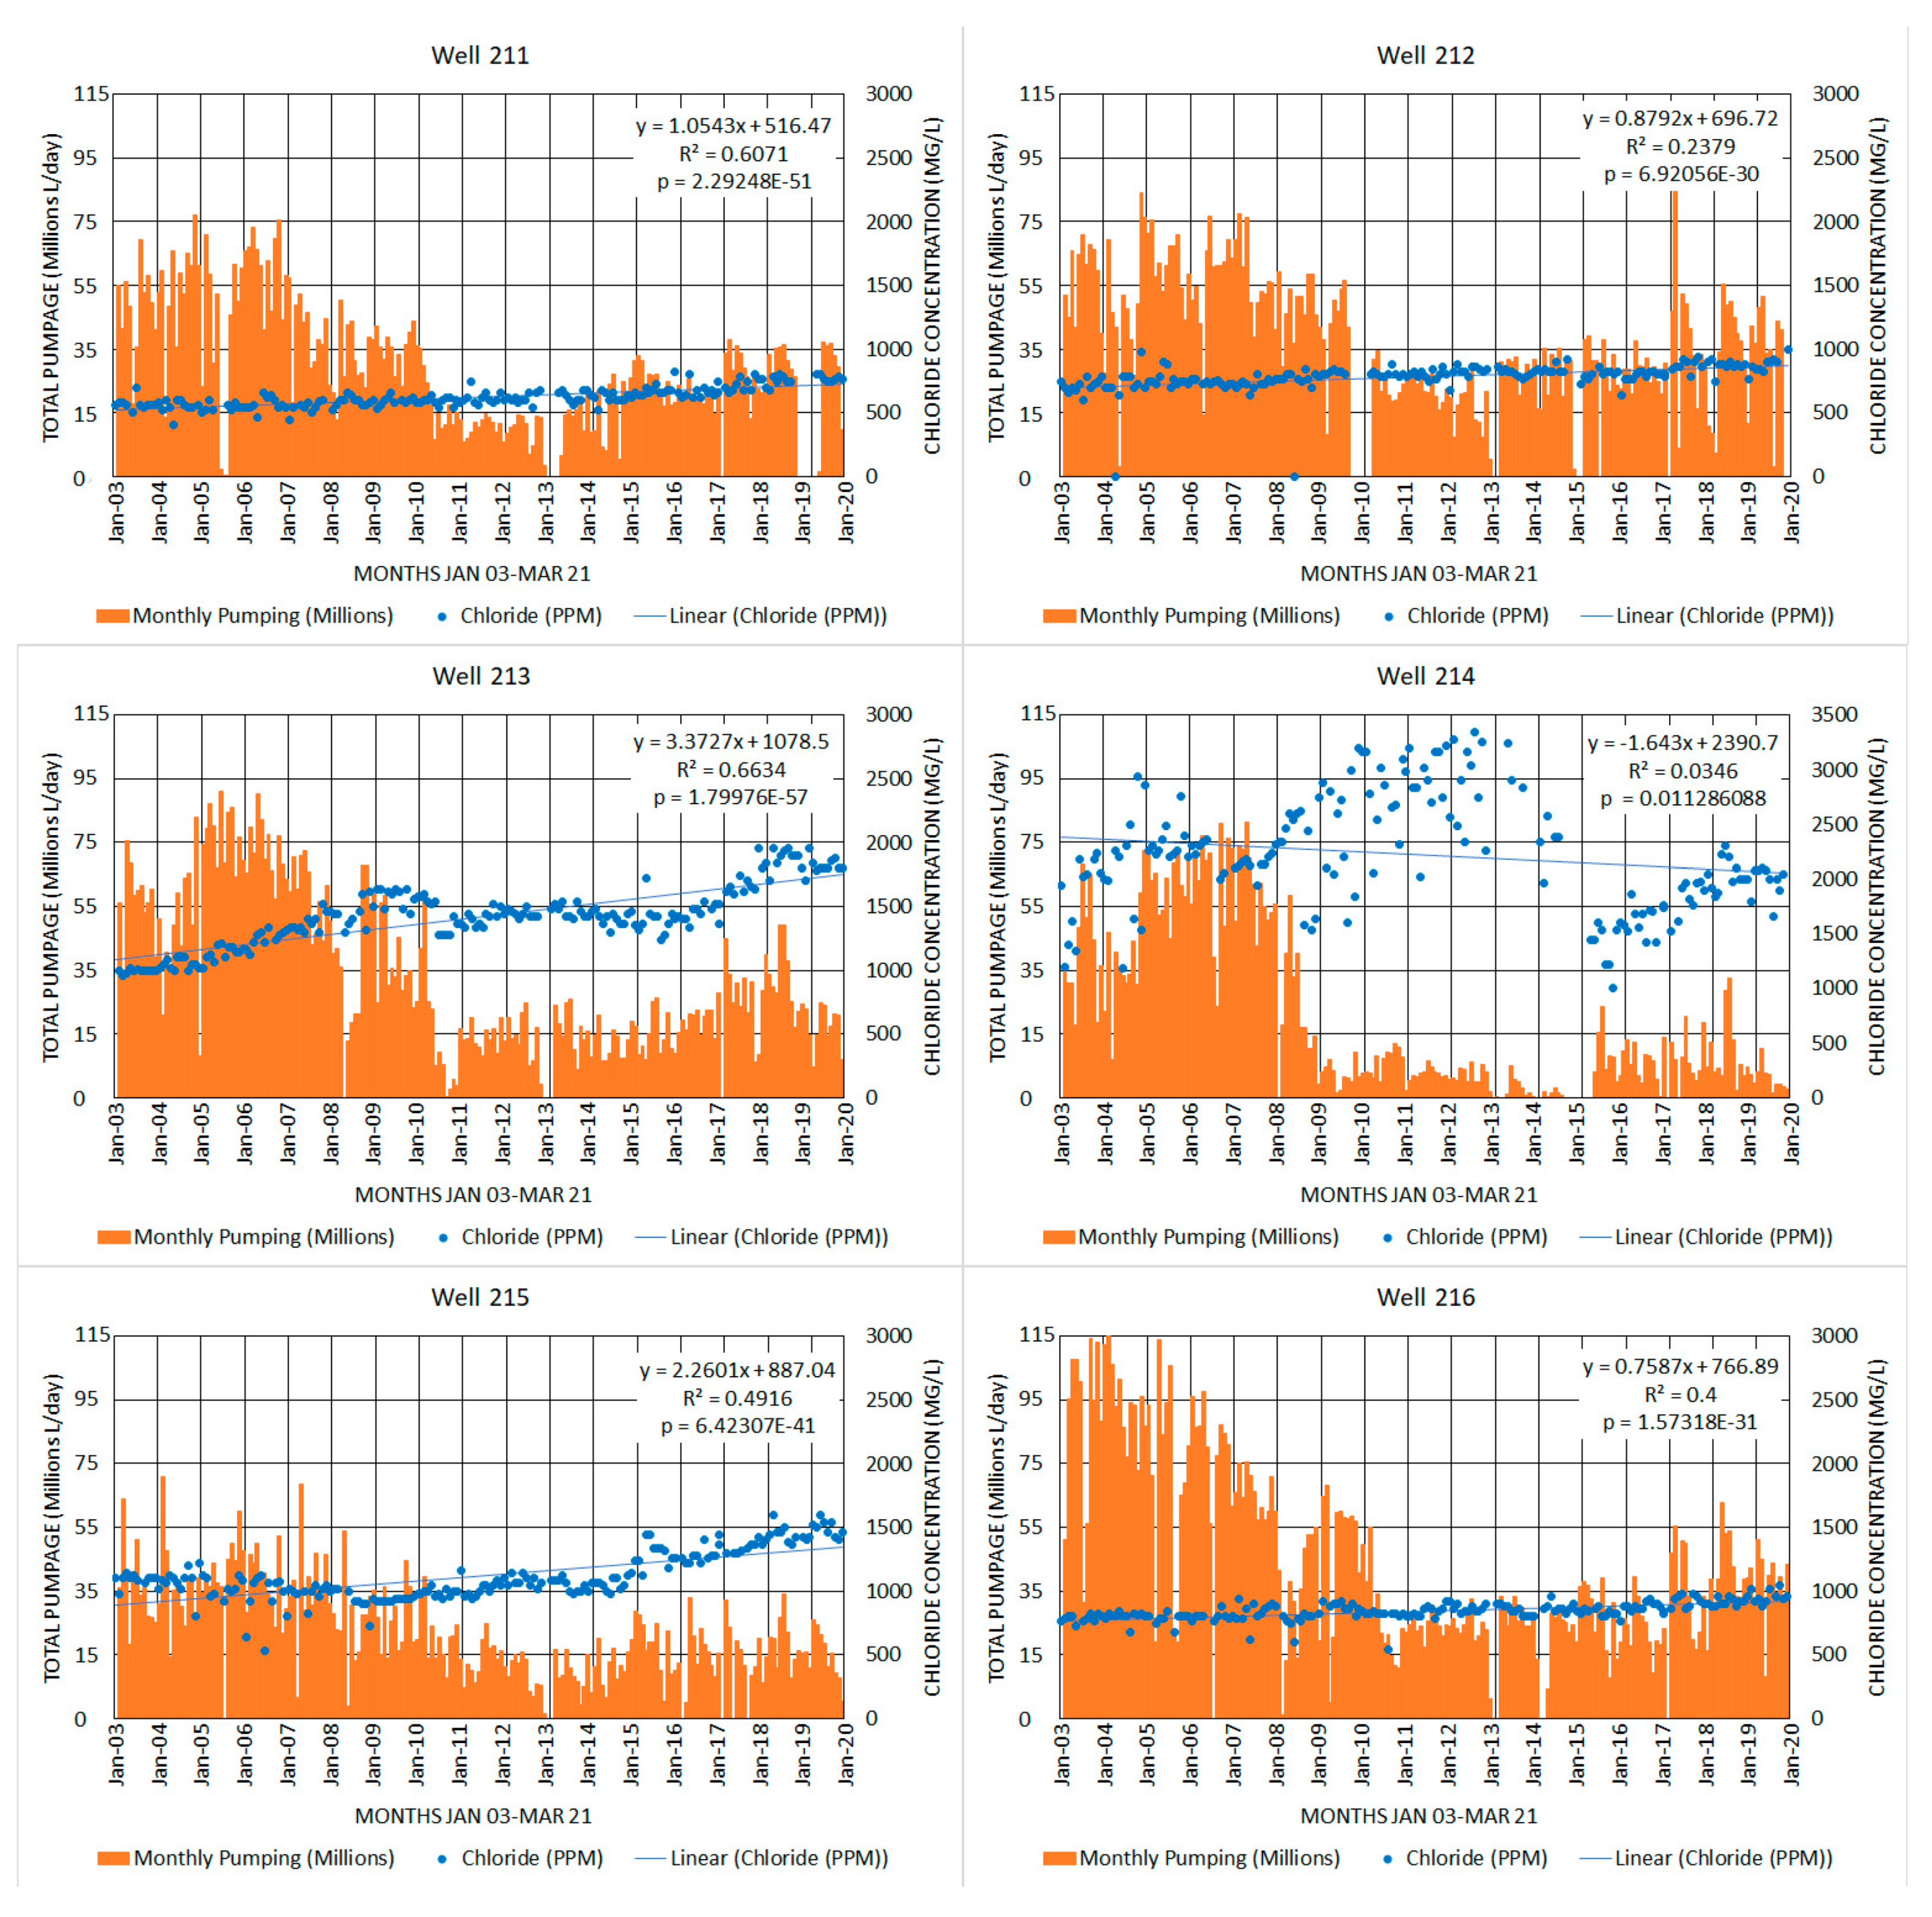
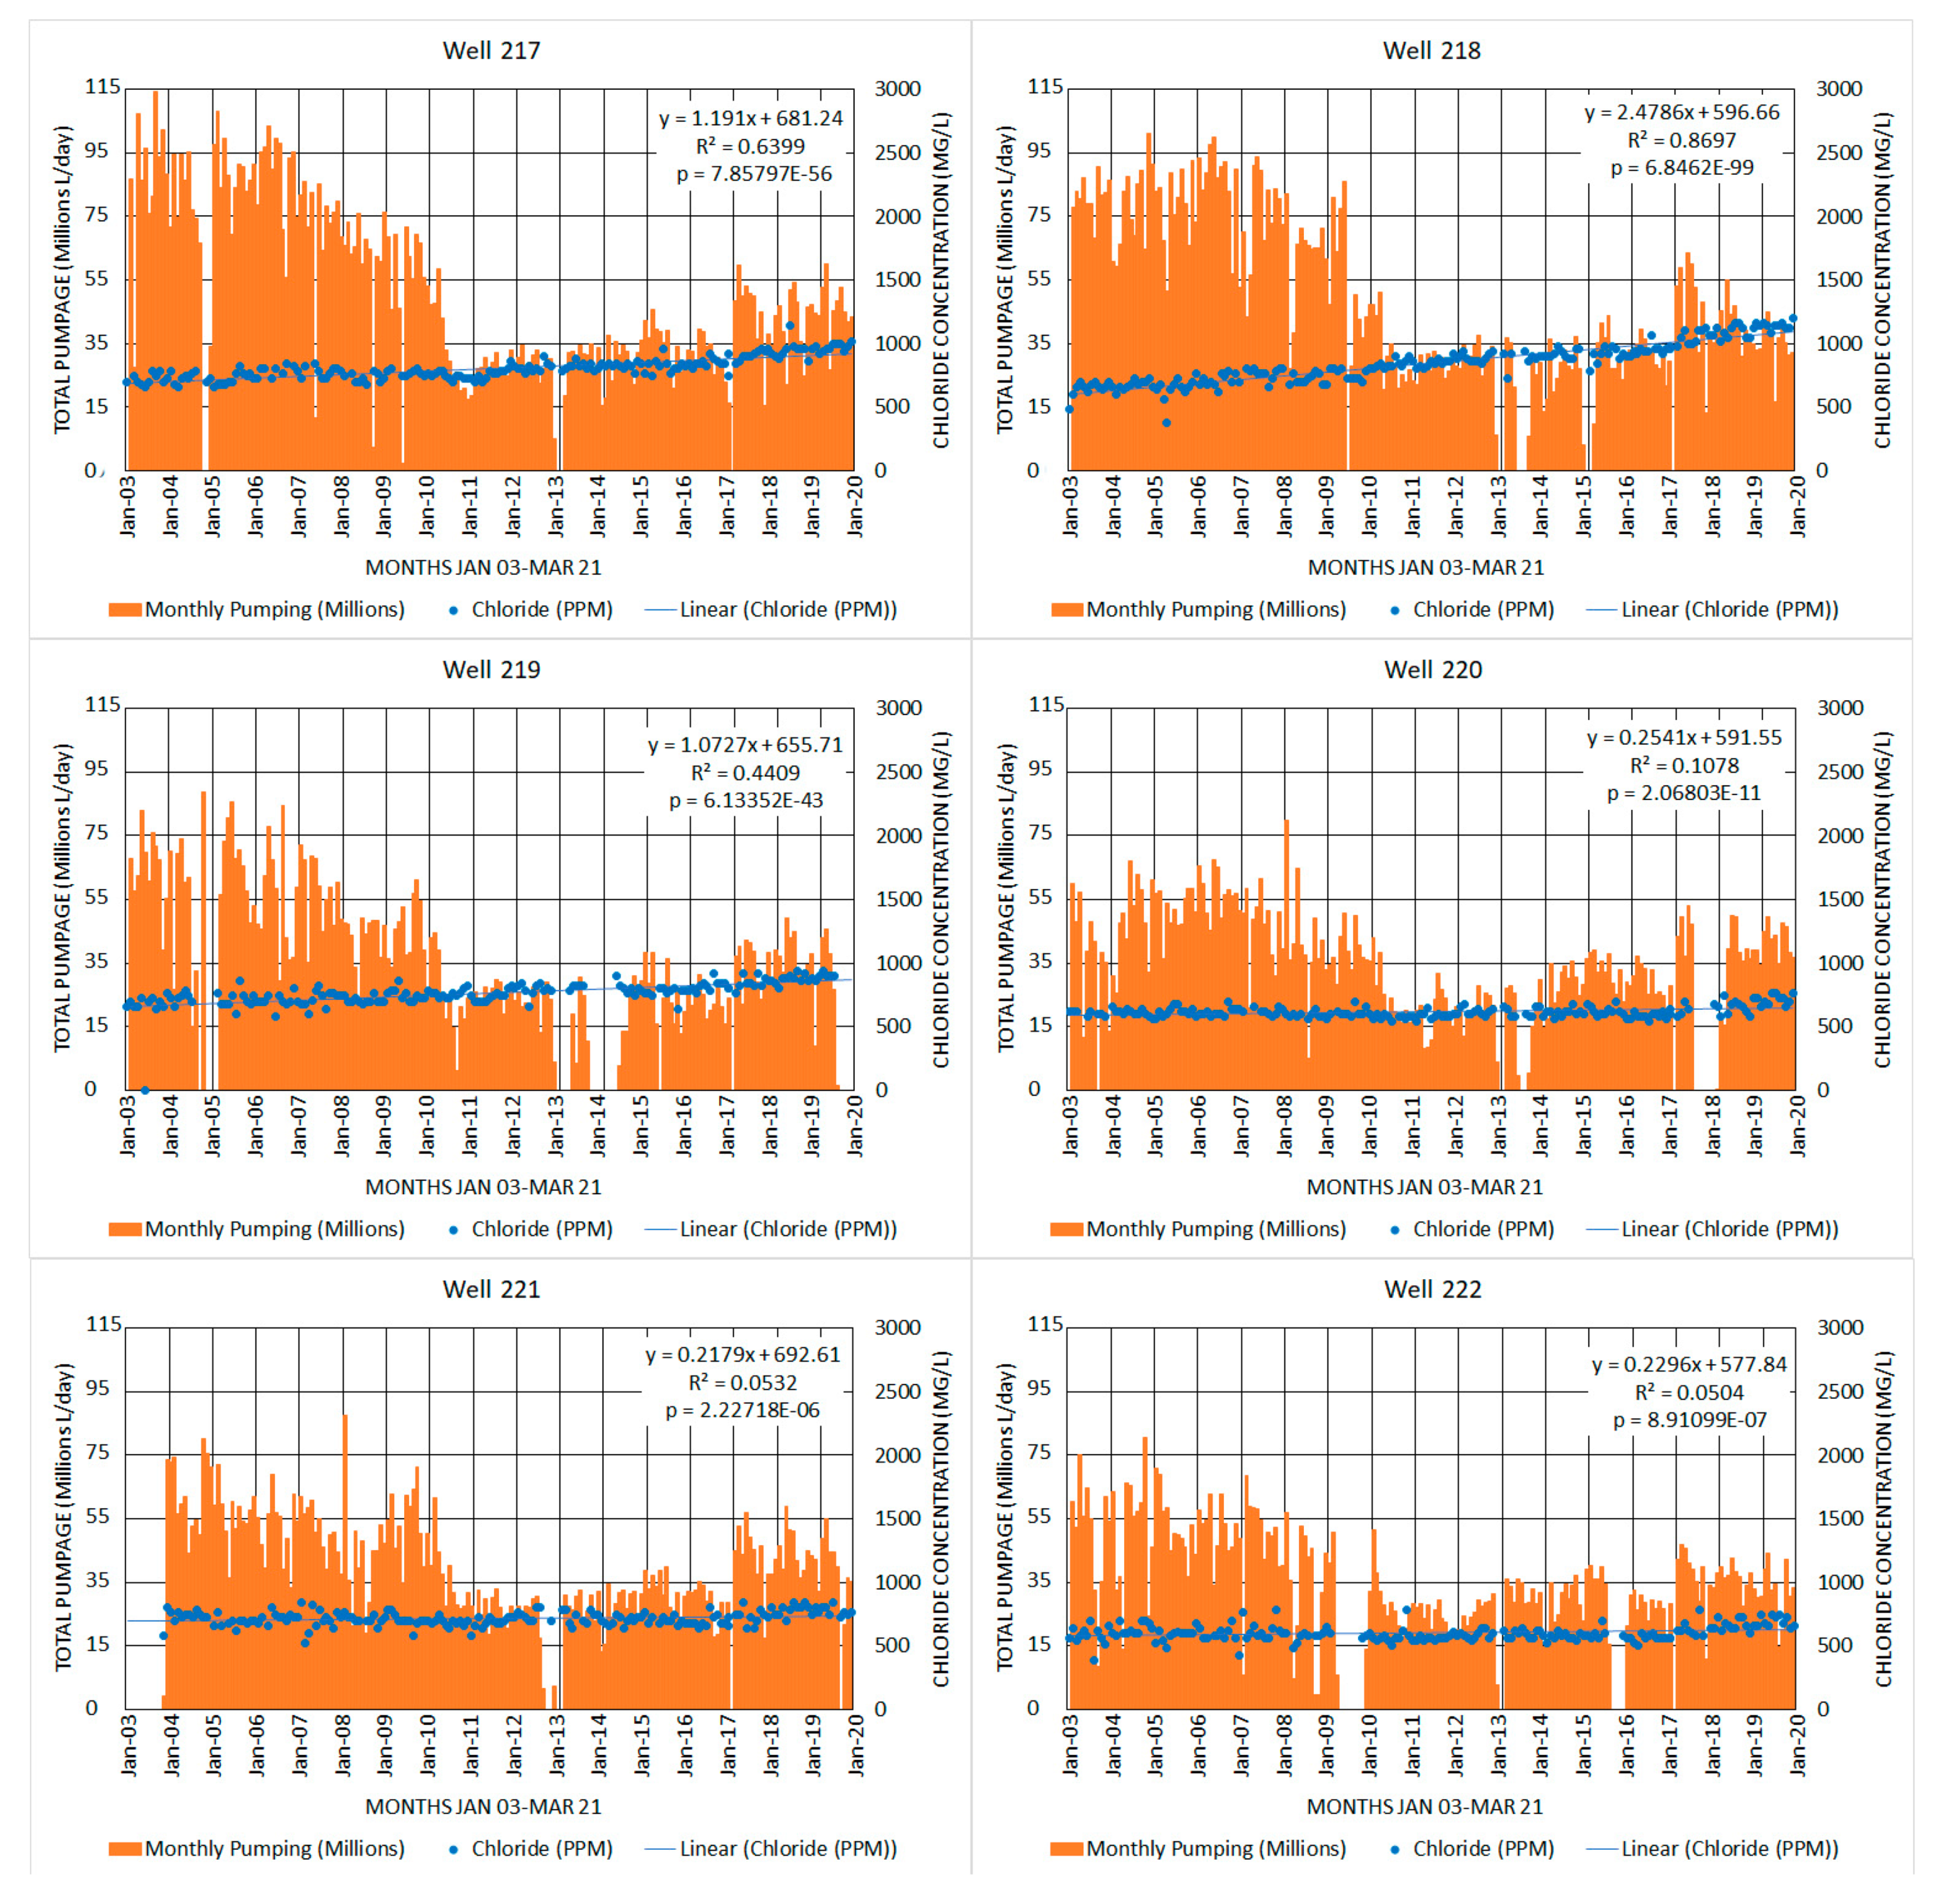
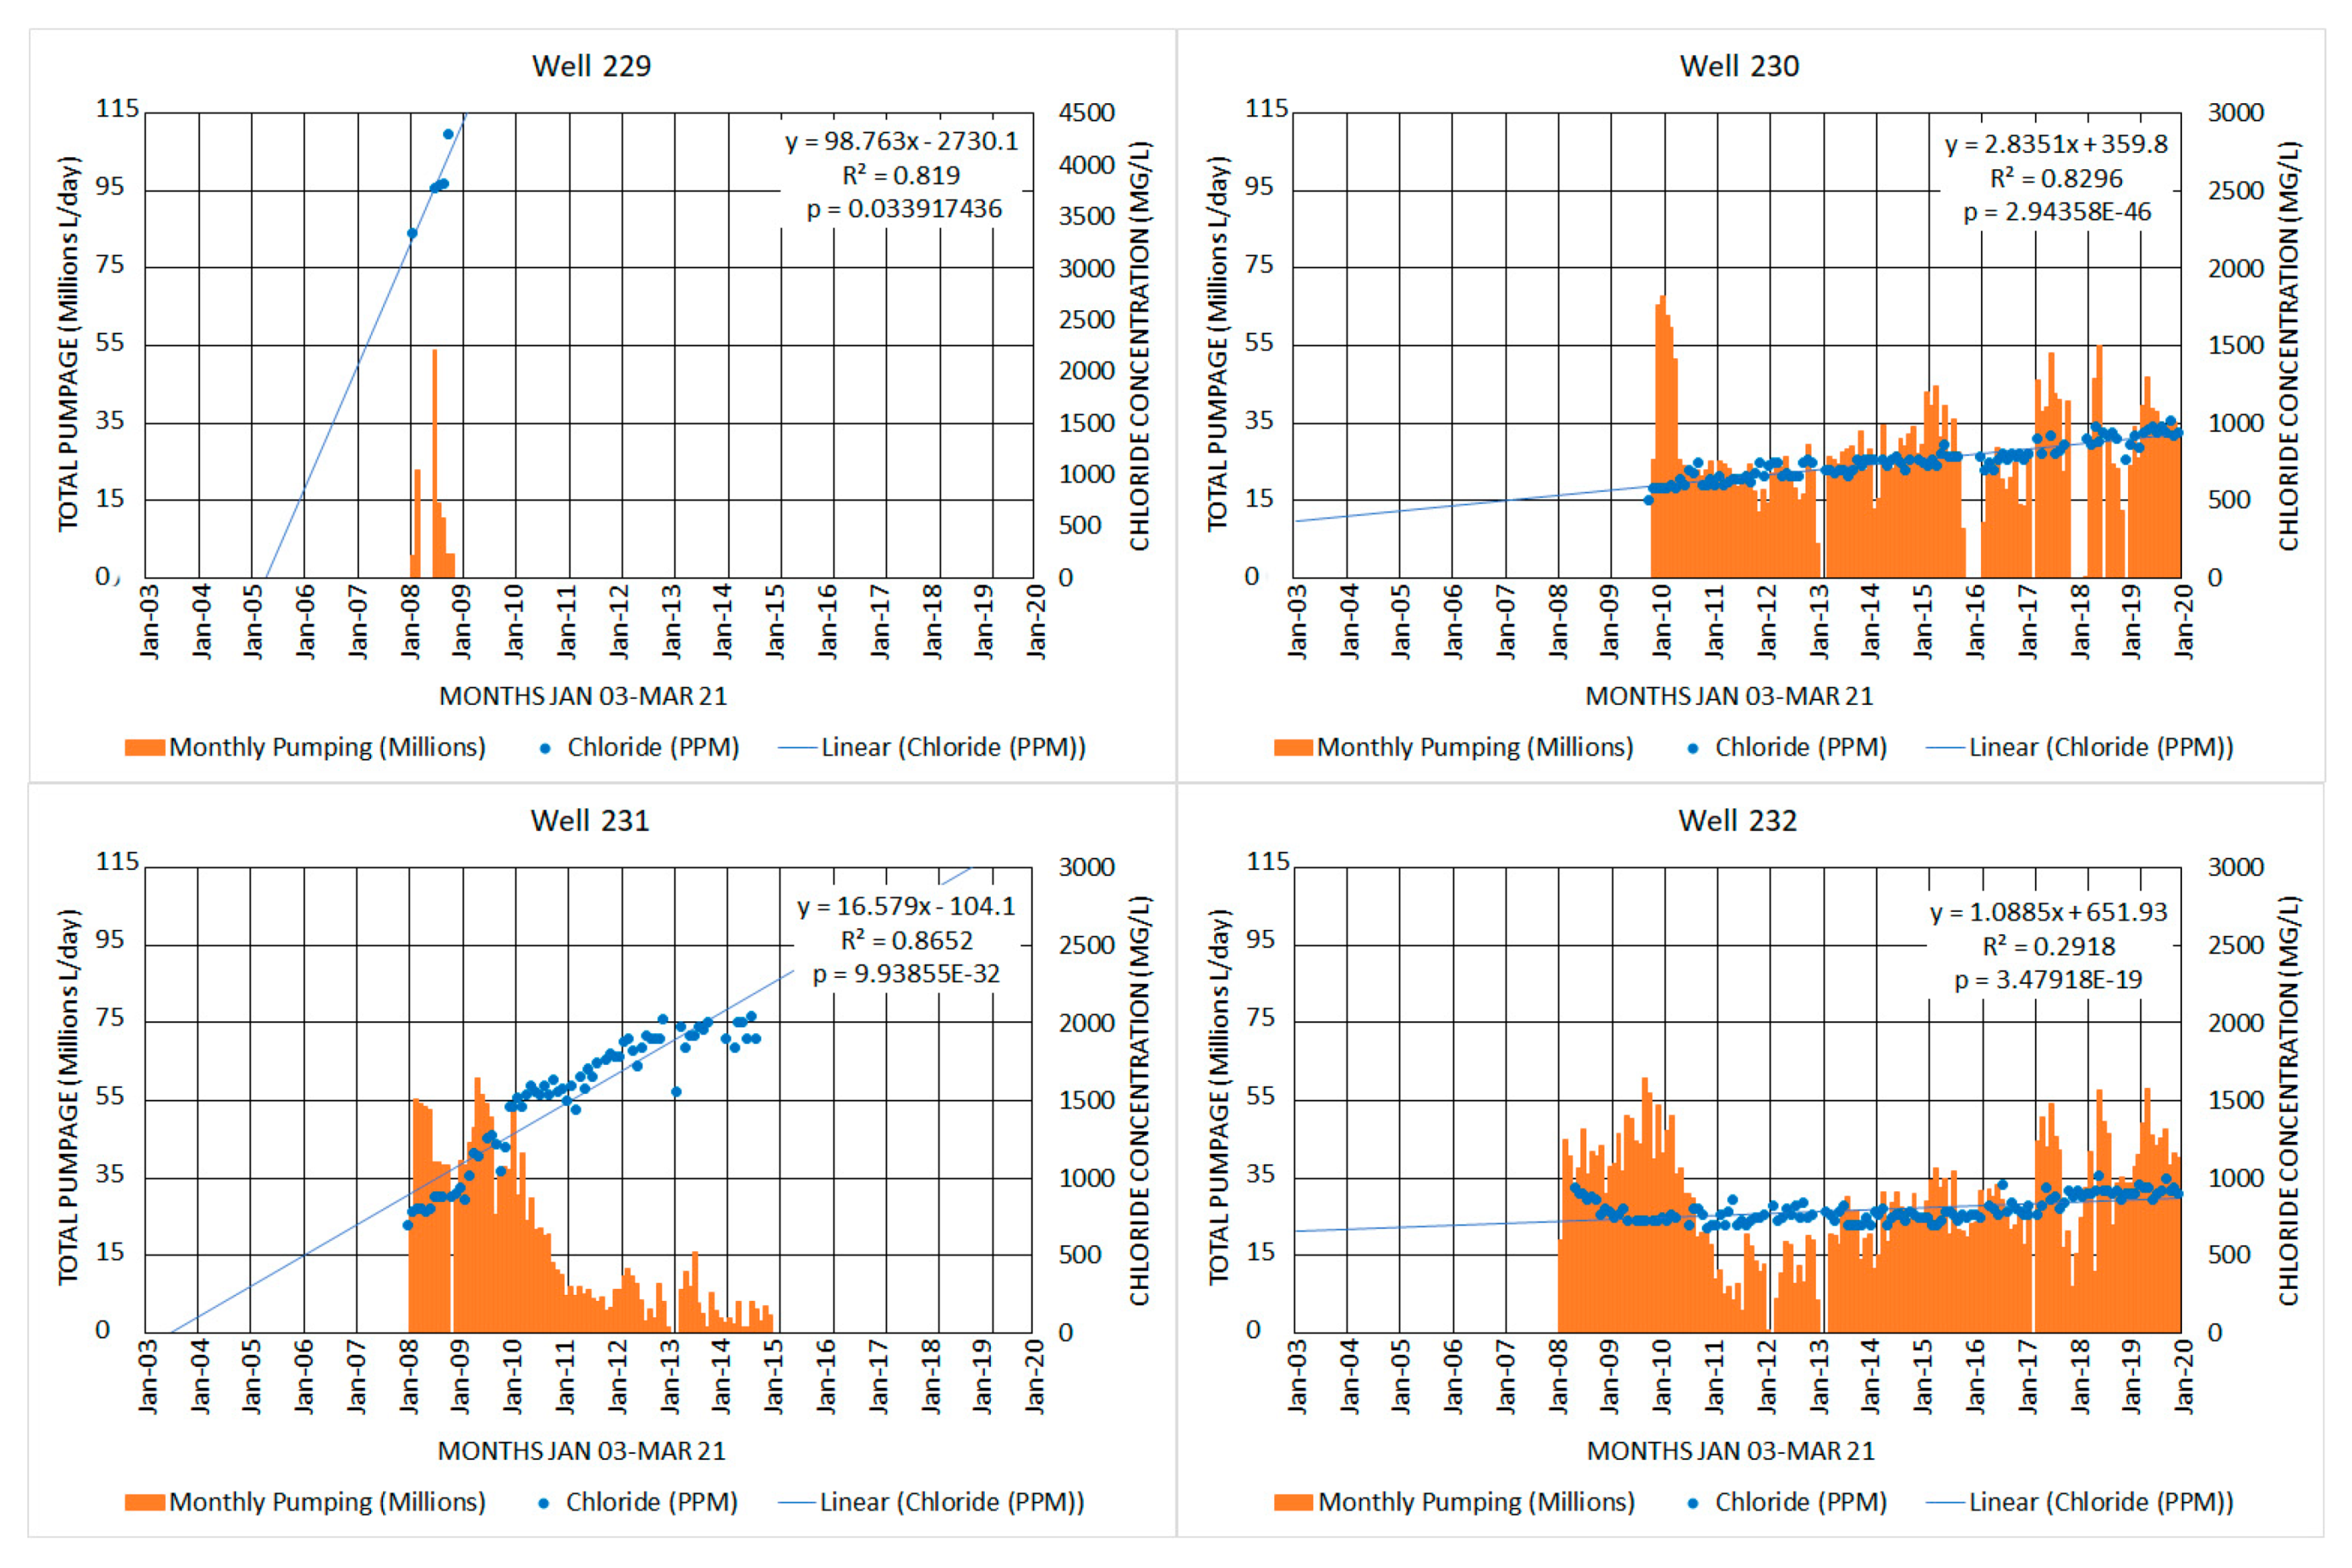
5.1. Feedwater Quality Fluctuation Compared to Historical Raw Well Water Pumping

Historical well pumping and dissolved chloride concentration data for the 34 Lower Hawthorn Aquifer wells are presented in Figure 13. The end date of the linear regression analysis is March 2021. The dissolved chloride data were collected using the argentometric method (titration) and are rather consistent. The R2 values for the regression plots ranged between 0.02 and 0.87. The p-values values showed that 31 of 34 wells produced regression analyses falling below 0.05, which indicates they are statistically significant. Therefore, the dataset is useful for making projections of future water quality.
The wells producing the poorest water quality, including 104, 105, 214, 219, 225, 229, and 231, closely follow a compass alignment of about N20E. Many of these wells also have the highest slope for future water quality change.

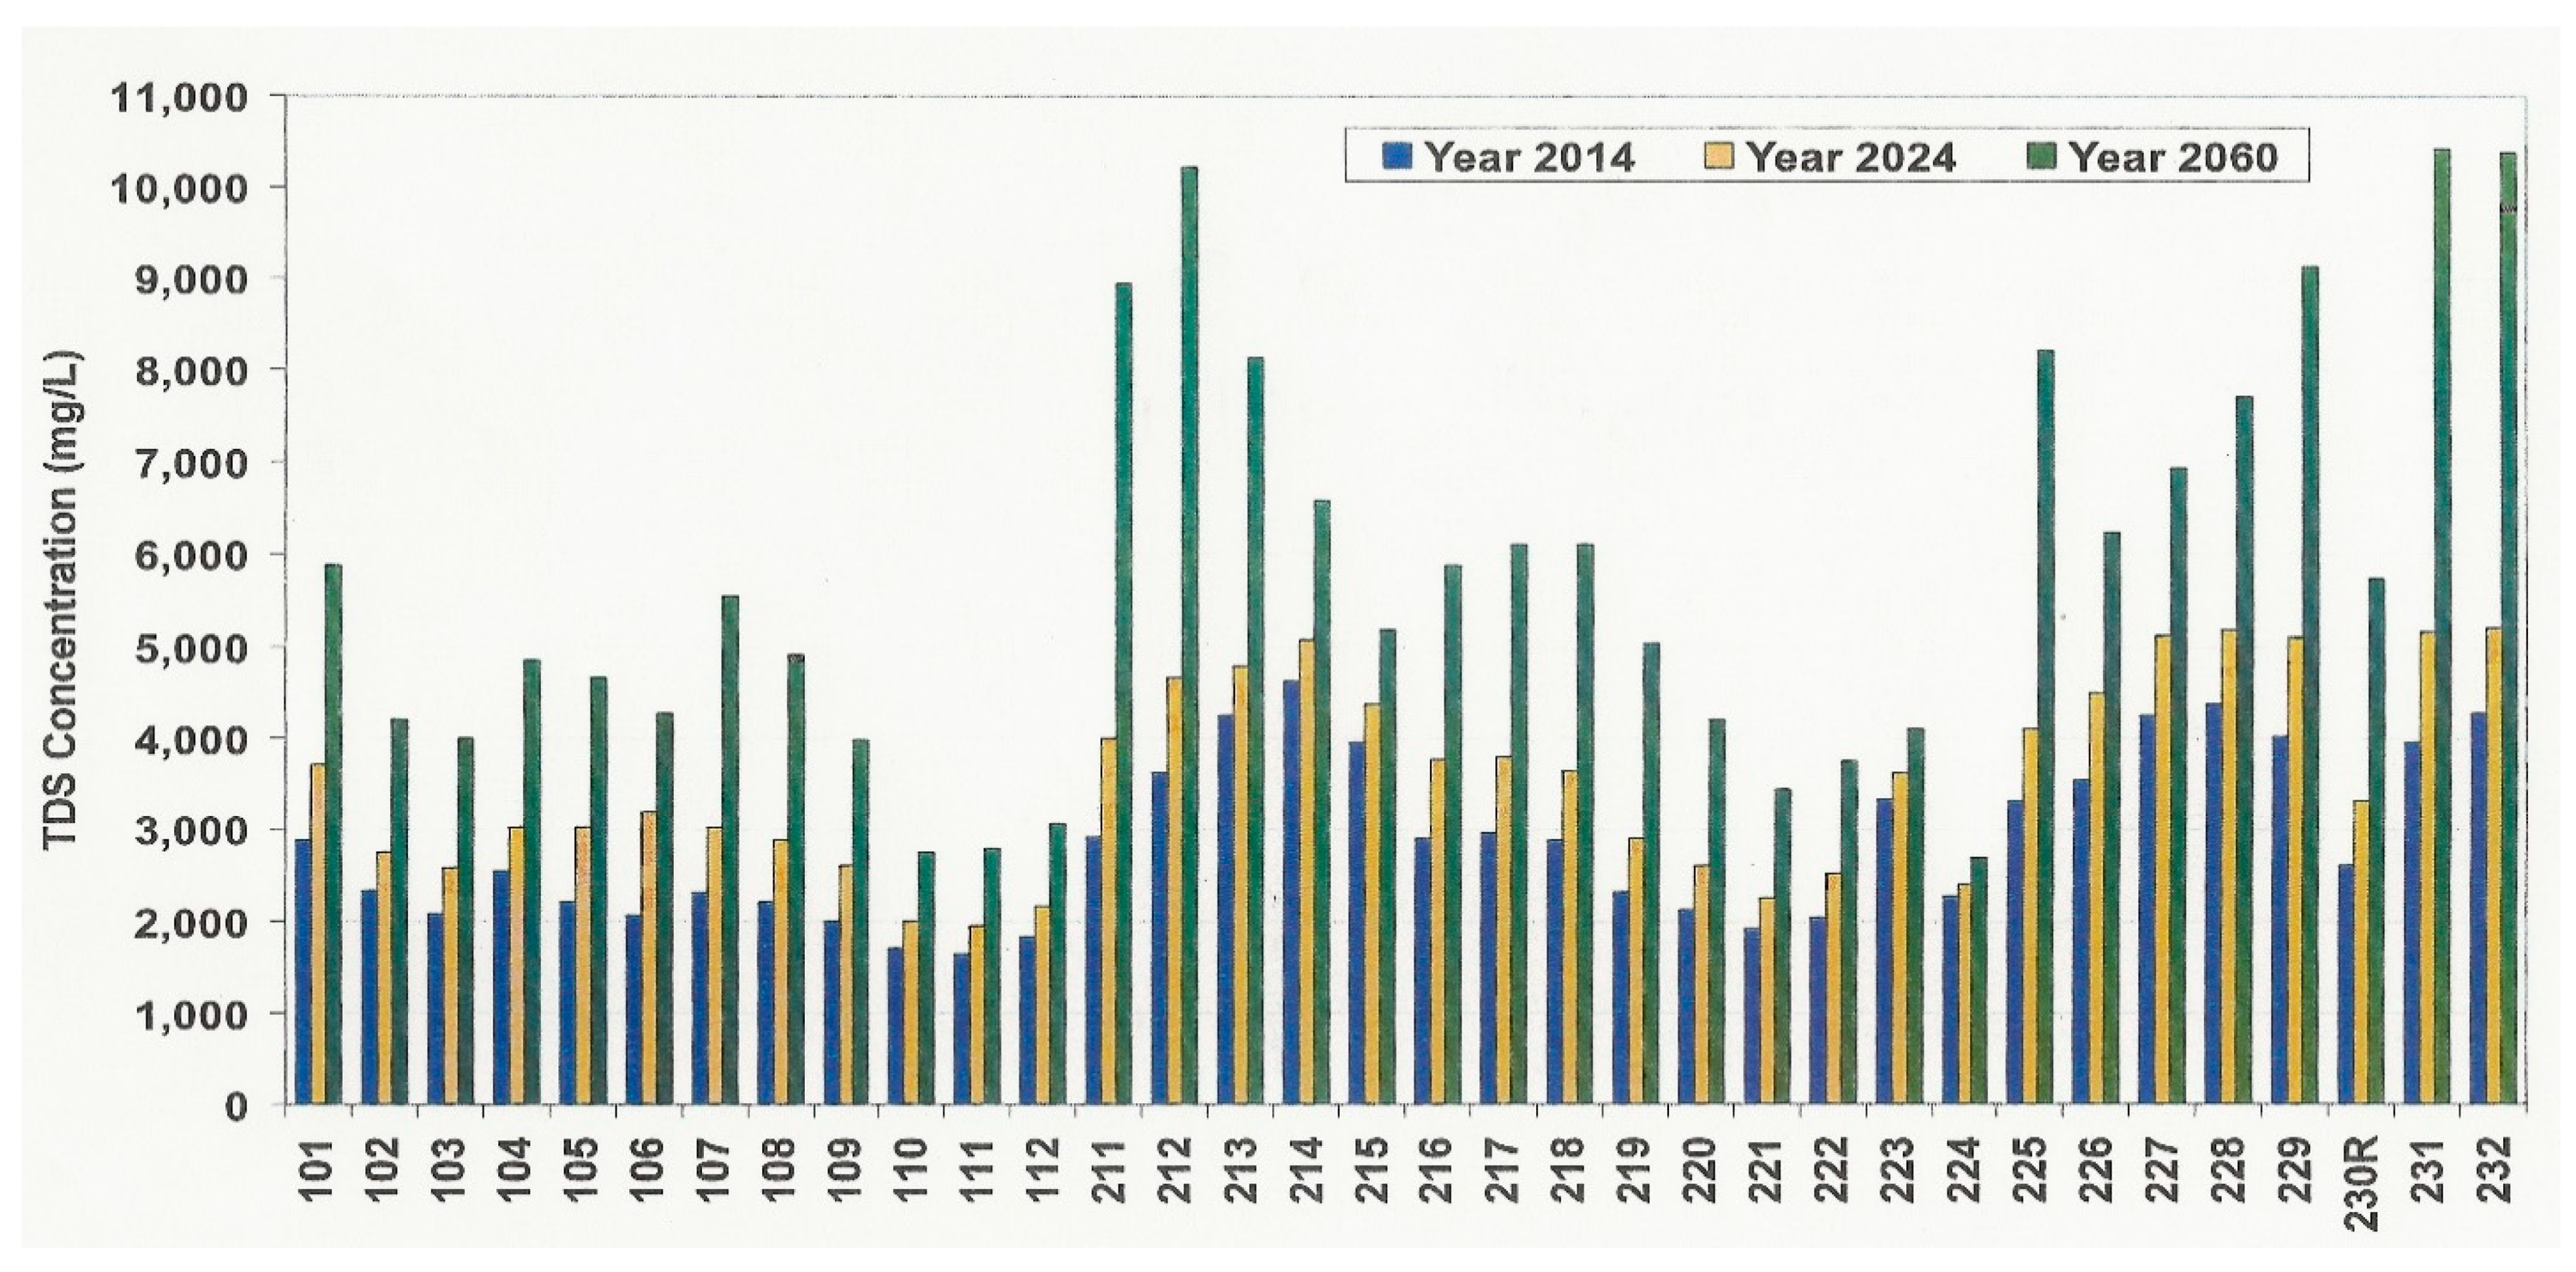
5.2. Predictions of Future Water Quality Based on the Linear Regression Analyses

Projections were made for 2026 (5 years), 2036 (10 years), 2046 (20 years), and 2066 (40 years) based on the regression equations (Table 3). The average value of dissolved chloride concentration for all of the wells was then assumed to be the approximate feedwater value. Of the 34 wells, 31 showed an upward trend in dissolved chloride concentration, and two showed a slight downward trend. The intercept line average dissolved chloride concentration that represents the starting value in January 2003 is 841 mg/L (TDS= 1819 mg/L). Two wells, 229 and 231, could not be used in the overall analysis of future changes because the slopes of the increase were too high, and they will not be used in the future due to the high upwards trend. The 5-, 10-, 20-, and 40-year projected dissolved chloride concentrations are 1082, 1170, 1314, and 1598 mg/L. The corresponding TDS values are 2203, 2343, 2572, and 3025 mg/L

5.3. Monthly Average Pumping Data Observations

The analysis included a comparison and observations of pumpage in the 34 well that constitutes the Cape Coral South Wellfield. The minimum monthly pumpage ranged from zero m3 pumped to a maximum of 120,681 m3 per month. The average monthly pumpage observed for each well combined over the 18-year analysis is 79,739 m3.

6. Discussion

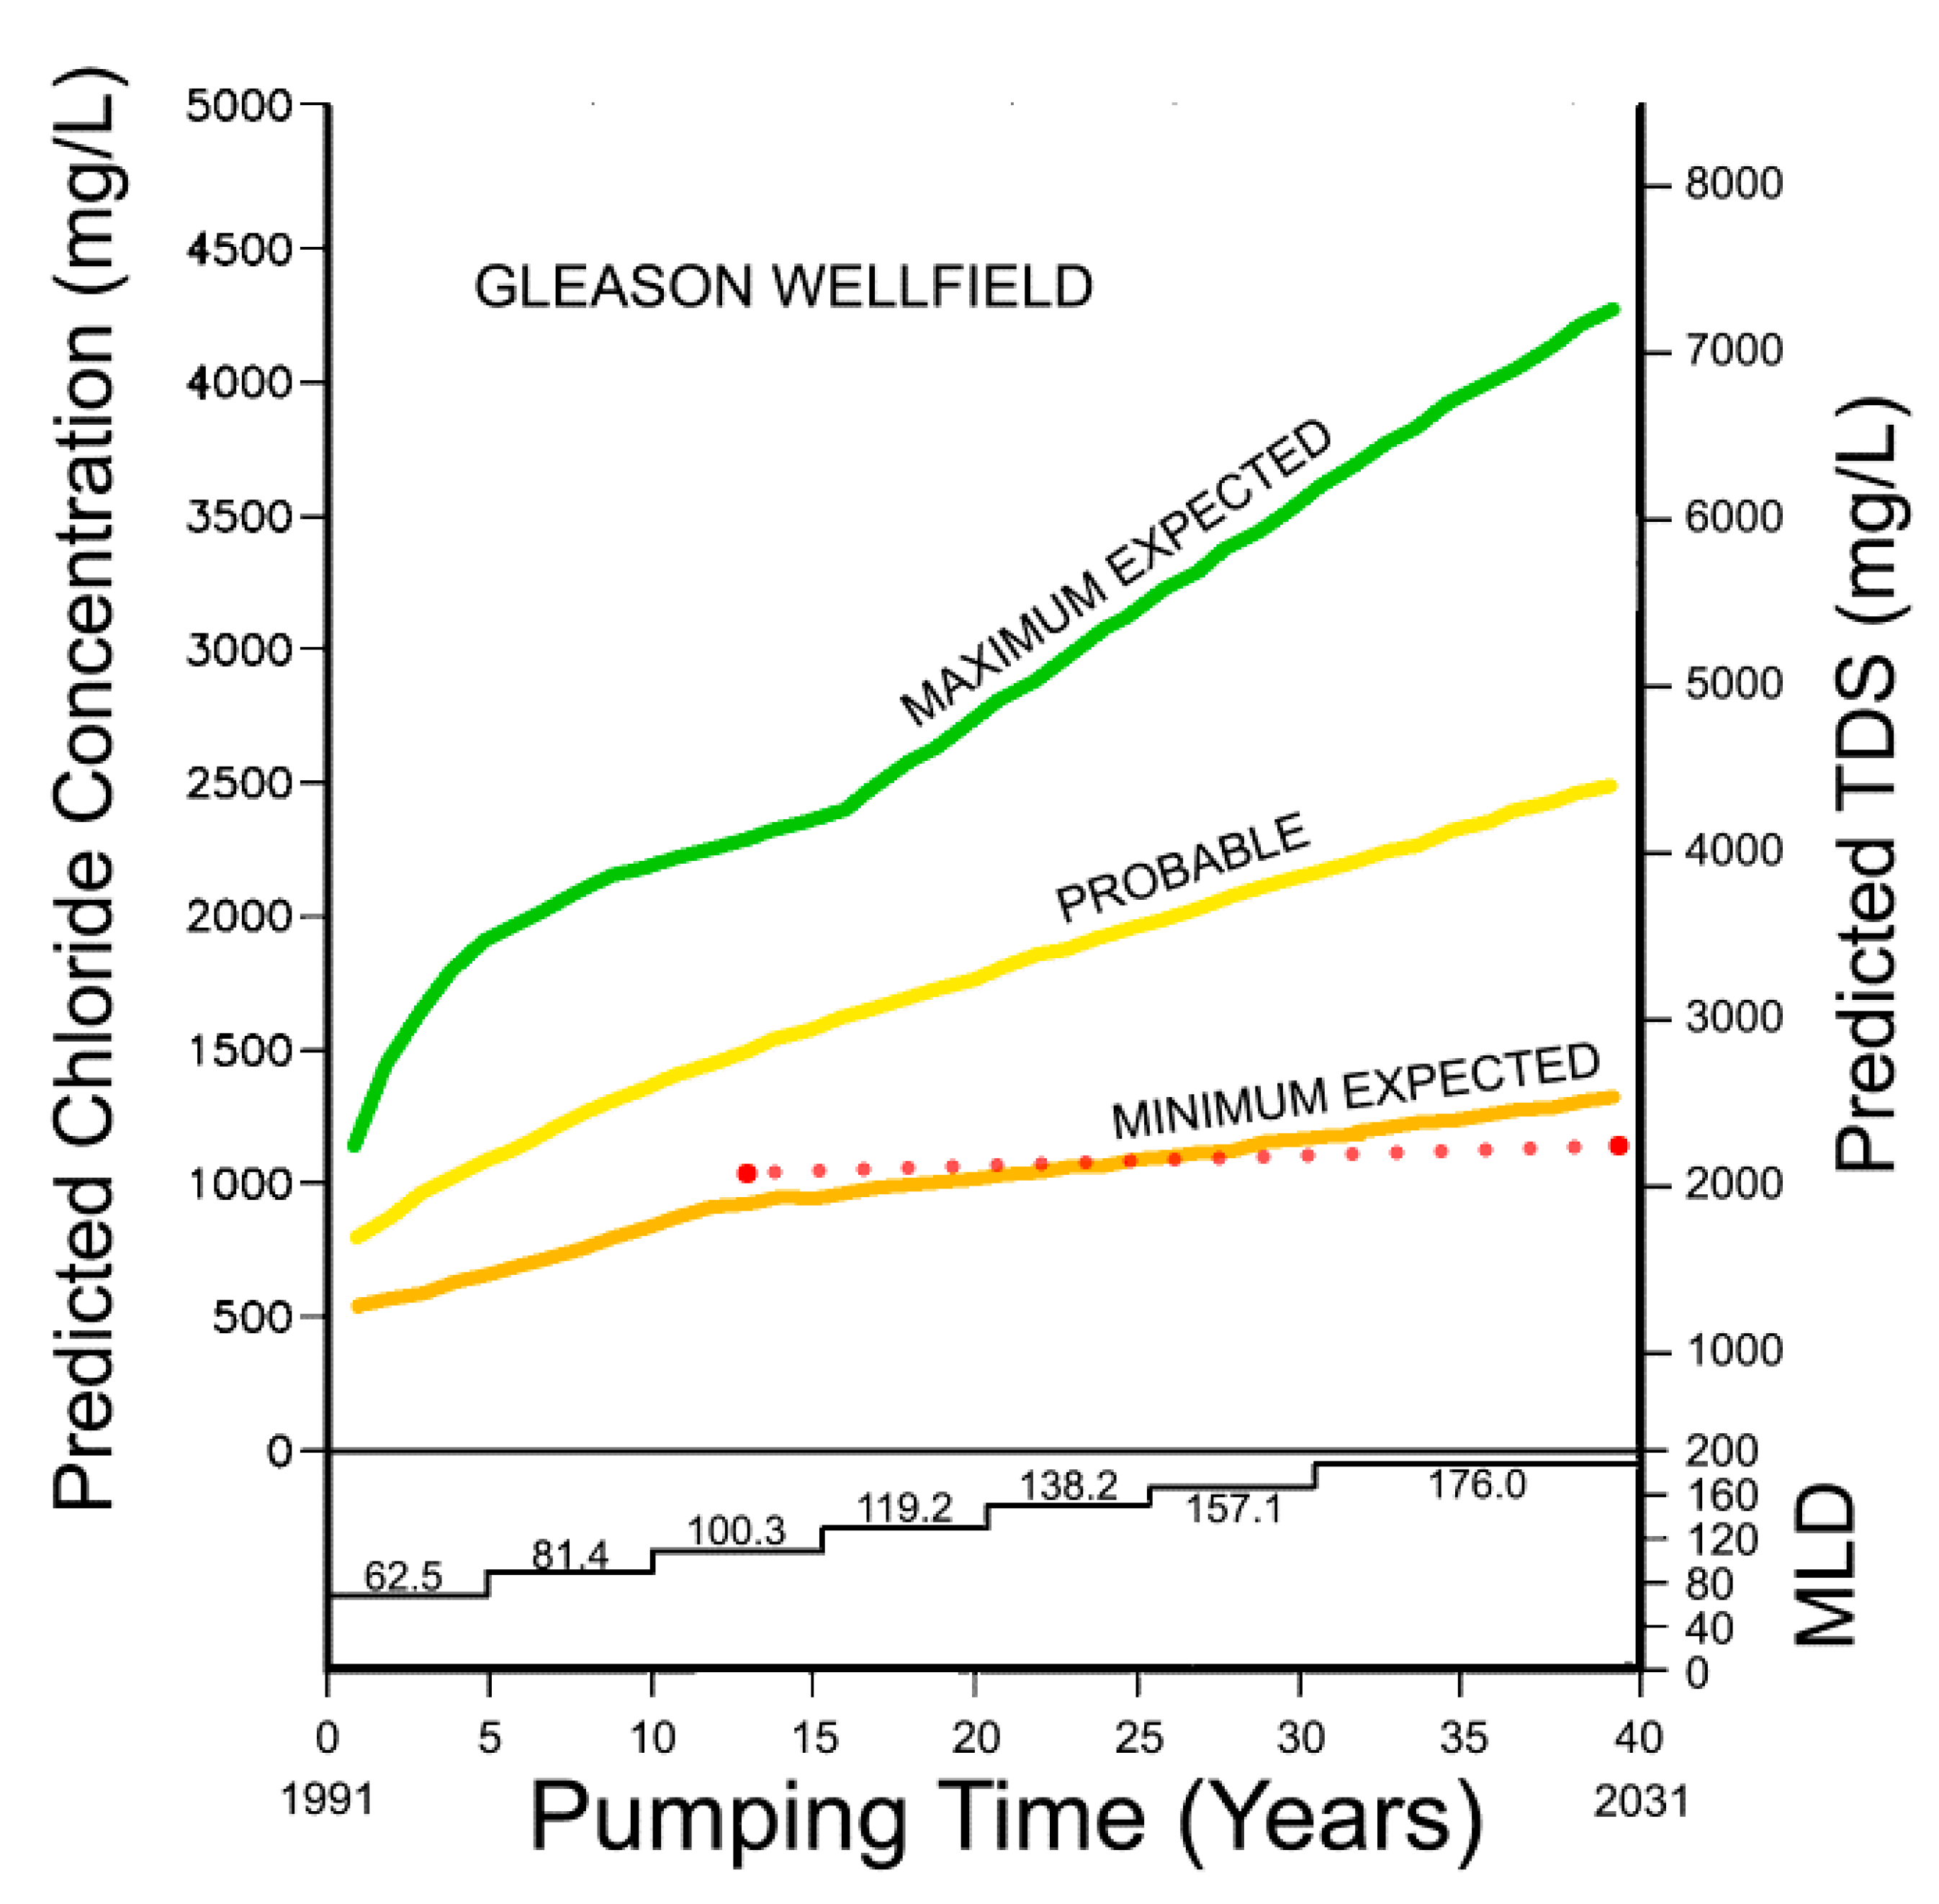
6.1. Comparison of Actual Dissolved Chloride Concentrations and Projections Based on Real Data to the Original Planning Model

The original planning model projection for the south part of the wellfield is shown in Figure 14. The solute transport model included the pumpage for all parts of the wellfield to incorporate the overall drawdown of the potentiometric surface. The model code used in the original model was FT-WORK [12]. Note that the projection for the 40 years started in about 1991. So, the 40-year project places the date at 2031. A comparison of the model to the 2003 year shows the predicted change in the South Wellfield was an average of about 800 mg/L of dissolved chloride based on the minimum expected projection, and the actual measured average was 841 mg/L. Therefore, the actual change occurred within the margin of error used in the model. The projected average dissolved chloride value for 2031 based on the minimum expected change was about 1350 mg/L, and the projected change based on real data is 1126 mg/L. The upward slope of the minimum expected change in dissolved chloride concentration is higher than the slope of the change predicted by regression analyses of all production wells. If the wells that produce the poorer quality water are re-factored (used to a greater extent) into the projection, the future water quality change would likely lie between the mid-range and low range based on the original planning model. However, selective use of the wells to produce the required feedwater will lessen changes in salinity.

6.2. Comparison of the Updated Model Projections to the Real Data and Future Projections Based on the Regression Analyses

The projected changes in TDS shown in Figure 10 were apparently developed using the SEAWAT code for modelling solute transport [13]. However, it is quite difficult to ascertain how individual well projections were made when using a block-centered solute transport model that contains between 0 and 3 wells within a given block. In addition, no detailed information is given on the structure of the model, including how it was calibrated to the existing water quality information collected from the Lower Hawthorn Aquifer production wells [13].
A comparison of the TDS concentration projection for each well shown in Figure 10 to actual collected data in 2014 and to projections made using the trend analyses of the real data collected between 2003 and 2020 are presented in Table 4. The 2014 comparison shows that the total wellfield error in projection is an average of +29.4% or a significant over-estimation of change. There are major variations in the projection error within the wellfield with a range of −28.7 to +57.4. The projected model changes in TDS concentration for the full southern wellfield compared to those estimated from the regression analyses increases with time from +39.1 in 2024 to +47.8 in 2060. There is also considerable scatter in the projections based on assessments of individual well performance. This is a typical condition when running long-term solute transport analyses. However, there is no means of assessing the efficacy of the model, because of the lack of details presented in the engineering report.

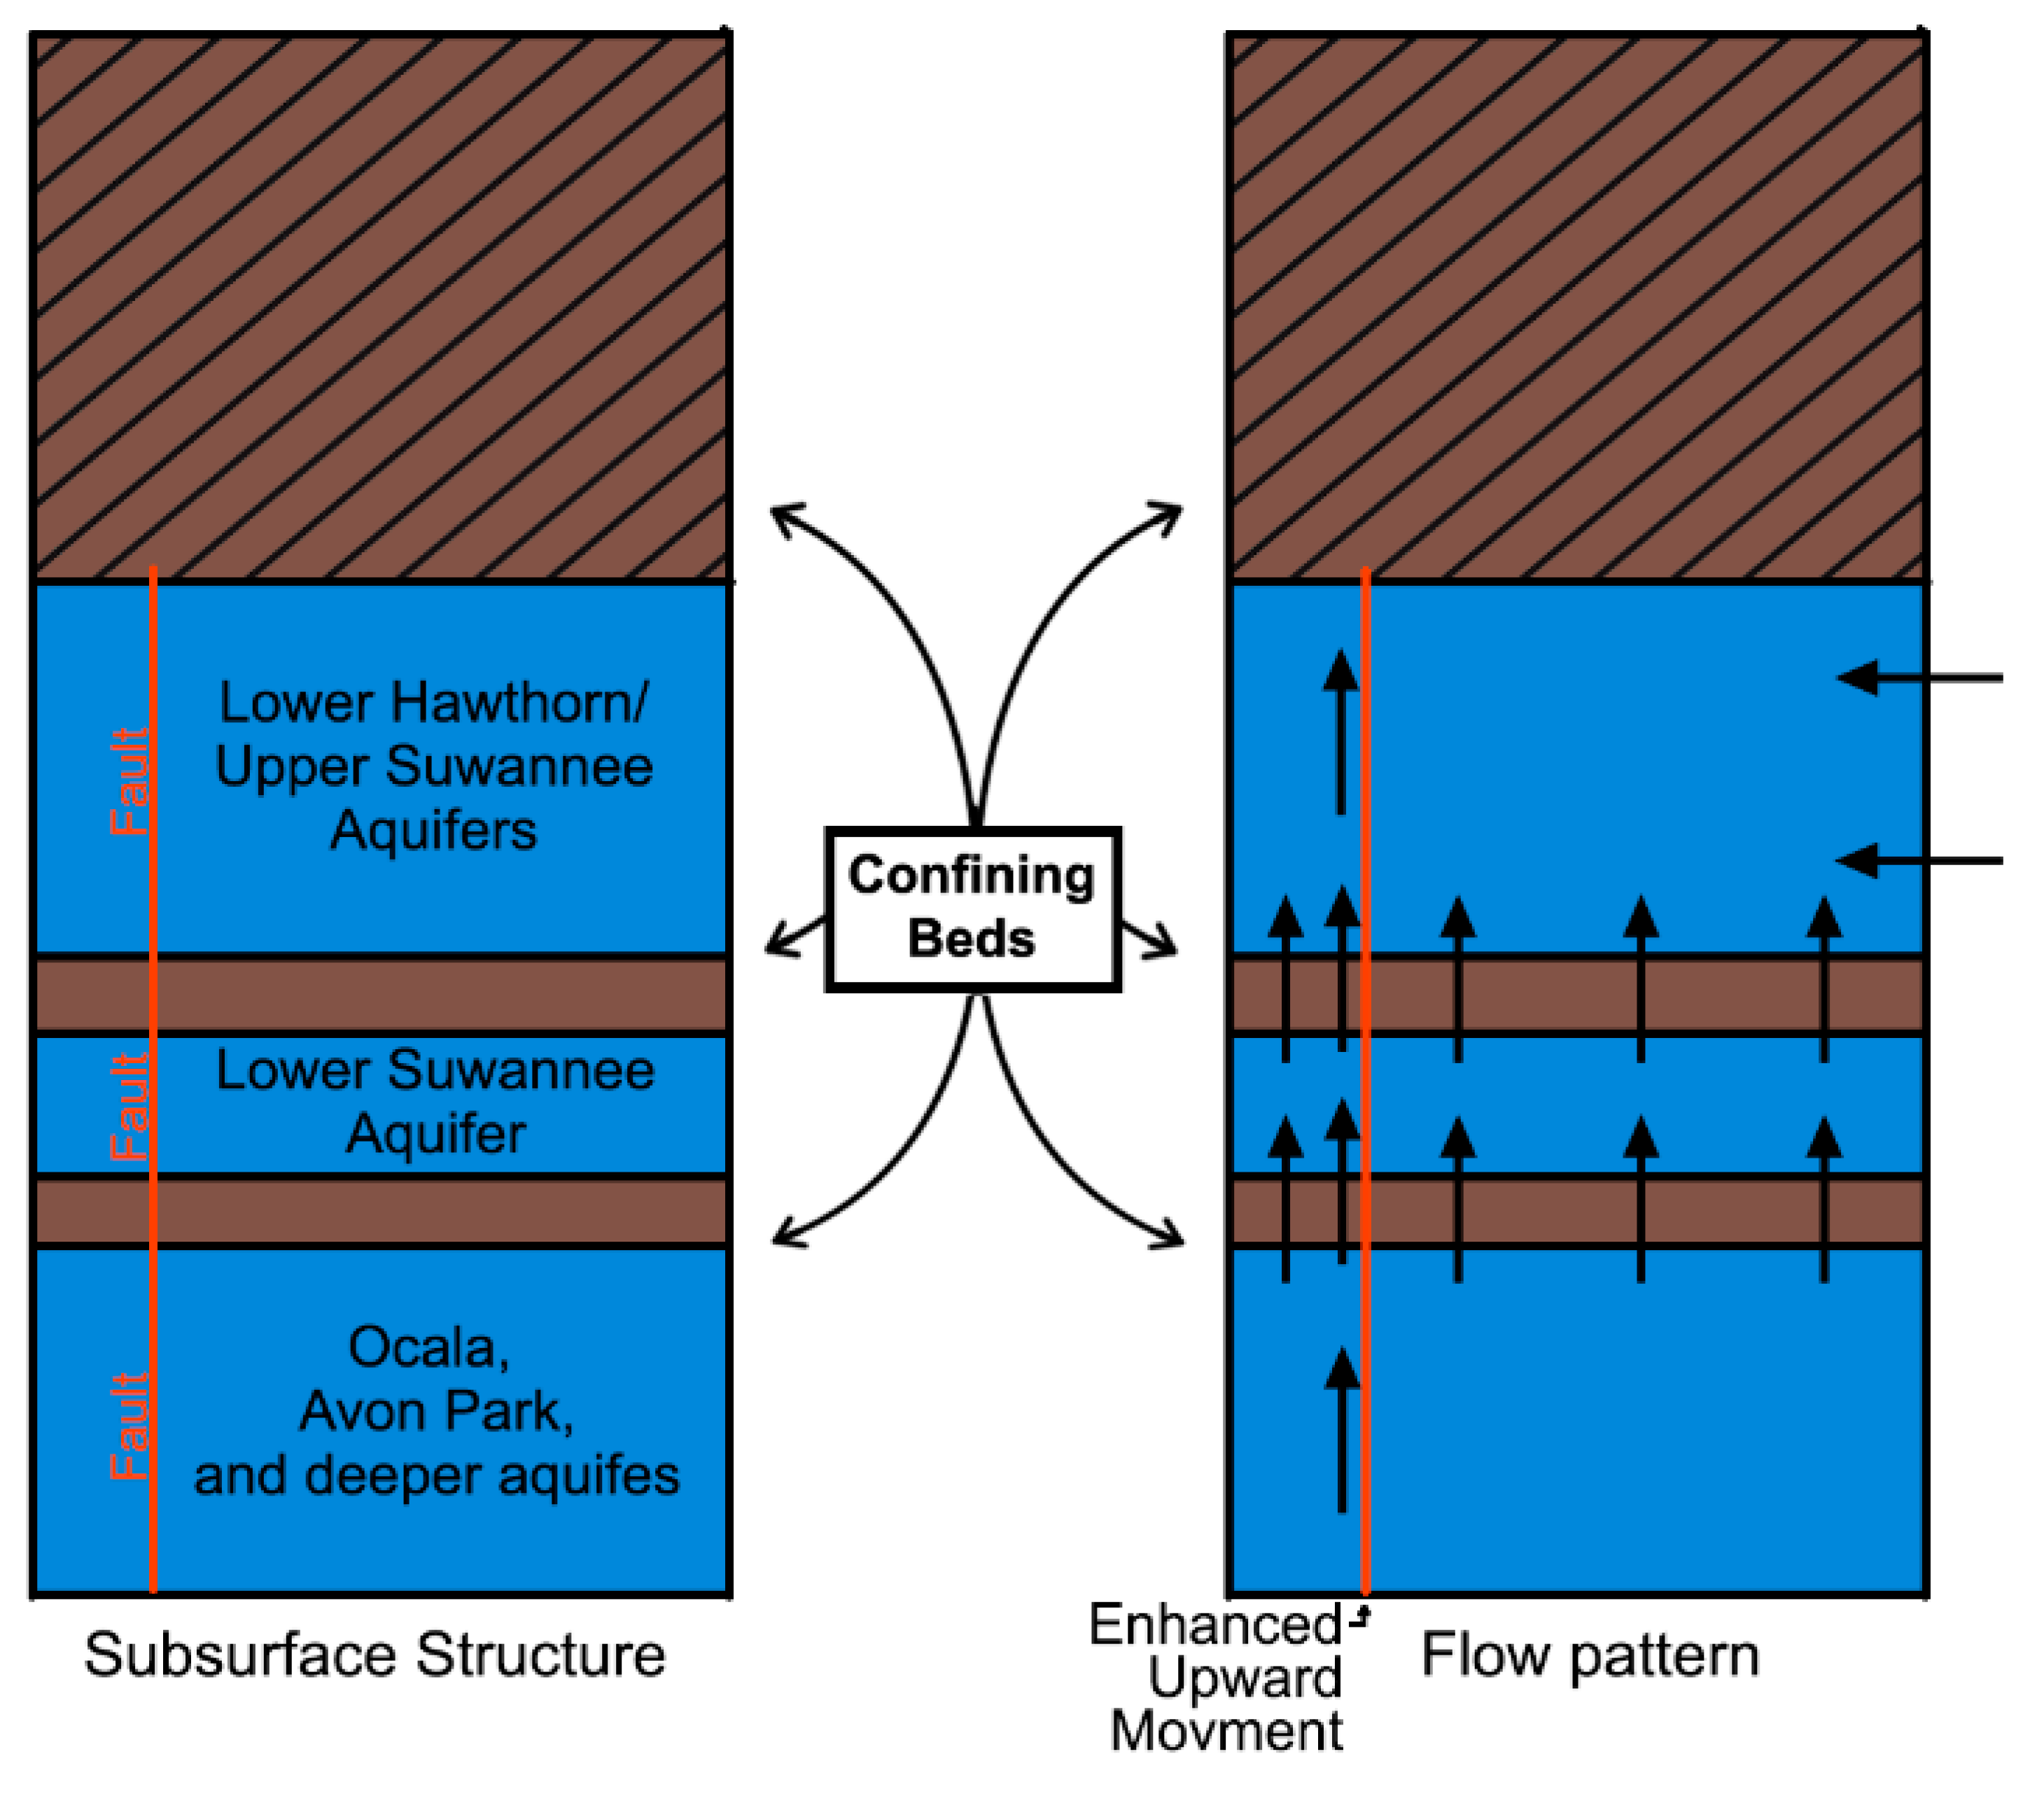
6.3. Behavior of the Groundwater Quality Changes Compared to the Conceptual Model Used in the Solute Transport Modeling

Based on the collected data and the projections, the general conceptual model as presented in Figure 1 has been confirmed by the wellfield behavior. However, there are a series of production wells that show abnormal increases in dissolved chloride and TDS concentrations. These wells include numbers 104, 105, 214, 217, 225, 229, and 231. As shown in Figure 15, these wells occur along a straight line oriented at a compass direction of N20°E. Therefore, the conceptual model may contain a fault or fracture zone that allows enhanced upward movement of water. A new conceptual model is presented in Figure 16 that adds this feature. The movement of water upward along this feature does not occur as that at the McGregor Isles fault located about 14 km to the east of the South Water Treatment Plant. At this fault, hot, highly saline water moves upward from 500 to 800 m below the Lower Hawthorn Aquifer into it [6]. The fault or fracture zone found in the South Wellfield shows no natural upwards flow, but does have enhanced leakance that leads to a more rapid change in quality caused by wellfield pumping.
The changes in water quality at the City of Cape Coral South Wellfield are similar to those found at Bonita Springs Utilities, Florida [20], the Island Water Association (Sanibel Island, Florida) [43], the Town of Jupiter, Florida [44], and the City of Clewiston, Florida [45]. The impact of a fault shows some enhanced upward movement of higher salinity water in some wells, which is similar to that found in the North Cape Coral Plant, Florida [42], and the City of Fort Myers, Florida Plant [46]. The water quality changes did not show extreme increases in salinity as found at the City of Clearwater, Florida facility [47] or a reduction in salinity as found at the South Collier County, Florida Plant [48].

6.4. Impacts of the Feedwater Salinity Change on the Design and Operation of the Two South Cape Coral BWRO Plants

The BWRO plant process is designed to treat feedwater with a maximum TDS of 4000 mg/L. There are three projections, which give different years when it is anticipated that the TDS concentration of the collective wellfield will exceed 4000 mg/L. The original planning model created in 1991 suggests that at the most probable range projection, the 4000 mg/L TDS would have exceeded the 4000 mg/L TDS concentration is about 2018, which it did not [12]. However, the data suggest that the TDS concentration, which has been following the low-range model projection, will not exceed the 4000 mg/L design concentration until sometime past 2031. The MWH projections for the individual wells and composite inflow water suggest that the 4000 mg/L threshold would be exceeded in about 2022, which is highly unlikely (Table 4). The projection based on the regression analyses using real data suggest that the 4000 mg/L TDS concentration will not be exceeded in the period through 2060 (Table 4). It appears that the City of Cape Coral can continue to monitor the production wells for at least the next 10 years to ascertain real changes in dissolved chloride and TDS. A revised solute transport model should be constructed and used to make new projections. If the MODFLOW/SEAWAT model is used, it could be highly calibrated using the existing production well water quality data.

6.5. South RO Plant Low-Pressure RO Membrane Specifications and Limitations

The South RO plant utilizes 200 mm composite polyamide membrane elements, with a 37.1 m2 active area and 0.864 mm feed spacer. Membrane performance for permeate flow is 37.9 m3/day with a 99.6% chloride rejection rate and maximum pressure drop for each element is 103 kPa (15 psi). The membranes are low fouling and spiral wound specifically designed for low-pressure brackish water RO plants. The maximum operating pressure is 4.41 MPa, and the maximum operating temperature is 45 °C. The maximum continuous free chlorine residual is <0.1 mg/L. The maximum turbidity is 1 NTU, and each membrane weighs 15 kg each and is 1016 mm long by 200 mm wide with a 28.6 feed and permeate sealed ports. The Nitto Hydranautics®™ membrane elements undergo testing utilizing a 1500 NaCl solution at 1.05 MPa applied pressure, with 15% permeate recovery at 25 °C and pH range between 6.5 and 7.0 [49]. Once the TDS concentration exceeds 4000 mg/L, the membranes will require a change and the feed pressure will also need to be increased to produce the desired water quality. Based on the real collected data from the wellfield, it is not anticipated that a retrofit of the facility will be required for over a decade into the future based on the current capacity of the South BWRO facility.

6.6. Lessons Learned from the Analysis of the South Cape Coral BWRO Facility

The design and long-term successful operation of the two BWRO plants in the south part of the City of Cape Coral provide some very useful information to the desalination industry. Careful attention was placed on the coordination between the plant process design and the development of the feedwater supply from a brackish groundwater source. Planning of expansions was done many years in advance, and groundwater solute transport modeling was utilized to project changes in water quality that would impact plant operations in the future.
Many other BWRO facilities have been designed and operated without using groundwater solute transport modeling during the design process, such as the Bonita Springs [20] and City of Clewiston [45] facilities in southern Florida. The Bonita Springs facility was conservatively designed, and the changes in feedwater quality did not change significantly, thereby allowing normal operations for the full life expectancy of the plant. In the case of the City of Clewiston facility, the changes in feedwater salinity have impacted the ability of the plant to treat the water to its full life expectancy. This will necessitate a change in the process design and a general loss of productivity (lower recovery in the future). The key lesson is that management of the groundwater source is a key design issue that requires groundwater solute transport modeling to guide the membrane process design.

7. Conclusions

The sole source of drinking water for the City of Cape Coral, Florida is provided by three BWRO desalination facilities. The South Cape Coral facility is the oldest, continuously operated BWRO plant in the United States with a production capacity of 68,182 m3/d. This facility is designed to treat brackish groundwater with a maximum TDS concentration of 4000 mg/L.
Pumping of the groundwater source causes a significant increase in the TDS concentration over time. The rate of increase is controlled by the source aquifer hydraulic coefficients, in particular, leakage, the wellfield design, and the pumping rate. Two previously conducted groundwater solute transport models suggest that the TDS of the feedwater would be at about 2800 mg/L in 2031 (1991 planning model), and the second model (2014) suggested that the feedwater TDS would exceed the 4000 mg/L treatment threshold in 2022, which will not occur.
The measured TDS concentration in January 2003 averaged 1819 mg/L. Based on linear regression analyses of TDS concentrations measured monthly in the production wells, the projected TDS concentrations for 5, 10, 20, and 40 years of future operation are 2203, 2343, 2542, and 3025 mg/L, respectively. Based on the projection using the real data, the facility should be able to operate without major design changes until at least 2060.
The conceptual model used to make solute transport projections was generally accurate with the addition of an enhanced area of upward leakage caused by either a fracture zone or fault. It is likely that the failure of the 2014 solute transport model to accurately predict the future changes in water quality was based on a low estimate for leakance. Any new modeling should use real water quality data from the production wells for model calibration.
The key to the long-term successful operation of the City of Cape Coral, Florida two southern BWRO facilities has been the original membrane process design being coordinated with projected changes in the feedwater quality. Use of groundwater solute transport modeling at the planning stage was a critical component of the design process.

Author Contributions

J.L.P. prepared the first draft of the paper and provided some of the figures. M.H. did the statistical analysis of the well data and created many of the figures. T.M.M. edited and wrote the final paper draft and provided funding for the project. All authors have read and agreed to the published version of the manuscript.

Funding

This research received no external funding. It was funded internally by the Emergent Technologies Institute at Florida Gulf Coast University.

Institutional Review Board Statement

Not applicable.

Informed Consent Statement

Not applicable.

Data Availability Statement

All data used in the investigation is contained in the paper and is archived by the City of Cape Coral Utilities Department.

Conflicts of Interest

The authors declare no conflict of interest.

References

  1. Alley, W.; Reilly, T.E.; Franke, O.L. Sustainability of Ground-Water Resources; U.S. Geological Survey Circular: Reston, VA, USA, 1999; Volume 1186.
  2. Stanton, J.S.; Anning, D.W.; Brown, C.J.; Moore, R.B.; McQuire, V.L.; Qi, S.L.; Harris, A.C.; Dennehy, K.F.; McMahon, P.B.; Degnan, J.R.; et al. Brackish Groundwater in the United States; U. S. Geological Survey Professional Paper; U. S. Geological Survey: Reston, VA, USA, 2017; Volume 1833.
  3. Pearson, J.L.; Michael, P.R.; Ghaffour, N.; Missimer, T.M. Economics and energy consumption of brackish-water reverse osmosis desalination: Innovations and impacts of feedwater quality. Membranes 2021, 11, 616. [Google Scholar] [CrossRef] [PubMed]
  4. Florida Department of Environmental Protection (FDEP). Desalination in Florida: Technology, Implementation, and Environmental Issues; Division of Water Resources Management, Florida Department of Environmental Protect: Tallahassee, FL, USA, 2010.
  5. South Florida Water Management District. Facilities Using Brackish Groundwater and Seawater in South Florida; South Florida Water Management District: West Palm Beach, FL, USA, 2019. Available online: https://www.sfwmd.gov/sites/default/files/2019_Facilities_Using_Brackish_Groundwater_and_Seawater_in_South_Florida.pdf (accessed on 10 May 2021).
  6. Sproul, C.R.; Boggess, D.H.; Woodard, H.J. Saline-Water Intrusion from Deep Artesian Sources in the McGregor Isles Area of Lee County, Florida; Florida Bur. of Geology Information Circular; Florida Bur. of Geology: Tallahassee, FL, USA, 1972; Volume 75.
  7. Boggess, D.H. Saline Ground-Water Resources of Lee County, Florida; U. S. Geological Survey Open-File Report FL 74–247; U. S. Geological Survey: Tallahassee, FL, USA, 1974.
  8. Wedderburn, W.A.; Knapp, M.S.; Waltz, D.P.; Burns, W.S. Hydrogeologic Reconnaissance of Lee County, Florida; South Florida Water Management District, Technical Publication, South Florida Water Management District: West Palm Beach, FL, USA, 1982; Volume 82.
  9. Missimer, T.M.; Martin, W.K. Hydrogeology of Lee County, Florida. In Geology and Hydrology of Lee County, Florida; Missimer, T.M., Scott, T.M., Eds.; Florida Geological Survey Special Publication: Tallahassee, FL, USA, 2001; Volume 49, pp. 91–137. [Google Scholar]
  10. CH2M-Hill. Design Report of the City of Cape Coral Wellfield to Supply the RO Plant; Consultant’s to the City of Cape Coral, FL; CH2M-Hill: Naples, FL, USA, 1975. [Google Scholar]
  11. Kopko, S.P. The Story of Water Treatment and the Cape Coral Experience; Infinity Publishing: West Conshohocken, PA, USA, 2015. [Google Scholar]
  12. Missimer & Associates, Inc. City of Cape Coral Master Water Supply Plan, Phase II Report, Hydrogeology and Hydraulic Solute Transport Modeling of the Upper Floridan Aquifer System Beneath Cape Coral, Florida; Consultant’s Report to the City of Cape Coral, Florida; Missimer & Associates, Inc.: Atlanta, GA, USA, 1991; p. 141. [Google Scholar]
  13. MWH. W-10 Water Supply Resource Study Study, Task 6: Future Water Supply Sources for the City of Cape Coral Final Planning Report; Consultant’s Report to the City of Cape Coral, FL; MWH: Cape Coral, FL, USA.
  14. Li, M. Optimal plant operation of brackish water reverse osmosis (BWRO) desalination. Desalination 2012, 293, 61–68. [Google Scholar] [CrossRef]
  15. Khanzada, N.K.; Khan, S.; Davies, P.A. Performance evaluation of reverse osmosis (RO) pre-treatment technologies for inland brackish water treatment. Desalination 2017, 406, 44–50. [Google Scholar] [CrossRef] [Green Version]
  16. Biesheuval, P.M.; Zhang, L.; Gasquet, P.; Blankert, B.; Elimelech, M.; van der Meer, W.G.J. Ion selectivity in brackish water desalination by reverse osmosis: Theory, measurements, and implications. Environ. Sci. Technol. 2020, 7, 42–47. [Google Scholar] [CrossRef] [Green Version]
  17. Zhao, L.; Chang, P.C.-Y.; Yen, C.; Ho, W.W.S. High-flux and fouling resistant membranes for brackish water desalination. J. Membr. Sci. 2013, 425–426, 1–10. [Google Scholar]
  18. Greenlee, L.F.; Lawler, D.E.; Freemen, B.D.; Marrot, B.; Moulin, P. Reverse osmosis desalination: Water sources, technology, and today’s challenges. Water Res. 2009, 43, 317–2348. [Google Scholar] [CrossRef] [PubMed]
  19. Alsarayreh, A.A.; A.-Obaidi, M.A.; Al-Hroub, A.M.; Patel, R.; Mujtaba, I.M. Evaluation of energy consumption in a medium-scale reverse osmosis brackish water desalination plant. J. Cleaner Prod. 2020, 248, 11920. [Google Scholar] [CrossRef]
  20. Drendel, R.; Kinzli, K.D.A.; Koeble, A.; Missimer, T.M. Management of BWRO systems using long-term monitoring of feed water quality to avoid future membrane process failure. Desalin. Water Treat. 2016, 57, 16209–16219. [Google Scholar] [CrossRef] [Green Version]
  21. Missimer, T.M. Water Supply Development, Aquifer Storage, and Concentrate Disposal for Membrane Water Treatment Facilities, 2nd ed.; Methods in Water Resources Evaluation Series No. 1; Schlumberger Water Services: Houston, TX, USA, 2009. [Google Scholar]
  22. Missimer, T.M. Raw water quality: The critical design factor for brackish water reverse osmosis treatment facilities. Desalin. Water Reuse Q. 1999, 9, 41–47. [Google Scholar]
  23. Maliva, R.G.; Missimer, T.M. Improved aquifer characterization and the optimization of the design of brackish groundwater desalination systems. Desalin. Water Treat. 2011, 3, 190–196. [Google Scholar] [CrossRef]
  24. Missimer, T.M.; Maliva, R.G.; Watson, I. Brackish-water desalination in Florida: Is the feed water from the Floridan Aquifer System a sustainable resource. In Proceedings of the Florida Section of the American Water Works Association Annual Meeting, Orlando, FL, USA, 30 November–2 December 2014. [Google Scholar]
  25. Schers, G.J.; Rectenwald, E.; Andersen, J.; Fenske, A.; Barnes, A.; Brogdon, H.; Uram, T. Salinity increases in the upper Floridan Aquifer System wellfield in south Florida: What have we learned and how do we plan new systems? In Proceedings of the Florida Section, American Water Works Association Annual Meeting, Orlando, FL, USA, 30 November 2015. [Google Scholar]
  26. MWH. South Cape Coral BWRO Plant Expansion (W-4) Record Drawing Sheet G-04; Consultant’s Report to the City of Cape Coral; MWH: Cape Corel, FL, USA, 2008. [Google Scholar]
  27. Missimer, T.M.; Banks, R.S. Miocene cyclic sedimentation in western Lee County, Florida. In Miocene of the Southeastern United States; Scott, T.M., Upchurch, S.B., Eds.; Florida Bureau of Geology Special Publication: Tallahassee, FL, USA, 1982; Volume 25, pp. 285–298. [Google Scholar]
  28. Boggess, D.H.; Missimer, T.M.; O’Donnell, T.H. Saline Water Intrusion Related to Well Construction in Lee County, Florida; U.S. Geological Survey Water Resources Investigations, 77–33; U.S. Geological Survey: Tallahassee, FL, USA, 1976.
  29. Fitzpatrick, D.J. Tests for Injecting, Storage and Recovery of Freshwater in a Saline Artesian Aquifer, Lee County, Florida; U. S. Geological Survey Water-Resources Investigations 85–4249; U.S. Geological Survey: Tallahassee, FL, USA, 1986.
  30. Bower, R.F.; Adams, K.M.; Restrepo, J.I. A Three-Dimensional Finite-Difference Ground-Water Flow Model of Lee County, Florida; Technical Publication 90–01; South Florida Water Management District: West Palm Beach, FL, USA, 1990.
  31. Missimer & Associates, Inc. Aquifer Test on Isolated Hawthorn Aquifer System–Zones II and III Using Inflatable Packer Separation; Consultant’s Report No. 231–84 to the City of Cape Coral; Missimer & Associates, Inc.: Cape Coral, FL, USA, 1984; 19p. [Google Scholar]
  32. Missimer & Associates, Inc. Cape Coral Reverse Osmosis Wellfield Final Construction Report and Operation and Maintenance Recommendations; Consultant’s to the City of Cape Coral, FL; Missimer & Associates, Inc.: Cape Coral, FL, USA, 1985; Volume 3. [Google Scholar]
  33. Missimer & Associates, Inc. City of Cape Coral Master Water Supply Plan, Phase I Report: Preliminary Assessment of Sources of Water for Future Potable Water Supply in the City of Cape Coral; Consultant’s Report to the City of Cape Coral; Missimer & Associates, Inc.: Cape Coral, FL, USA, 1989; 178p. [Google Scholar]
  34. MWH. Southwest Wellfield Expansion Well Completion Report; Consultant’s to the City of Cape Coral, FL; MWH: Cape Coral, FL, USA, 2007. [Google Scholar]
  35. MWH. North Wellfield Expansion Well Completion Report; Consultant’s Report to the City of Cape Coral, FL; MWH: Cape Coral, FL, USA, 2008. [Google Scholar]
  36. MWH. W-2C North Production Well System, North Wellfield Completion Report, 2008; Consultant’s Report to the City of Cape Coral: City of Cape Coral; MWH: Cape Coral, FL, USA, 2009. [Google Scholar]
  37. Copeland, R. Hydrostratigraphic Units of Florida; Florida Geological Survey Poster No. 16 (one sheet); Florida Geological Survey: Tallahassee, FL, USA, 2010.
  38. Reese, R.S.; Richardson, E. Synthesis of the Hydrogeologic Framework of the Floridan Aquifer System and Delineation of a Major Avon Park Permeability Zone in Central and Southern Florida; U. S. Geological Survey Scientific Investigations Report 2007–5707; U. S. Geological Survey: Tallahassee, FL, USA, 2008.
  39. U. S. Army Corps of Engineers and South Florida Water Management District. Draft ASR Regional Study Phase I–Groundwater Modeling; Report Prepared for USACE-SAJ and SFWMD by the USACE-NAP; U. S. Army Corps of Engineers and South Florida Water Management District: Jacksonville, FL, USA, 2006.
  40. U. S. Army Corps of Engineers and South Florida Water Management District. Final Groundwater Model Calibration Report–Aquifer Storage and Recovery Regional Modeling Study; Report prepared for USACE-SAJ and SFWMD by the USACE-NAP; U. S. Army Corps of Engineers and South Florida Water Management District: Jacksonville, FL, USA, 2011.
  41. U. S. Army Corps of Engineers. Central and Southern Florida Project. Comprehensive Everglades Restoration Plan, Final Technical Data report, Aquifer Storage and Recovery Regional Study; U. S. Army Corps of Engineers: Jacksonville, FL, USA, 2014.
  42. Harvey, N.J.; Missimer, T.M. Impacts of projected changes in feed-water salinity on the City of Cape Coral, Florida north-brackish water reverse osmosis desalination plant operation. Desalin. Water Treat. 2020, 181, 1–16. [Google Scholar] [CrossRef]
  43. Harvey, N.J.; Johnston, D.; Missimer, T.M. Long-term pumping-induced groundwater quality changes at a brackish-water desalination facility, Sanibel Island, Florida. Desalin. Water Treat. 2020, 202, 1–13. [Google Scholar] [CrossRef]
  44. Schroeder, D.; Thomson, A.; Missimer, T.M. Characterization change of the production aquifer affects the successful design and operation of a brackish-water reverse osmosis plant over the lifespan of the facility, The Town of Jupiter, Florida. Desalin. Water Treat. 2021, 227, 1–15. [Google Scholar] [CrossRef]
  45. Schroeder, D.W.; Missimer, T.M. Production aquifer water salinity change impacts on brackish-water reverse osmosis desalination facility process design: The City of Clewiston, Florida. Desalin. Water Treat. 2021. [Google Scholar] [CrossRef]
  46. Mead, E.; Victory, J.; Missimer, T.M. Changes in feed water salinity with pumping in wellfields used to supply a brackish water RO facility at the City of Fort Myers, Florida. Desalin. Water Treat. 2020, 171, 1–12. [Google Scholar] [CrossRef]
  47. Schroeder, D.W.; Guo, W.; Missimer, T.M. Groundwater quality impacts of brackish-water reverse osmosis water treatment plant design: The City of Clearwater, Florida. Desalin. Water Treat. 2021, 211, 31–44. [Google Scholar] [CrossRef]
  48. Arico, Q.L.; Kassis, Z.R.; Maliva, R.G.; Guo, W.; Manahan, W.S.; Missimer, T.M. Changes in pumping-induced groundwater quality used to supply a large-capacity brackish-water desalination facility, Collier County, Florida: A new aquifer conceptual model. Water 2021, 13, 1951. [Google Scholar] [CrossRef]
  49. Nitto Hydranautics Corporation. Membrane Element ESPA2-LD Specifications. 2021. Available online: https://complete-water.com/product/hydranautics-nitto-ro-membranes-energy-saving-polyamide-espa2-espa2-ld (accessed on 5 May 2021).
Figure 2. Process diagram for the South Cape Coral BWRO [26].
Water 13 02654 g002
Figure 3. Map showing the location of production wells.
Water 13 02654 g003
Figure 4. Hydrogeologic section beneath the City of Cape Coral (from [12,21]).
Water 13 02654 g004
Figure 5. North–south hydrogeologic section through the City of Cape Coral showing the aquifer and confining bed locations (from [12,21]).
Water 13 02654 g005
Figure 6. Depth to the top of the Lower Hawthorn Aquifer (from [12,21]).
Water 13 02654 g006
Figure 7. Dissolved chloride concentrations in the Lower Hawthorn Aquifer in the City of Cape Coral. Note the very high dissolved chloride concentration in the lower eastern part of the map, which is near the Caloosahatchee River bridge (from [12,21]).
Water 13 02654 g007
Figure 8. Dissolved chloride profile with depth as used in the original solute transport model for the City of Cape Coral Utility Master Plan (from [12,21]).
Water 13 02654 g008
Figure 9. Pumping-induced lowering of the potentiometric surface of the Lower Hawthorn Aquifer in November 1990 (from [12,21].
Water 13 02654 g009
Figure 10. Water level data from two monitoring wells, located in the southern part of the City. Note that the water levels fluctuate on a seasonal basis caused by variation in wellfield pumping, but there is no downward trend in water levels.
Water 13 02654 g010
Figure 11. Projected individual well TDS concentrations for the South Wellfield in the Lower Hawthorn Aquifer [13].
Water 13 02654 g011
Figure 12. Cross plot of the dissolved chloride concentration versus the TDS taken from chemical analyses of production well water samples from the Lower Hawthorn Aquifer [42].
Water 13 02654 g012
Figure 13. Monthly cumulative pumpage and dissolved chloride concentration versus time with a linear regression trend line.
Water 13 02654 g013aWater 13 02654 g013bWater 13 02654 g013cWater 13 02654 g013dWater 13 02654 g013eWater 13 02654 g013f
Figure 14. Original planning model projected dissolved chloride change for the South Wellfield along with the average values obtained from real data [12]. The actual data are shown from 2003 to 2020 (red dots), and the projection based on the trend analysis is shown up to 2031.
Water 13 02654 g014
Figure 15. Approximate location of fracture zone or fault that impacts water quality in the wellfield.
Water 13 02654 g015
Figure 16. New conceptual model for the City of Cape Coral wellfield.
Water 13 02654 g016
Table 1. South Wellfield construction details (City of Cape Coral 2021).
PLANT Well No.SFWMD Well No.SFWMD Well ID#Casing Depth (m)Total Depth (m)
101RO-127,259110274
102RO-227,261110227
103RO-327,263106209
104RO-427,265105215
105RO-527,267107213
106RO-6R27,269172244
107RO-727,271107228
108RO-827,273107228
109RO-927,275107228
110RO-1027,277107228
11110A27,316140217
112112158,260139220
211RO-1127,279183232
212RO-1227,281183226
213RO-1327,283180233
214RO-1427,285158214
215RO-1527,287170220
216RO-16150,927139215
217RO-1727,289134213
218RO-1827,291151220
219RO-1927,293157214
220RO-2027,295152219
221RO-2127,297157219
222RO-2227,299157196
223RO-2327,301128199
224RO-2427303119216
225RO-2527,312134218
226226158,262140218
227227158,263131218
228228158,264140218
229229158,265140217
230230R213,103154219
231231158,267133214
232232158,268143216
Table 2. Water Use Permit limiting conditions and submittals.
Limiting ConditionFrequencyCompliance Status
17Flow Meter Calibration
Report
Every Five yearsSubmittal date: August 2020
18Monthly Withdrawals
Report
QuarterlySubmittal date: January 2020
20Unaccounted for Water Loss Report (only requires when >10%)YearlySubmittal date: March 2016
22Long-Term Water Supply PlanOne timeSubmittal date: October 2019
23Ten-Year Water Use Compliance ReportEvery ten yearsSubmittal date: February 2016
27Table with Proposed WellsOne timeSubmittal date: August 2020
28Chloride Level ReportQuarterlySubmittal date: August 2020
29Ground Water Level ReportQuarterlySubmittal date: August 2020
30Annual Reclaimed Water ReportYearlySubmittal date: January 2020
31Emergency Preparedness PlanOne timeSubmittal date: March 2011
34Wellfield Operating ProgramOne timeSubmittal date: November 2008
35Leak Detection PlansYearly*Submittal date: September 2015
Table 3. Initial dissolved chloride concentration value in mg/L for March 2021 and projected values for 5, 10, 20, and 40 years.
Well No.Intercept Value5-Year
Projection
10-Year
Projection
20-Year
Projection
40-Year Projection
101652961100511351342
102704970103111511393
103727746766865884
10418961809178917501671
1059601834203324313225
106392585689717892
107593701726775873
108797807809814823
109525540543550564
110512591610646718
111524573584607651
112859904152017652254
2115167958589851238
21269792998210871285
21310791969217125763385
21423911957185816611267
2158871484161918912433
216767967101311041286
217681996106712101496
2185971251140016972292
219656939100311321389
220592659674704765
221693750763789842
222578638652680735
2238031051110812201446
2247739049349941113
2259601245131014401699
226824982101610891233
2275571907221428274055
2288542138243030134181
2292730----
2305001108127816182299
231650----
232652939100511351396
Average8411082117013141598
Table 4. Comparison of the measured and projected data from the linear regression analyses to the MWH individual well projections [13].
Well No.201420242060
Proj. TDS
mg/L
Actual
TDS
mg/L
Error
Percent.
Proj.
TDS
mg/L
Trend
TDS
mg/L
Error
Percent.
Proj.
TDS
mg/L
Trend
TDS
mg/L
Error
Percent
10129001780+39.337001954+47.258002703+53.4
10224001850+22.928002005+28.442002698+35.8
10320001611+19.527001661+38.540001887+52.8
10426003267−25.730003367−10.947003141+33.2
10522002832−28.730003265−8.146005619−18.1
10621001285+38.83200136+56.443001900+55.8
10723001492+35.130001588+47.156001870+66.6
10822501756+22.029001723+40.249001707+65.2
10920001328+33.626001321+49.240001377+65.6
11017001369+19.52000415+29.327001623+39.9
11116001360+15.020001388+30.628001516+45.9
11218002356−23.622002666−25.030004070−26.3
21129001564+46.040001725+56.989002451+72.4
21236001807+49.847001841+58.710,3002532+75.3
21342002869+31.748003551+26.082005872+28.4
21446004462+13.051003629+28.866002497+62.2
21540002152+46.243002800+34.952004355+16.3
21629001887+34.938002005+47.258002528+56.4
21730001860+38.038002042+46.361002962+53.1
21829002045+29.537001532+58.660004078+33.1
21923001790+22.229001670+42.450002692+46.2
22022001488+32.427001534+43.243001698+60.5
22118001637+9.122001670+24.134001820+46.5
22220001457+27.224001492+37837001650+55.4
22333001991+39736002136+40.741002783+32.1
22422001835+16.622001911+13.226002255+13.3
22533002278+34.041002442+49.58200316+61.1
22635001941+44.544002032+53.862002443+60.6
22742002470+41.251003418+33.069006938−0.5
22843002630+38.85200793+27.177007142+7.2
2294000--5100--9200--
23027001756+35.033002190+33.657004142+27.3
23140003347+16.35100--10,400--
23242001788+57.452001954+62.410,4002703+74.0
Avg.28812041+29.235532163+39.156062925+47.8
Publisher’s Note: MDPI stays neutral with regard to jurisdictional claims in published maps and institutional affiliations.

