
Spatial Heterogeneity and Driving Factors of Soil Moisture in Alpine Desert Using the Geographical Detector Method


 , ,
, ,
Abstract
:1. Introduction
2. Materials and Methods
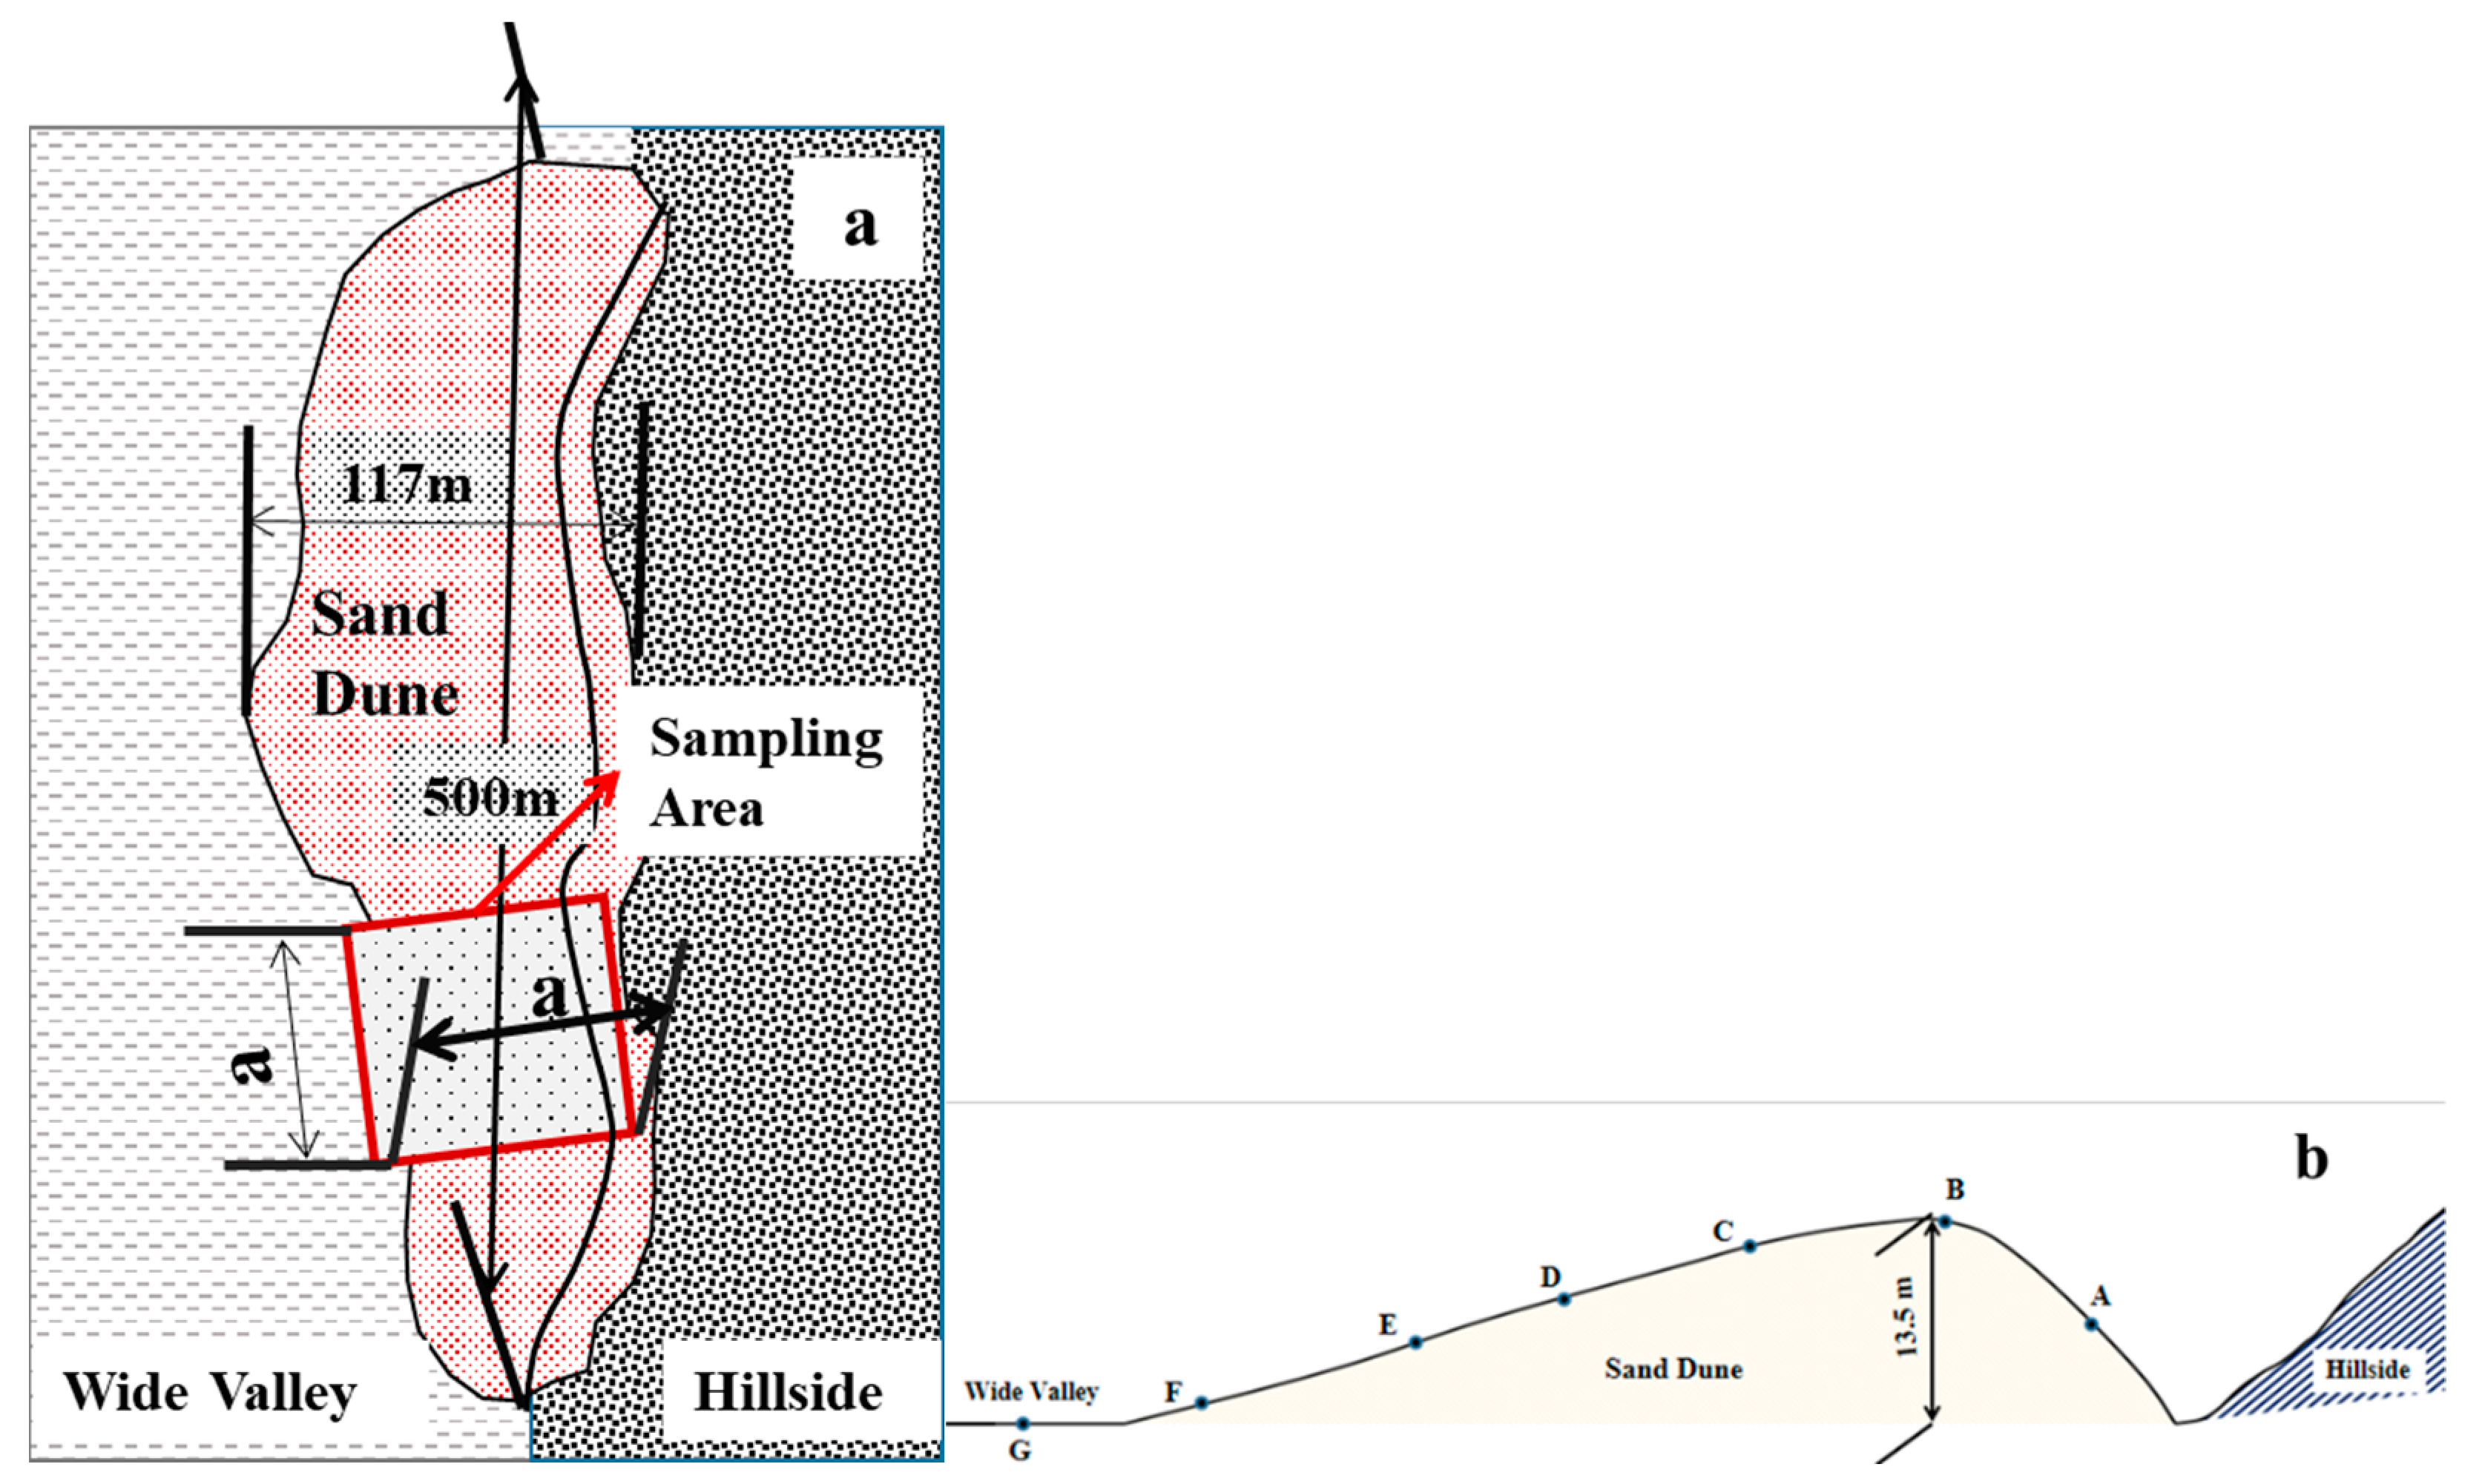
2.1. Study Area and Data Sources
2.2. Methods
2.2.1. Semi-Variogram Model and Kriging Method
- (b)
- (c)
2.2.2. Geographical Detector Method
3. Results
3.1. Statistical Characteristics of Soil Moisture in the Alpine Valley Desert
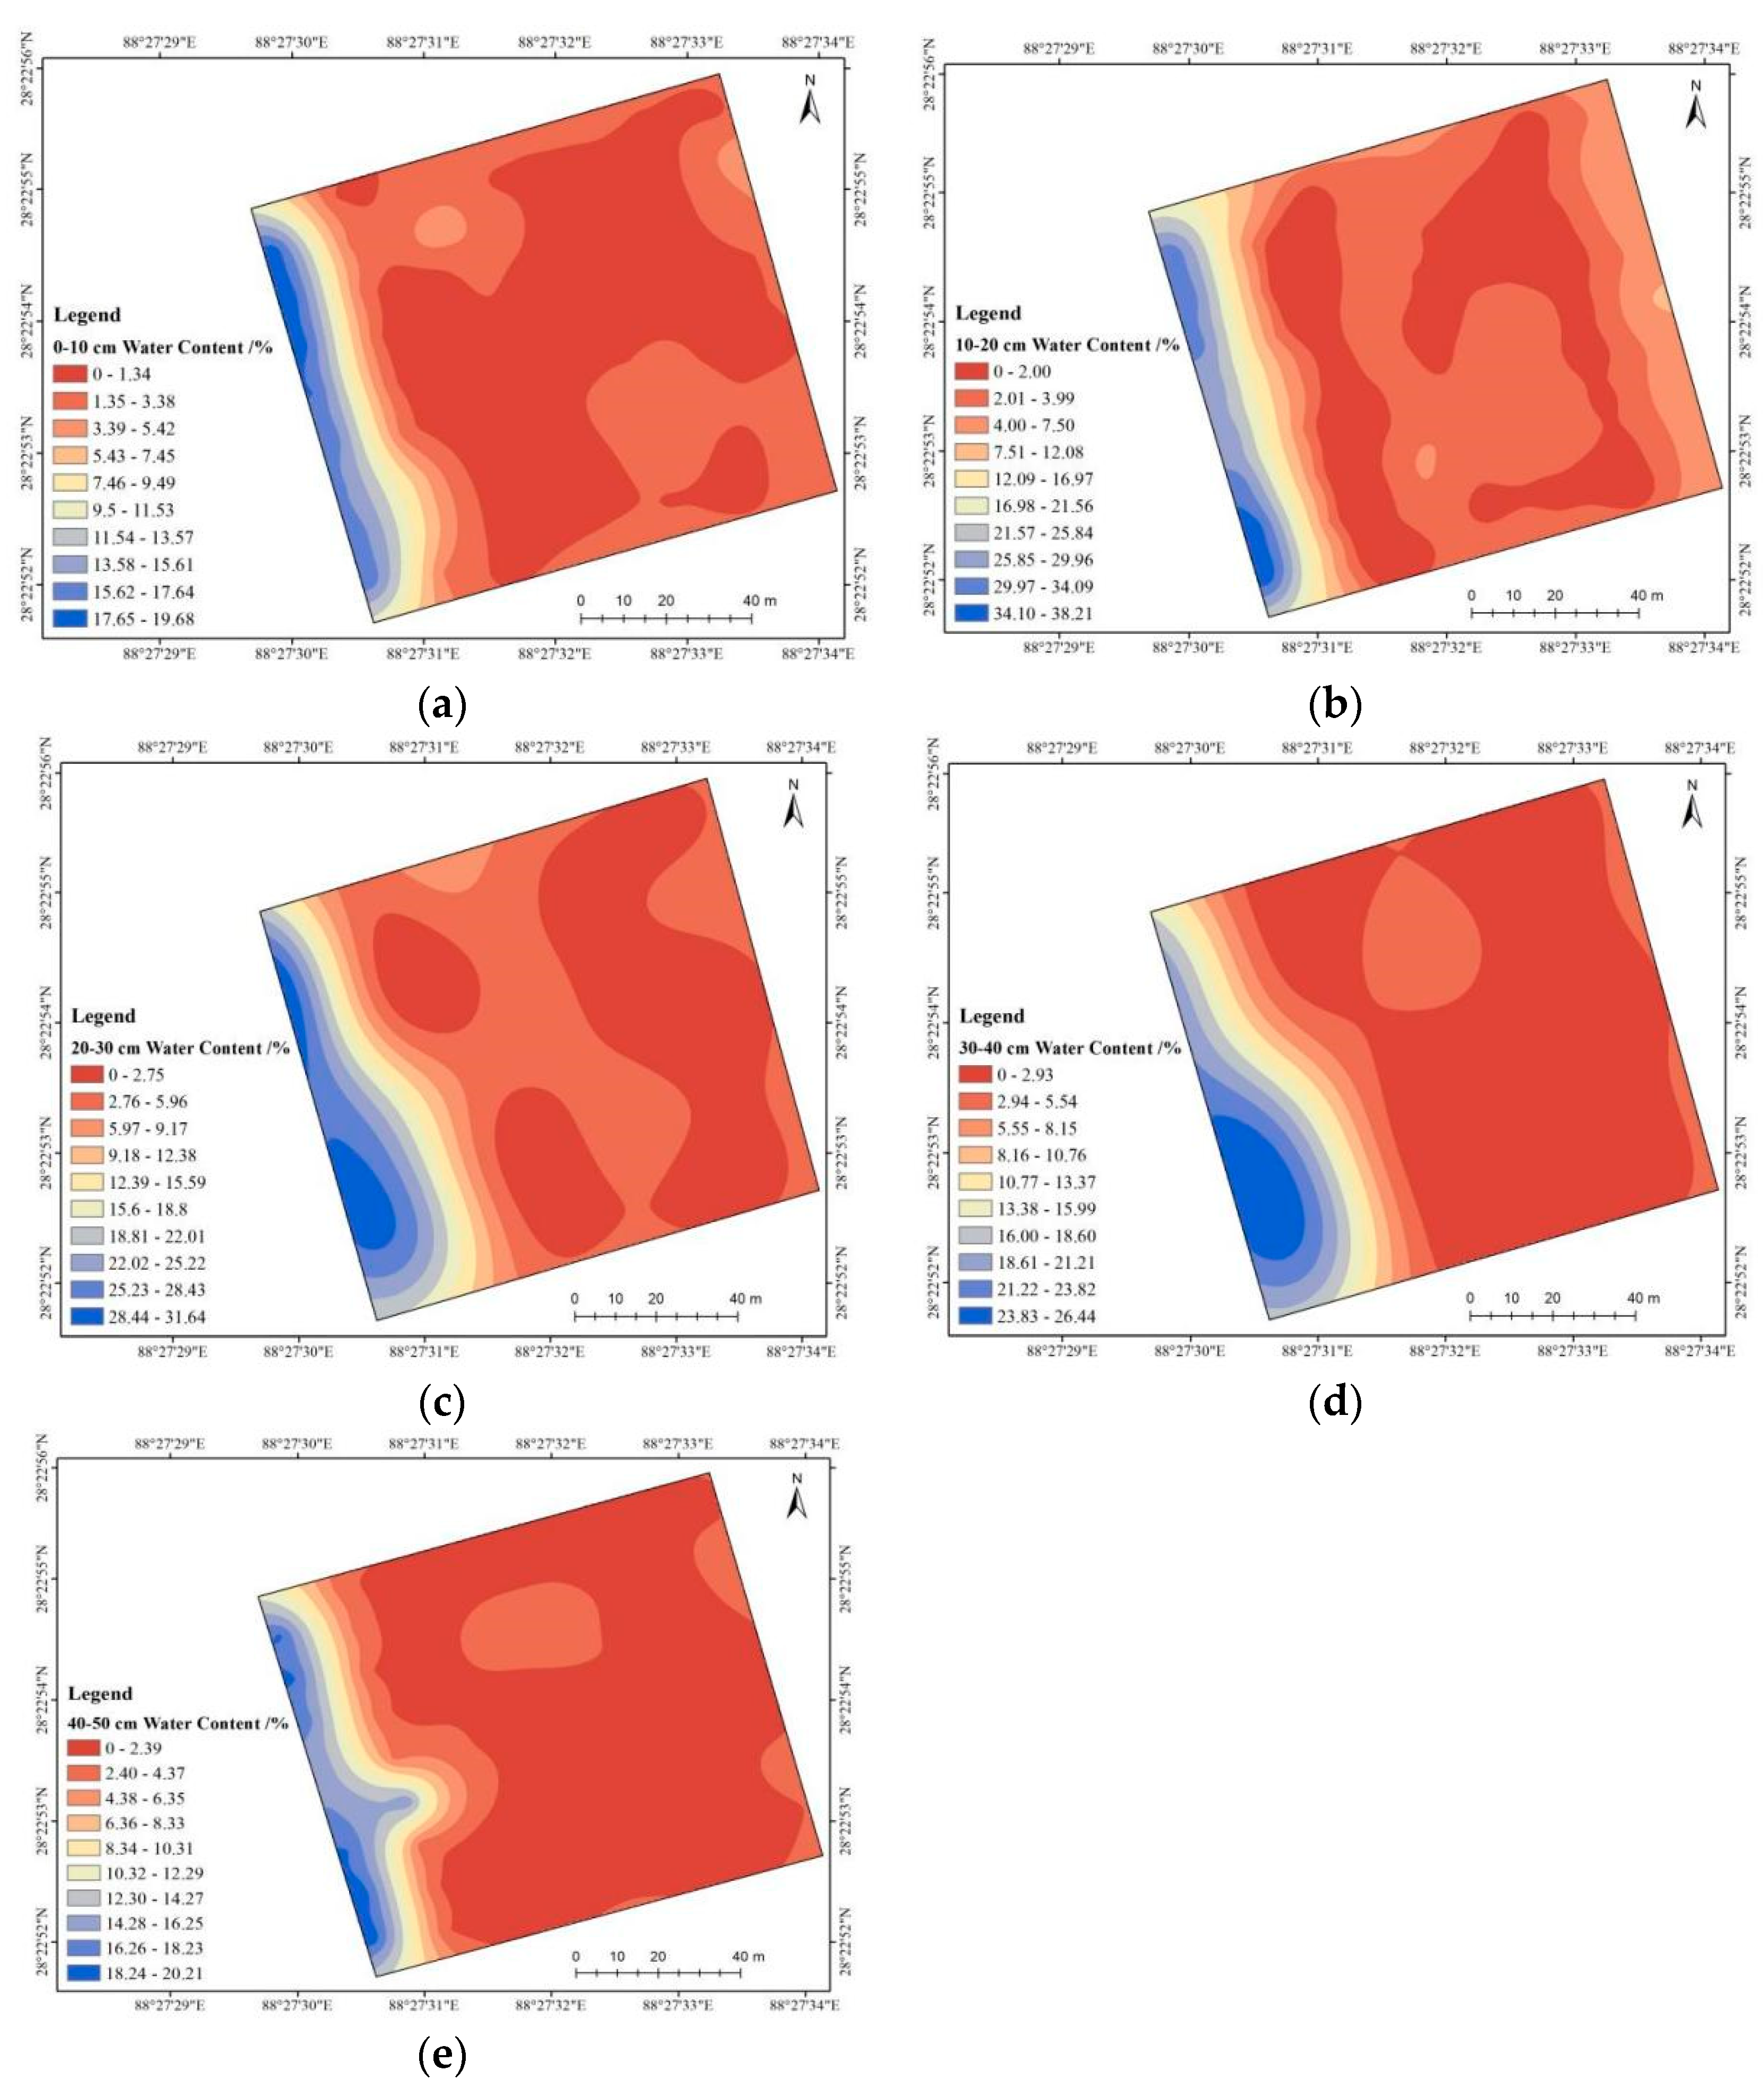
3.2. Spatial Heterogeneity of Soil Moisture in the Alpine Valley Desert
3.3. Driving Factors of Soil Moisture in Alpine Valley Dunes
3.3.1. Factor Detector
3.3.2. Interactive Detector
3.3.3. Ecological Detector
4. Discussion
5. Conclusions
Author Contributions
Funding
Institutional Review Board Statement
Informed Consent Statement
Data Availability Statement
Conflicts of Interest
Appendix A

| Soil Depth /cm | Interaction (C) | Sum of q Values | Result | Influence |
|---|---|---|---|---|
| 0–10 | X1 ∩ X2 = 0.8901 | 1.5017 | C > Max(q (X1), q (X2)) | Two-factor enhancement |
| X1 ∩ X3 = 0.6267 | 0.6209 | C > Max(q (X1), q (X2)) | Nonlinear enhancement | |
| X1 ∩ X4 = 0.6267 | 1.2406 | C > q (X1) + q (X4) | Two-factor enhancement | |
| X1 ∩ X5 = 0.6267 | 1.0981 | C > Max(q (X1), q (X4)) | Two-factor enhancement | |
| X2 ∩ X3 = 0.8901 | 0.8820 | C > Max(q (X1), q (X5)) | Nonlinear enhancement | |
| X2 ∩ X4 = 0.8901 | 1.5017 | C > q (X2) + q (X4) | Two-factor enhancement | |
| X2 ∩ X5 = 0.8834 | 1.3592 | C > Max(q (X2), q (X4)) | Two-factor enhancement | |
| X3 ∩ X4 = 0.6267 | 0.6209 | C > Max(q (X2), q (X5)) | Nonlinear enhancement | |
| X3 ∩ X5 = 0.5154 | 0.4784 | C > q (X3) + q (X5) | Nonlinear enhancement | |
| X4 ∩ X5 = 0.6267 | 1.0981 | C > q (X4) + q (X5) | Two-factor enhancement | |
| 10–20 | X1 ∩ X2 = 0.9124 | 1.7320 | C > Max(q (X4), q (X5)) | Two-factor enhancement |
| X1 ∩ X3 = 0.8265 | 0.8583 | C > Max(q (X1), q (X2)) | Two-factor enhancement | |
| X1 ∩ X4 = 0.8265 | 1.6470 | C > Max(q (X1), q (X3)) | Two-factor enhancement | |
| X1 ∩ X5 = 0.8267 | 1.4510 | C > Max(q (X1), q (X4)) | Two-factor enhancement | |
| X2 ∩ X3 = 0.9124 | 0.9433 | C > Max(q (X1), q (X5)) | Two-factor enhancement | |
| X2 ∩ X4 = 0.9124 | 1.7320 | C > Max(q (X2), q (X3)) | Two-factor enhancement | |
| X2 ∩ X5 = 0.9100 | 1.5360 | C > Max(q (X2), q (X4)) | Two-factor enhancement | |
| X3 ∩ X4 = 0.8265 | 0.8583 | C > Max(q (X2), q (X5)) | Two-factor enhancement | |
| X3 ∩ X5 = 0.7698 | 0.6623 | C > Max(q (X3), q (X4)) | Nonlinear enhancement | |
| X4 ∩ X5 = 0.8267 | 1.4510 | C > q (X4) + q (X5) | Two-factor enhancement | |
| 20–30 | X1 ∩ X2 = 0.9288 | 1.6646 | C > Max(q (X4), q (X5)) | Two-factor enhancement |
| X1 ∩ X3 = 0.7415 | 0.7648 | C > Max(q (X1), q (X2)) | Two-factor enhancement | |
| X1 ∩ X4 = 0.7415 | 1.4742 | C > Max(q (X1), q (X3)) | Two-factor enhancement | |
| X1 ∩ X5 = 0.7417 | 1.4192 | C > Max(q (X1), q (X4)) | Two-factor enhancement | |
| X2 ∩ X3 = 0.9288 | 0.9552 | C > Max(q (X1), q (X5)) | Two-factor enhancement | |
| X2 ∩ X4 = 0.9288 | 1.6646 | C > Max(q (X2), q (X3)) | Two-factor enhancement | |
| X2 ∩ X5 = 0.9287 | 1.6096 | C > Max(q (X2), q (X4)) | Two-factor enhancement | |
| X3 ∩ X4 = 0.7415 | 0.7648 | C > Max(q (X2), q (X5)) | Two-factor enhancement | |
| X3 ∩ X5 = 0.6880 | 0.7098 | C > Max(q (X3), q (X4)) | Two-factor enhancement | |
| X4 ∩ X5 = 0.7417 | 1.4192 | C > Max(q (X3), q (X5)) | Two-factor enhancement | |
| 30–40 | X1 ∩ X2 = 0.9560 | 1.7390 | C > Max(q (X4), q (X5)) | Two-factor enhancement |
| X1 ∩ X3 = 0.7891 | 0.7930 | C > Max(q (X1), q (X2)) | Two-factor enhancement | |
| X1 ∩ X4 = 0.7891 | 1.5710 | C > Max(q (X1), q (X3)) | Two-factor enhancement | |
| X1 ∩ X5 = 0.7891 | 1.4881 | C > Max(q (X1), q (X4)) | Two-factor enhancement | |
| X2 ∩ X3 = 0.9560 | 0.9610 | C > Max(q (X1), q (X5)) | Two-factor enhancement | |
| X2 ∩ X4 = 0.9560 | 1.7390 | C > Max(q (X2), q (X3)) | Two-factor enhancement | |
| X2 ∩ X5 = 0.9542 | 1.6561 | C > Max(q (X2), q (X4)) | Two-factor enhancement | |
| X3 ∩ X4 = 0.7891 | 0.7930 | C > Max(q (X2), q (X5)) | Two-factor enhancement | |
| X3 ∩ X5 = 0.7208 | 0.7101 | C > Max(q (X3), q (X4)) | Nonlinear enhancement | |
| X4 ∩ X5 = 0.7891 | 1.4881 | C > q (X4) + q (X5) | Two-factor enhancement | |
| 40–50 | X1 ∩ X2 = 0.9300 | 1.6661 | C > Max(q (X4), q (X5)) | Two-factor enhancement |
| X1 ∩ X3 = 0.7423 | 0.7382 | C > Max(q (X1), q (X2)) | Nonlinear enhancement | |
| X1 ∩ X4 = 0.7423 | 1.4760 | C > q (X1) + q (X4) | Two-factor enhancement | |
| X1 ∩ X5 = 0.7426 | 1.3299 | C > Max(q (X1), q (X4)) | Two-factor enhancement | |
| X2 ∩ X3 = 0.9300 | 0.9283 | C > Max(q (X1), q (X5)) | Nonlinear enhancement | |
| X2 ∩ X4 = 0.9300 | 1.6661 | C > q (X2) + q (X4) | Two-factor enhancement | |
| X2 ∩ X5 = 0.9293 | 1.5200 | C > Max(q (X2), q (X4)) | Two-factor enhancement | |
| X3 ∩ X4 = 0.7423 | 0.7382 | C > Max(q (X2), q (X5)) | Nonlinear enhancement | |
| X3 ∩ X5 = 0.6210 | 0.5921 | C > q (X3) + q (X5) | Nonlinear enhancement | |
| X4 ∩ X5 = 0.7426 | 1.3299 | C > q (X4) + q (X5) | Two-factor enhancement | |
| 0–50 | X1 ∩ X2 = 0.9811 | 1.8660 | C > Max(q (X4), q (X5)) | Two-factor enhancement |
| X1 ∩ X3 = 0.8873 | 0.8859 | C > Max(q (X1), q (X2)) | Nonlinear enhancement | |
| X1 ∩ X4 = 0.8873 | 1.7706 | C > q (X1) + q (X4) | Two-factor enhancement | |
| X1 ∩ X5 = 0.8873 | 1.6609 | C > Max(q (X1), q (X4)) | Two-factor enhancement | |
| X2 ∩ X3 = 0.9811 | 0.9813 | C > Max(q (X1), q (X5)) | Two-factor enhancement | |
| X2 ∩ X4 = 0.9811 | 1.8660 | C > Max(q (X2), q (X3)) | Two-factor enhancement | |
| X2 ∩ X5 = 0.9810 | 1.7563 | C > Max(q (X2), q (X4)) | Two-factor enhancement | |
| X3 ∩ X4 = 0.8873 | 0.8859 | C > Max(q (X2), q (X5)) | Nonlinear enhancement | |
| X3 ∩ X5 = 0.8127 | 0.7762 | C > q (X3) + q (X5) | Nonlinear enhancement | |
| X4 ∩ X5 = 0.8873 | 1.6609 | C > q (X4) + q (X5) | Two-factor enhancement |
References
- Li, X.; Shao, M.; Zhao, C.; Jia, X. Spatial variability of soil water content and related factors across the Hexi Corridor of China. J. Arid. Land 2019, 11, 123–134. [Google Scholar] [CrossRef] [Green Version]
- Bi, H.; Li, X.; Liu, X.; Guo, M.; Li, J. A case study of spatial heterogeneity of soil moisture in the Loess Plateau, western China: A geostatistical approach. Int. J. Sediment Res. 2009, 24, 63–73. [Google Scholar] [CrossRef]
- Seneviratne, S.I.; Corti, T.; Davin, E.; Hirschi, M.; Jaeger, E.B.; Lehner, I.; Orlowsky, B.; Teuling, A. Investigating soil moisture–climate interactions in a changing climate: A review. Earth-Sci. Rev. 2010, 99, 125–161. [Google Scholar] [CrossRef]
- McColl, K.A.; Alemohammad, S.H.; Akbar, R.; Konings, A.G.; Yueh, S.; Entekhabi, D. The global distribution and dynamics of surface soil moisture. Nat. Geosci. 2017, 10, 100–104. [Google Scholar] [CrossRef]
- Moore, G.W.; Jones, J.A.; Bond, B.J. How soil moisture mediates the influence of transpiration on streamflow at hourly to interannual scales in a forested catchment. Hydrol. Process. 2011, 25, 3701–3710. [Google Scholar] [CrossRef]
- Jia, X.; Zhu, Y.; Luo, Y. Soil moisture decline due to afforestation across the Loess Plateau, China. J. Hydrol. 2017, 546, 113–122. [Google Scholar] [CrossRef]
- Venkatesh, B.; Lakshman, N.; Purandara, B.K.; Reddy, V.B. Analysis of observed soil moisture patterns under different land coversin Western Ghats, India. J. Hydrol. 2011, 397, 281–294. [Google Scholar] [CrossRef]
- Wei, X.; Zhou, Q.; Cai, M.; Wang, Y. Effects of Vegetation Restoration on Regional Soil Moisture Content in the Humid Karst Areas—A Case Study of Southwest China. Water 2021, 13, 321. [Google Scholar] [CrossRef]
- Baroni, G.; Ortuani, B.; Facchi, A.; Gandolfi, C. The role of vegetation and soil properties on the spatio-temporal variability of the surface soil moisture in a maize-cropped field. J. Hydrol. 2013, 489, 148–159. [Google Scholar] [CrossRef]
- Neelam, M.; Mohanty, B. On the Radiative Transfer Model for Soil Moisture across Space, Time and Hydro-Climates. Remote Sens. 2020, 12, 2645. [Google Scholar] [CrossRef]
- Zhang, W.; Yi, S.; Qin, Y.; Sun, Y.; Shangguan, D.; Meng, B.; Li, M.; Zhang, J. Effects of Patchiness on Surface Soil Moisture of Alpine Meadow on the Northeastern Qinghai-Tibetan Plateau: Implications for Grassland Restoration. Remote Sens. 2020, 12, 4121. [Google Scholar] [CrossRef]
- Herbert, C.; Pablos, M.; Vall-Llossera, M.; Camps, A.; Martínez-Fernández, J. Analyzing Spatio-Temporal Factors to Estimate the Response Time between SMOS and In-Situ Soil Moisture at Different Depths. Remote. Sens. 2020, 12, 2614. [Google Scholar] [CrossRef]
- Guo, X.; Fu, Q.; Hang, Y.; Lu, H.; Gao, F.; Si, J. Spatial Variability of Soil Moisture in Relation to Land Use Types and Topographic Features on Hillslopes in the Black Soil (Mollisols) Area of Northeast China. Sustainability 2020, 12, 3552. [Google Scholar]
- Feng, Q.; Zhao, W.; Qiu, Y.; Zhao, M.; Zhong, L. Spatial Heterogeneity of Soil Moisture and the Scale Variability of Its Influencing Factors: A Case Study in the Loess Plateau of China. Water 2013, 5, 1226–1242. [Google Scholar]
- Zhu, Q.; Lin, H. Influences of soil, terrain, and crop growth on soil moisture variation from transect to farm scales. Geoderma 2011, 163, 45–54. [Google Scholar] [CrossRef]
- Lakhankar, T.; Ghedira, H.; Temimi, M.; Azar, A.E.; Khanbilvardi, R. Effect of Land Cover Heterogeneity on Soil Moisture Retrieval Using Active Microwave Remote Sensing Data. Remote. Sens. 2009, 1, 80–91. [Google Scholar] [CrossRef] [Green Version]
- Li, H.; Shen, W.; Zou, C.; Jiang, J.; Fu, L.; She, G. Spatio-temporal variability of soil moisture and its effect on vegetation in a desertified aeolian riparian ecotone on the Tibetan Plateau, China. J. Hydrol. 2013, 479, 215–225. [Google Scholar] [CrossRef]
- López-Vicente, M.; Quijano, L.; Navas, A. Spatial patterns and stability of topsoil water content in a rainfed fallow cereal field and Calcisol-type soil. Agric. Water Manag. 2015, 161, 41–52. [Google Scholar] [CrossRef] [Green Version]
- Delbari, M.; Afrasiab, P.; Gharabaghi, B.; Amiri, M.; Salehian, A. Spatial variability analysis and mapping of soil physical and chemical attributes in a salt-affected soil. Arab. J. Geosci. 2019, 12, 68. [Google Scholar]
- Arriaga, J.; Rubio, F.R. A distributed parameters model for soil water content: Spatial and temporal variability analysis. Agric. Water Manag. 2017, 183, 101–106. [Google Scholar] [CrossRef]
- Wang, J.F.; Li, X.H.; Christakos, G.; Liao, Y.L.; Zhang, T.; Gu, X.; Zheng, X.Y. Geographical detectors-based health risk assessment and its application in the neural tube defects study of the Heshun region, China. Int. J. Geogr. Inf. Sci. 2010, 24, 107–127. [Google Scholar] [CrossRef]
- Du, J.; Yang, Z.G. Tibet Autonomous Region County-Level Climate Regionalization; China Meteorological Press: Beijing, China, 2013; pp. 73–74. [Google Scholar]
- Prokopovich, N.P.; Bara, J.P. Soil classification system, unified. In Applied Geology; Finkl, C., Ed.; Encyclopedia of Earth Sciences Series; Springer: Boston, MA, USA, 1984; Volume 3. [Google Scholar]
- Entin, J.K.; Robock, A.; Vinnikov, K.Y.; Hollinger, S.E.; Liu, S.; Namkhai, A. Temporal and spatial scales of observed soil moisture variations in the extratropics. J. Geophys. Res. Atmos. 2000, 105, 11865–11877. [Google Scholar] [CrossRef]
- Woebbecke, D.M. Plant species identification, size, and enumeration using machine vision techniqueson near-binary images. Proc. SPIE 1993, 1836, 208–219. [Google Scholar]
- Ren, J.; Bai, Y.C.; Wang, J.D. An efficient method for extracting vegetation coverage from digital photographs. Remote Sens. Technol. Appl. 2010, 25, 719–724. [Google Scholar]
- Journel, A.G. Mining Geostatistics; Academic Press: New York, NY, USA, 1978. [Google Scholar]
- Li, H.; Reynolds, J.F. On Definition and Quantification of Heterogeneity. Oikos 1995, 73, 280–284. [Google Scholar] [CrossRef]
- Maroufpoor, S.; Bozorg-Haddad, O.; Chu, X.F. Chapter 9—Geostatistics: Principles and Methods. In Handbook of Probabilistic Models; Samui, P., Bui, D.T., Chakraborty, S., Ravinesh, C.D., Eds.; Butterworth-Heinemann: Oxford, UK, 2020; pp. 229–242. [Google Scholar]
- Jean-Paul, C.; Pierre, D. Geostatistics: Modeling Spatial Uncertainty; Jhon Wiley & Sons Inc.: New York, NY, USA, 1999; p. 695. [Google Scholar]
- Paramasivam, C.; Venkatramanan, S. An Introduction to Various Spatial Analysis Techniques. GIS Geostat. Tech. Groundw. Sci. 2019, 23–30. [Google Scholar] [CrossRef]
- Zhang, Y.; Zhang, K.-C.; An, Z.-S.; Yu, Y.-P. Quantification of driving factors on NDVI in oasis-desert ecotone using geographical detector method. J. Mt. Sci. 2019, 16, 2615–2624. [Google Scholar] [CrossRef]
- Li, H.; Shen, W.; Lin, N.; Yuan, L.; Sun, M.; Ji, D. Spatial variability of soil moisture on aeolian sandy land in riparian ecotone of middle reaches of yarlung zangbo river valley. Trans. Chin. Soc. Agric. Eng. 2012, 28, 150–155. [Google Scholar]
- Liu, B.; Zhao, W.; Zeng, F. Statistical analysis of the temporal stability of soil moisture in three desert regions of northwestern China. Env. Earth Sci. 2013, 70, 2249–2262. [Google Scholar] [CrossRef]
- Zhu, X.; Shao, M.; Liang, Y.; Tian, Z.; Wang, X.; Qu, L. Mesoscale spatial variability of soilâ water content in an alpine meadow on the northern Tibetan Plateau. Hydrol. Process. 2019, 33, 2523–2534. [Google Scholar] [CrossRef]
- Zhang, X.; Zhao, Y. Identification of the driving factors’ influences on regional energy-related carbon emissions in China based on geographical detector method. Environ. Sci. Pollut. Res. 2018, 25, 9626–9635. [Google Scholar] [CrossRef]
- Conover, W.J.; Conover, W.J. Practical Nonparametric Statistics; John Wiley & Sons: Hoboken, NJ, USA, 1980. [Google Scholar]
- Liu, L.J.; Zhang, H.; Luo, L. Spatial heterogeneity of soil water of alpine area in eastern Qinghai-tibet plateau. J. Wuhan Univ. 2008, 54, 414–420. [Google Scholar]
- Savva, Y.; Szlavecz, K.; Carlson, D.; Gupchup, J.; Szalay, A.; Terzis, A. Spatial patterns of soil moisture under forest and grass land cover in a suburban area, in Maryland, USA. Geoderma 2013, 192, 202–210. [Google Scholar] [CrossRef]
- Wang, Y.; Shao, M.; Liu, Z. Vertical distribution and influencing factors of soil water content within 21-m profile on the Chinese Loess Plateau. Geoderma 2013, 300–310. [Google Scholar] [CrossRef]
- Zhu, Q.; Nie, X.; Zhou, X.; Liao, K.; Li, H. Soil moisture response to rainfall at different topographic positions along a mixed land-use hillslope. Catena 2014, 119, 61–70. [Google Scholar] [CrossRef]
- Yang, R.M.; Zhang, G.L.; Yang, F.; Zhi, J.J.; Yang, F.; Liu, F.; Zhao, Y.G.; Li, D.C. Precise estimation of soil organic carbon stocks in the northeast Tibetan Plateau. Sci. Rep. 2016, 6, 21842. [Google Scholar] [CrossRef] [PubMed] [Green Version]
- Zeng, C.; Zhang, F.; Wang, Q.; Chen, Y.; Joswiak, D.R. Impact of alpine meadow degradation on soil hydraulic properties over the Qinghai-Tibetan Plateau. J. Hydrol. 2013, 478, 148–156. [Google Scholar] [CrossRef]
- Yang, Z.; Ouyang, H.; Zhang, X.; Xu, X.; Zhou, C.; Yang, W. Spatial variability of soil moisture at typical alpine meadow and steppe sites in the Qinghai-Tibetan Plateau permafrost region. Environ. Earth Sci. 2010, 63, 477–488. [Google Scholar] [CrossRef] [Green Version]
- Li, H. A Study on Spatial Variability of Soil Properties and Influence of Vegetation on It at a Catchment of Southern Jiangsu Province in China; Nanjing Forestry University: Nanjing, China, 2008; (In Chinese with English Abstract). [Google Scholar]
- Yang, Y.; Huang, Y.; Zhang, Y.; Tong, X. Optimal Irrigation Mode and Spatio-Temporal Variability Characteristics of Soil Moisture Content in Different Growth Stages of Winter Wheat. Water 2018, 10, 1180. [Google Scholar] [CrossRef] [Green Version]


| Interaction | Description |
|---|---|
| Weaken, nonlinear | |
| Weaken, univariate Min | , |
| Enhance, bivariate | >, |
| Independent | = |
| Enhance, nonlinear | > |
| Depth /cm | Minimum /% | Maximum /% | Mean /% | Standard Deviation | Variation /% | Kurtosis | Skewness | K-S Test | |||
|---|---|---|---|---|---|---|---|---|---|---|---|
| Z Value * | p Value * | Z Value # | p Value # | ||||||||
| 0–10 | 0.07 | 20.93 | 3.68 | 6.23 | 169 | 2.53 | 2.02 | 0.34 | 0 | 0.82 | 0.54 |
| 10–20 | 0.27 | 38.33 | 7.06 | 10.71 | 152 | 2.93 | 2.11 | 0.35 | 0 | 0.83 | 0.40 |
| 20–30 | 0.51 | 33.03 | 7.84 | 10.28 | 131 | 0.77 | 1.55 | 0.35 | 0 | 0.80 | 0.24 |
| 30–40 | 0.59 | 28.85 | 6.63 | 8.60 | 130 | 0.53 | 1.49 | 0.36 | 0 | 0.80 | 0.31 |
| 40–50 | 0.26 | 21.61 | 4.36 | 6.35 | 146 | 2.26 | 1.99 | 0.37 | 0 | 0.79 | 0.42 |
| Depth /cm | Theoretical Model | Nugget | Sill | Nugget Coefficient /% | Range /m | Coefficient of Determination | Residual Sum of Squares (%2) |
|---|---|---|---|---|---|---|---|
| 0–10 | Spherical model | 6.30 | 45.99 | 13.7 | 37.42 | 0.991 | 3.98 |
| Exponential model | 2.40 | 45.8 | 5.20 | 44.61 | 0.98 | 9.49 | |
| Gaussian model | 10.73 | 41.98 | 25.60 | 27.31 | 0.97 | 9.99 | |
| 10–20 | Spherical model | 14.90 | 111.9 | 23.30 | 23.51 | 0.96 | 110 |
| Exponential model | 0.10 | 124.1 | 0.10 | 31.23 | 0.98 | 43.60 | |
| Gaussian model | 25 | 108.60 | 23 | 17.58 | 0.96 | 110 | |
| 20–30 | Spherical model | 20.60 | 169 | 12.20 | 61.09 | 0.96 | 97.70 |
| Exponential model | 17.90 | 236.70 | 7.60 | 142.28 | 0.95 | 150 | |
| Gaussian model | 34 | 148.90 | 22.80 | 41.70 | 0.99 | 21.20 | |
| 30–40 | Spherical model | 20 | 101 | 19.80 | 45.99 | 0.92 | 142 |
| Exponential model | 17.60 | 96.20 | 18.30 | 71.01 | 0.87 | 180 | |
| Gaussian model | 28.50 | 108 | 26.40 | 46.19 | 0.97 | 50.60 | |
| 40–50 | Spherical model | 9.37 | 40.78 | 32 | 23.76 | 0.983 | 44.20 |
| Exponential model | 7.20 | 53.64 | 13.40 | 63.38 | 0.99 | 0.37 | |
| Gaussian model | 13.45 | 40.05 | 33.60 | 23.48 | 0.99 | 5.15 |
| Soil Depth/cm | 0–10 | 10–20 | 20–30 | 30–40 | 40–50 |
|---|---|---|---|---|---|
| 0–10 | 1 | ||||
| 10–20 | 0.953 ** | 1 | |||
| 20–30 | 0.890 ** | 0.858 ** | 1 | ||
| 30–40 | 0.820 ** | 0.796 ** | 0.970 ** | 1 | |
| 40–50 | 0.898 ** | 0.926 ** | 0.862 ** | 0.816 ** | 1 |
| Soil Depth/cm | Natural Factors | Location | Elevation | Aspect | Slope | Vegetation |
|---|---|---|---|---|---|---|
| 0–10 | q | 0.620 | 0.881 | 0.001 | 0.620 | 0.478 |
| p value | 0.000 | 0.430 | 0.859 | 0.000 | 0.000 | |
| 10–20 | q | 0.824 | 0.909 | 0.035 | 0.824 | 0.628 |
| p value | 0.000 | 0.243 | 0.342 | 0.000 | 0.000 | |
| 20–30 | q | 0.737 | 0.928 | 0.028 | 0.737 | 0.682 |
| p value | 0.000 | 0.137 | 0.222 | 0.000 | 0.000 | |
| 30–40 | q | 0.785 | 0.953 | 0.008 | 0.785 | 0.703 |
| p value | 0.000 | 0.021 | 0.543 | 0.000 | 0.000 | |
| 40–50 | q | 0.738 | 0.928 | 0.000 | 0.738 | 0.592 |
| p value | 0.000 | 0.109 | 0.926 | 0.000 | 0.000 | |
| 0–50 | q | 0.885 | 0.981 | 0.001 | 0.885 | 0.776 |
| p value | 0.000 | 0.000 | 0.879 | 0.000 | 0.000 |
| Soil Depth /cm | Index | Location | Elevation | Aspect | Slope | Vegetation |
|---|---|---|---|---|---|---|
| X1 | X2 | X3 | X4 | X5 | ||
| 0–10 | X1 | 0.6203 | ||||
| X2 | 0.8901 (Y) | 0.8814 | ||||
| X3 | 0.6267 (Y) | 0.8901 (Y) | 0.0006 | |||
| X4 | 0.6267 (N) | 0.8901 (Y) | 0.6267 (Y) | 0.6203 | ||
| X5 | 0.6267 (N) | 0.8834 (Y) | 0.5154 (Y) | 0.6267 (N) | 0.4778 | |
| 10–20 | X1 | 0.8235 | ||||
| X2 | 0.9124 (Y) | 0.9085 | ||||
| X3 | 0.8265 (Y) | 0.9124 (Y) | 0.0348 | |||
| X4 | 0.8265 (N) | 0.9124 (Y) | 0.8265 (Y) | 0.8235 | ||
| X5 | 0.8267 (Y) | 0.9100 (Y) | 0.7698 (Y) | 0.8267 (Y) | 0.6275 | |
| 20–30 | X1 | 0.7371 | ||||
| X2 | 0.9288 (Y) | 0.9275 | ||||
| X3 | 0.7415 (Y) | 0.9288 (Y) | 0.0277 | |||
| X4 | 0.7415 (N) | 0.9288 (Y) | 0.7415 (Y) | 0.7371 | ||
| X5 | 0.7417 (N) | 0.9287 (Y) | 0.6880 (Y) | 0.7417 (N) | 0.6821 | |
| 30–40 | X1 | 0.7855 | ||||
| X2 | 0.9560 (Y) | 0.9535 | ||||
| X3 | 0.7891 (Y) | 0.9560 (Y) | 0.0075 | |||
| X4 | 0.7891 (N) | 0.9560 (Y) | 0.7891 (Y) | 0.7855 | ||
| X5 | 0.7891 (N) | 0.9542 (Y) | 0.7208 (Y) | 0.7891 (N) | 0.7026 | |
| 40–50 | X1 | 0.7380 | ||||
| X2 | 0.9300 (Y) | 0.9281 | ||||
| X3 | 0.7423 (Y) | 0.9300 (Y) | 0.0002 | |||
| X4 | 0.7423 (N) | 0.9300 (Y) | 0.7423 (Y) | 0.7380 | ||
| X5 | 0.7426 (Y) | 0.9293 (Y) | 0.6210 (Y) | 0.7426 (Y) | 0.5919 | |
| 0–50 | X1 | 0.8853 | ||||
| X2 | 0.9811 (Y) | 0.9807 | ||||
| X3 | 0.8873 (Y) | 0.9811 (Y) | 0.0006 | |||
| X4 | 0.8873 (N) | 0.9811 (Y) | 0.8873 (Y) | 0.8853 | ||
| X5 | 0.8873 (Y) | 0.9810 (Y) | 0.8127 (Y) | 0.8873 (Y) | 0.7756 |
Publisher’s Note: MDPI stays neutral with regard to jurisdictional claims in published maps and institutional affiliations. |
© 2021 by the authors. Licensee MDPI, Basel, Switzerland. This article is an open access article distributed under the terms and conditions of the Creative Commons Attribution (CC BY) license (https://creativecommons.org/licenses/by/4.0/).
Share and Cite
Zhang, Z.; Yin, H.; Zhao, Y.; Wang, S.; Han, J.; Yu, B.; Xue, J. Spatial Heterogeneity and Driving Factors of Soil Moisture in Alpine Desert Using the Geographical Detector Method. Water 2021, 13, 2652. https://doi.org/10.3390/w13192652
Zhang Z, Yin H, Zhao Y, Wang S, Han J, Yu B, Xue J. Spatial Heterogeneity and Driving Factors of Soil Moisture in Alpine Desert Using the Geographical Detector Method. Water. 2021; 13(19):2652. https://doi.org/10.3390/w13192652
Chicago/Turabian StyleZhang, Zhiwei, Huiyan Yin, Ying Zhao, Shaoping Wang, Jiahua Han, Bo Yu, and Jie Xue. 2021. "Spatial Heterogeneity and Driving Factors of Soil Moisture in Alpine Desert Using the Geographical Detector Method" Water 13, no. 19: 2652. https://doi.org/10.3390/w13192652
APA StyleZhang, Z., Yin, H., Zhao, Y., Wang, S., Han, J., Yu, B., & Xue, J. (2021). Spatial Heterogeneity and Driving Factors of Soil Moisture in Alpine Desert Using the Geographical Detector Method. Water, 13(19), 2652. https://doi.org/10.3390/w13192652