
Snowmelt and Snow Sublimation in the Indus Basin


Abstract
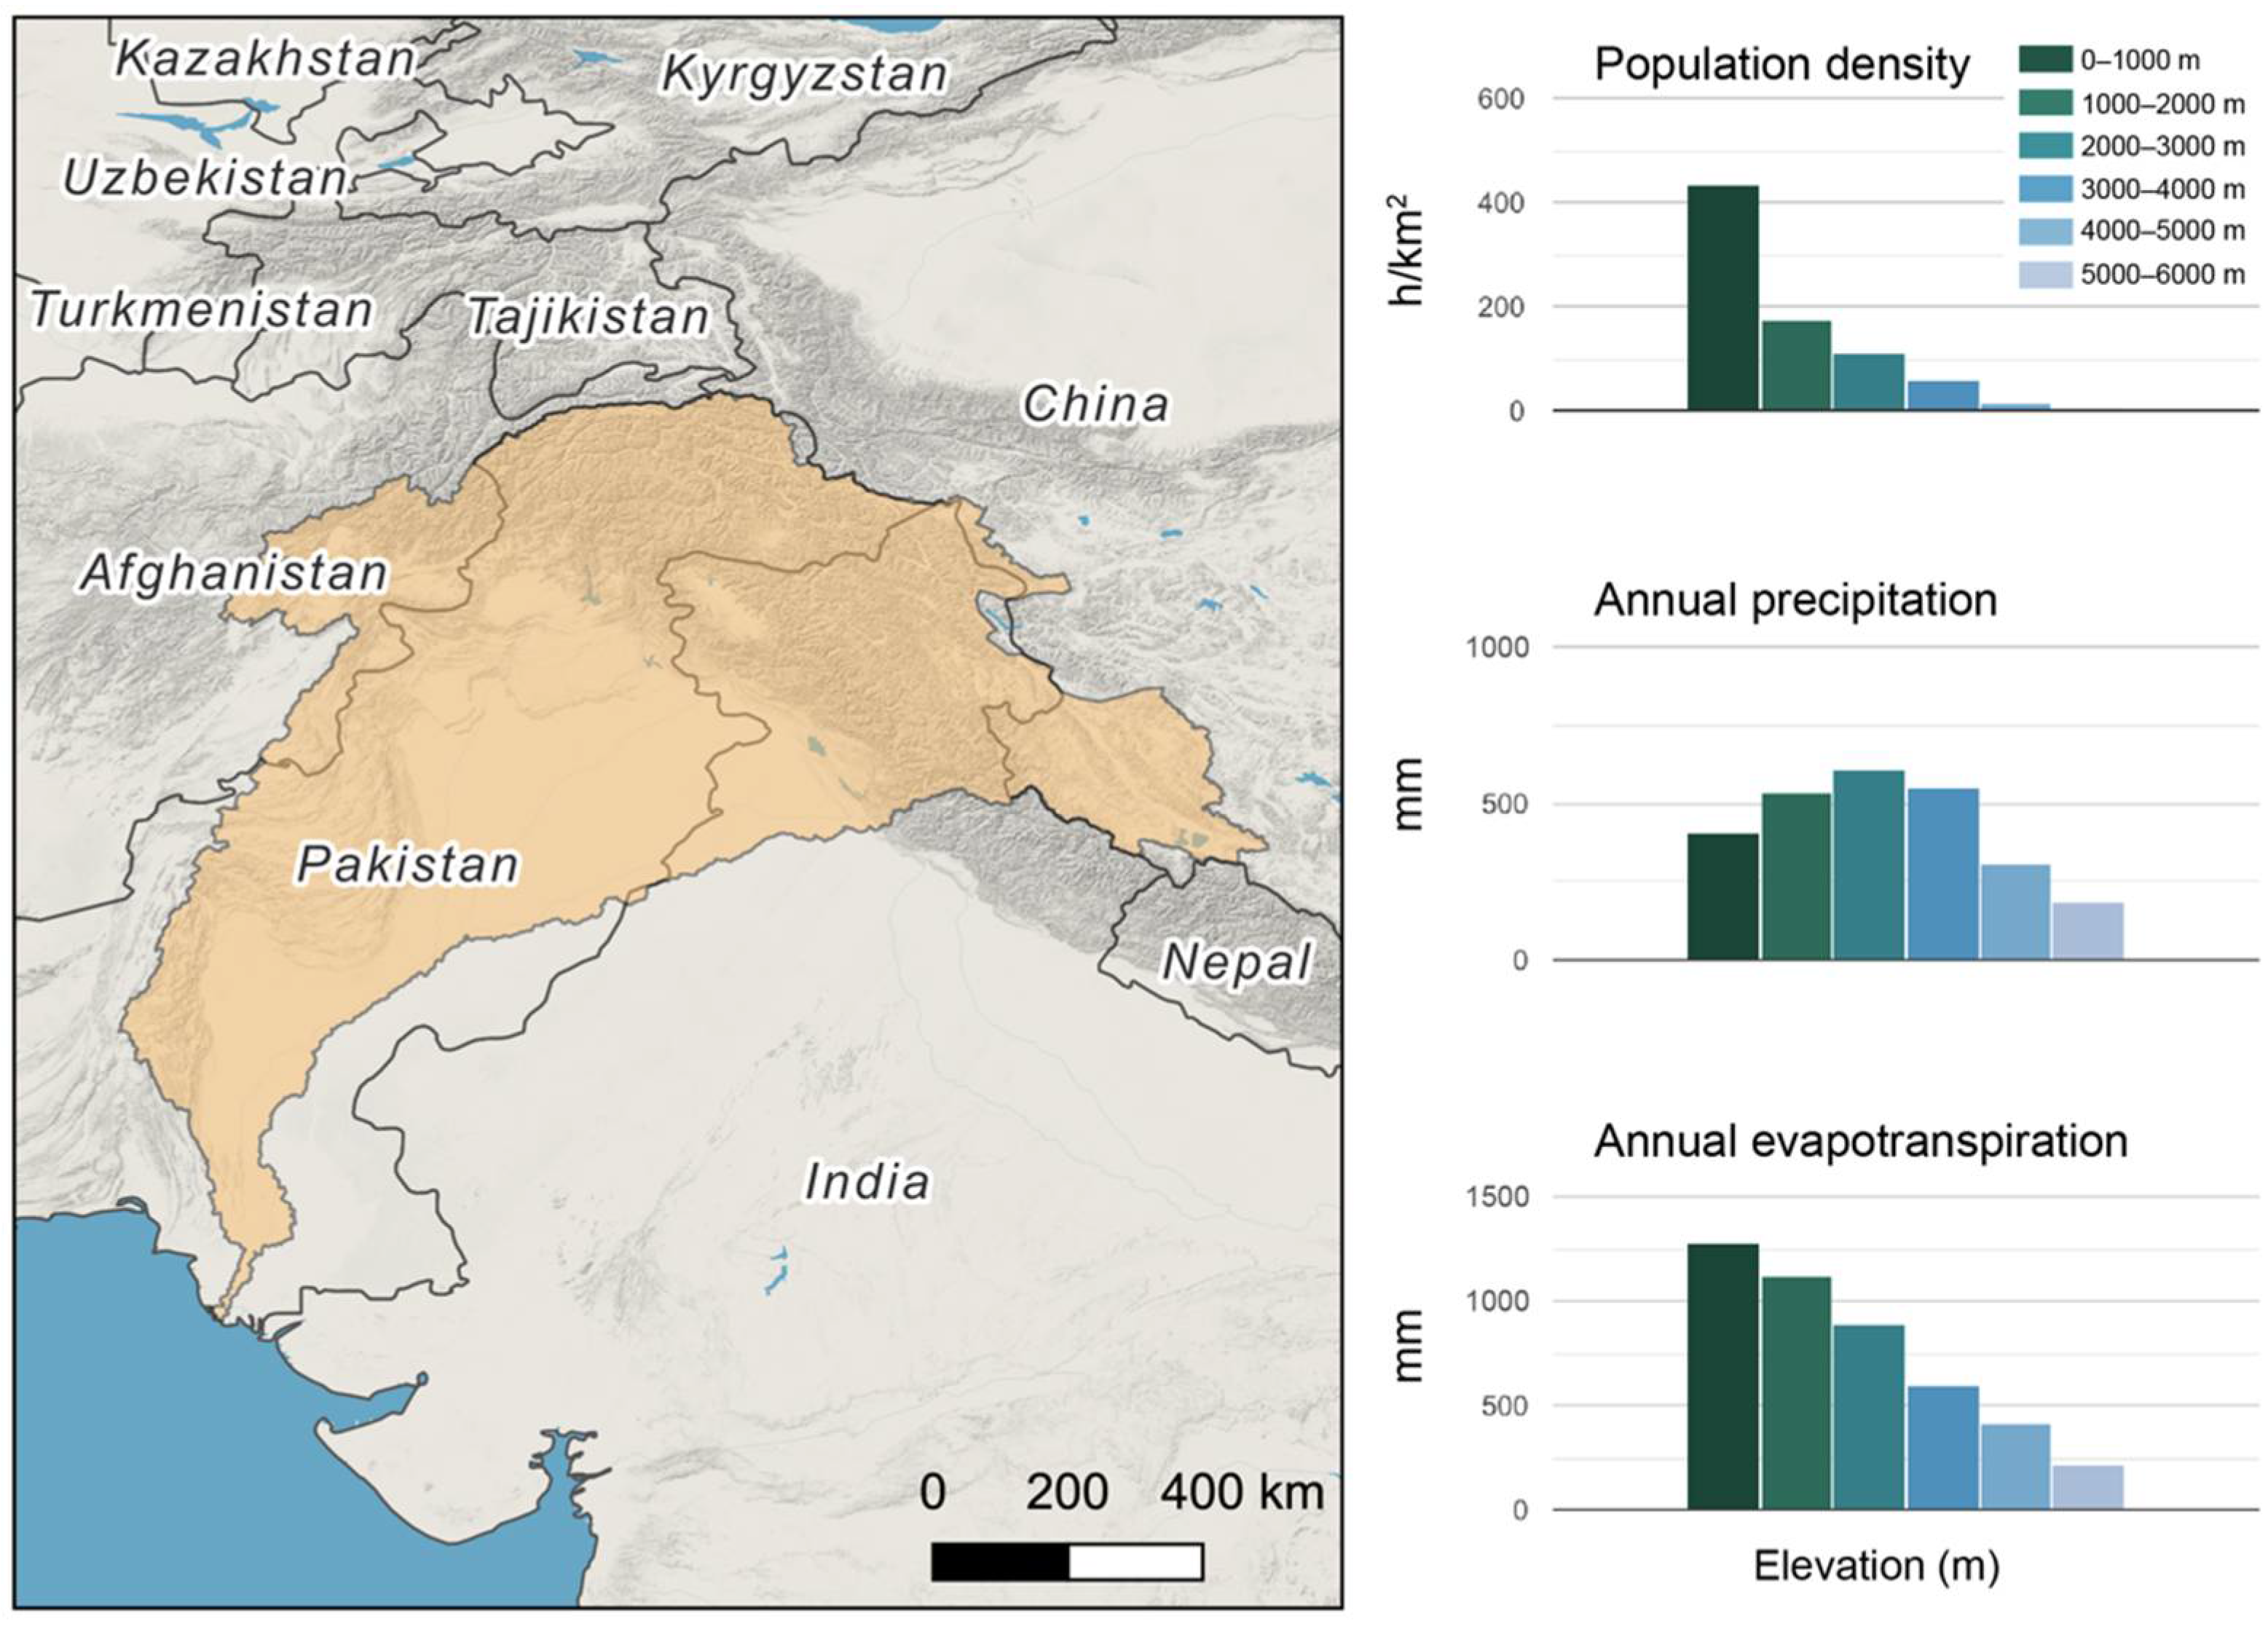
:1. Introduction
2. Materials and Methods
3. Results
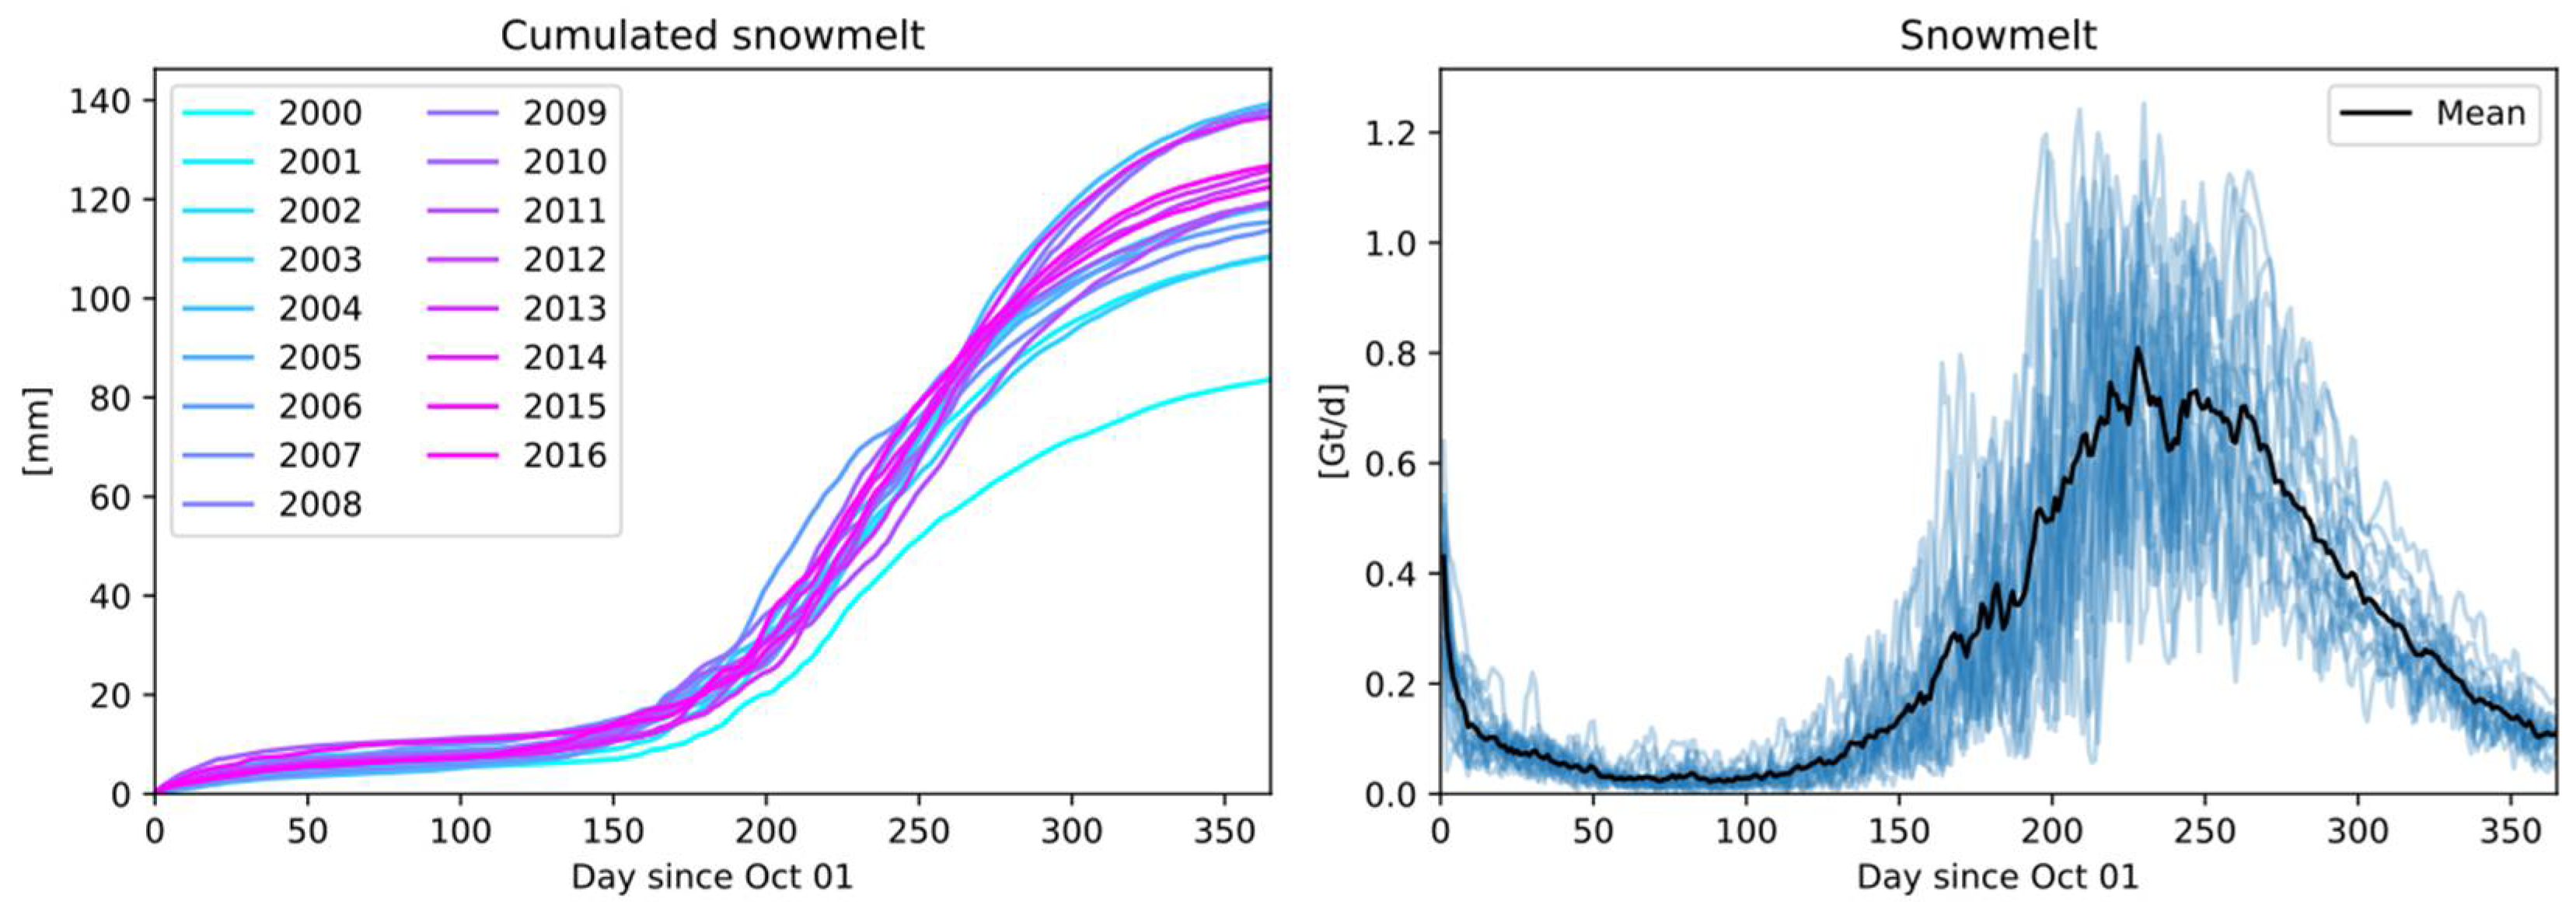
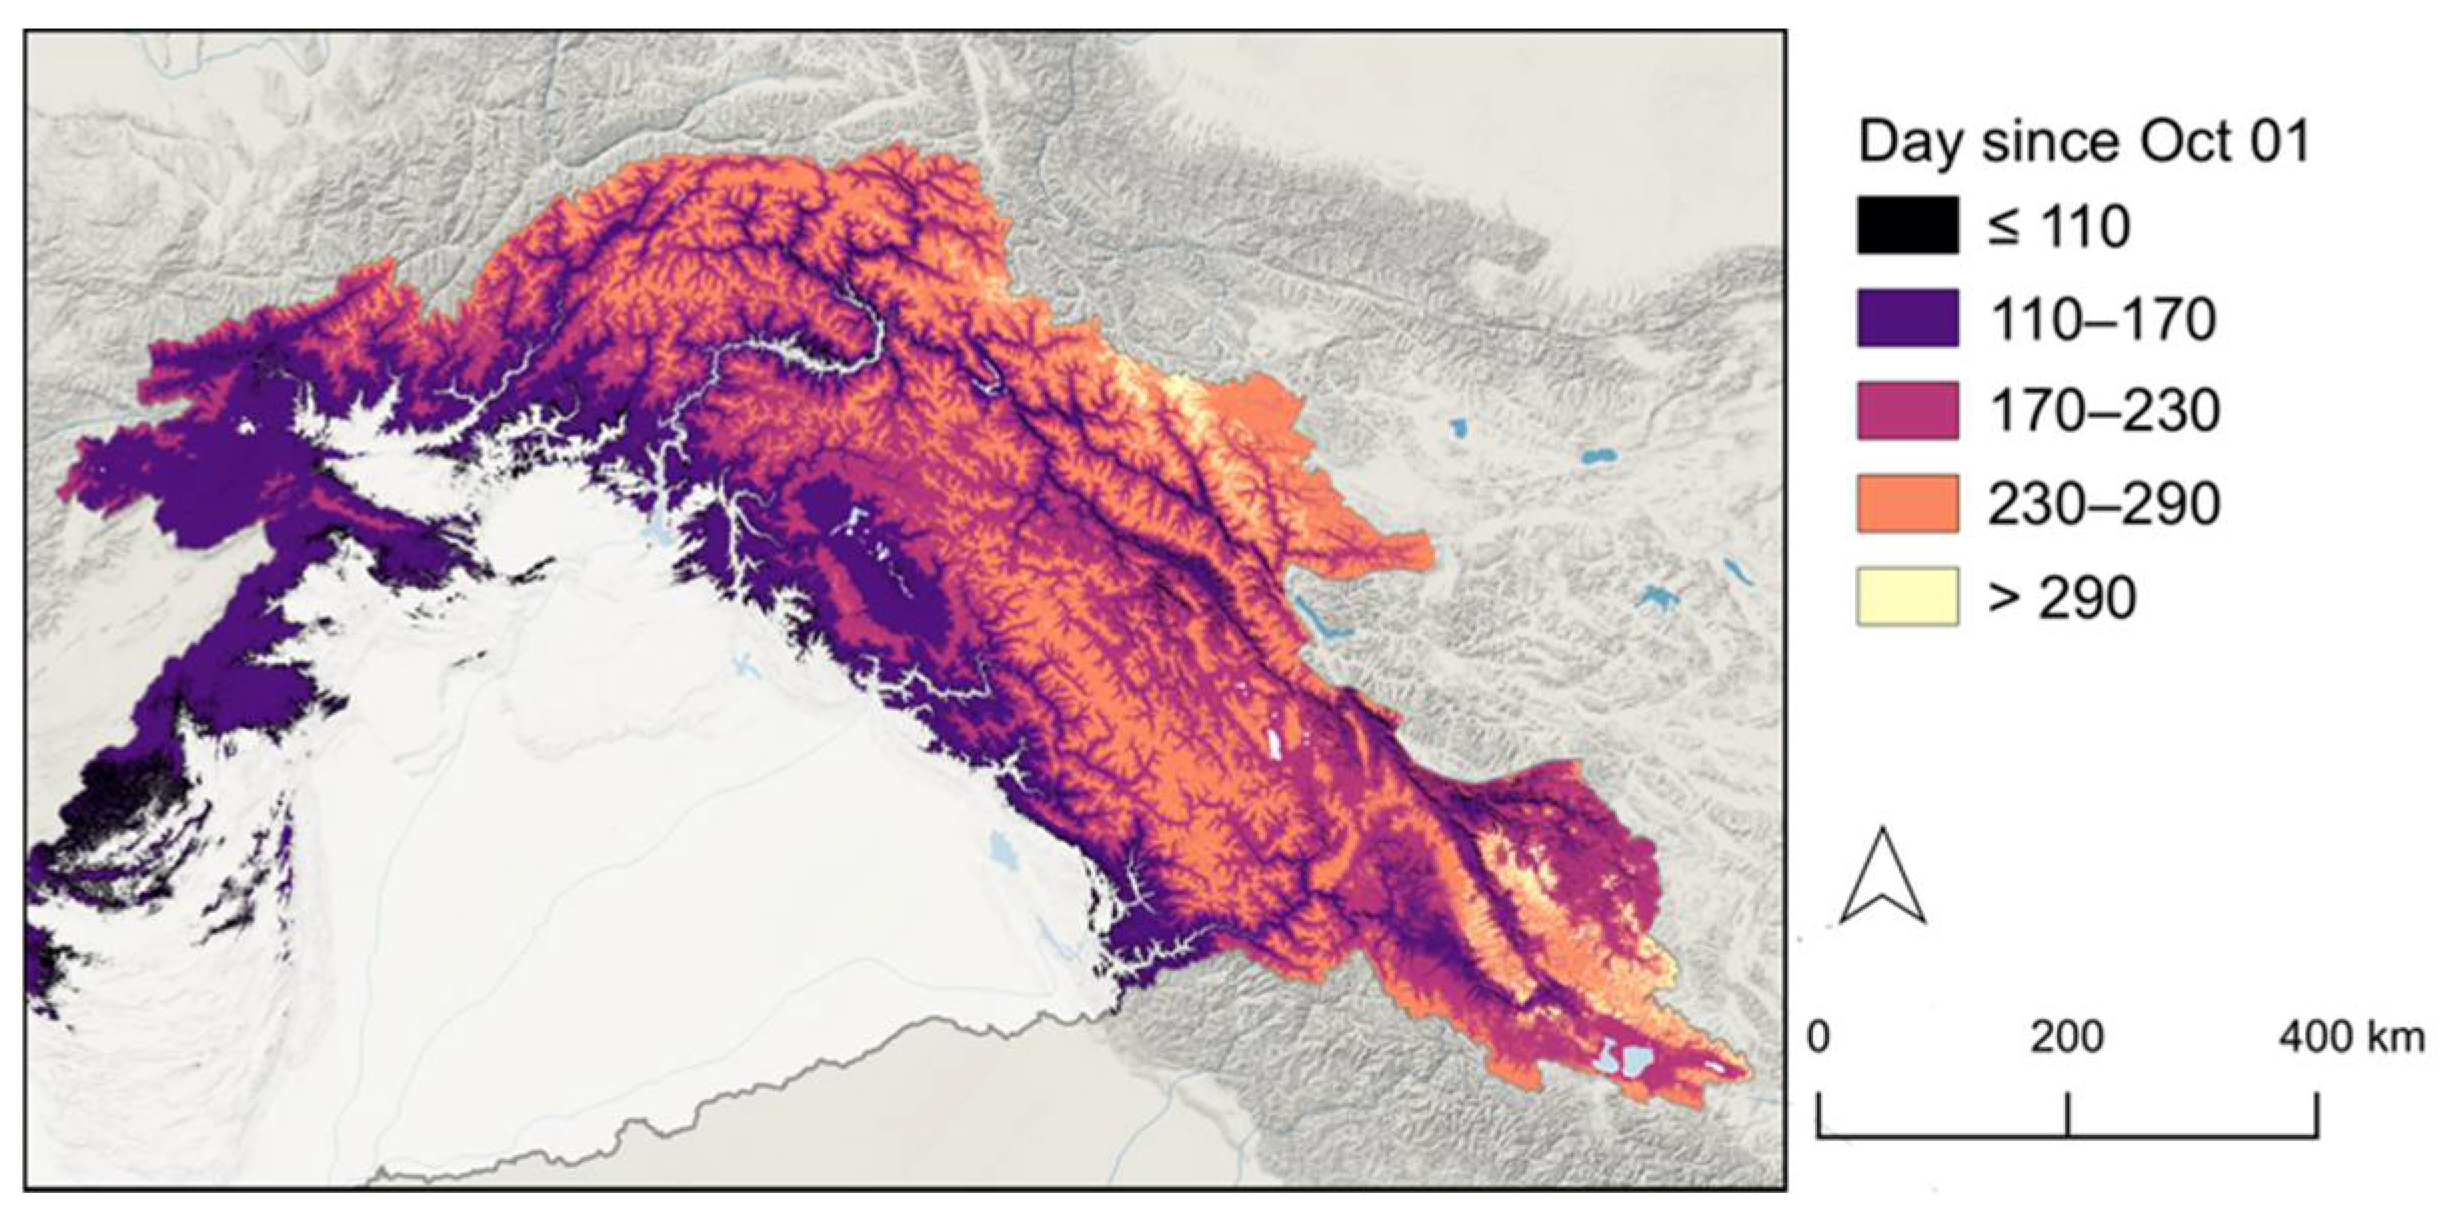
3.1. Snowmelt
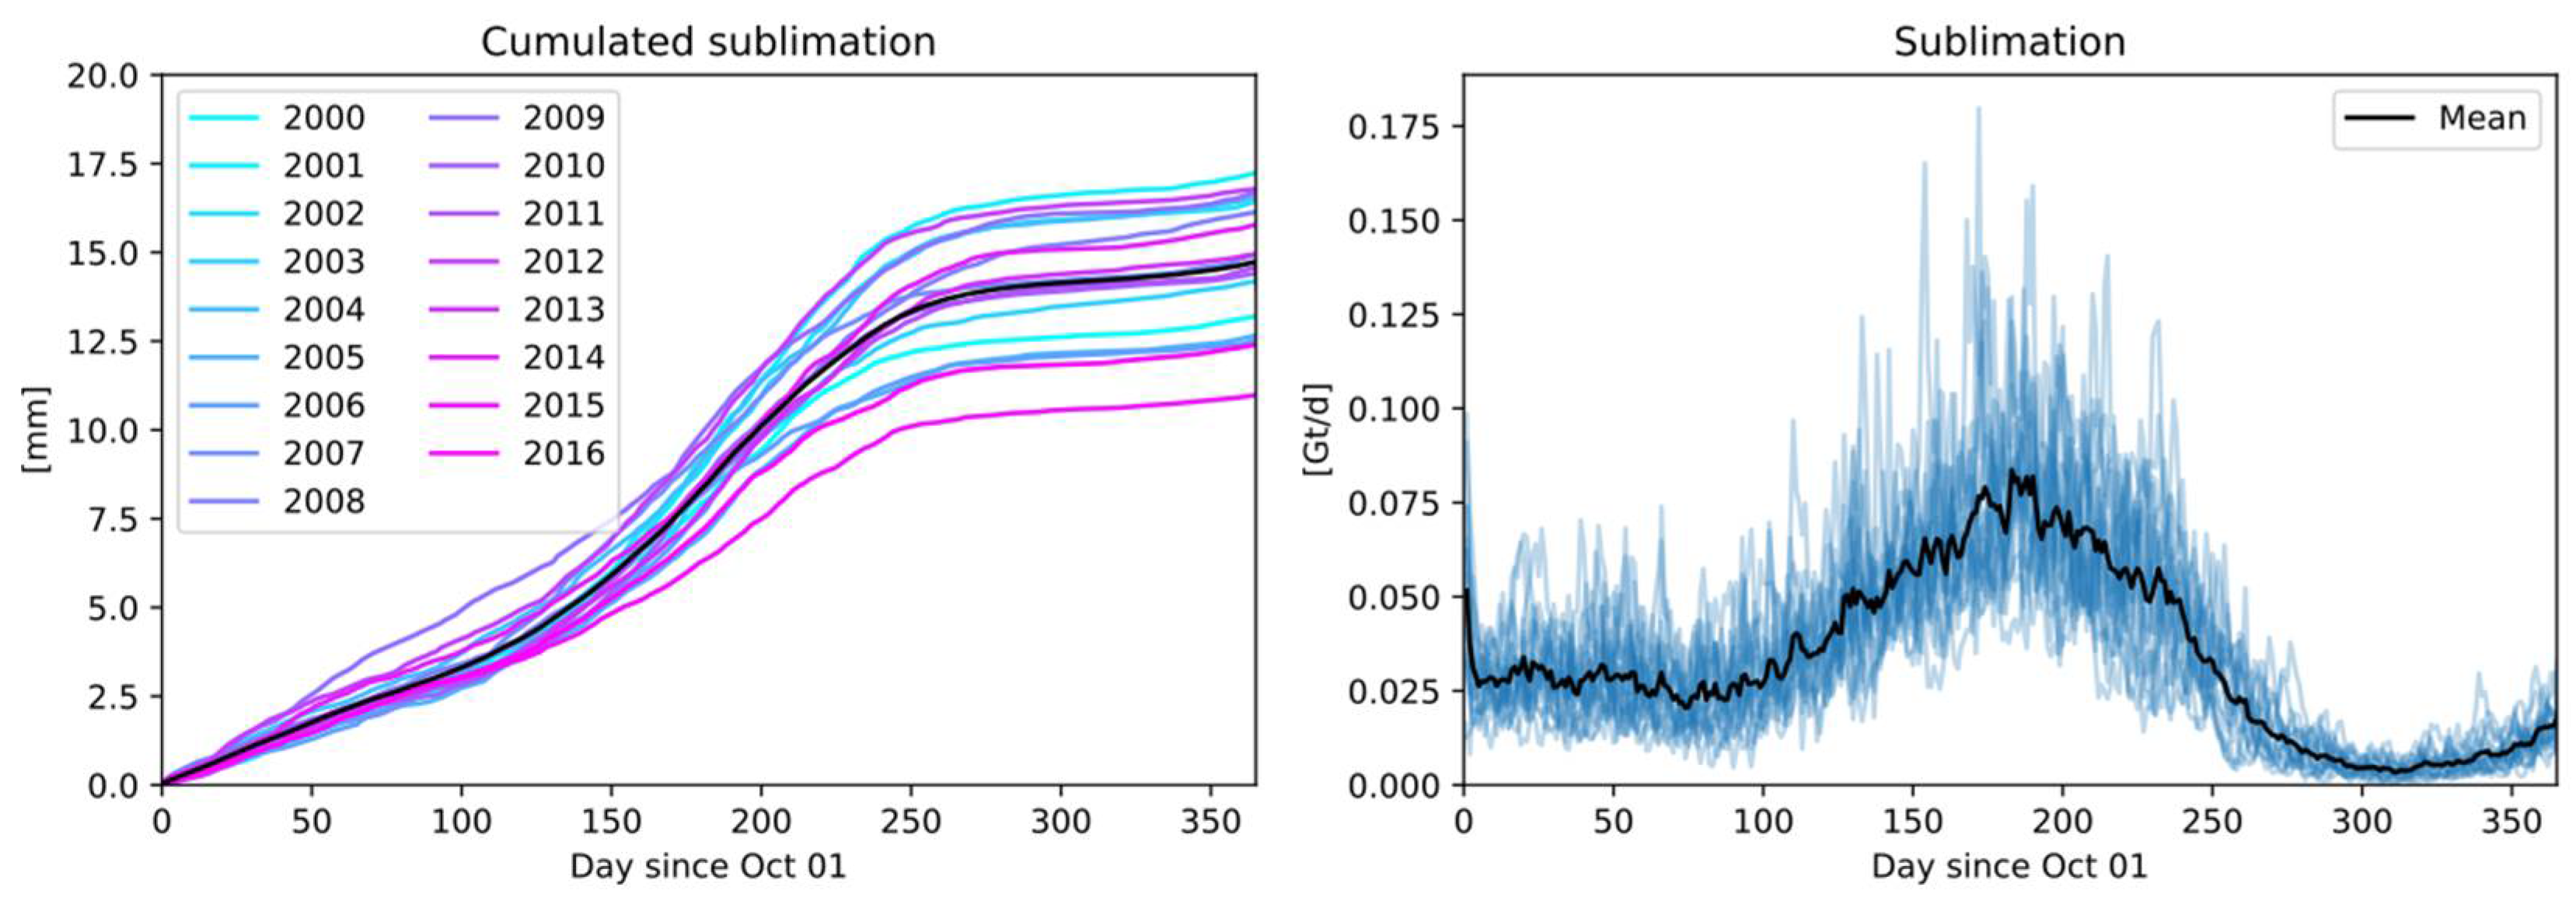
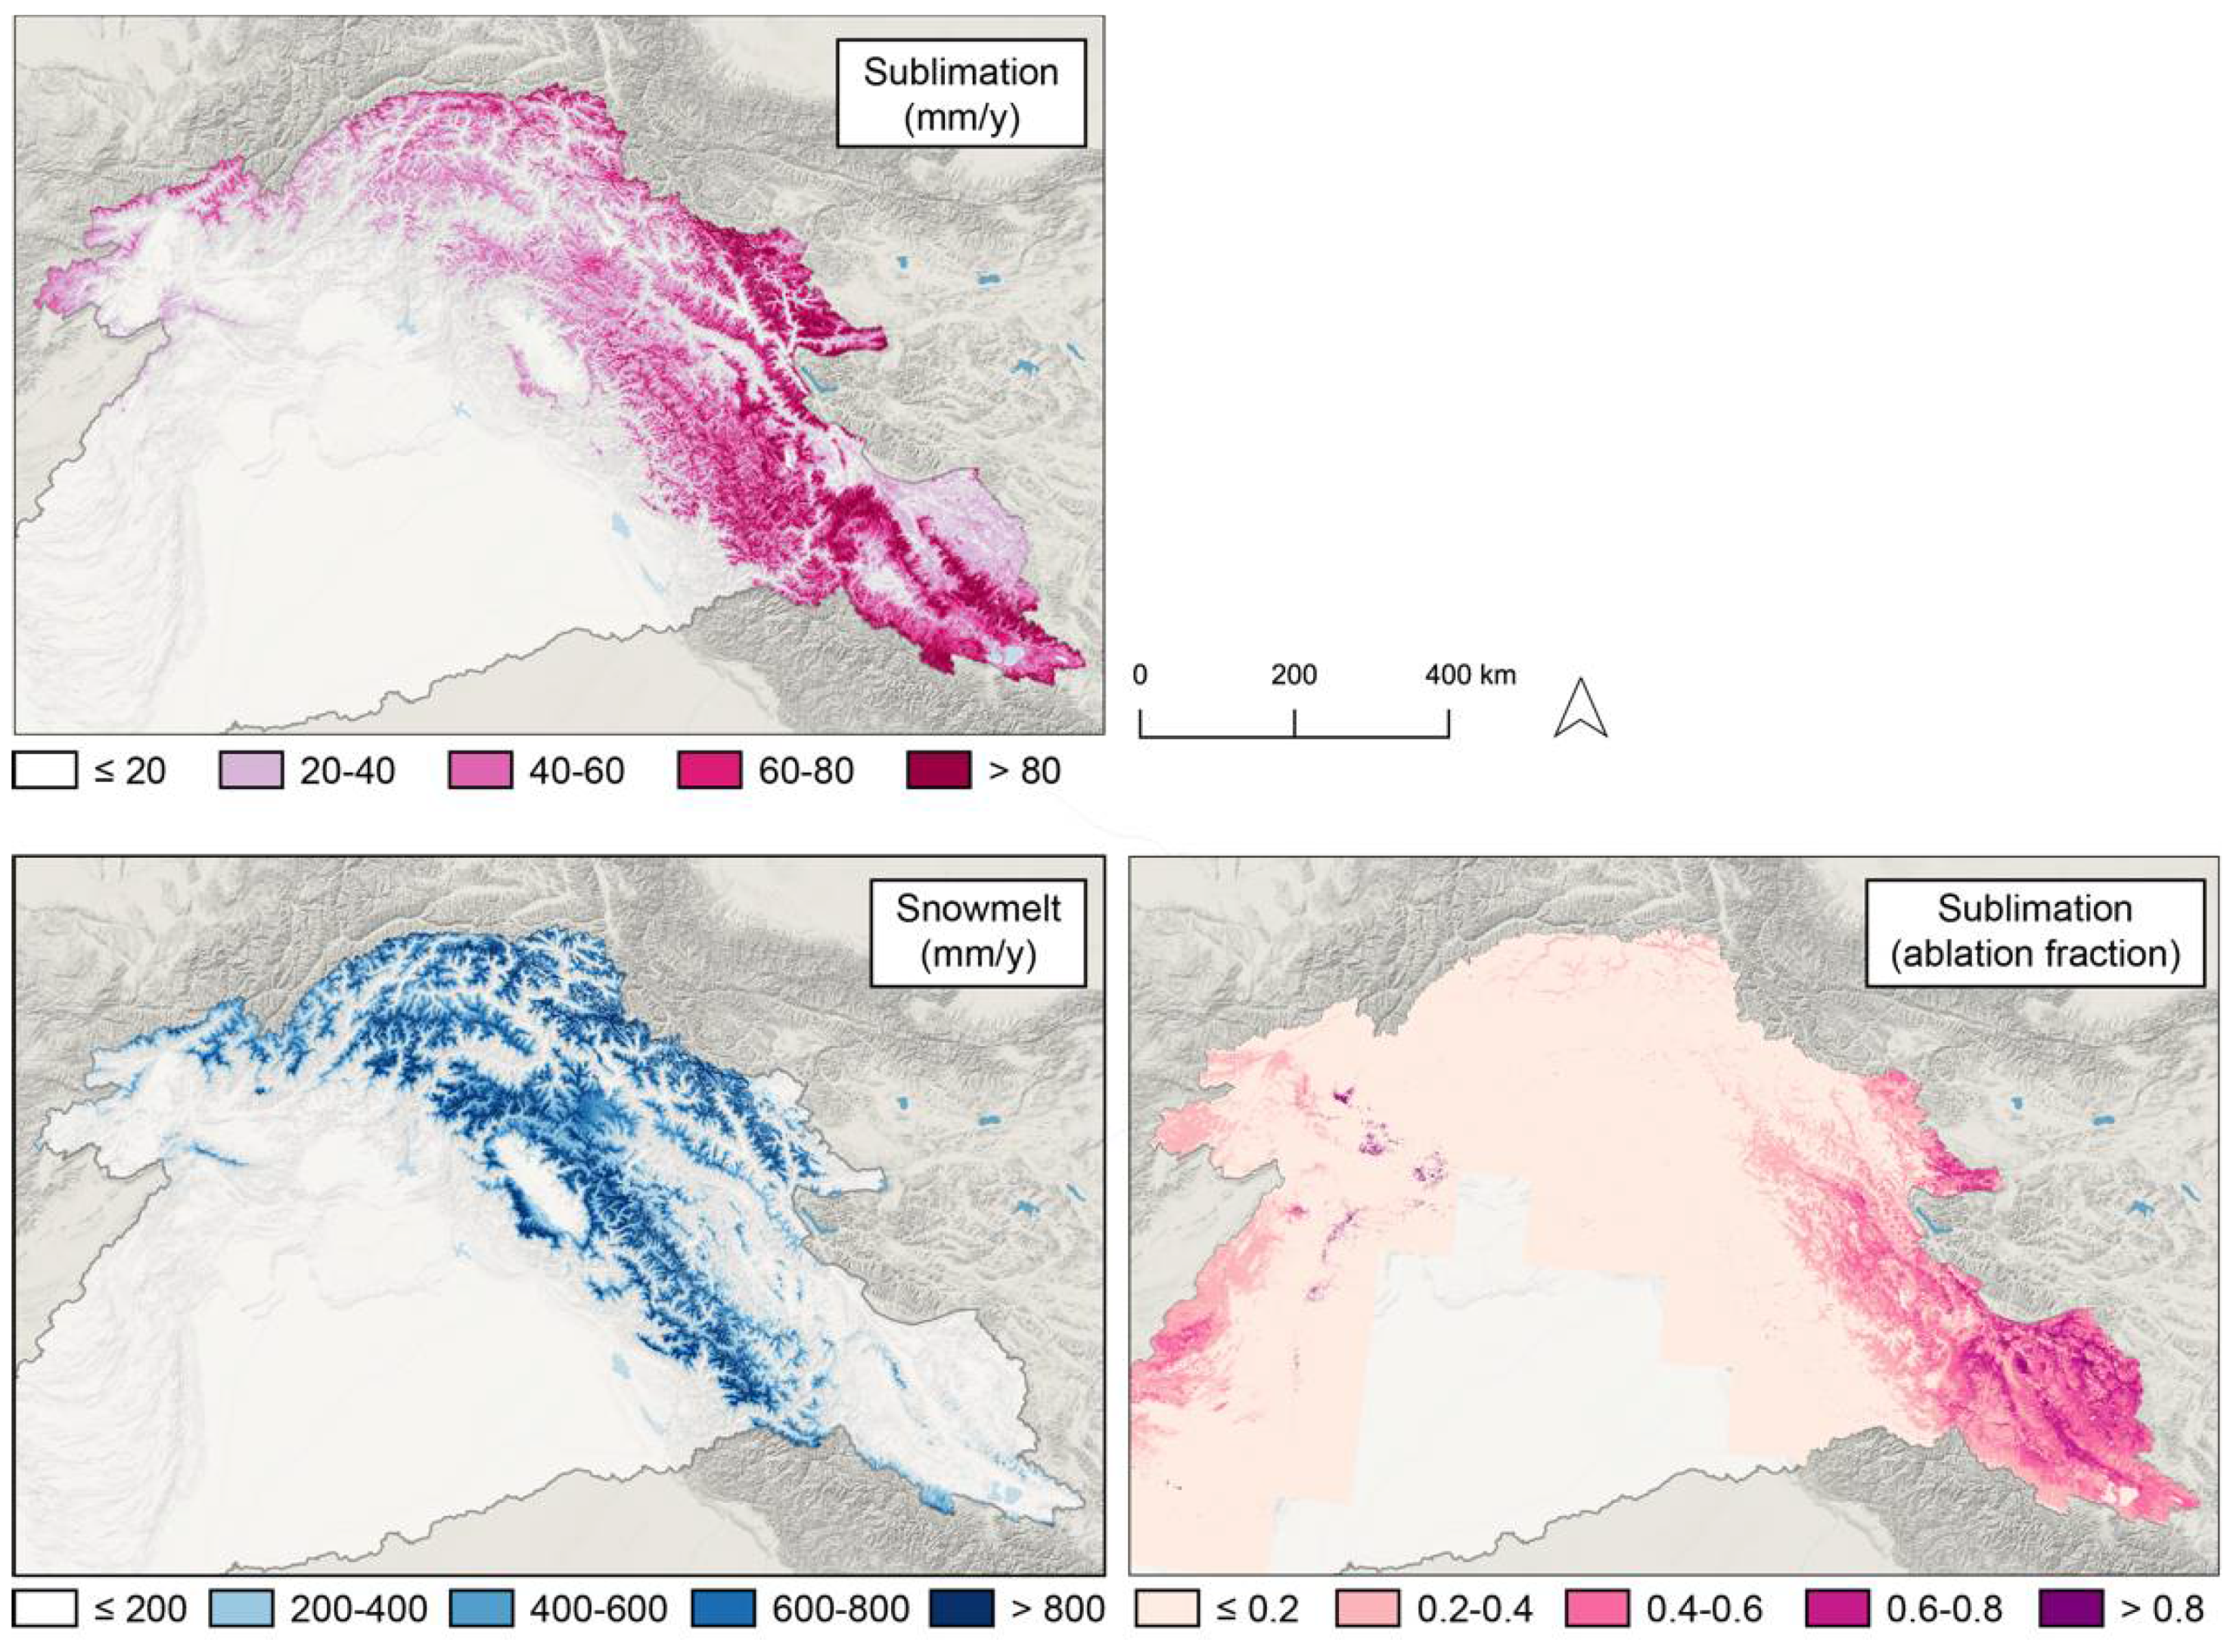
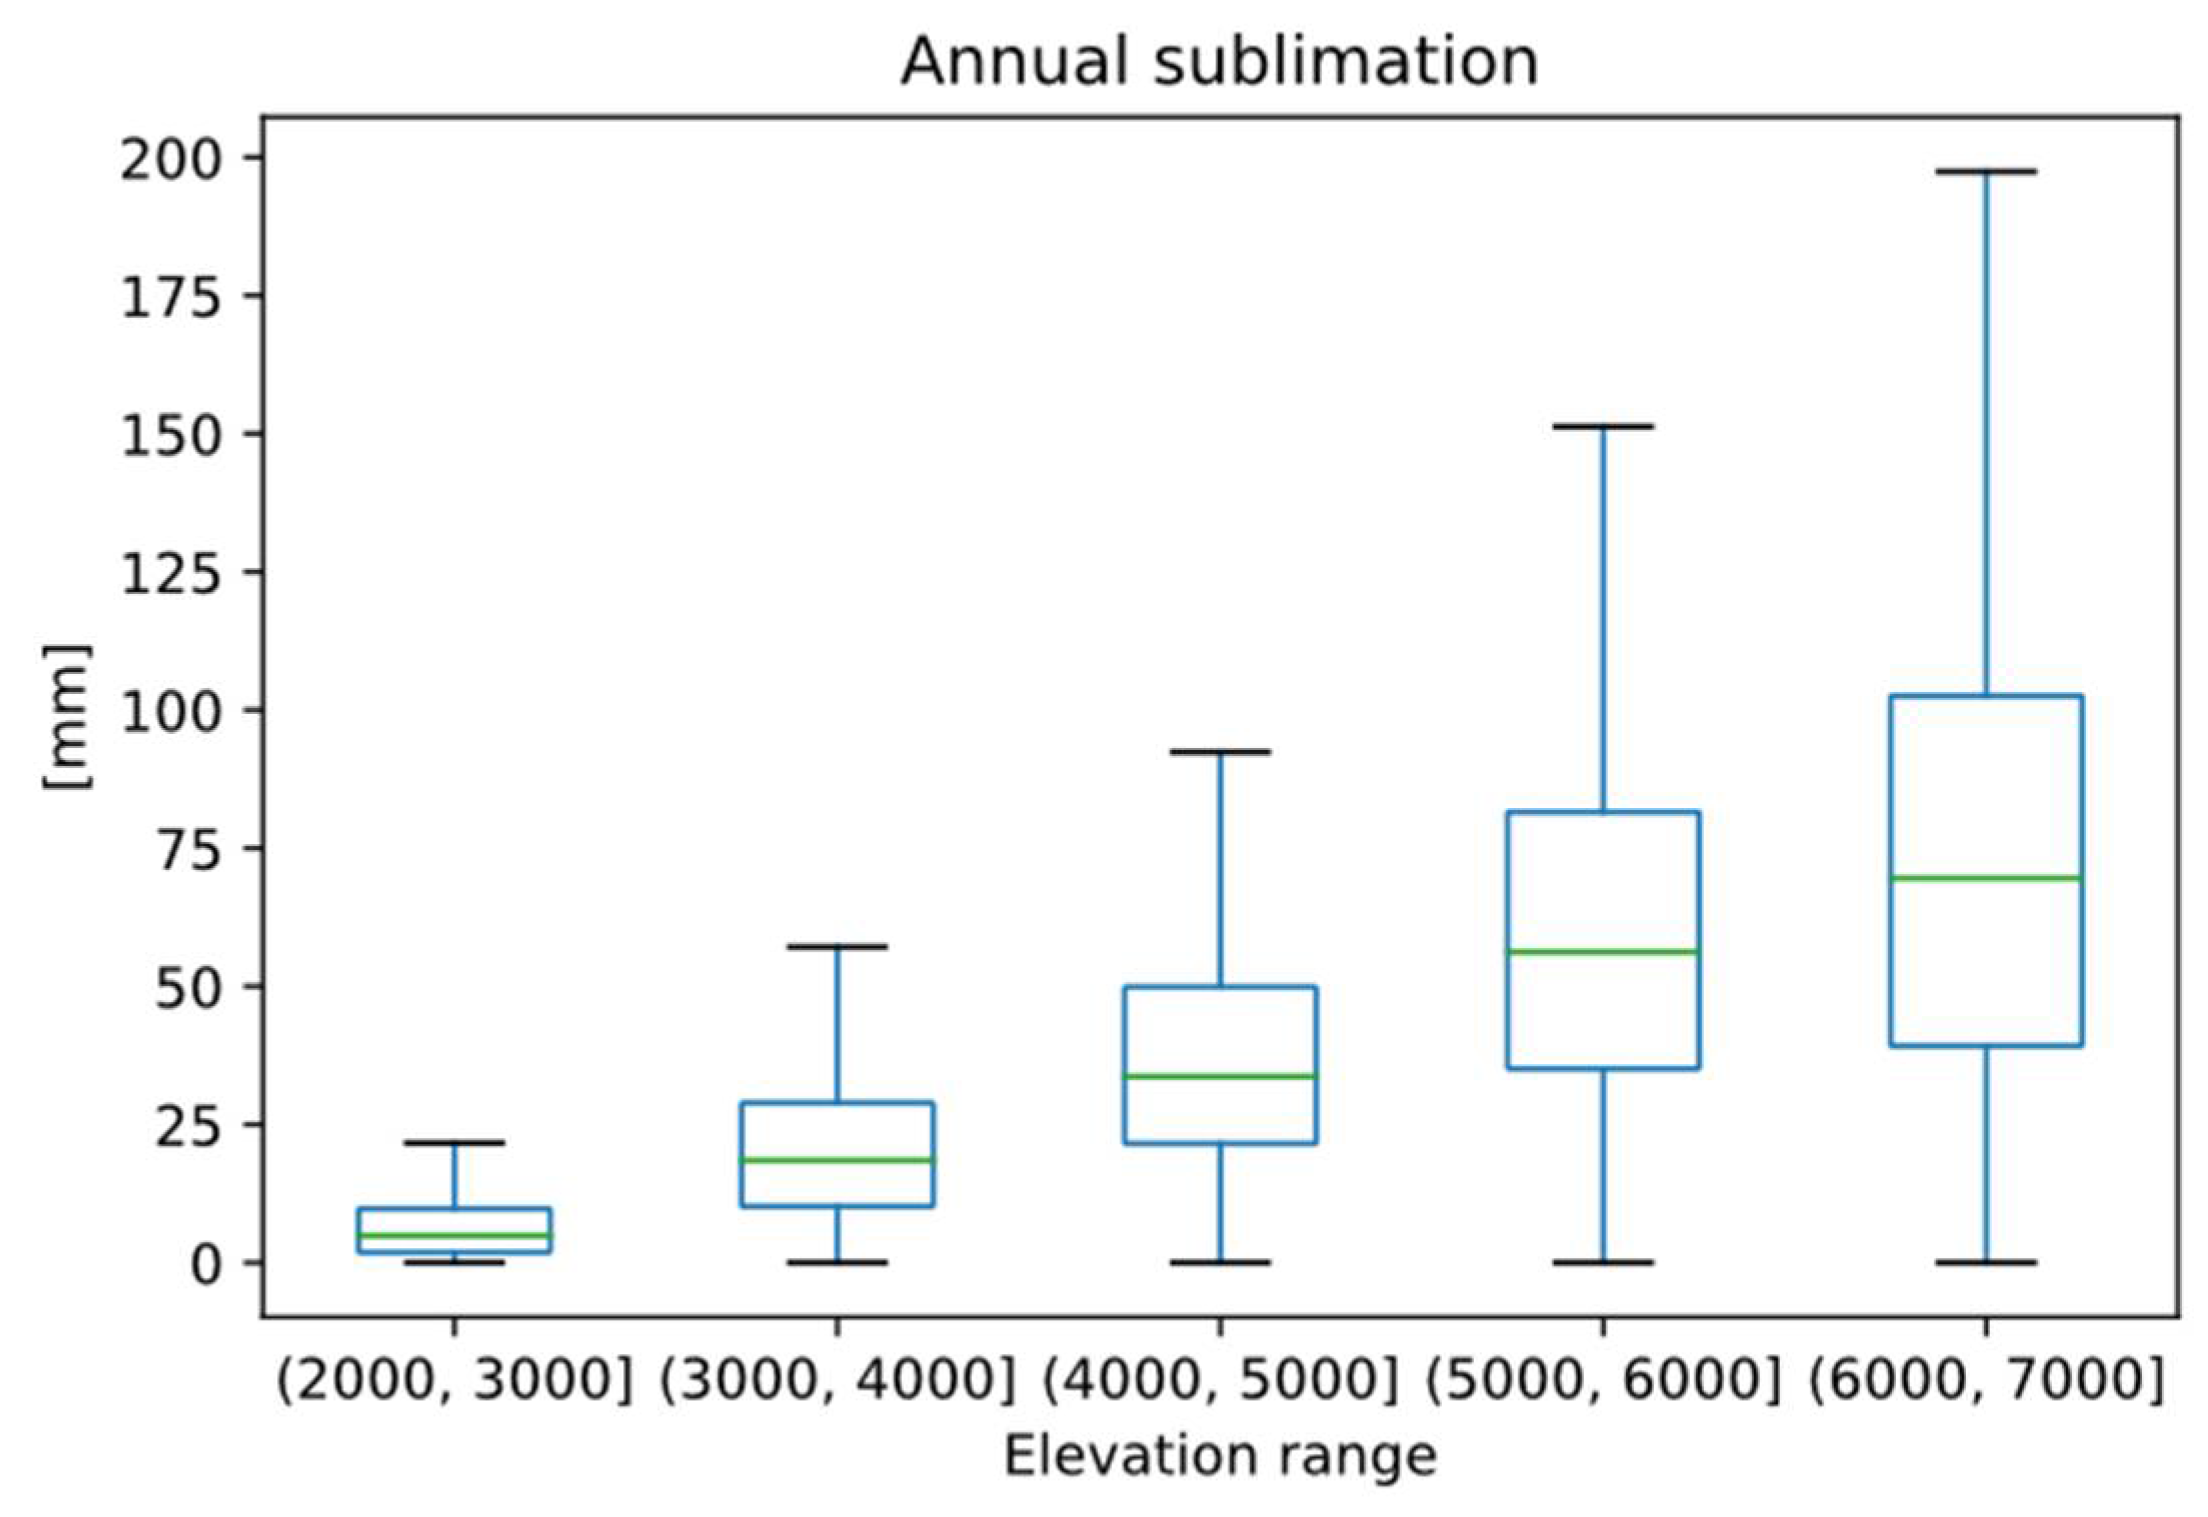
3.2. Snow Sublimation
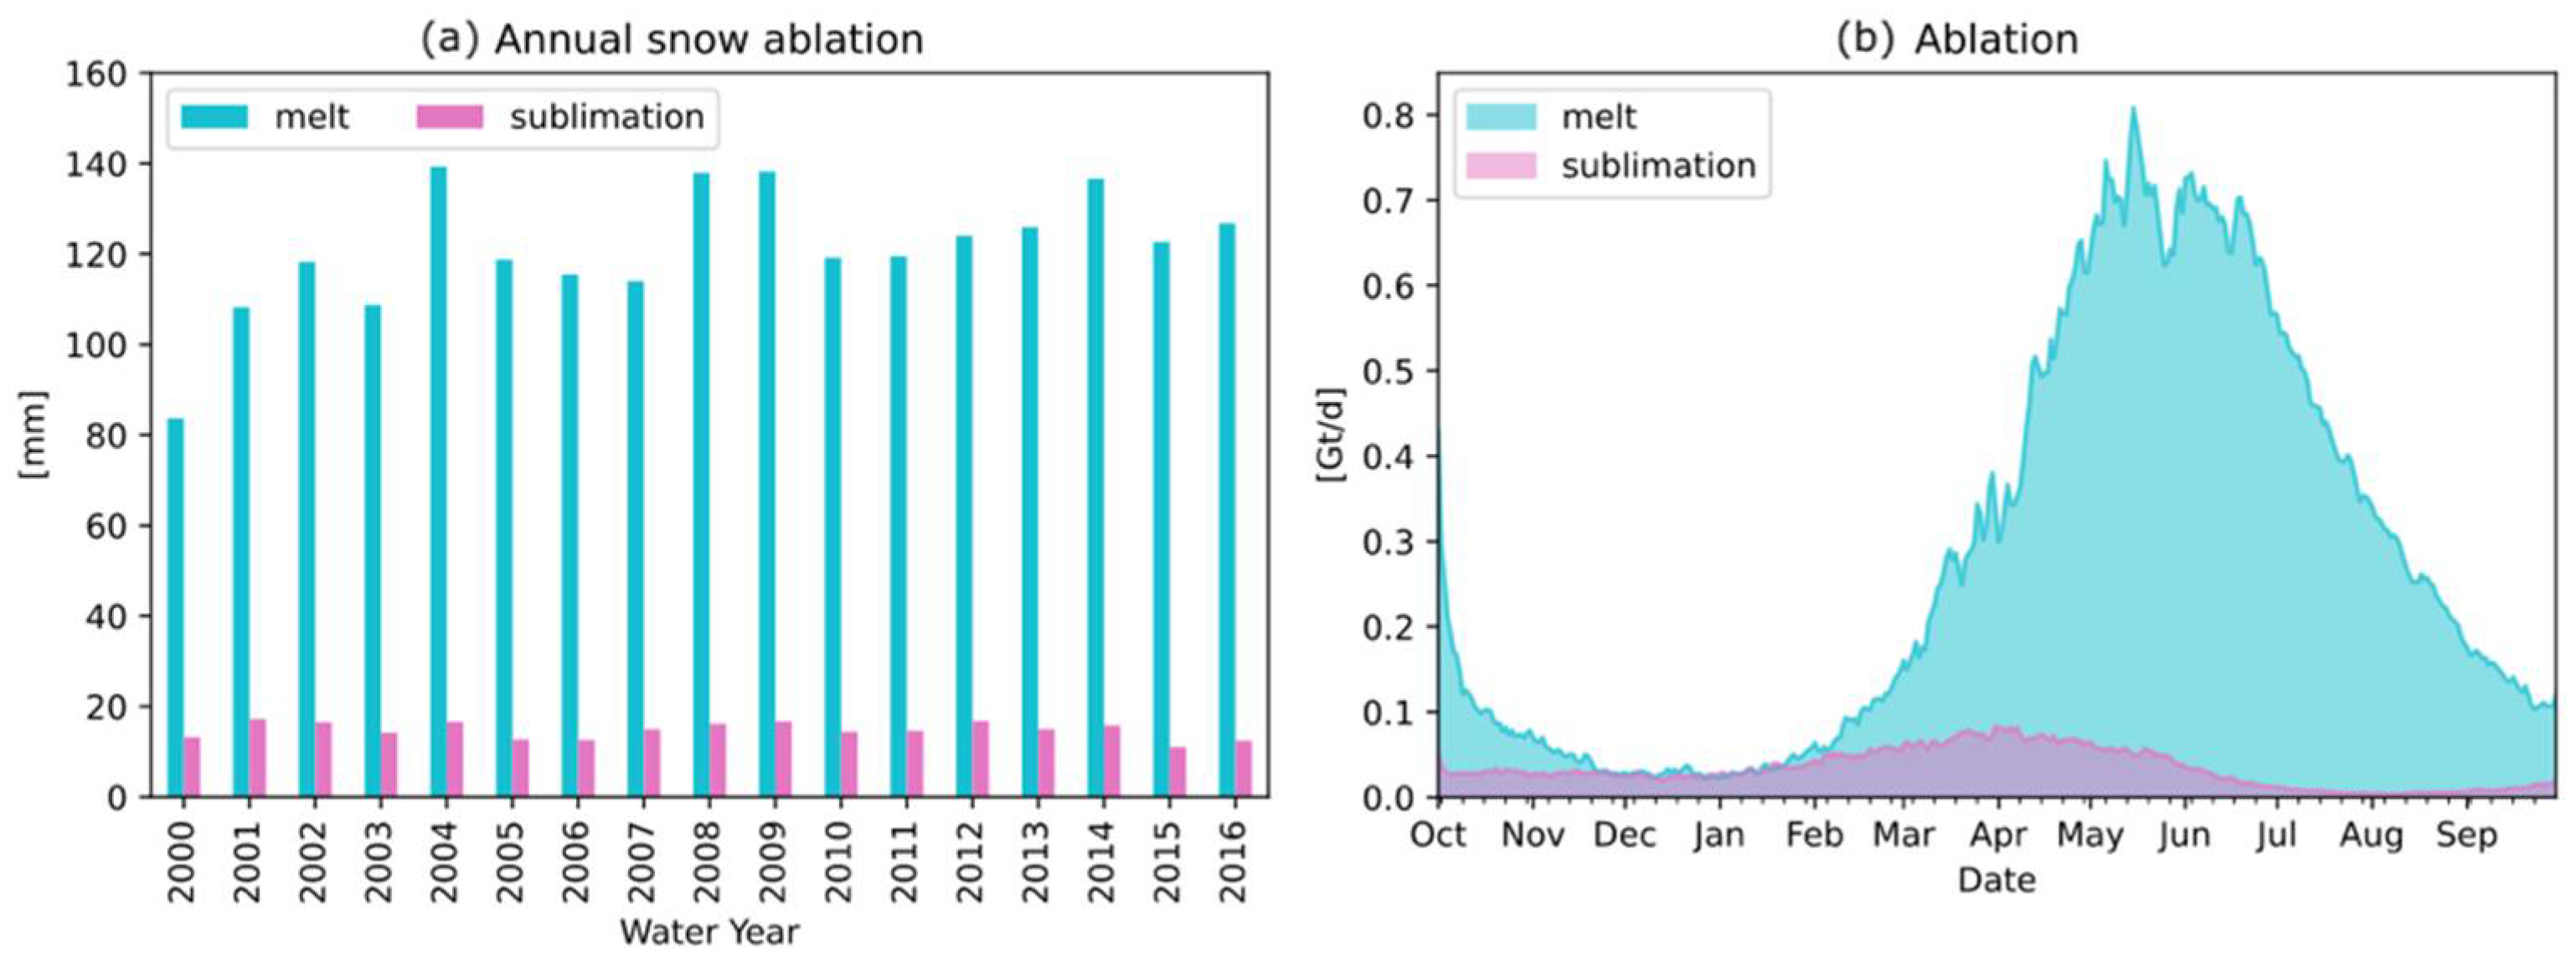
3.3. Contribution of Sublimation to Snow Ablation
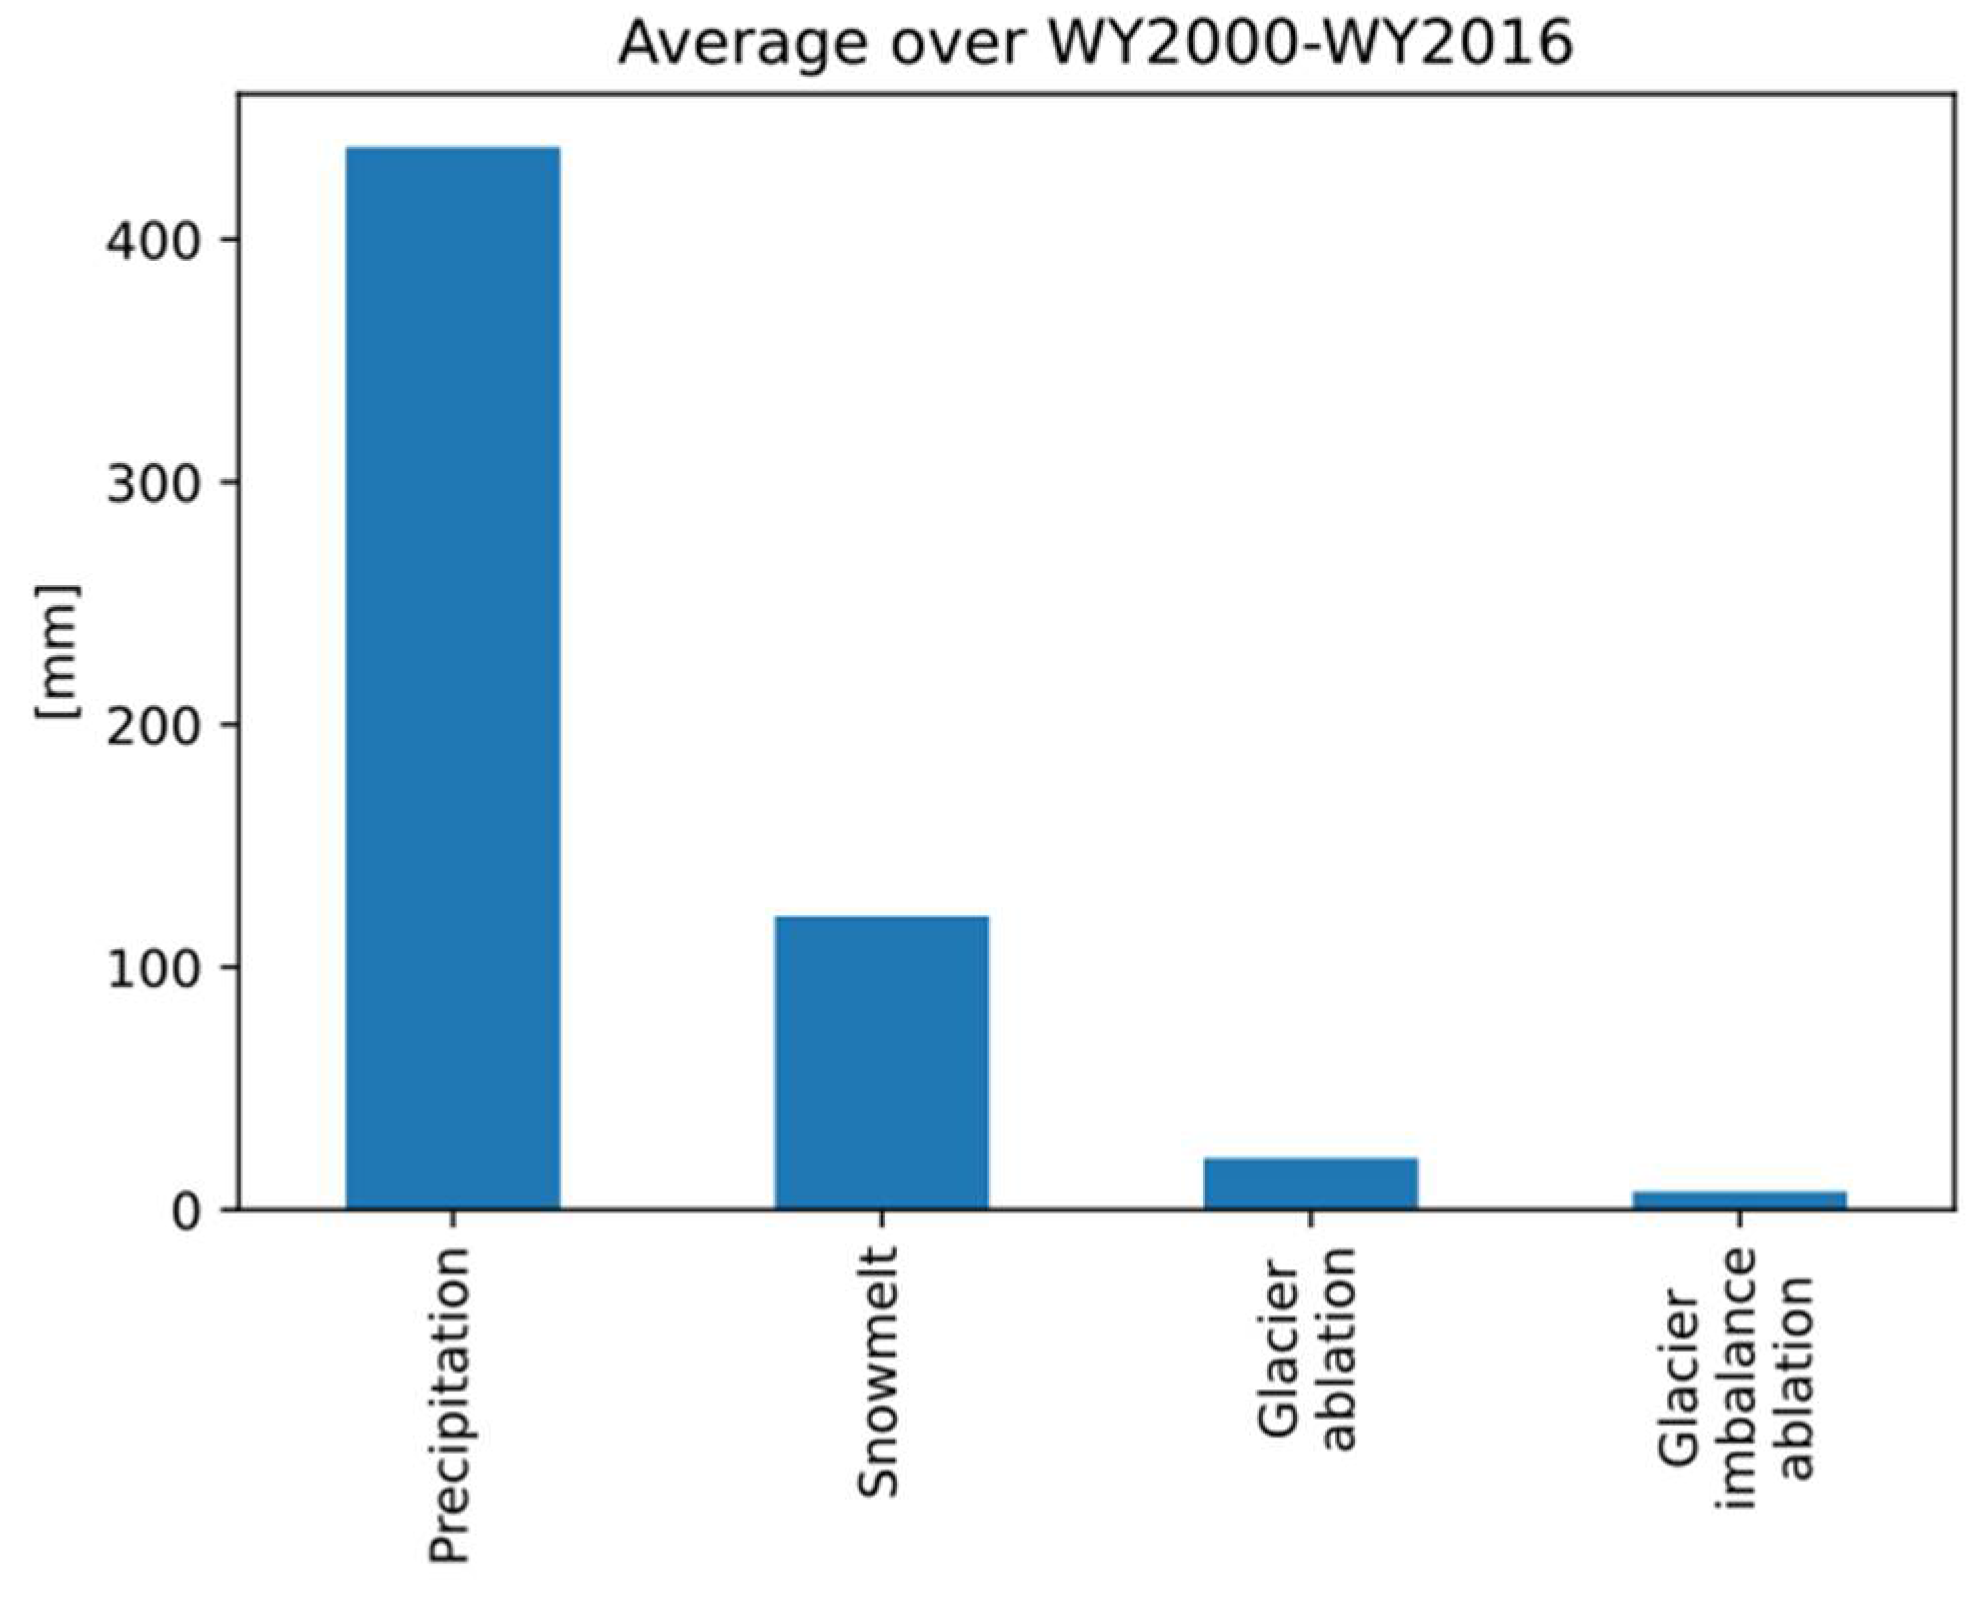
4. Discussion
5. Conclusions
Funding
Institutional Review Board Statement
Informed Consent Statement
Data Availability Statement
Acknowledgments
Conflicts of Interest
References
- Laghari, A.N.; Vanham, D.; Rauch, W. The Indus Basin in the Framework of Current and Future Water Resources Management. Hydrol. Earth Syst. Sci. 2012, 16, 1063–1083. [Google Scholar] [CrossRef] [Green Version]
- Karim, A.; Veizer, J. Water Balance of the Indus River Basin and Moisture Source in the Karakoram and Western Himalayas: Implications from Hydrogen and Oxygen Isotopes in River Water. J. Geophys. Res. 2002, 107, 4362. [Google Scholar] [CrossRef]
- Immerzeel, W.W.; Wanders, N.; Lutz, A.F.; Shea, J.M.; Bierkens, M.F.P. Reconciling High-Altitude Precipitation in the Upper Indus Basin with Glacier Mass Balances and Runoff. Hydrol. Earth Syst. Sci. 2015, 19, 4673–4687. [Google Scholar] [CrossRef] [Green Version]
- Ahmad, Z.; Hafeez, M.; Ahmad, I. Hydrology of Mountainous Areas in the Upper Indus Basin, Northern Pakistan with the Perspective of Climate Change. Environ. Monit. Assess. 2012, 184, 5255–5274. [Google Scholar] [CrossRef] [PubMed]
- Armstrong, R.L.; Rittger, K.; Brodzik, M.J.; Racoviteanu, A.; Barrett, A.P.; Khalsa, S.-J.S.; Raup, B.; Hill, A.F.; Khan, A.L.; Wilson, A.M.; et al. Runoff from Glacier Ice and Seasonal Snow in High Asia: Separating Melt Water Sources in River Flow. Reg. Environ. Chang. 2018, 19, 1249–1261. [Google Scholar] [CrossRef] [Green Version]
- Kraaijenbrink, P.D.A.; Stigter, E.E.; Yao, T.; Immerzeel, W.W. Climate Change Decisive for Asia’s Snow Meltwater Supply. Nat. Clim. Chang. 2021, 11, 591–597. [Google Scholar] [CrossRef]
- Biemans, H.; Siderius, C.; Lutz, A.F.; Nepal, S.; Ahmad, B.; Hassan, T.; von Bloh, W.; Wijngaard, R.R.; Wester, P.; Shrestha, A.B.; et al. Importance of Snow and Glacier Meltwater for Agriculture on the Indo-Gangetic Plain. Nat. Sustain. 2019, 2, 594. [Google Scholar] [CrossRef]
- Armstrong, R.L.; Brun, E. (Eds.) Snow and Climate: Physical Processes, Surface Energy Exchange and Modeling; Cambridge University Press: Cambridge, UK, 2008; ISBN 978-0-521-85454-2. [Google Scholar]
- Stigter, E.E.; Steiner, J.F.; Koch, I.; Saloranta, T.M.; Kirkham, J.D.; Immerzeel, W.W. Energy and Mass Balance Dynamics of the Seasonal Snowpack at Two High-Altitude Sites in the Himalaya. Cold Reg. Sci. Technol. 2021, 183, 103233. [Google Scholar] [CrossRef]
- Stigter, E.E.; Litt, M.; Steiner, J.F.; Bonekamp, P.N.J.; Shea, J.M.; Bierkens, M.F.P.; Immerzeel, W.W. The Importance of Snow Sublimation on a Himalayan Glacier. Front. Earth Sci. 2018, 6, 108. [Google Scholar] [CrossRef] [Green Version]
- Litt, M.; Shea, J.; Wagnon, P.; Steiner, J.; Koch, I.; Stigter, E.; Immerzeel, W. Glacier Ablation and Temperature Indexed Melt Models in the Nepalese Himalaya. Sci. Rep. 2019, 9, 5264. [Google Scholar] [CrossRef] [Green Version]
- Liu, Y.; Fang, Y.; Margulis, S.A. High Mountain Asia UCLA Daily Snow Reanalysis 2021. Available online: https://nsidc.org/data/HMA_SR_D/ (accessed on 21 September 2021).
- Liu, Y.; Fang, Y.; Margulis, S.A. Spatiotemporal Distribution of Seasonal Snow Water Equivalent in High-Mountain Asia from an 18-Year Landsat-MODIS Era Snow Reanalysis Dataset. Cryosphere Discuss. 2021, 2021, 1–25. [Google Scholar] [CrossRef]
- Margulis, S.A.; Girotto, M.; Cortés, G.; Durand, M. A Particle Batch Smoother Approach to Snow Water Equivalent Estimation. J. Hydrometeorol. 2015, 16, 1752–1772. [Google Scholar] [CrossRef]
- Liu, Y.; Margulis, S.A. Deriving Bias and Uncertainty in MERRA-2 Snowfall Precipitation Over High Mountain Asia. Front. Earth Sci. 2019, 7, 280. [Google Scholar] [CrossRef] [Green Version]
- BfG. The GRDC—Major River Basins of the World—Major River Basins of the World, 2nd ed.; GRDC: Barton, Australia, 2020; Available online: https://www.bafg.de/GRDC/EN/02_srvcs/22_gslrs/221_MRB/riverbasins_2020.html;jsessionid=654401DB461D8774CCEE33021A528DD7.live21301?nn=201762#doc2731742bodyText7 (accessed on 23 July 2021).
- Khan, A.; Richards, K.S.; Parker, G.T.; McRobie, A.; Mukhopadhyay, B. How Large Is the Upper Indus Basin? The Pitfalls of Auto-Delineation Using DEMs. J. Hydrol. 2014, 509, 442–453. [Google Scholar] [CrossRef]
- Center For International Earth Science Information Network-CIESIN-Columbia University Gridded Population of the World, Version 4 (GPWv4): Population Density, Revision 11 2017. Available online: https://doi.org/10.7927/H4NP22DQ (accessed on 21 September 2021).
- Abatzoglou, J.T.; Dobrowski, S.Z.; Parks, S.A.; Hegewisch, K.C. TerraClimate, a High-Resolution Global Dataset of Monthly Climate and Climatic Water Balance from 1958–2015. Sci. Data 2018, 5, 170191. [Google Scholar] [CrossRef] [PubMed] [Green Version]
- Zender, C.S. Analysis of Self-Describing Gridded Geoscience Data with NetCDF Operators (NCO). Environ. Model. Softw. 2008, 23, 1338–1342. [Google Scholar] [CrossRef] [Green Version]
- OSGeo/Gdal. Open Source Geospatial Foundation. 2021. Available online: https://www.osgeo.org/projects/gdal/https://doi.org/10.7927/H4NP22DQ (accessed on 21 September 2021).
- Grizonnet, M.; Michel, J.; Poughon, V.; Inglada, J.; Savinaud, M.; Cresson, R. Orfeo ToolBox: Open Source Processing of Remote Sensing Images. Open Geospat. Data Softw. Stand. 2017, 2, 15. [Google Scholar] [CrossRef] [Green Version]
- Tange, O. Gnu Parallel 20150322 (‘Hellwig’). Zenodo. 2015. Available online: https://explore.openaire.eu/search/software?pid=10.5281%2Fzenodo.16303 (accessed on 21 September 2021).
- Hijmans, R.J.; Cameron, S.E.; Parra, J.L.; Jones, P.G.; Jarvis, A. Very High Resolution Interpolated Climate Surfaces for Global Land Areas. Int. J. Climatol. 2005, 25, 1965–1978. [Google Scholar] [CrossRef]
- Miles, E.; McCarthy, M.; Dehecq, A.; Kneib, M.; Fugger, S.; Pellicciotti, F. Health and Sustainability of Glaciers in High Mountain Asia. Nat. Commun. 2021, 12, 2868. [Google Scholar] [CrossRef] [PubMed]
- Xue, Y.; Sun, S.; Kahan, D.S.; Jiao, Y. Impact of Parameterizations in Snow Physics and Interface Processes on the Simulation of Snow Cover and Runoff at Several Cold Region Sites. J. Geophys. Res. Atmos. 2003, 108, D22. [Google Scholar] [CrossRef]
- Sun, S.; Jin, J.; Xue, Y. A Simple Snow-Atmosphere-Soil Transfer Model. J. Geophys. Res. Atmos. 1999, 104, 19587–19597. [Google Scholar] [CrossRef] [Green Version]
- Strasser, U.; Bernhardt, M.; Weber, M.; Liston, G.E.; Mauser, W. Is Snow Sublimation Important in the Alpine Water Balance? Cryosphere 2008, 2, 53–66. [Google Scholar] [CrossRef] [Green Version]
- Gascoin, S.; Lhermitte, S.; Kinnard, C.; Bortels, K.; Liston, G.E. Wind Effects on Snow Cover in Pascua-Lama, Dry Andes of Chile. Adv. Water Resour. 2013, 55, 25–39. [Google Scholar] [CrossRef] [Green Version]
- Vionnet, V.; Martin, E.; Masson, V.; Guyomarc’h, G.; Naaim-Bouvet, F.; Prokop, A.; Durand, Y.; Lac, C. Simulation of Wind-Induced Snow Transport and Sublimation in Alpine Terrain Using a Fully Coupled Snowpack/Atmosphere Model. Cryosphere 2014, 8, 395–415. [Google Scholar] [CrossRef] [Green Version]
- Sexstone, G.A.; Clow, D.W.; Fassnacht, S.R.; Liston, G.E.; Hiemstra, C.A.; Knowles, J.F.; Penn, C.A. Snow Sublimation in Mountain Environments and Its Sensitivity to Forest Disturbance and Climate Warming. Water Resour. Res. 2018, 54, 1191–1211. [Google Scholar] [CrossRef]
- Groot Zwaaftink, C.D.; Mott, R.; Lehning, M. Seasonal Simulation of Drifting Snow Sublimation in Alpine Terrain. Water Resour. Res. 2013, 49, 1581–1590. [Google Scholar] [CrossRef] [Green Version]
- Buchhorn, M.; Lesiv, M.; Tsendbazar, N.-E.; Herold, M.; Bertels, L.; Smets, B. Copernicus Global Land Cover Layers—Collection 2. Remote Sens. 2020, 12, 1044. [Google Scholar] [CrossRef] [Green Version]


Publisher’s Note: MDPI stays neutral with regard to jurisdictional claims in published maps and institutional affiliations. |
© 2021 by the author. Licensee MDPI, Basel, Switzerland. This article is an open access article distributed under the terms and conditions of the Creative Commons Attribution (CC BY) license (https://creativecommons.org/licenses/by/4.0/).
Share and Cite
Gascoin, S. Snowmelt and Snow Sublimation in the Indus Basin. Water 2021, 13, 2621. https://doi.org/10.3390/w13192621
Gascoin S. Snowmelt and Snow Sublimation in the Indus Basin. Water. 2021; 13(19):2621. https://doi.org/10.3390/w13192621
Chicago/Turabian StyleGascoin, Simon. 2021. "Snowmelt and Snow Sublimation in the Indus Basin" Water 13, no. 19: 2621. https://doi.org/10.3390/w13192621
APA StyleGascoin, S. (2021). Snowmelt and Snow Sublimation in the Indus Basin. Water, 13(19), 2621. https://doi.org/10.3390/w13192621