
A Case Study on Reliability, Water Demand and Economic Analysis of Rainwater Harvesting in Australian Capital Cities


Abstract
:1. Introduction
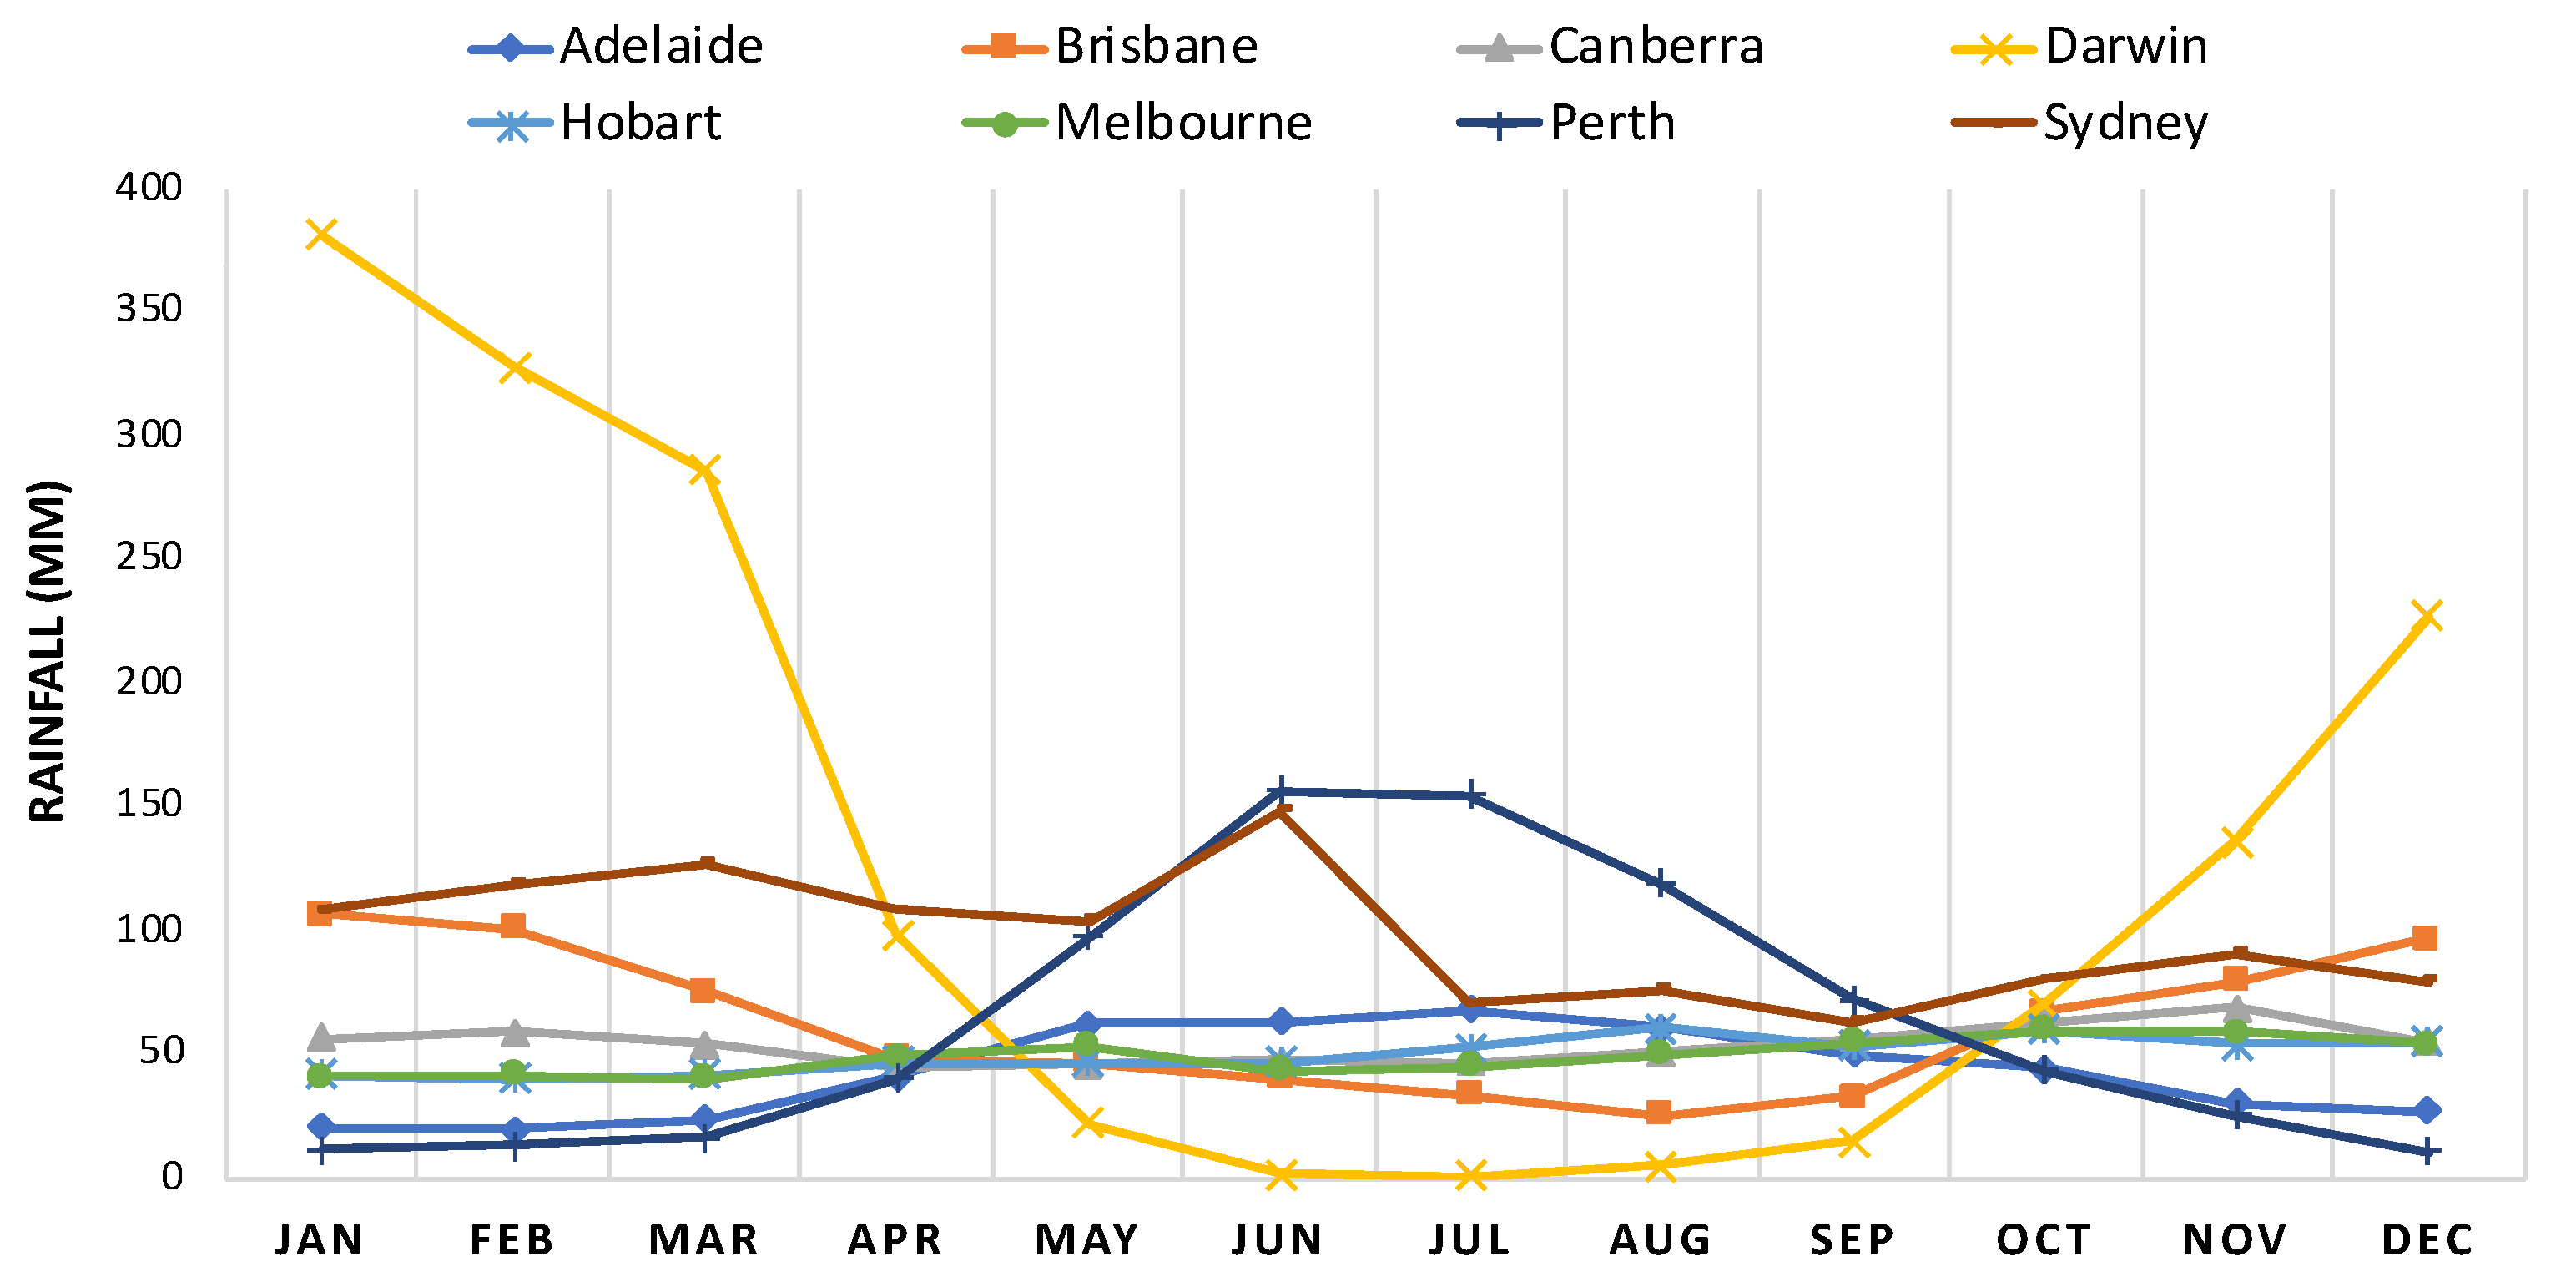
2. Study Area and Data
3. Methodology
3.1. Reliability and Water Saving Analysis
3.2. Water Demand
- Toilet: 6 L/flush, full flushed thrice a day per person, giving 18 L/person/day.
- Laundry: Washing machine 50 L/wash, at 0.43 washes/day, resulting in 21.5 L/day.
- Irrigation: Outdoor use includes irrigation at 10 mm depth of irrigation multiplied by the irrigation area (150 × 10 mm = 1.5 m3/session).
3.3. Dimensionless Design Parameters
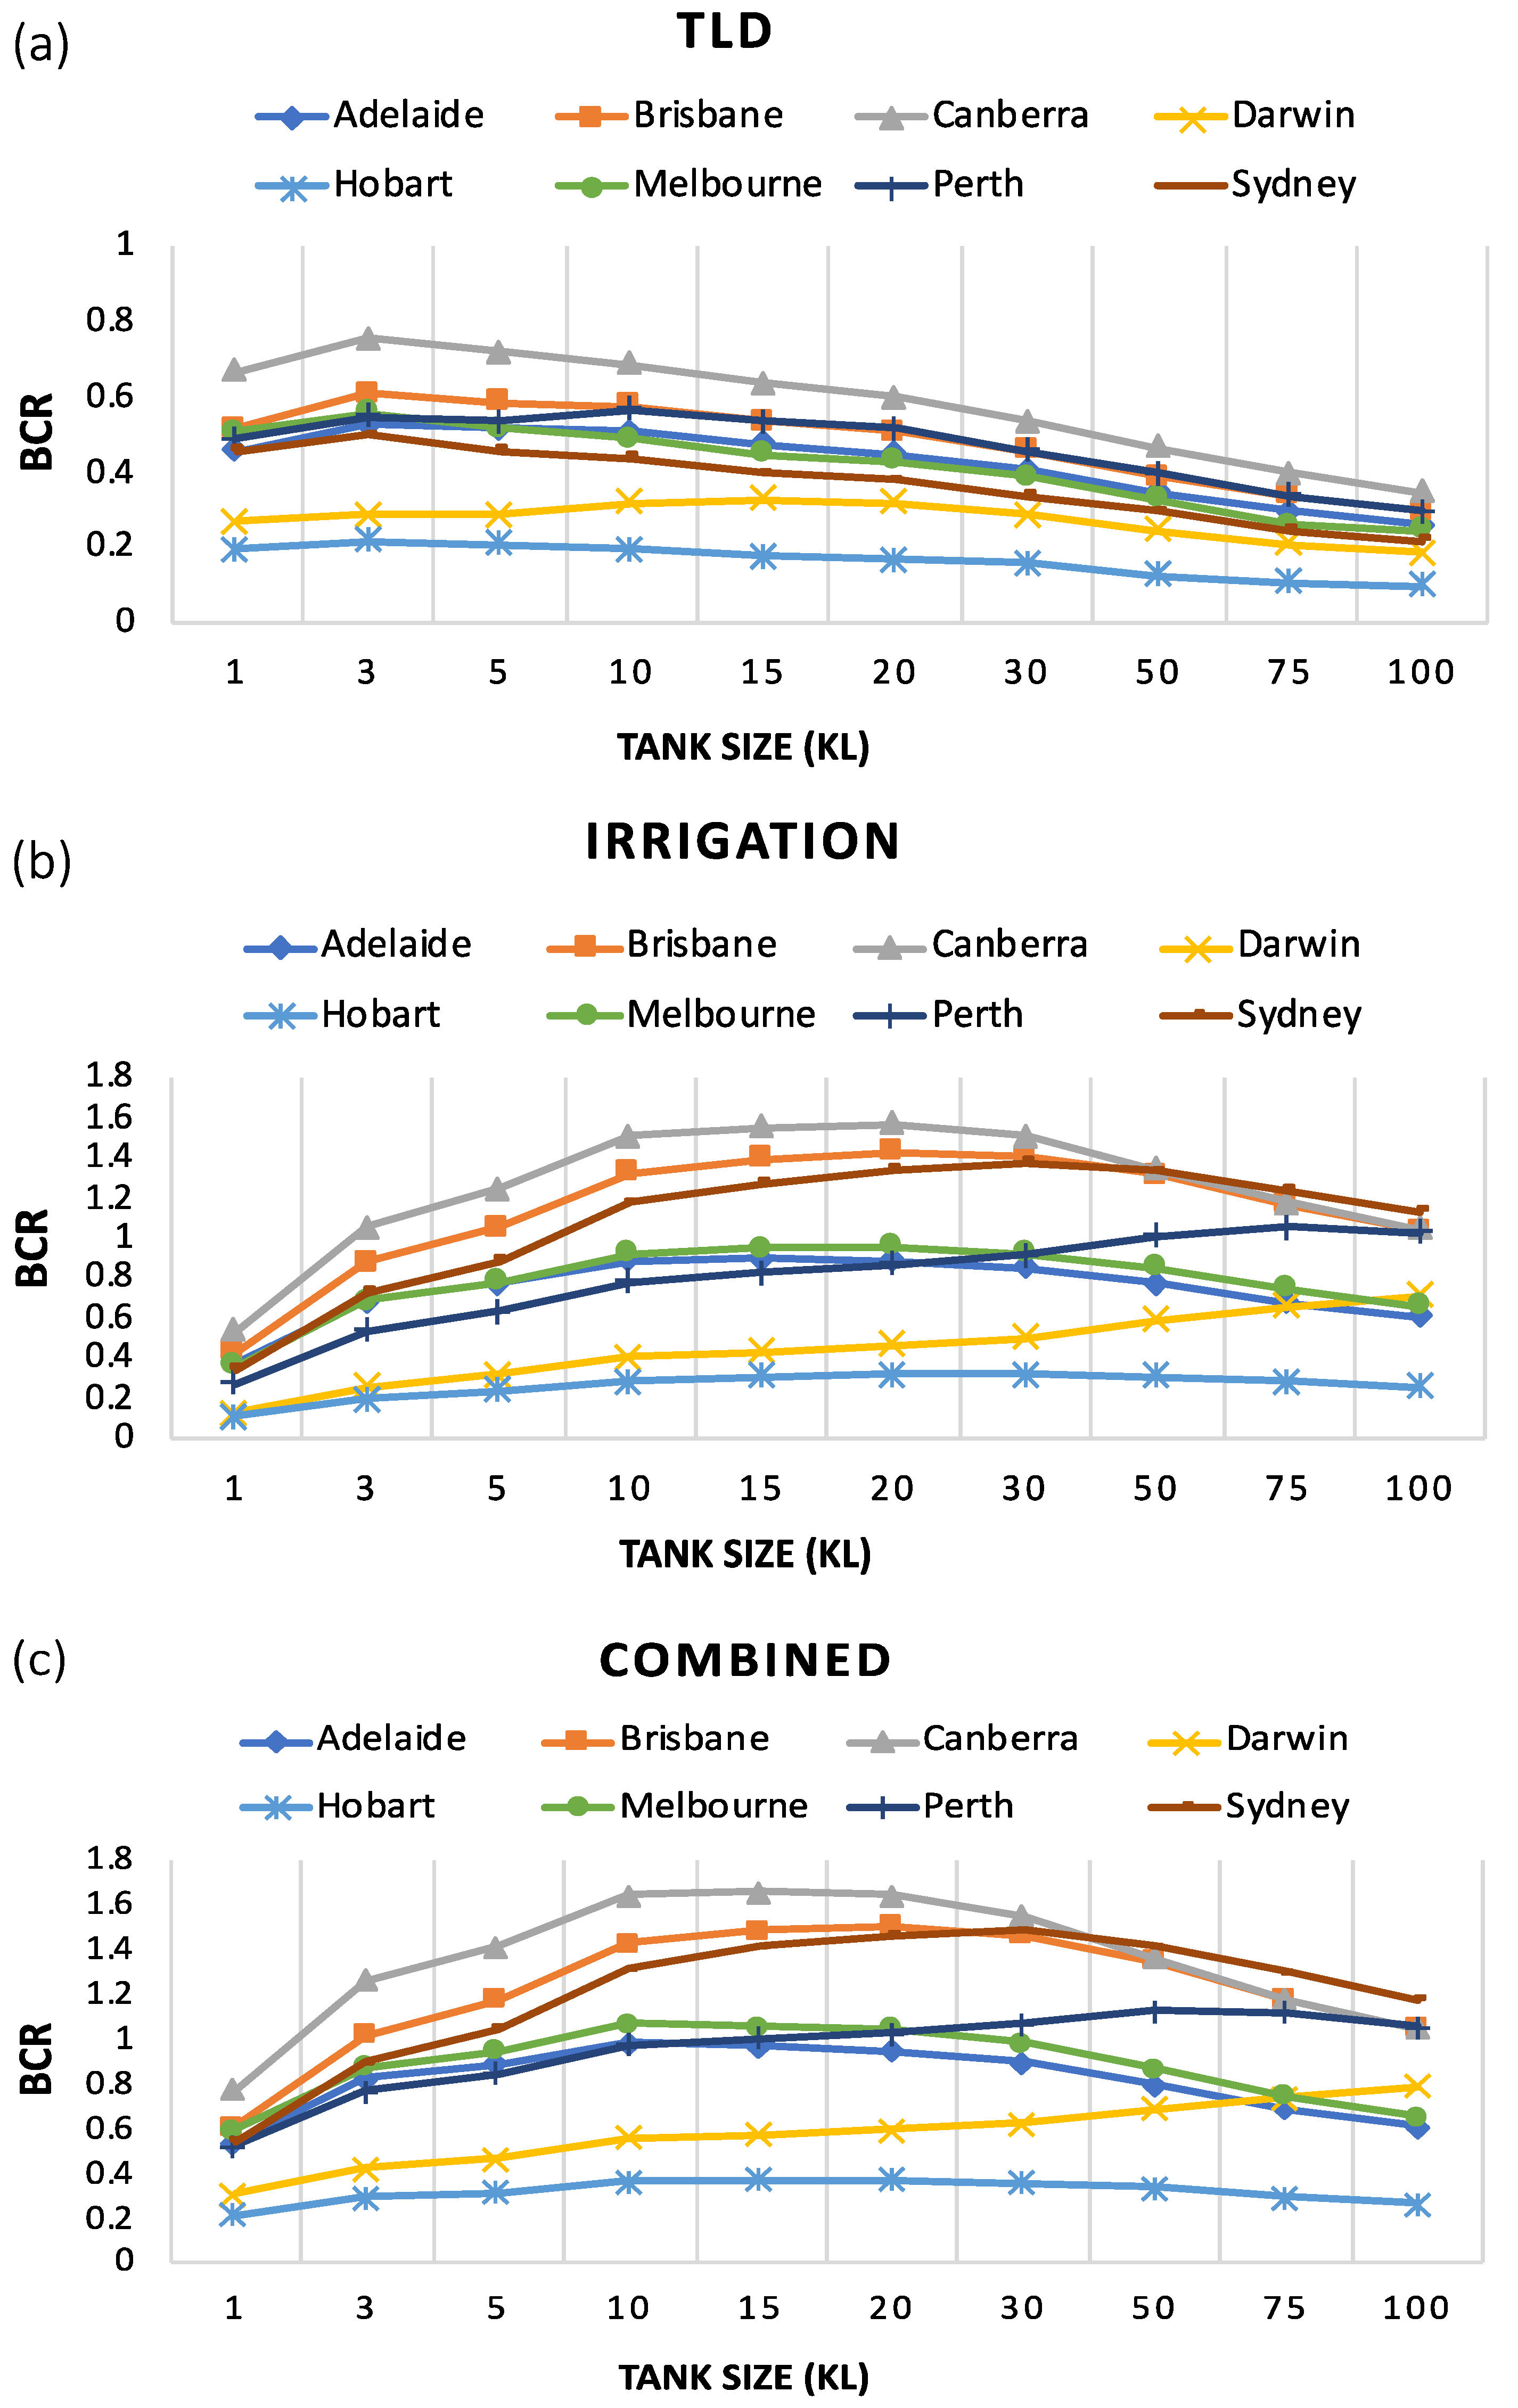
3.4. Economic Analysis
4. Results and Discussion
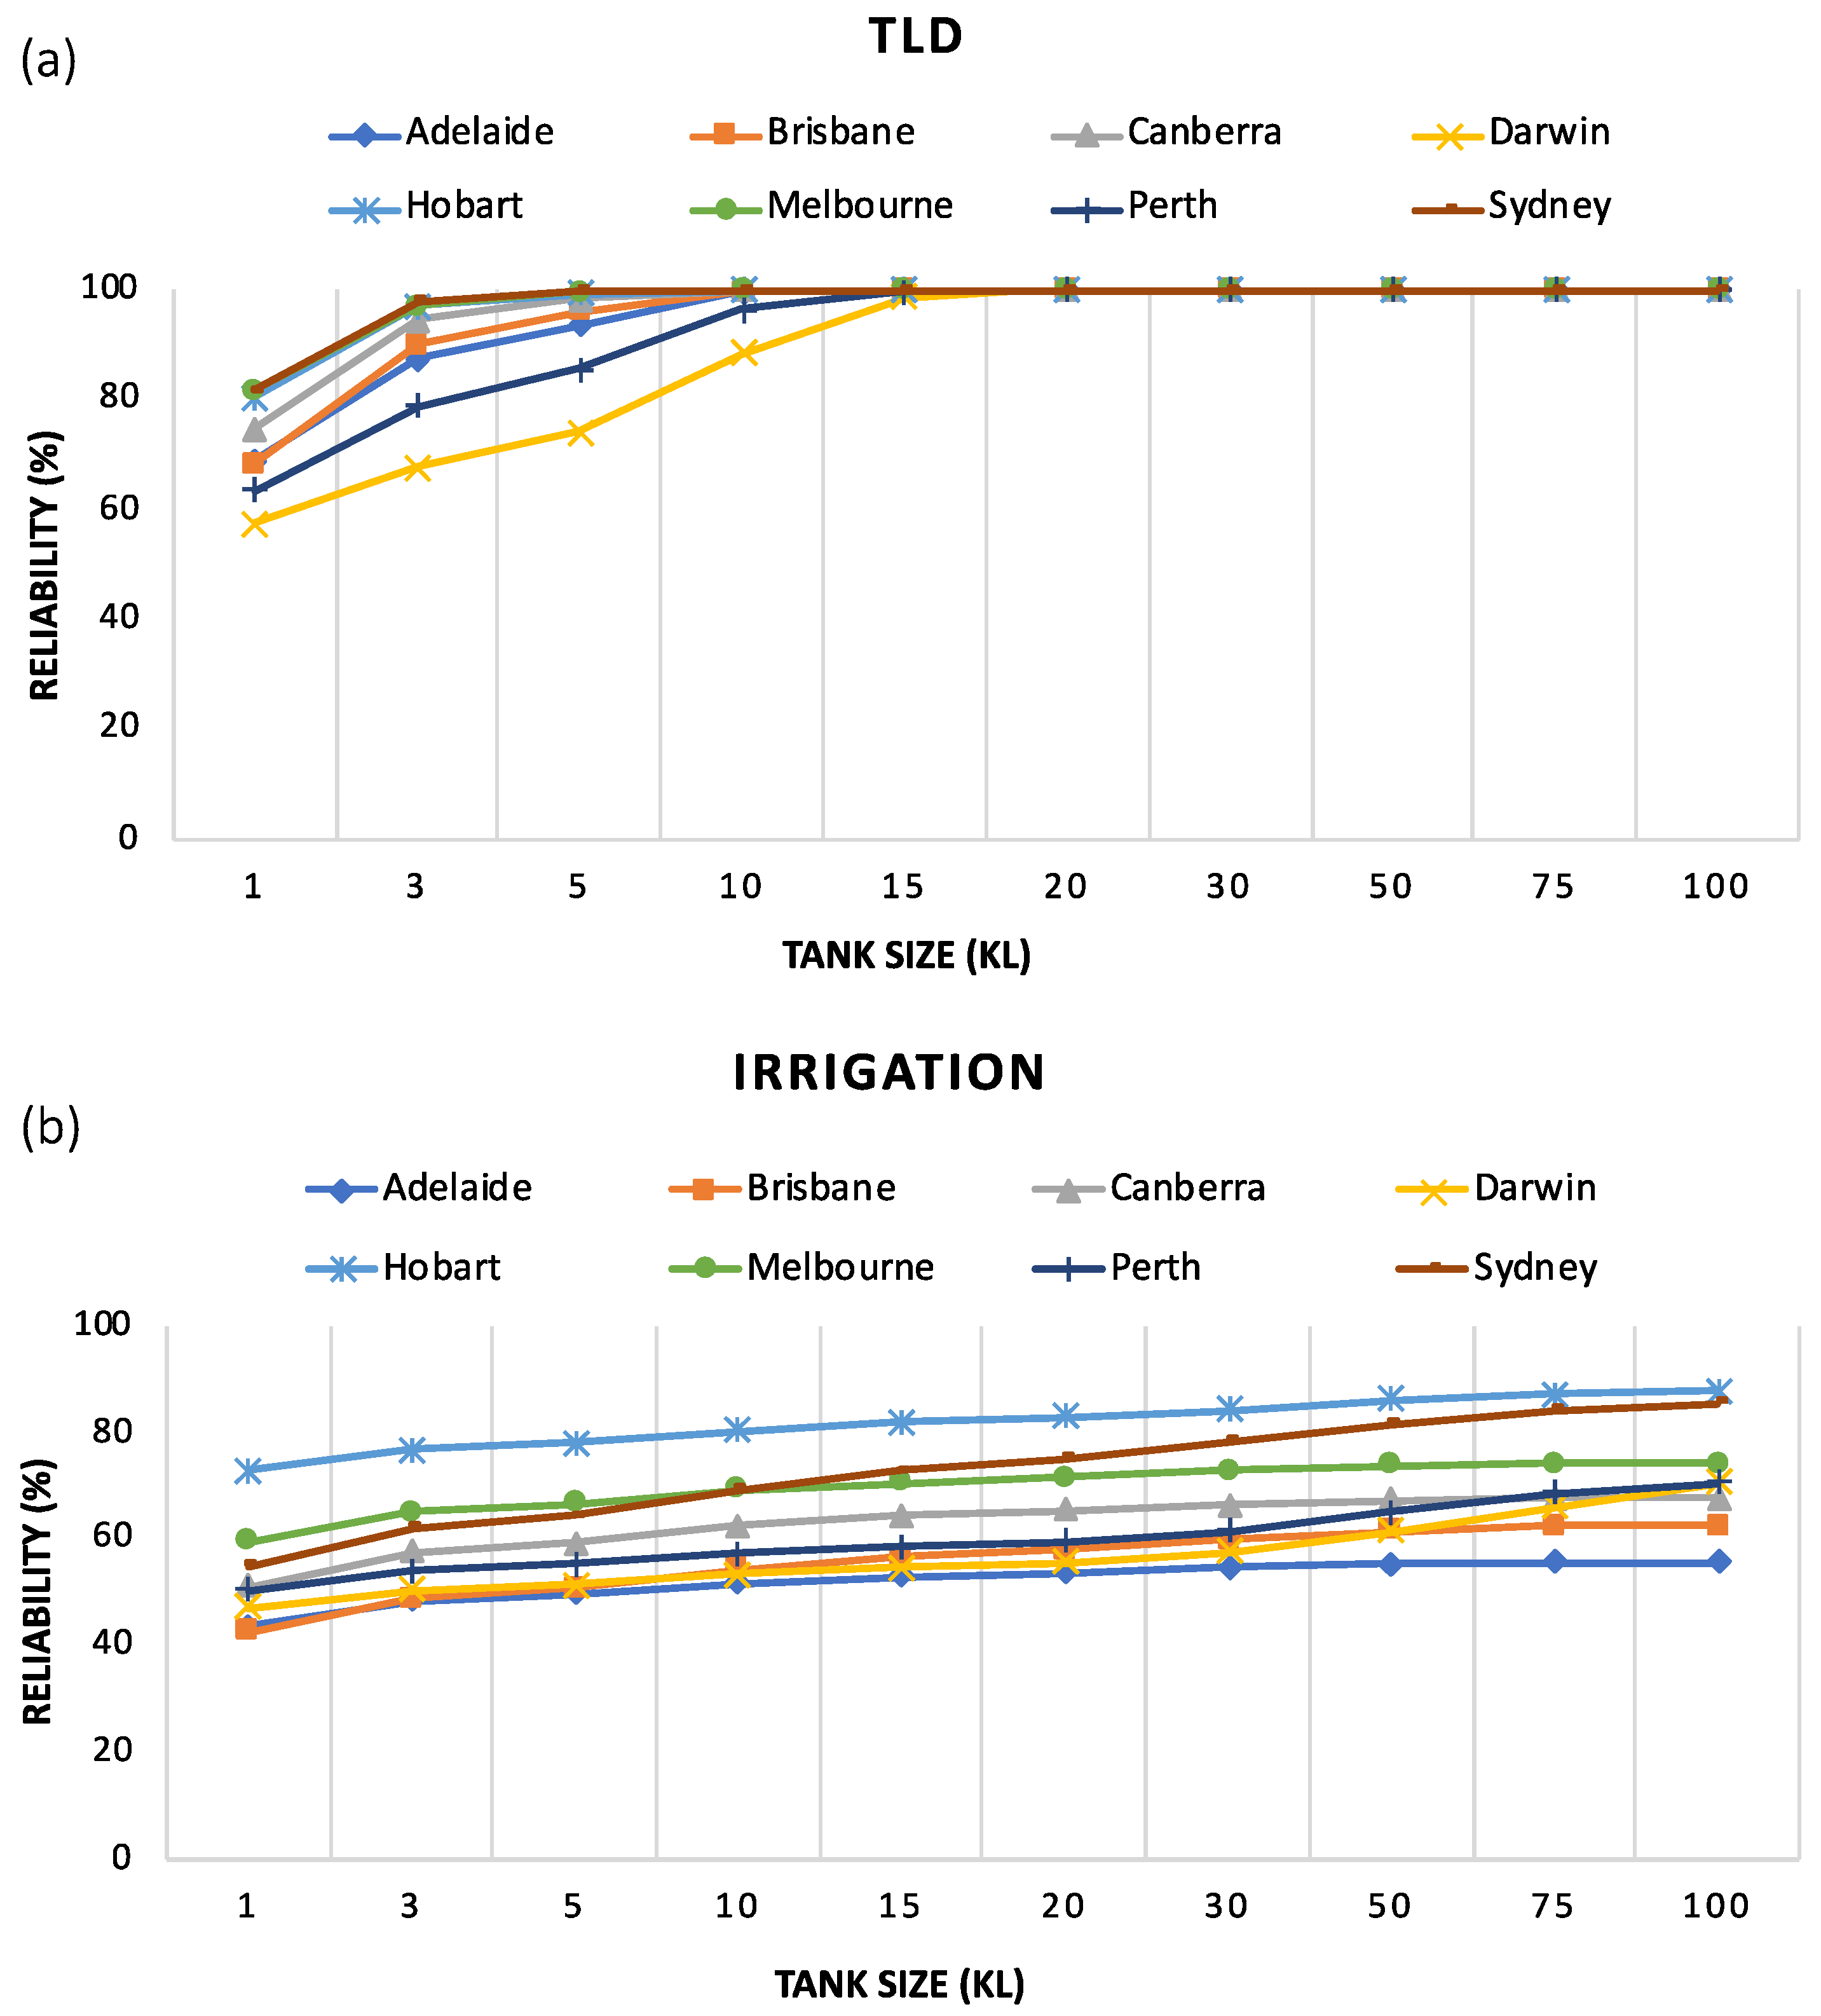
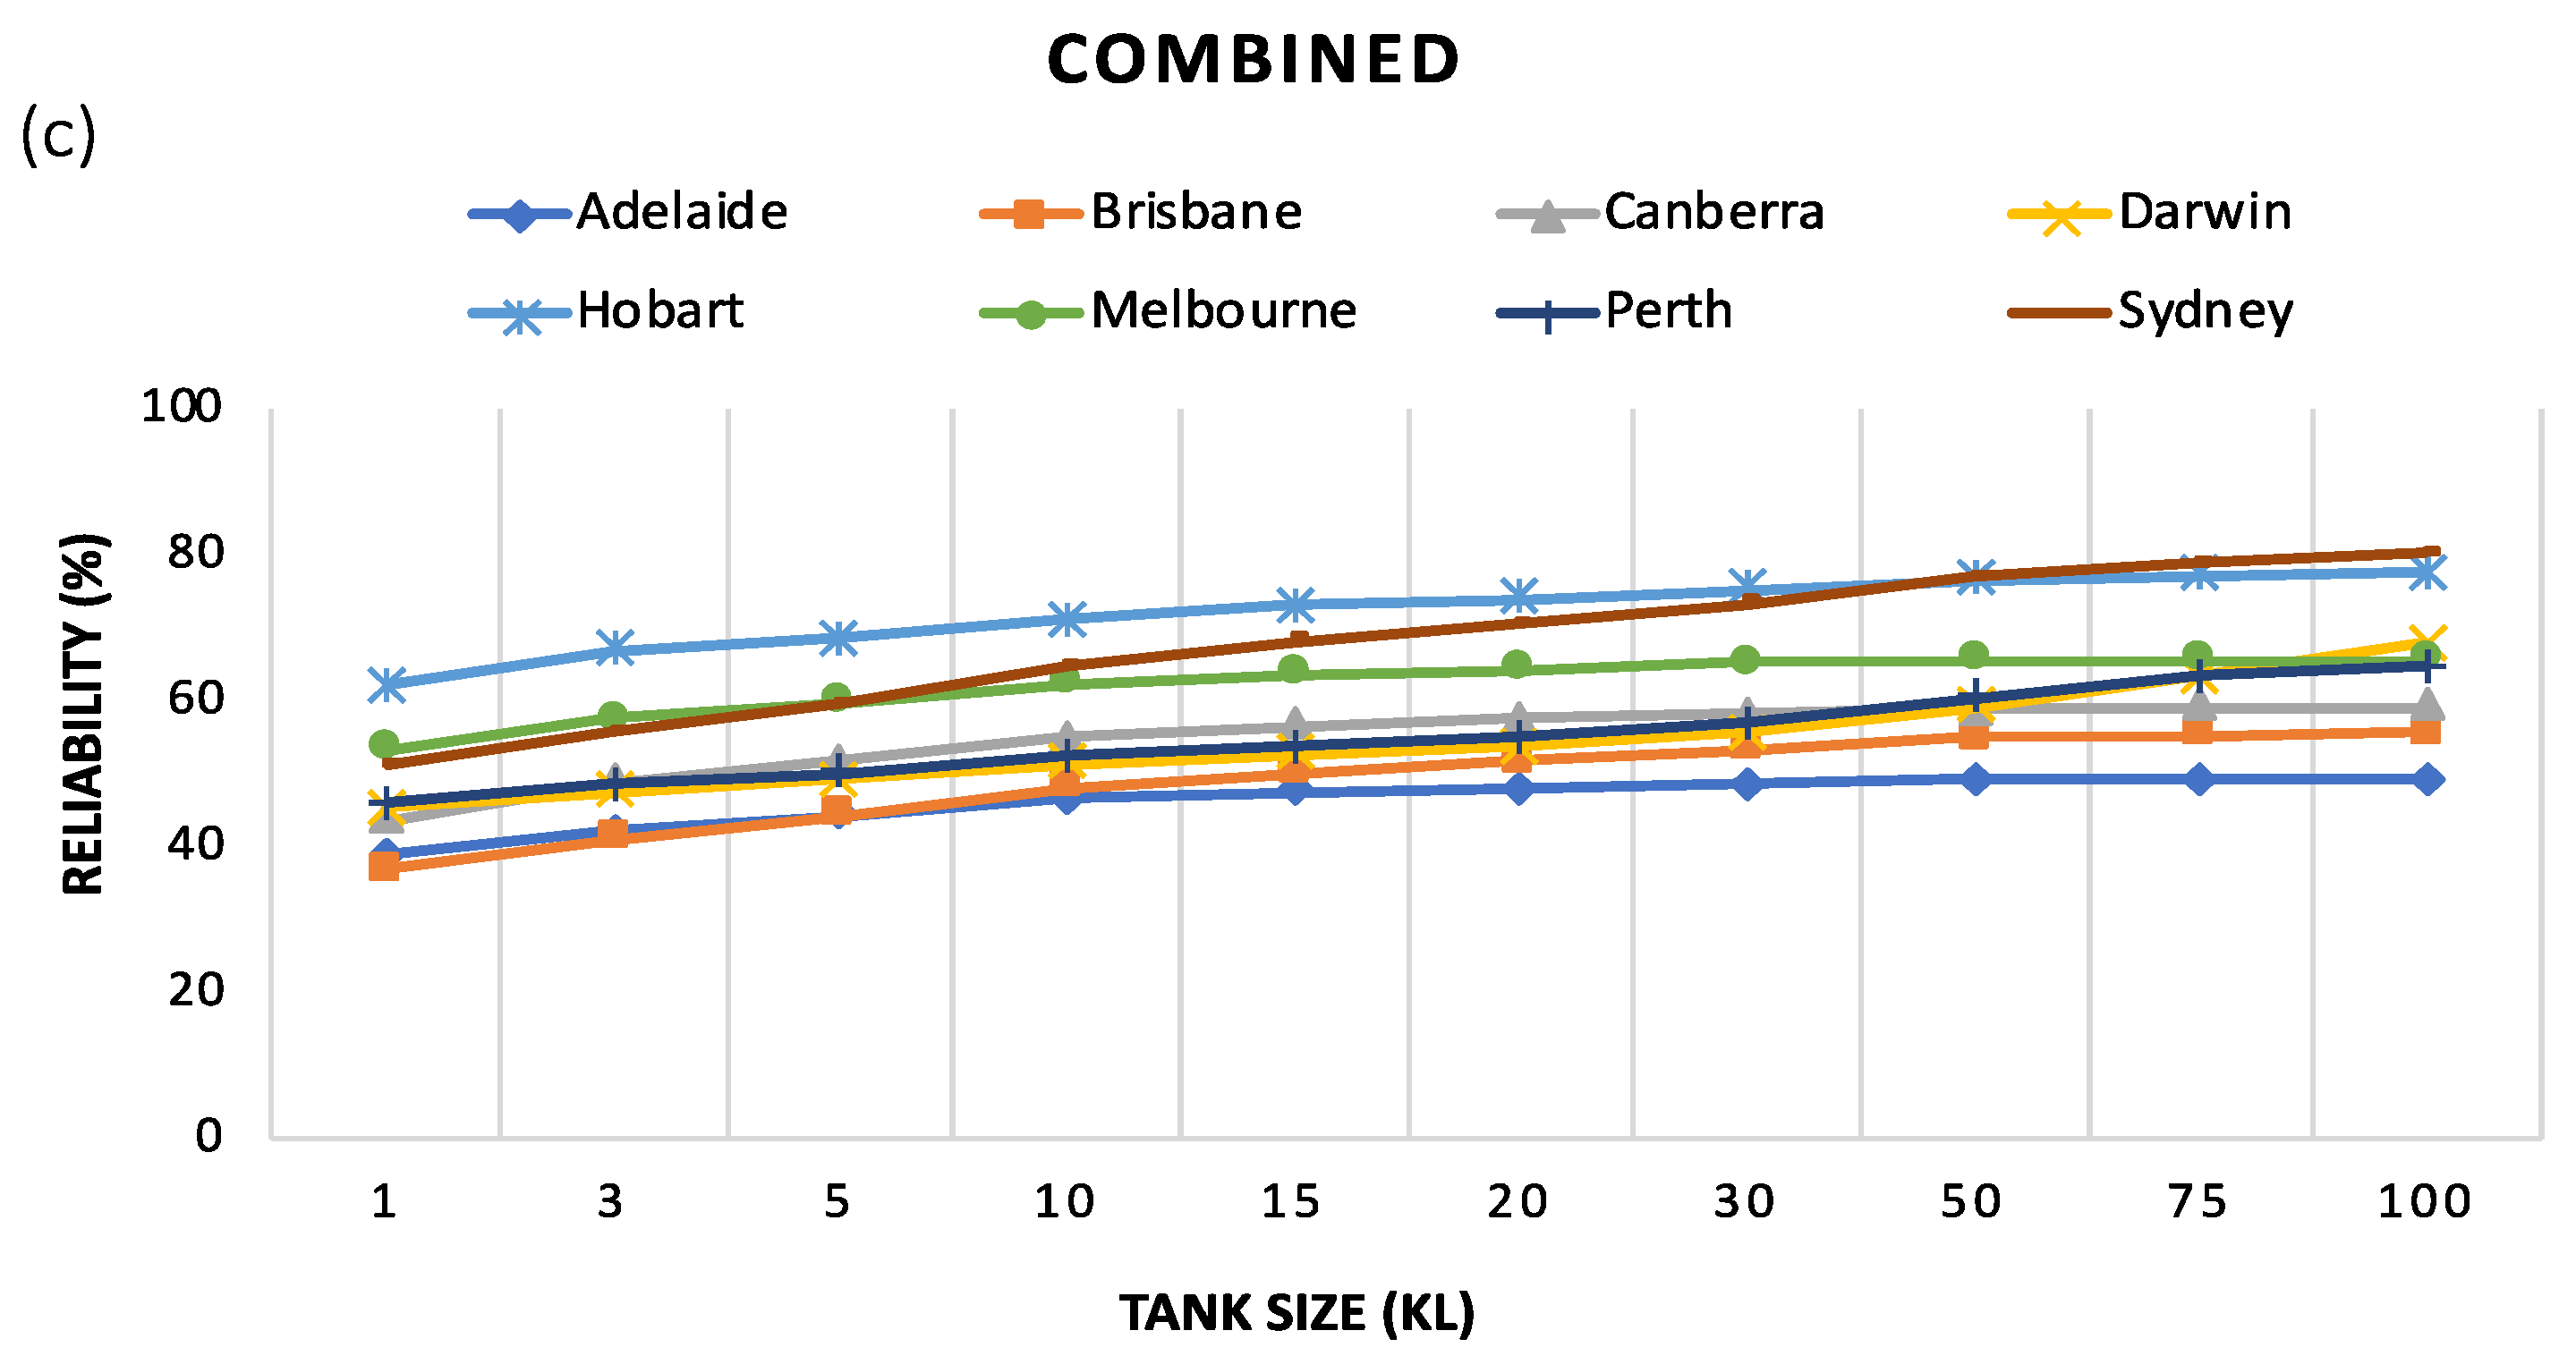
4.1. Reliability
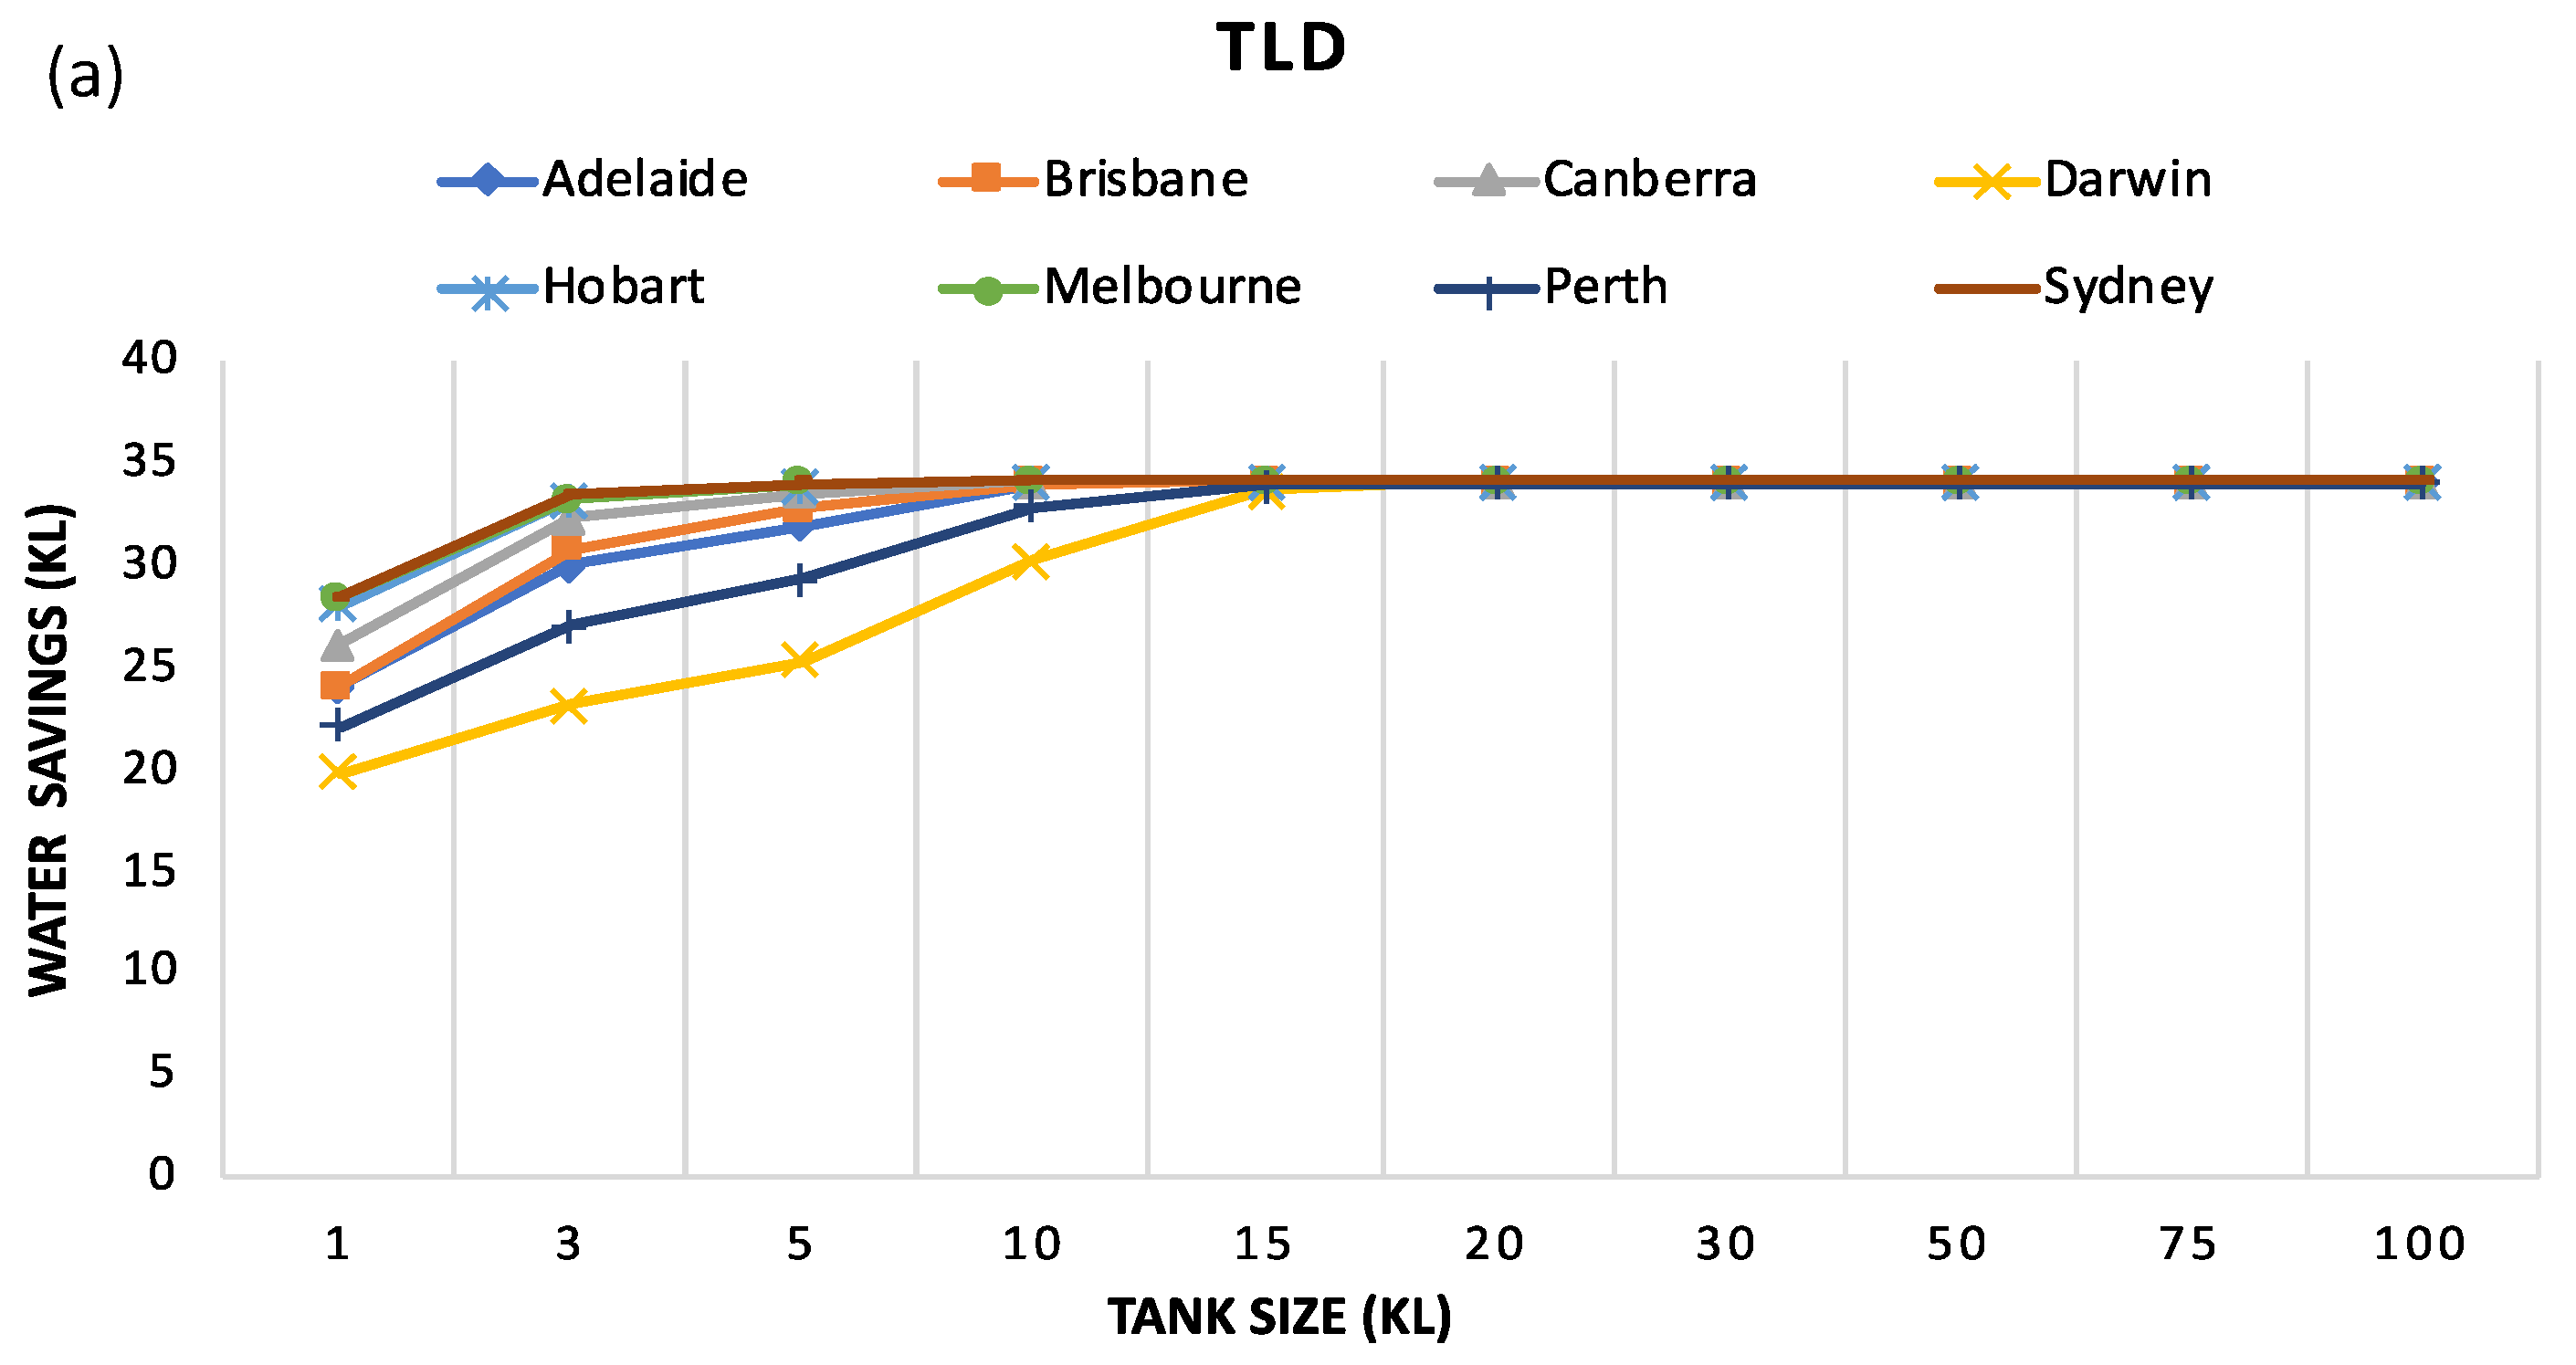
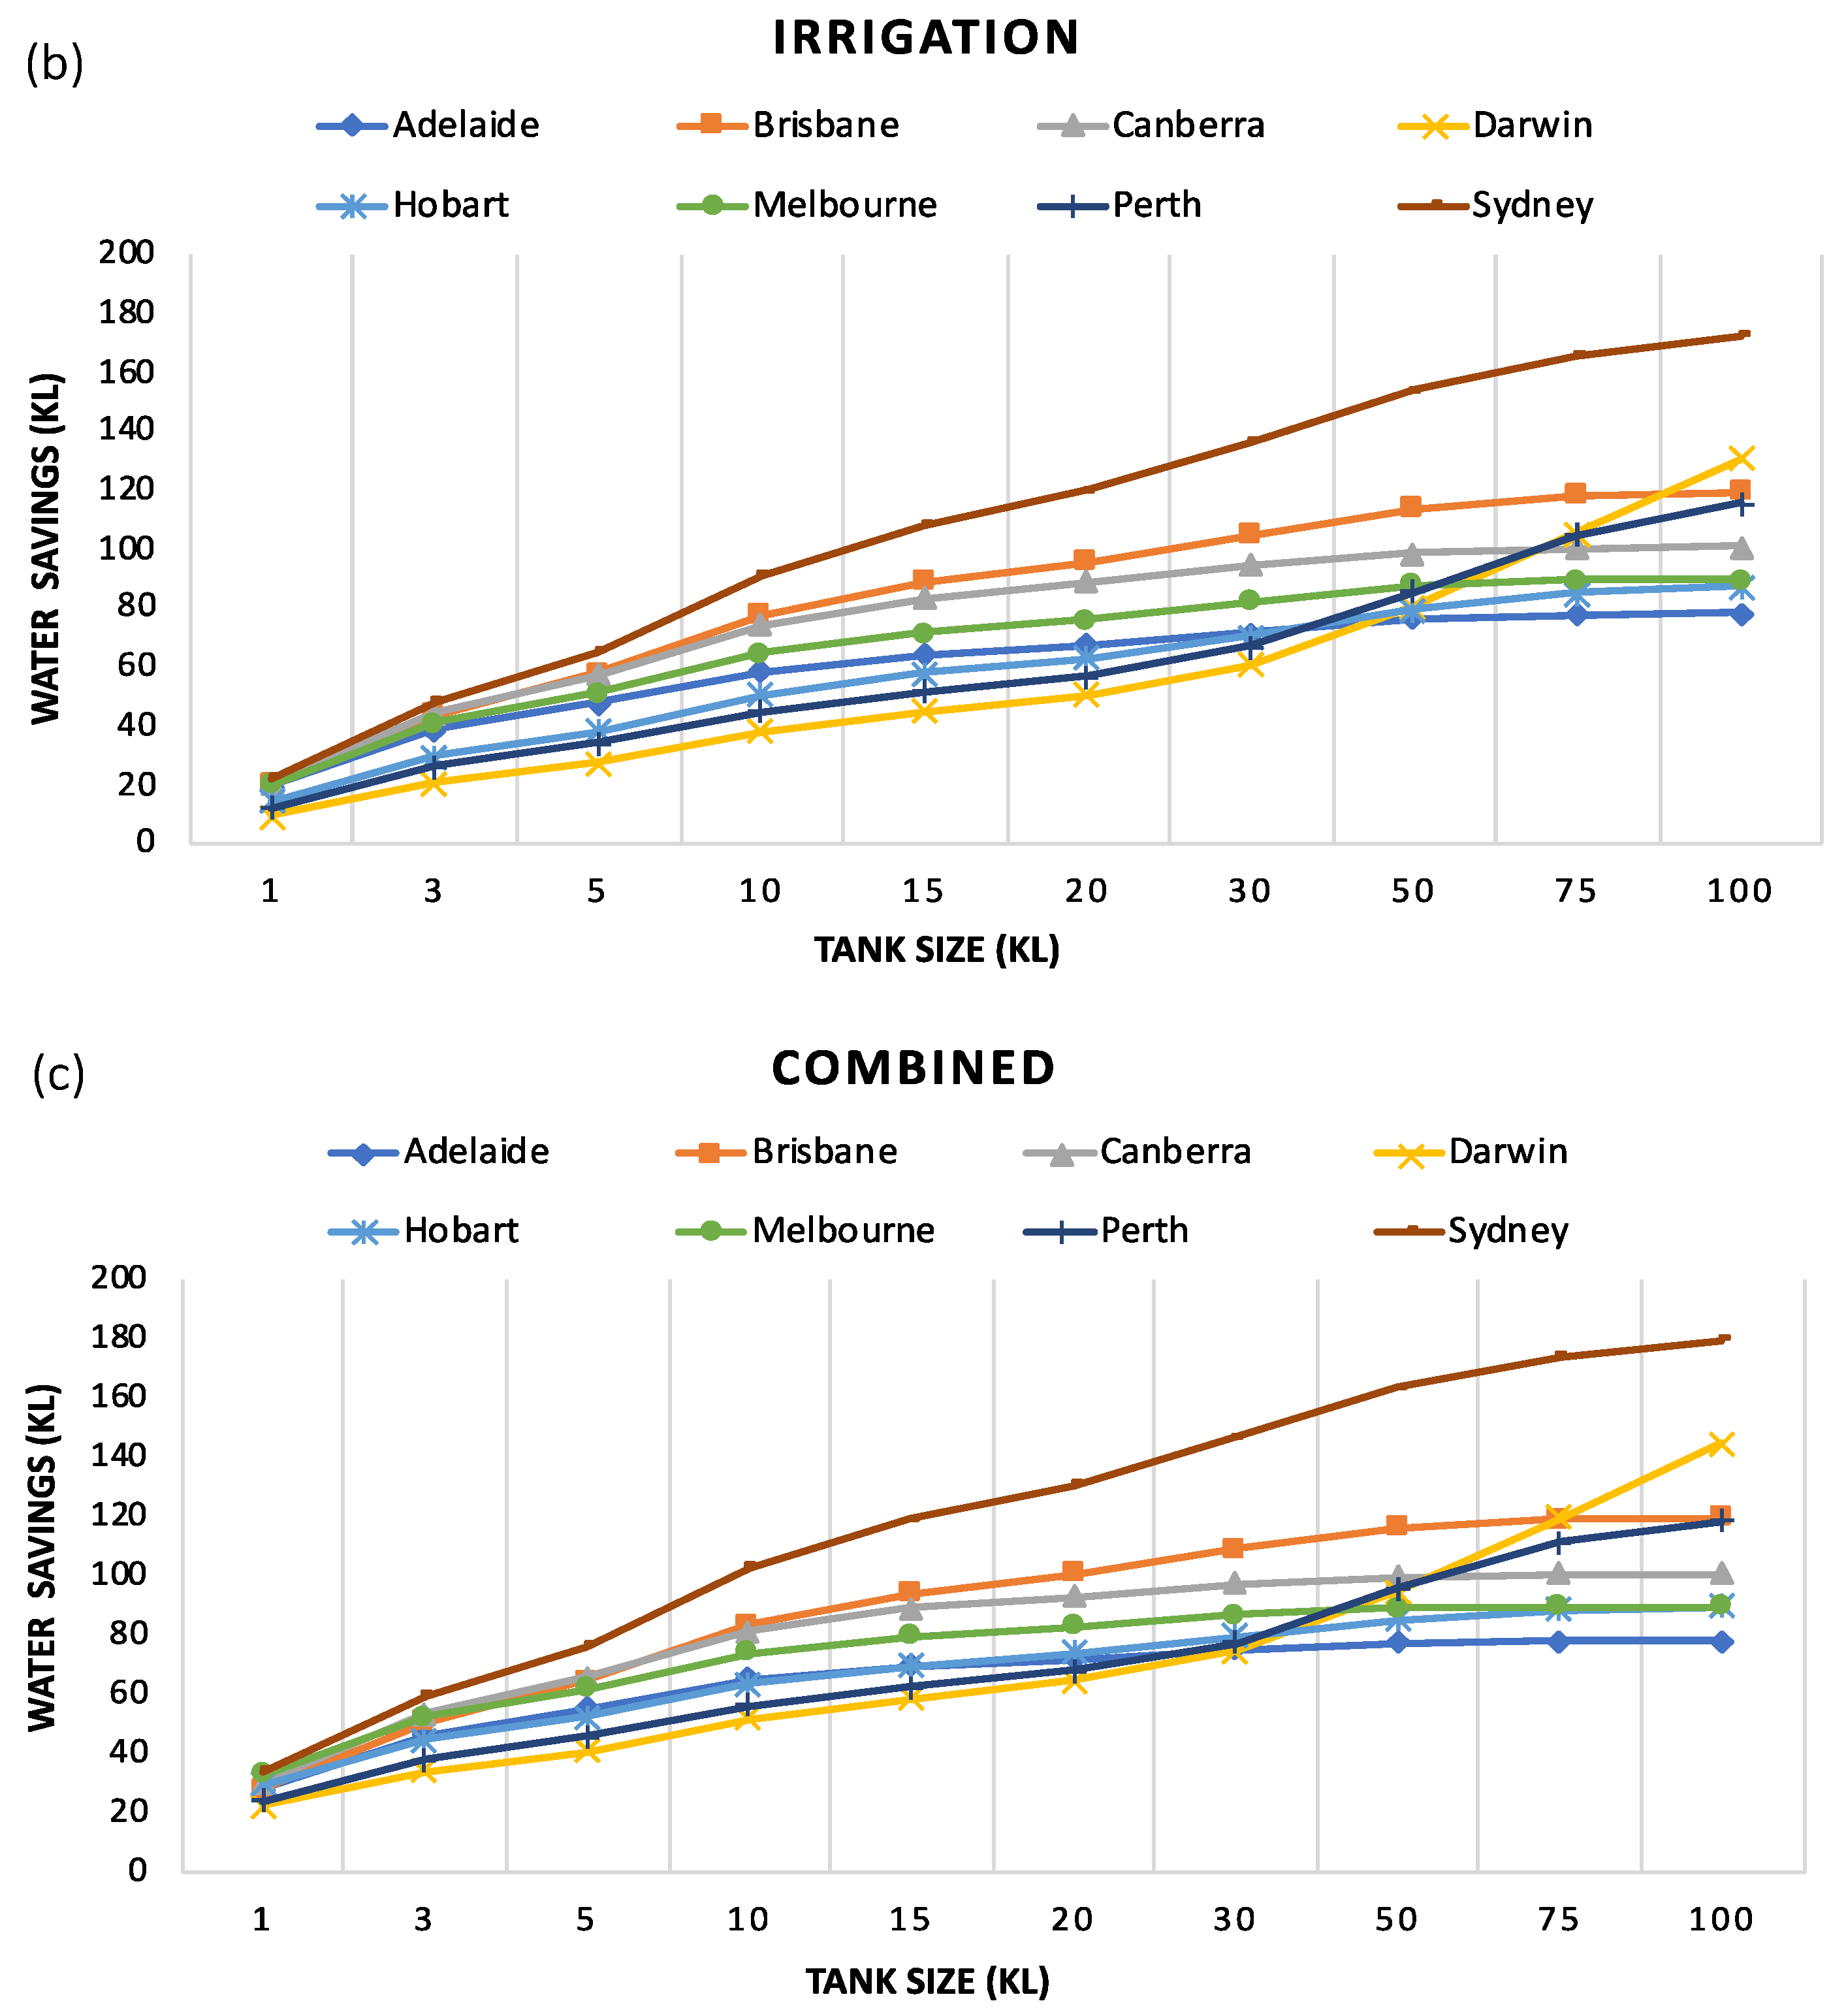
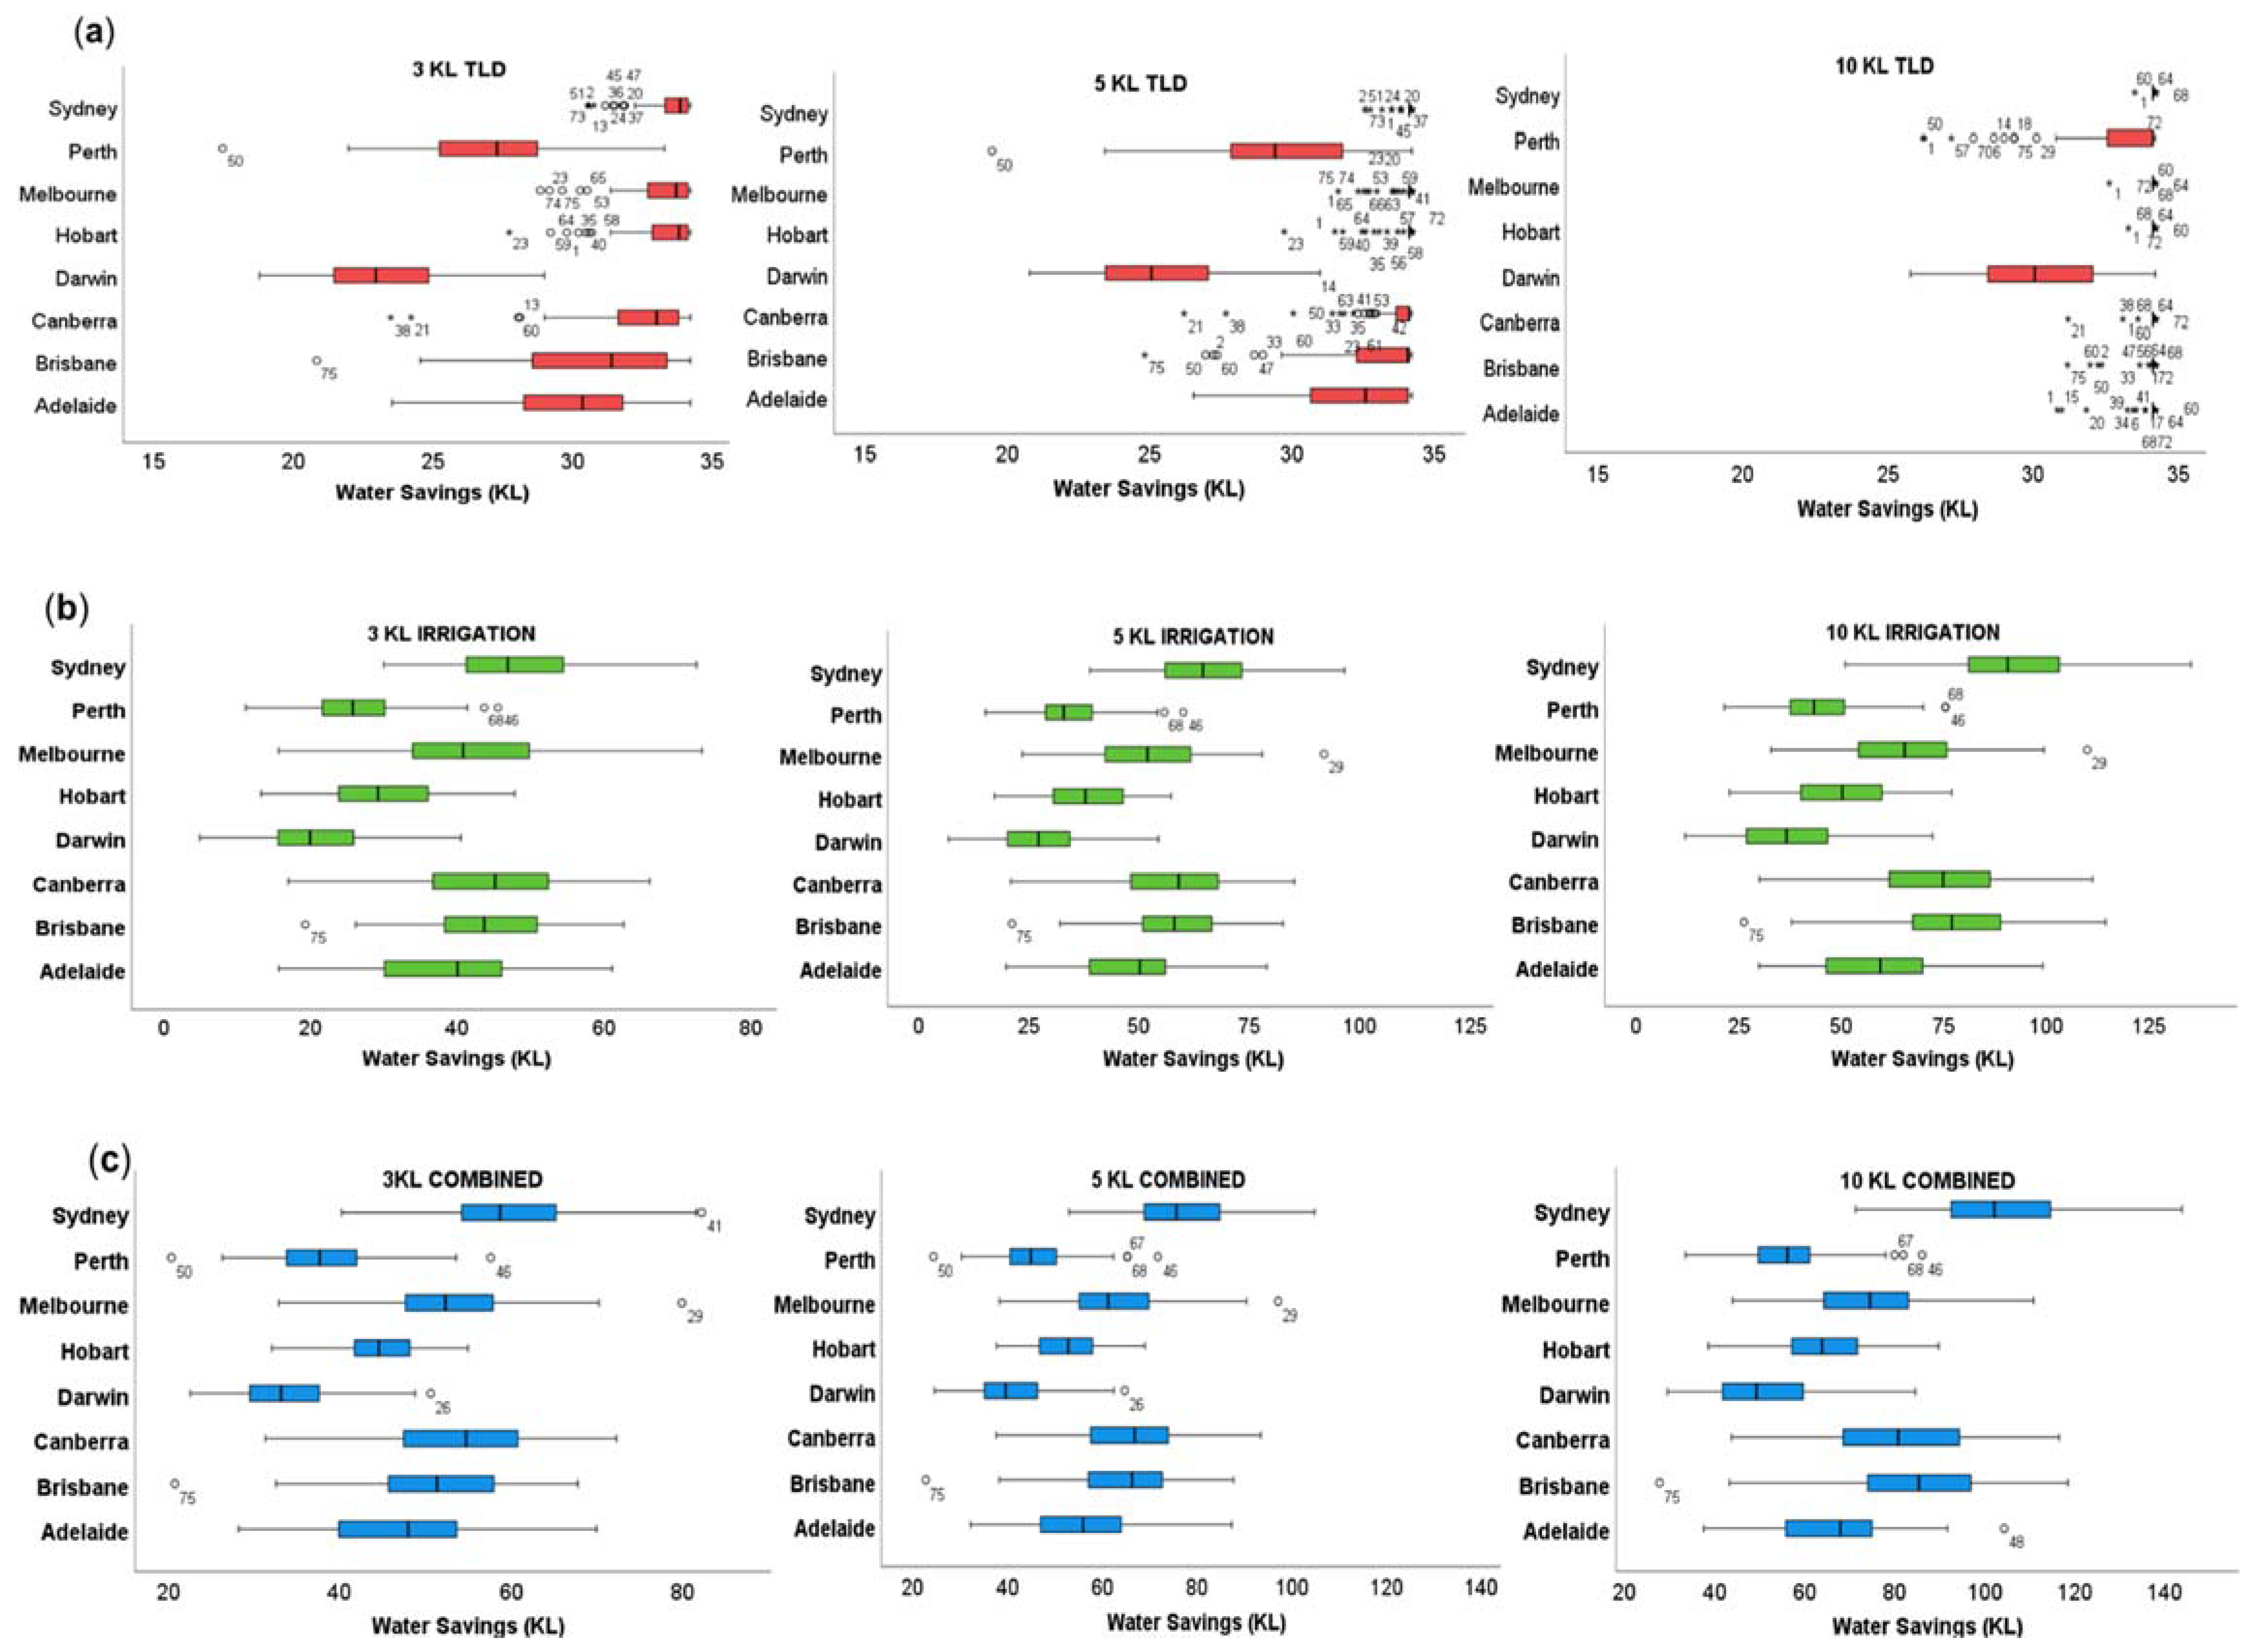
4.2. Water Savings
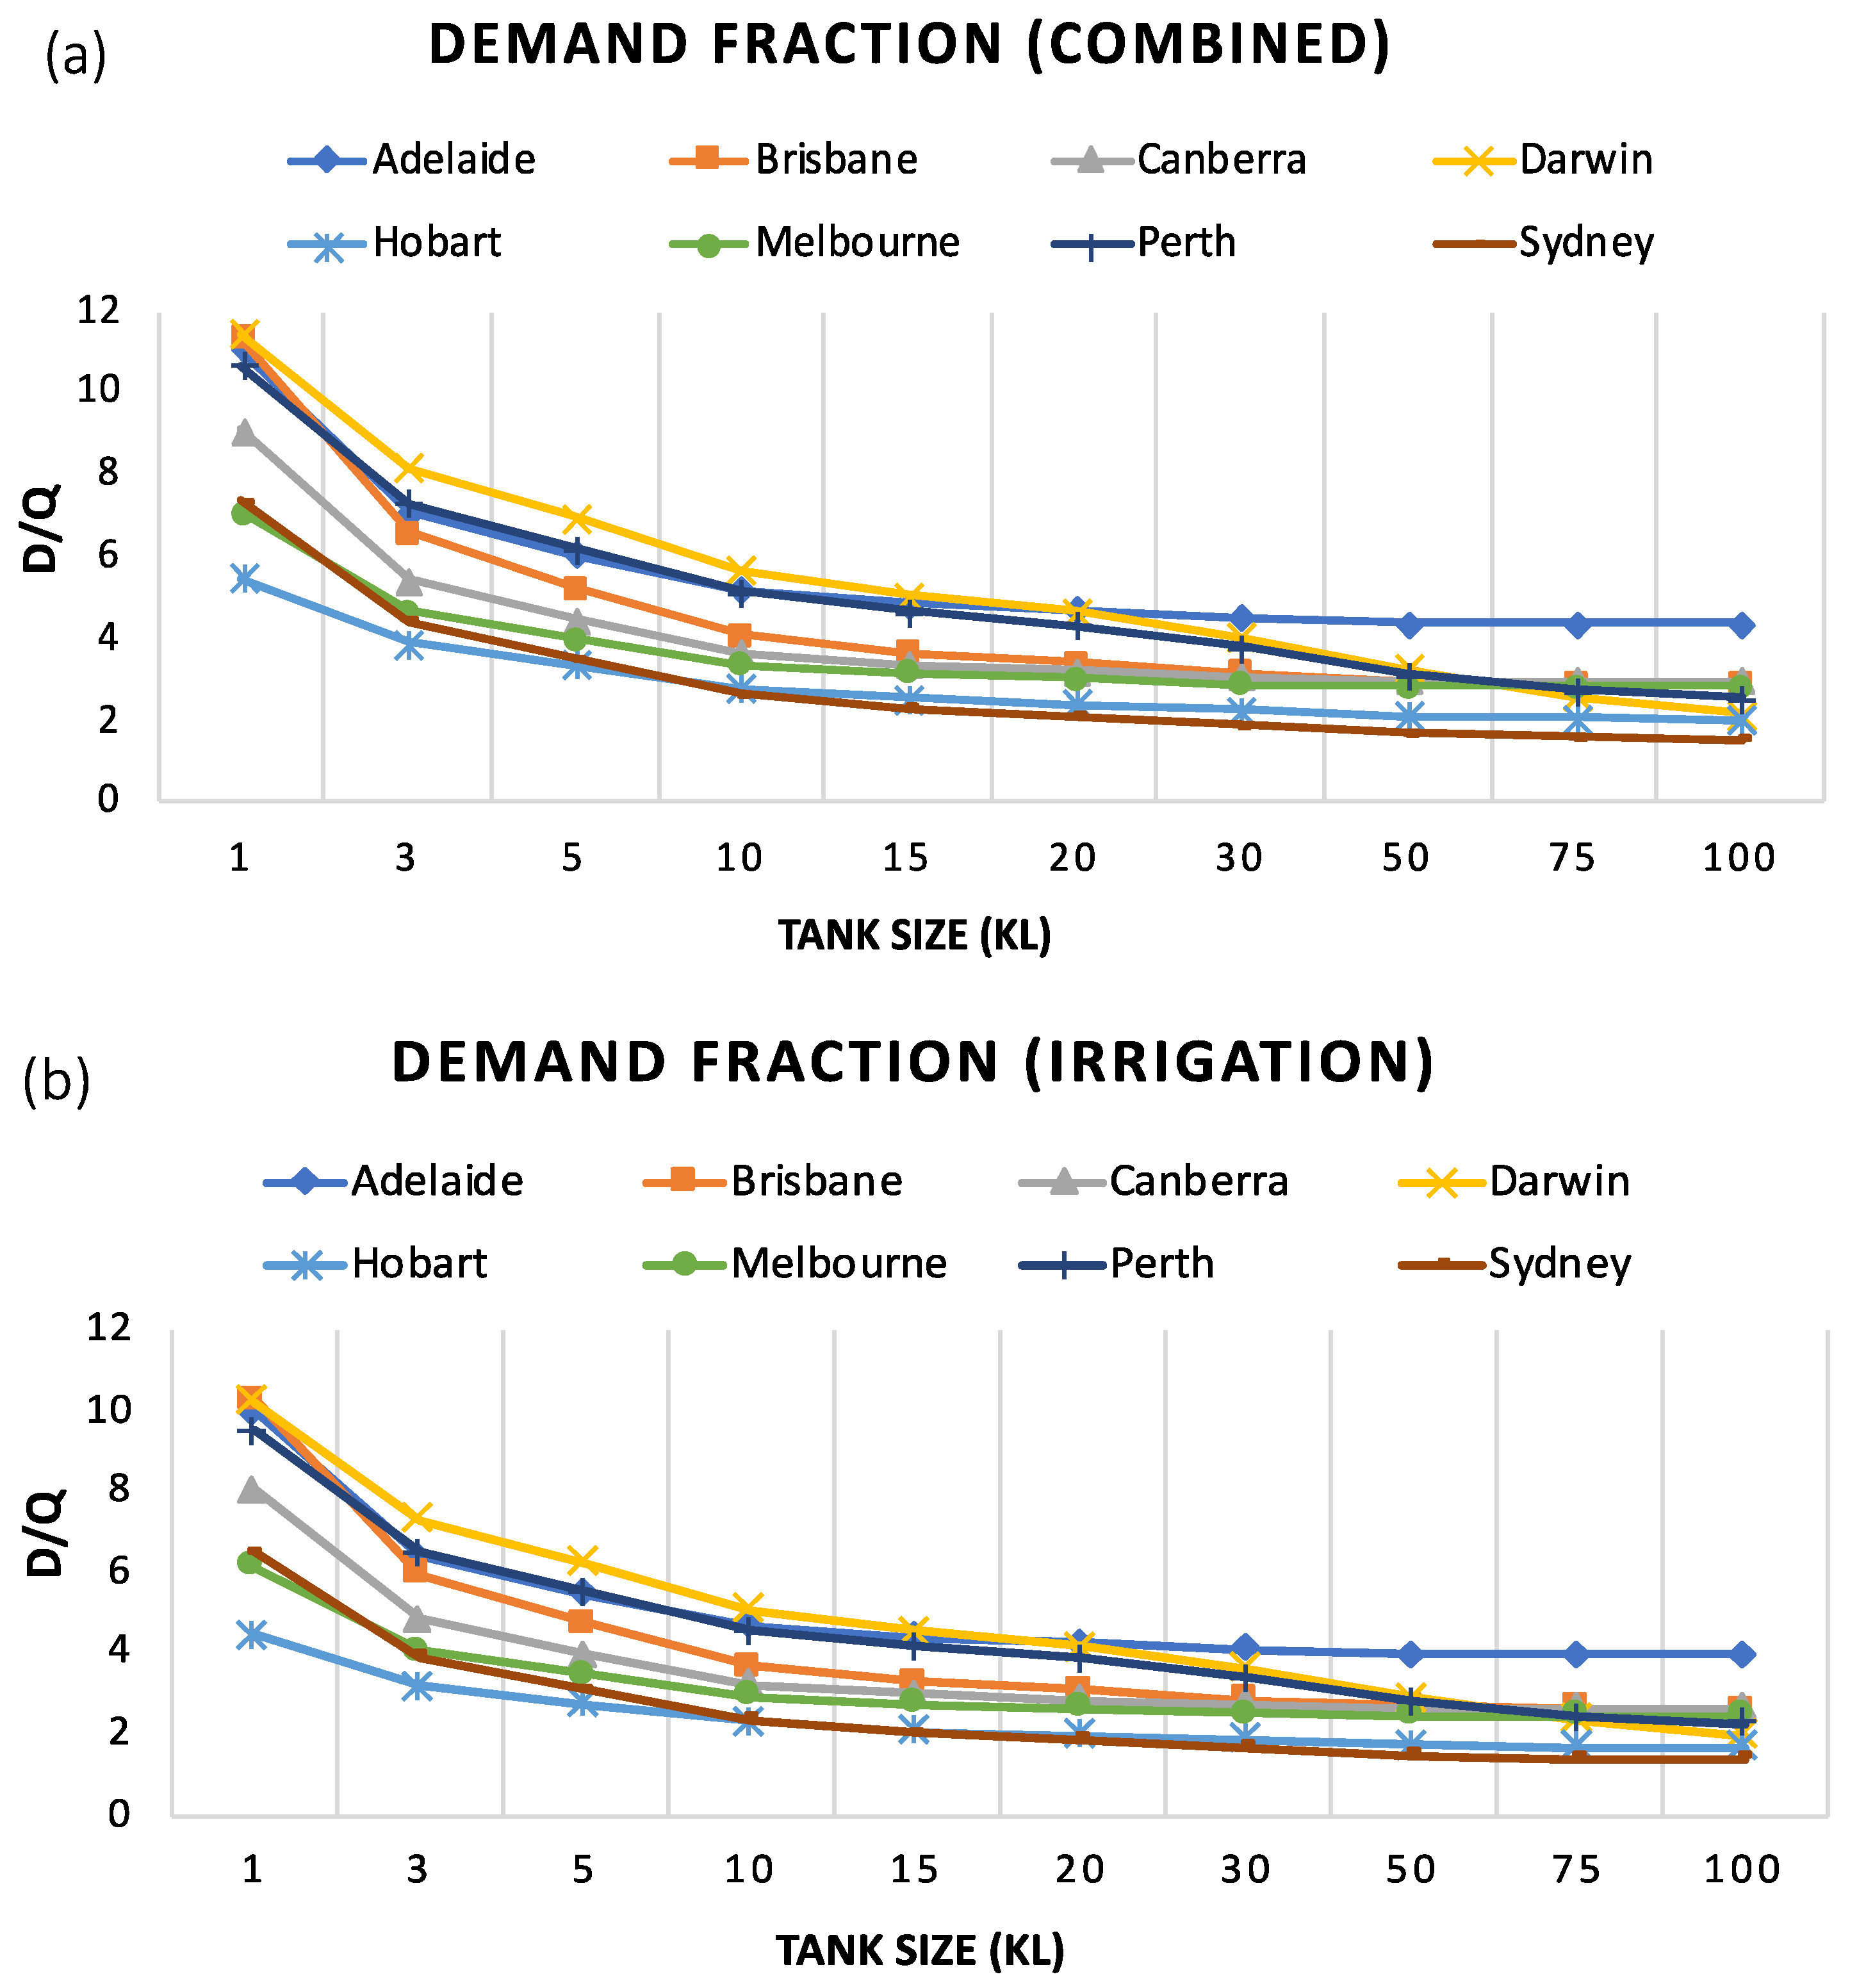
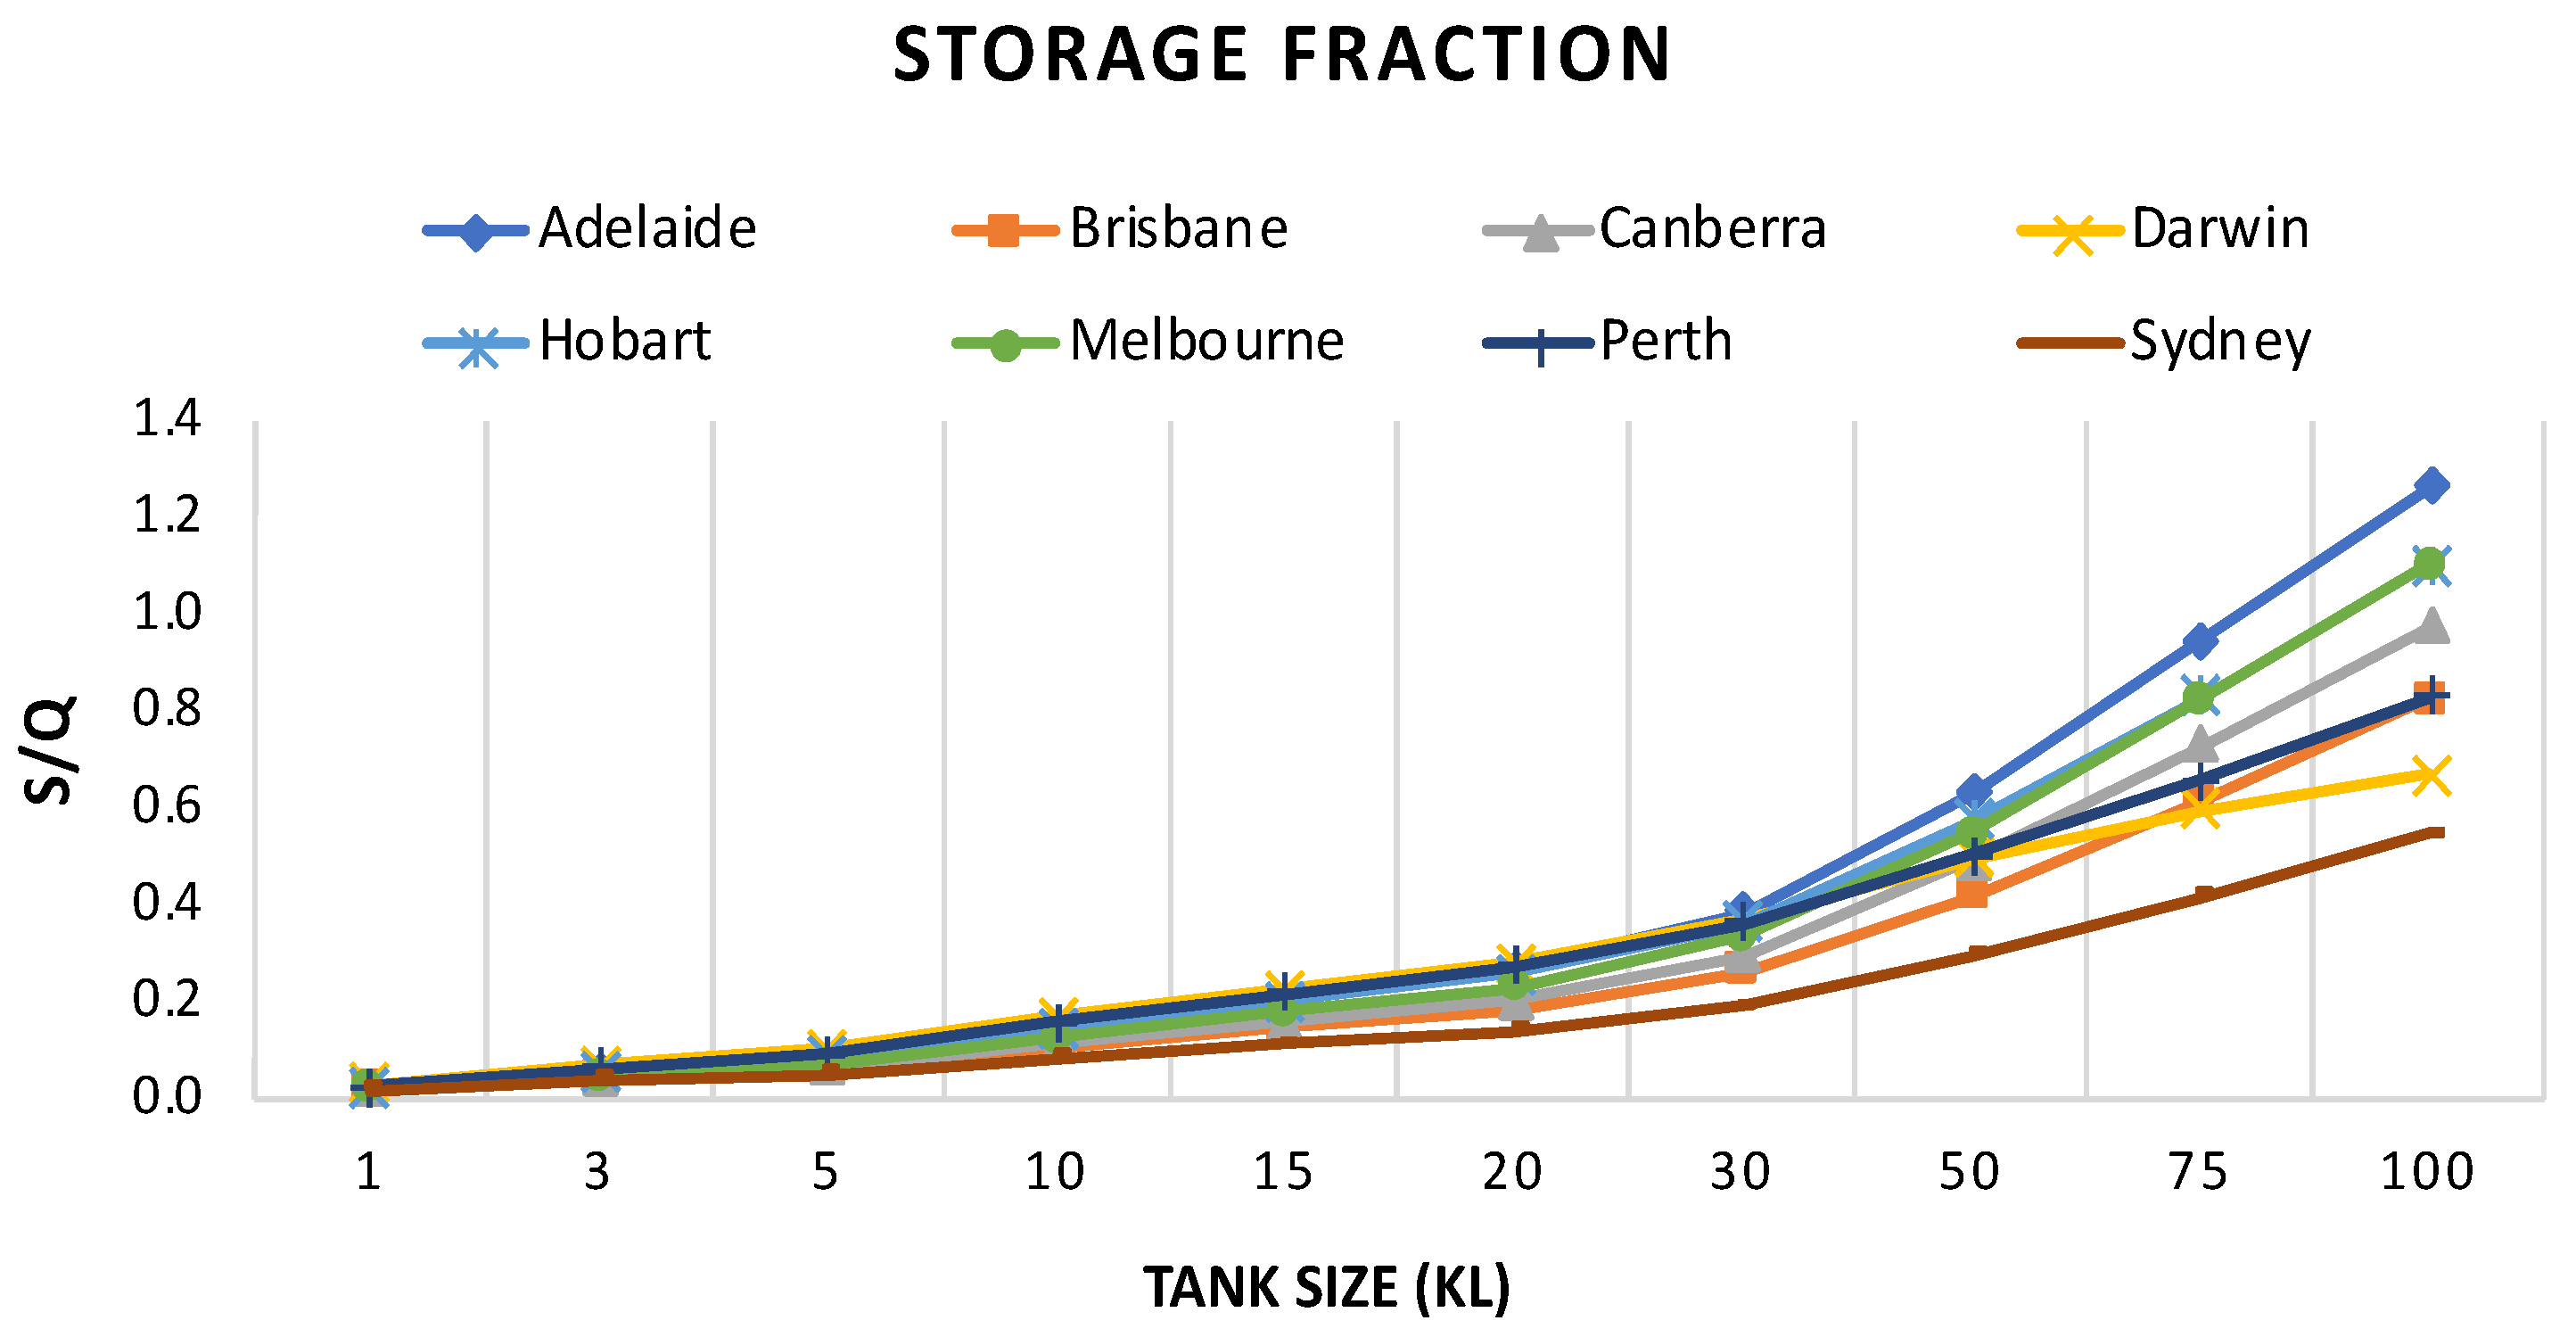
4.3. Dimensionless Design Parameters
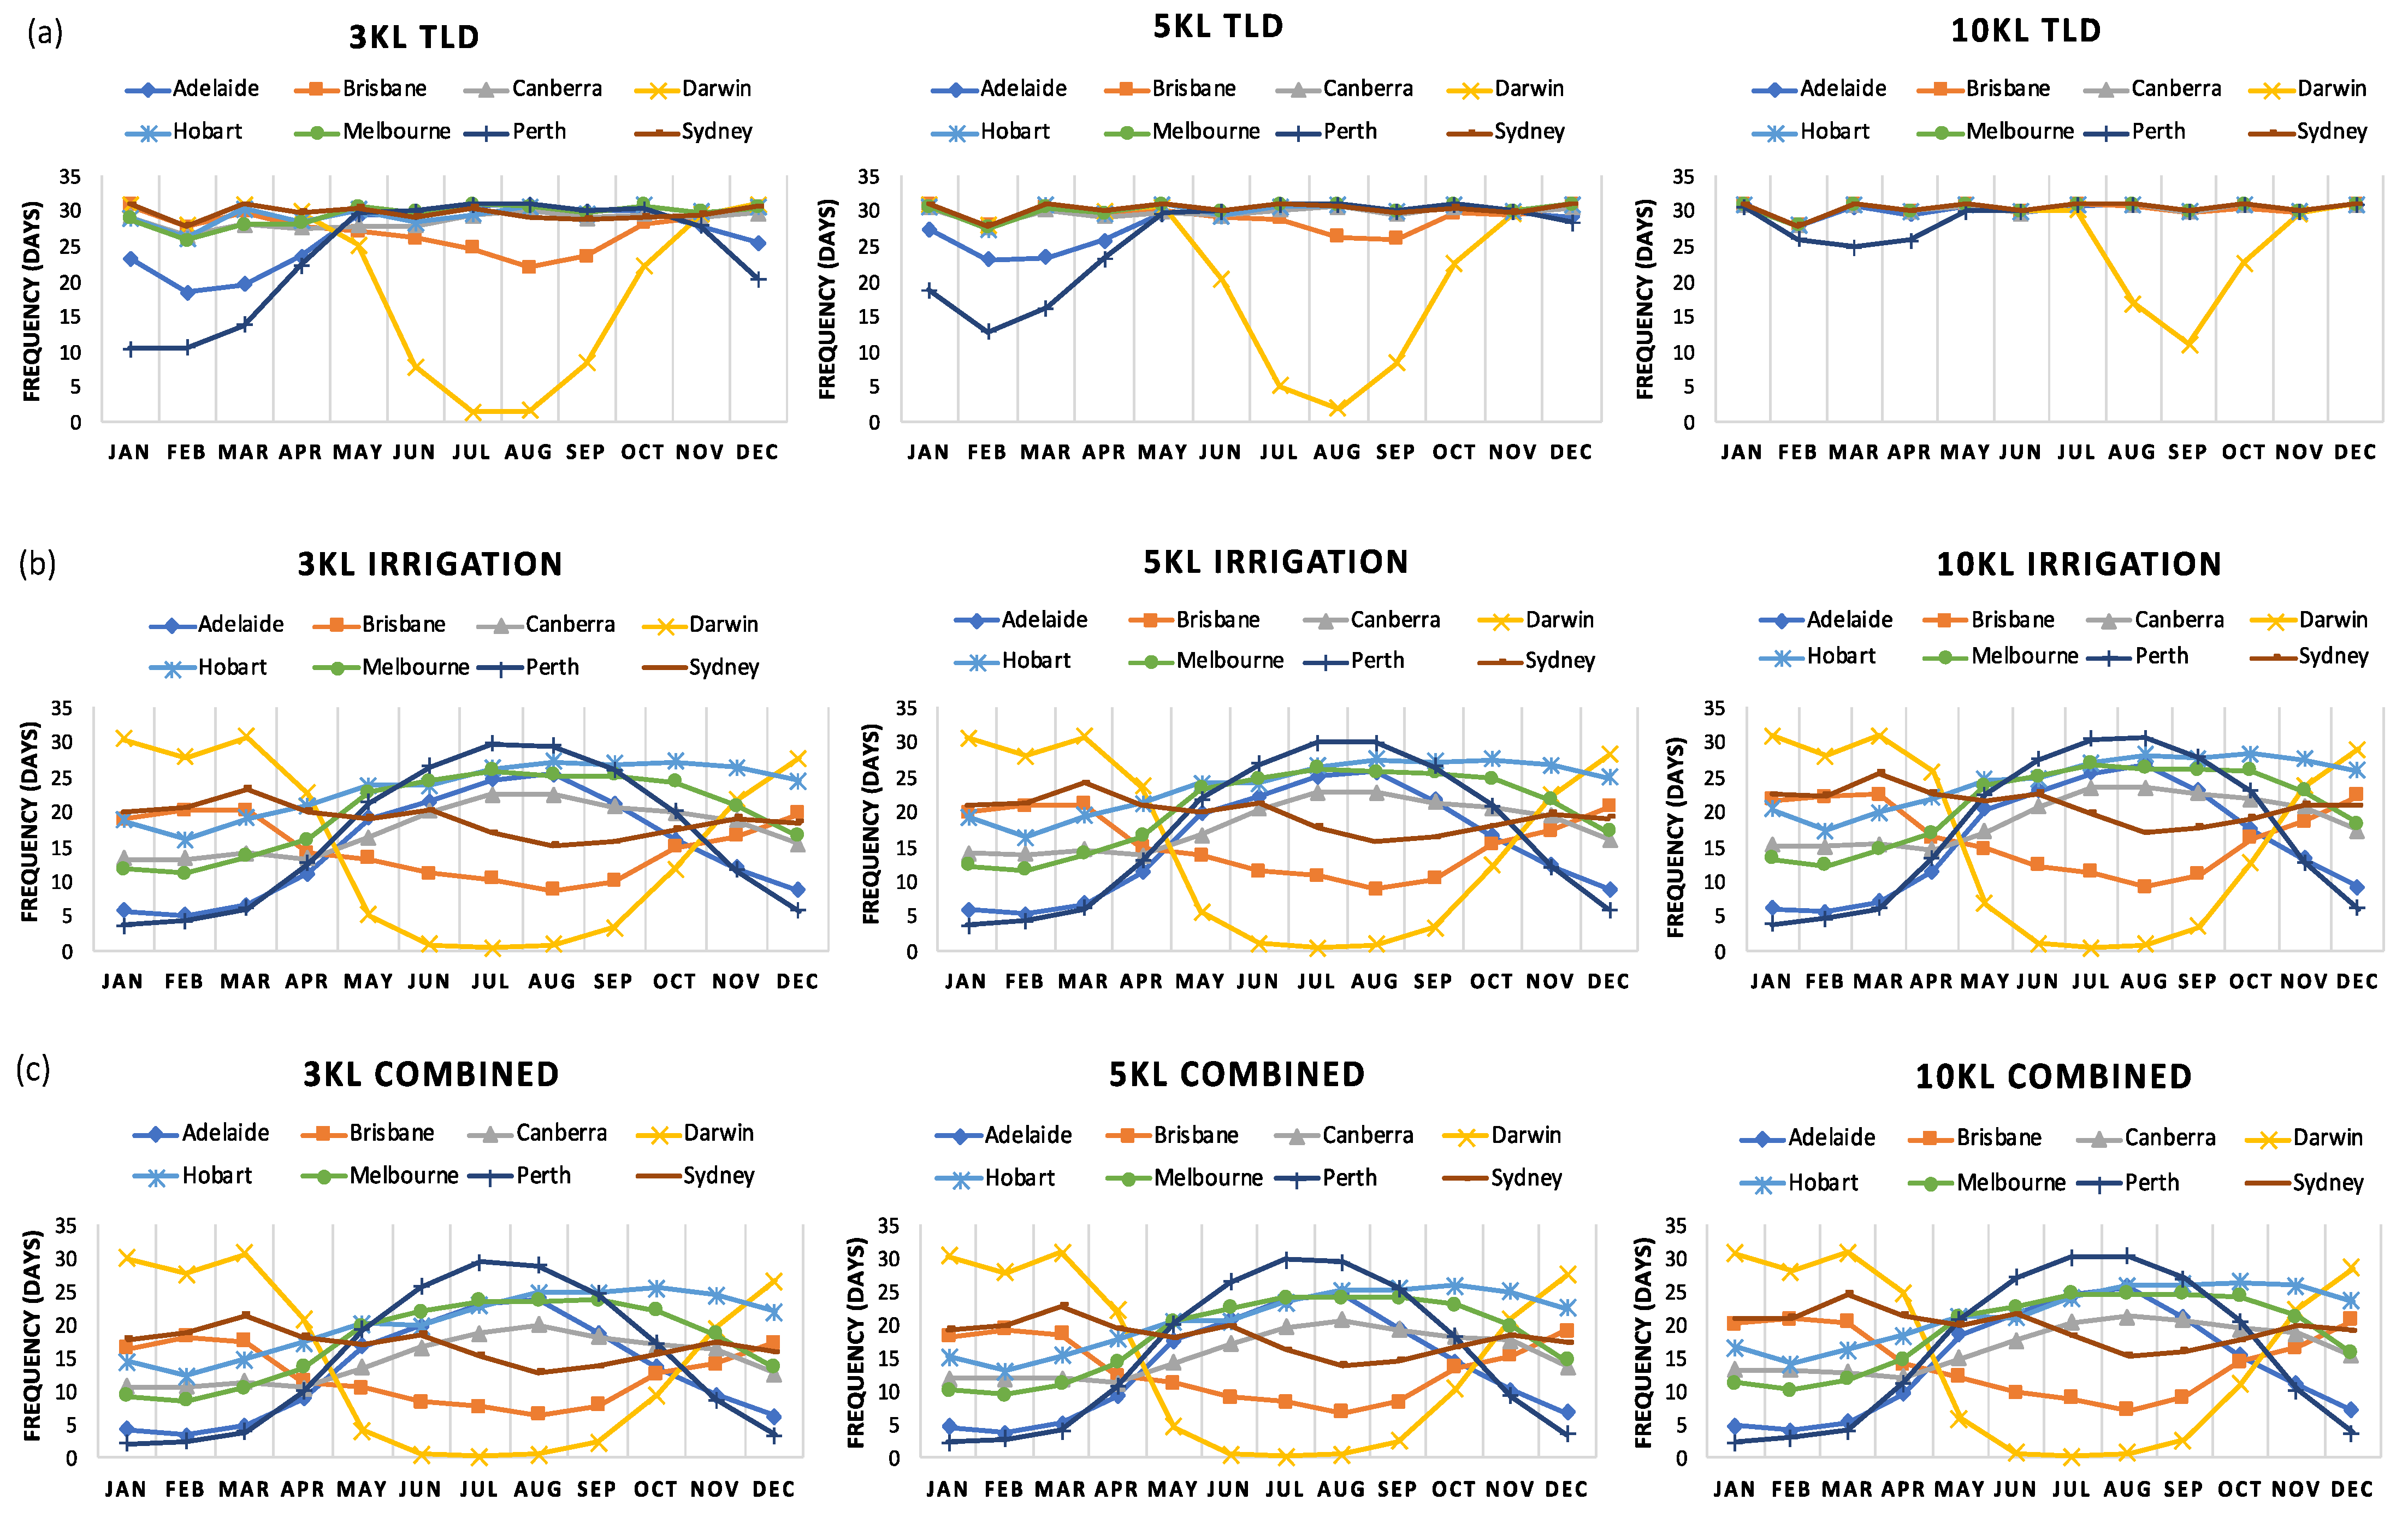
4.4. Monthly Water Demand Analysis
4.5. Economic Analysis
5. Conclusions
Author Contributions
Funding
Institutional Review Board Statement
Informed Consent Statement
Data Availability Statement
Acknowledgments
Conflicts of Interest
References
- Alam Imteaz, M.; Rahman, A.; Ahsan, A. Reliability analysis of rainwater tanks: A comparison between South-East and Central Melbourne. Resour. Conserv. Recycl. 2012, 66, 1–7. [Google Scholar] [CrossRef]
- Australian Bureau of Statistics (ABS). Australia’s Climate. Year Book of Australia. Catalogue Number 1301. 2012. Available online: https://www.abs.gov.au/ausstats/[email protected]/mf/1301.0 (accessed on 22 June 2021).
- Tam, V.W.; Tam, L.; Zeng, S. Cost effectiveness and tradeoff on the use of rainwater tank: An empirical study in Australian residential decision-making. Resour. Conserv. Recycl. 2010, 54, 178–186. [Google Scholar] [CrossRef]
- Zhang, S.; Zhang, J.; Yue, T.; Jing, X. Impacts of climate change on urban rainwater harvesting systems. Sci. Total. Environ. 2019, 665, 262–274. [Google Scholar] [CrossRef]
- Haque, M.; Rahman, A.; Samali, B. Evaluation of climate change impacts on rainwater harvesting. J. Clean. Prod. 2016, 137, 60–69. [Google Scholar] [CrossRef]
- Devkota, J.; Schlachter, H.; Apul, D. Life cycle based evaluation of harvested rainwater use in toilets and for irrigation. J. Clean. Prod. 2015, 95, 311–321. [Google Scholar] [CrossRef]
- Sepehri, M.; Malekinezhad, H.; Ildoromi, A.R.; Talebi, A.; Hosseini, S.Z. Studying the effect of rain water harvesting from roof surfaces on runoff and household consumption reduction. Sustain. Cities Soc. 2018, 43, 317–324. [Google Scholar] [CrossRef]
- Australian Bureau of Statistics (ABS). Environmental Issues. Catalogue Number 4602.0.55.003. 2013. Available online: https://www.abs.gov.au/ausstats/[email protected]/Lookup/4602.0.55.003main±features3Mar%202013 (accessed on 22 June 2021).
- Zhang, Y.; Grant, A.; Sharma, A.; Chen, D.; Chen, L. Alternative Water Resources for Rural Residential Development in Western Australia. Water Resour. Manag. 2010, 24, 25–36. [Google Scholar] [CrossRef]
- Imteaz, M.A.; Ahsan, A.; Naser, J.; Rahman, A. Reliability analysis of rainwater tanks in Melbourne using daily water balance model. Resour. Conserv. Recycl. 2011, 56, 80–86. [Google Scholar] [CrossRef]
- Rahman, A.; Keane, J.; Imteaz, M.A. Rainwater harvesting in Greater Sydney: Water savings, reliability and economic benefits. Resour. Conserv. Recycl. 2012, 61, 16–21. [Google Scholar] [CrossRef]
- Imteaz, M.A.; Ahsan, A.; Shanableh, A. Reliability analysis of rainwater tanks using daily water balance model: Variations within a large city. Resour. Conserv. Recycl. 2013, 77, 37–43. [Google Scholar] [CrossRef]
- Karim, M.R.; Bashar, M.Z.I.; Imteaz, M.A. Reliability and economic analysis of urban rainwater harvesting in a megacity in Bangladesh. Resour. Conserv. Recycl. 2015, 104, 61–67. [Google Scholar] [CrossRef]
- Campisano, A.; Butler, D.; Ward, S.; Burns, M.J.; Friedler, E.; DeBusk, K.; Fisher-Jeffes, L.N.; Ghisi, E.; Rahman, A.; Furumai, H.; et al. Urban rainwater harvesting systems: Research, implementation and future perspectives. Water Res. 2017, 115, 195–209. [Google Scholar] [CrossRef]
- Vaes, G.; Berlamont, J. The effect of rainwater storage tanks on design storms. Urban Water 2001, 3, 303–307. [Google Scholar] [CrossRef]
- Basinger, M.; Montalto, F.; Lall, U. A rainwater harvesting system reliability model based on nonparametric stochastic rainfall generator. J. Hydrol. 2010, 392, 105–118. [Google Scholar] [CrossRef]
- Shokati, H.; Kouchakzadeh, M.; Fashi, F.H. Assessing reliability of rainwater harvesting systems for meeting water demands in different climatic zones of Iran. Model. Earth Syst. Environ. 2020, 6, 109–114. [Google Scholar] [CrossRef]
- Villarreal, E.L.; Dixon, A. Analysis of a rainwater collection system for domestic water supply in Ringdansen, Norrköping, Sweden. Build. Environ. 2005, 40, 1174–1184. [Google Scholar] [CrossRef]
- Fewkes, A.; Butler, D. Simulating the performance of rainwater collection and reuse systems using behavioural models. Build. Serv. Eng. Res. Technol. 2000, 21, 99–106. [Google Scholar] [CrossRef]
- Liaw, C.-H.; Tsai, Y.-L. Optimum storage volume of rooftop rain water harvesting systems for domestic use. JAWRA J. Am. Water Resour. Assoc. 2004, 40, 901–912. [Google Scholar] [CrossRef]
- Hajani, E.; Rahman, A. Rainwater utilization from roof catchments in arid regions: A case study for Australia. J. Arid. Environ. 2014, 111, 35–41. [Google Scholar] [CrossRef]
- Souza, E.L.; Ghisi, E. Potable Water Savings by Using Rainwater for Non-Potable Uses in Houses. Water 2012, 4, 607–628. [Google Scholar] [CrossRef]
- Ahiablame, L.; Engel, B.; Venort, T. Improving Water Supply Systems for Domestic Uses in Urban Togo: The Case of a Suburb in Lomé. Water 2012, 4, 123–134. [Google Scholar] [CrossRef] [Green Version]
- Imteaz, M.A.; Adeboye, O.B.; Rayburg, S.; Shanableh, A. Rainwater harvesting potential for southwest Nigeria using daily water balance model. Resour. Conserv. Recycl. 2012, 62, 51–55. [Google Scholar] [CrossRef]
- Kahinda, J.-M.M.; Taigbenu, A.E.; Boroto, J.R. Domestic rainwater harvesting to improve water supply in rural South Africa. Phys. Chem. Earth, Parts A/B/C 2007, 32, 1050–1057. [Google Scholar] [CrossRef]
- Ndomba, P.M.; Wambura, F.J. Reliability of rainwater harvesting systems in suburbs. A case study of Changanyikeni in Dar es Salaam, Tanzania. Nile Basin Water Sci. Eng. 2010, 3, 72–85. [Google Scholar]
- Ali, S.; Zhang, S.; Yue, T. Environmental and economic assessment of rainwater harvesting systems under five climatic conditions of Pakistan. J. Clean. Prod. 2020, 259, 120829. [Google Scholar] [CrossRef]
- Abdulla, F.A.; Al-Shareef, A. Roof rainwater harvesting systems for household water supply in Jordan. Desalination 2009, 243, 195–207. [Google Scholar] [CrossRef]
- Bashar, M.Z.I.; Karim, M.R.; Imteaz, M.A. Reliability and economic analysis of urban rainwater harvesting: A comparative study within six major cities of Bangladesh. Resour. Conserv. Recycl. 2018, 133, 146–154. [Google Scholar] [CrossRef]
- Hafizi Lani, N.; Yusop, Z.; Syafiuddin, A. A review of rainwater harvesting in Malaysia: Prospects and challenges. Water 2018, 10, 506. [Google Scholar] [CrossRef] [Green Version]
- Cheng, C.; Liao, M. Regional rainfall level zoning for rainwater harvesting systems in northern Taiwan. Resour. Conserv. Recycl. 2009, 53, 421–428. [Google Scholar] [CrossRef]
- Jing, X.; Zhang, S.; Zhang, J.; Wang, Y.; Wang, Y. Assessing efficiency and economic viability of rainwater harvesting systems for meeting non-potable water demands in four climatic zones of China. Resour. Conserv. Recycl. 2017, 126, 74–85. [Google Scholar] [CrossRef]
- Alim, A.; Rahman, A.; Tao, Z.; Samali, B.; Khan, M.M.; Shirin, S. Feasibility analysis of a small-scale rainwater harvesting system for drinking water production at Werrington, New South Wales, Australia. J. Clean. Prod. 2020, 270, 122437. [Google Scholar] [CrossRef]
- Eroksuz, E.; Rahman, A. Rainwater tanks in multi-unit buildings: A case study for three Australian cities. Resour. Conserv. Recycl. 2010, 54, 1449–1452. [Google Scholar] [CrossRef]
- Campisano, A.; Modica, C. Optimal sizing of storage tanks for domestic rainwater harvesting in Sicily. Resour. Conserv. Recycl. 2012, 63, 9–16. [Google Scholar] [CrossRef]
- Farreny, R.; Morales-Pinzón, T.; Guisasola, A.; Tayà, C.; Rieradevall, J.; Gabarrell, X. Roof selection for rainwater harvesting: Quantity and quality assessments in Spain. Water Res. 2011, 45, 3245–3254. [Google Scholar] [CrossRef] [PubMed]
- Matos, C.; Bentes, I.; Santos, C.; Alam Imteaz, M.; Pereira, S. Economic Analysis of a Rainwater Harvesting System in a Commercial Building. Water Resour. Manag. 2015, 29, 3971–3986. [Google Scholar] [CrossRef]
- Notaro, V.; Liuzzo, L.; Freni, G. Reliability Analysis of Rainwater Harvesting Systems in Southern Italy. Procedia Eng. 2016, 162, 373–380. [Google Scholar] [CrossRef] [Green Version]
- Sazakli, E.; Alexopoulos, A.; Leotsinidis, M. Rainwater harvesting, quality assessment and utilization in Kefalonia Island, Greece. Water Res. 2007, 41, 2039–2047. [Google Scholar] [CrossRef]
- Roebuck, R.M.; Oltean-Dumbrava, C.; Tait, S. Whole life cost performance of domestic rainwater harvesting systems in the United Kingdom. Water Environ. J. 2011, 25, 355–365. [Google Scholar] [CrossRef]
- Dallman, S.; Chaudhry, A.M.; Muleta, M.K.; Lee, J. Is Rainwater Harvesting Worthwhile? A Benefit–Cost Analysis. J. Water Resour. Plan. Manag. 2021, 147, 04021011. [Google Scholar] [CrossRef]
- Ghisi, E.; Bressan, D.L.; Martini, M. Rainwater tank capacity and potential for potable water savings by using rainwater in the residential sector of southeastern Brazil. Build. Environ. 2007, 42, 1654–1666. [Google Scholar] [CrossRef]
- Jones, M.P.; Hunt, W.F. Performance of rainwater harvesting systems in the southeastern United States. Resour. Conserv. Recycl. 2010, 54, 623–629. [Google Scholar] [CrossRef]
- Lawrence, D.; Lopes, V.L. Reliability analysis of urban rainwater harvesting for three Texas cities. J. Urban Environ. Eng. 2016, 10, 124–134. [Google Scholar] [CrossRef]
- Sample, D.J.; Liu, J.; Wang, S. Evaluating the Dual Benefits of Rainwater Harvesting Systems Using Reliability Analysis. J. Hydrol. Eng. 2013, 18, 1310–1321. [Google Scholar] [CrossRef]
- Amos, C.C.; Rahman, A.; Gathenya, J.M. Economic analysis of rainwater harvesting systems comparing developing and developed countries: A case study of Australia and Kenya. J. Clean. Prod. 2018, 172, 196–207. [Google Scholar] [CrossRef]
- Khan, Z.; Alim, M.A.; Rahman, M.M.; Rahman, A. A continental scale evaluation of rainwater harvesting in Australia. Resour. Conserv. Recycl. 2021, 167, 105378. [Google Scholar] [CrossRef]
- Palla, A.; Gnecco, I.; Lanza, L. Non-dimensional design parameters and performance assessment of rainwater harvesting systems. J. Hydrol. 2011, 401, 65–76. [Google Scholar] [CrossRef]
- Hajani, E.; Rahman, A. Reliability and Cost Analysis of a Rainwater Harvesting System in Peri-Urban Regions of Greater Sydney, Australia. Water 2014, 6, 945–960. [Google Scholar] [CrossRef] [Green Version]
- Mehrabadi, M.H.R.; Saghafian, B.; Fashi, F.H. Assessment of residential rainwater harvesting efficiency for meeting non-potable water demands in three climate conditions. Resour. Conserv. Recycl. 2013, 73, 86–93. [Google Scholar] [CrossRef]


| Location | Lat. | Long. | Station No. | Station Name | Duration | Data Length (years) | Average Annual Rainfall (mm) |
|---|---|---|---|---|---|---|---|
| Adelaide, SA | −34.92 | 138.59 | 023011 | North Adelaide | 1945–2019 | 75 | 510 |
| Brisbane, QLD | −27.54 | 152.33 | 040082 | University of Queensland Gatton | 1945–2019 | 75 | 753 |
| Canberra, ACT | −35.26 | 149.14 | 070000 | Ainslie Tyson St | 1945–2019 | 75 | 648 |
| Darwin, NT | −12.42 | 130.89 | 014015 | Darwin Airport | 1945–2019 | 75 | 1574 |
| Hobart, TAS | −42.89 | 147.33 | 094029 | Hobart (Ellerslie Road) | 1945–2019 | 75 | 598 |
| Melbourne, VIC | −37.79 | 144.91 | 086039 | Flemington Racecourse | 1945–2019 | 75 | 592 |
| Perth, WA | −31.93 | 115.98 | 009021 | Perth Airport | 1945–2019 | 75 | 761 |
| Sydney, NSW | −33.87 | 151.22 | 066006 | Sydney Botanic Gardens | 1945–2019 | 75 | 1176 |
| City | Dry | Average | Wet | |||||||||
|---|---|---|---|---|---|---|---|---|---|---|---|---|
| Year | Rainfall (mm) | Reliability (%) | Water Savings (m3) | Year | Rainfall (mm) | Reliability (%) | Water Savings (m3) | Year | Rainfall (mm) | Reliability (%) | Water Savings (m3) | |
| Adelaide | 2006 | 270 | 28 | 39 | 1987 | 510 | 34 | 78 | 1992 | 832 | 54 | 104 |
| Brisbane | 2019 | 230 | 22 | 28 | 1966 | 753 | 41 | 106 | 1950 | 1241 | 67 | 99 |
| Canberra | 1957 | 295 | 25 | 44 | 1988 | 648 | 55 | 80 | 1950 | 1066 | 64 | 105 |
| Darwin | 1985 | 934 | 43 | 67 | 1947 | 1574 | 51 | 84 | 1974 | 2244 | 60 | 57 |
| Hobart | 2006 | 347 | 55 | 55 | 1983 | 598 | 51 | 75 | 1946 | 1004 | 91 | 57 |
| Melbourne | 1997 | 308 | 28 | 44 | 2004 | 592 | 76 | 63 | 1992 | 871 | 84 | 67 |
| Perth | 2006 | 480 | 43 | 53 | 1962 | 761 | 54 | 36 | 1955 | 1165 | 63 | 52 |
| Sydney | 1957 | 620 | 42 | 76 | 1985 | 1176 | 55 | 133 | 1950 | 1944 | 87 | 120 |
Publisher’s Note: MDPI stays neutral with regard to jurisdictional claims in published maps and institutional affiliations. |
© 2021 by the authors. Licensee MDPI, Basel, Switzerland. This article is an open access article distributed under the terms and conditions of the Creative Commons Attribution (CC BY) license (https://creativecommons.org/licenses/by/4.0/).
Share and Cite
Preeti, P.; Rahman, A. A Case Study on Reliability, Water Demand and Economic Analysis of Rainwater Harvesting in Australian Capital Cities. Water 2021, 13, 2606. https://doi.org/10.3390/w13192606
Preeti P, Rahman A. A Case Study on Reliability, Water Demand and Economic Analysis of Rainwater Harvesting in Australian Capital Cities. Water. 2021; 13(19):2606. https://doi.org/10.3390/w13192606
Chicago/Turabian StylePreeti, Preeti, and Ataur Rahman. 2021. "A Case Study on Reliability, Water Demand and Economic Analysis of Rainwater Harvesting in Australian Capital Cities" Water 13, no. 19: 2606. https://doi.org/10.3390/w13192606