
Nutrient Analysis of Food Waste from Ships’ Greywater in the Baltic Sea


Abstract
:1. Introduction
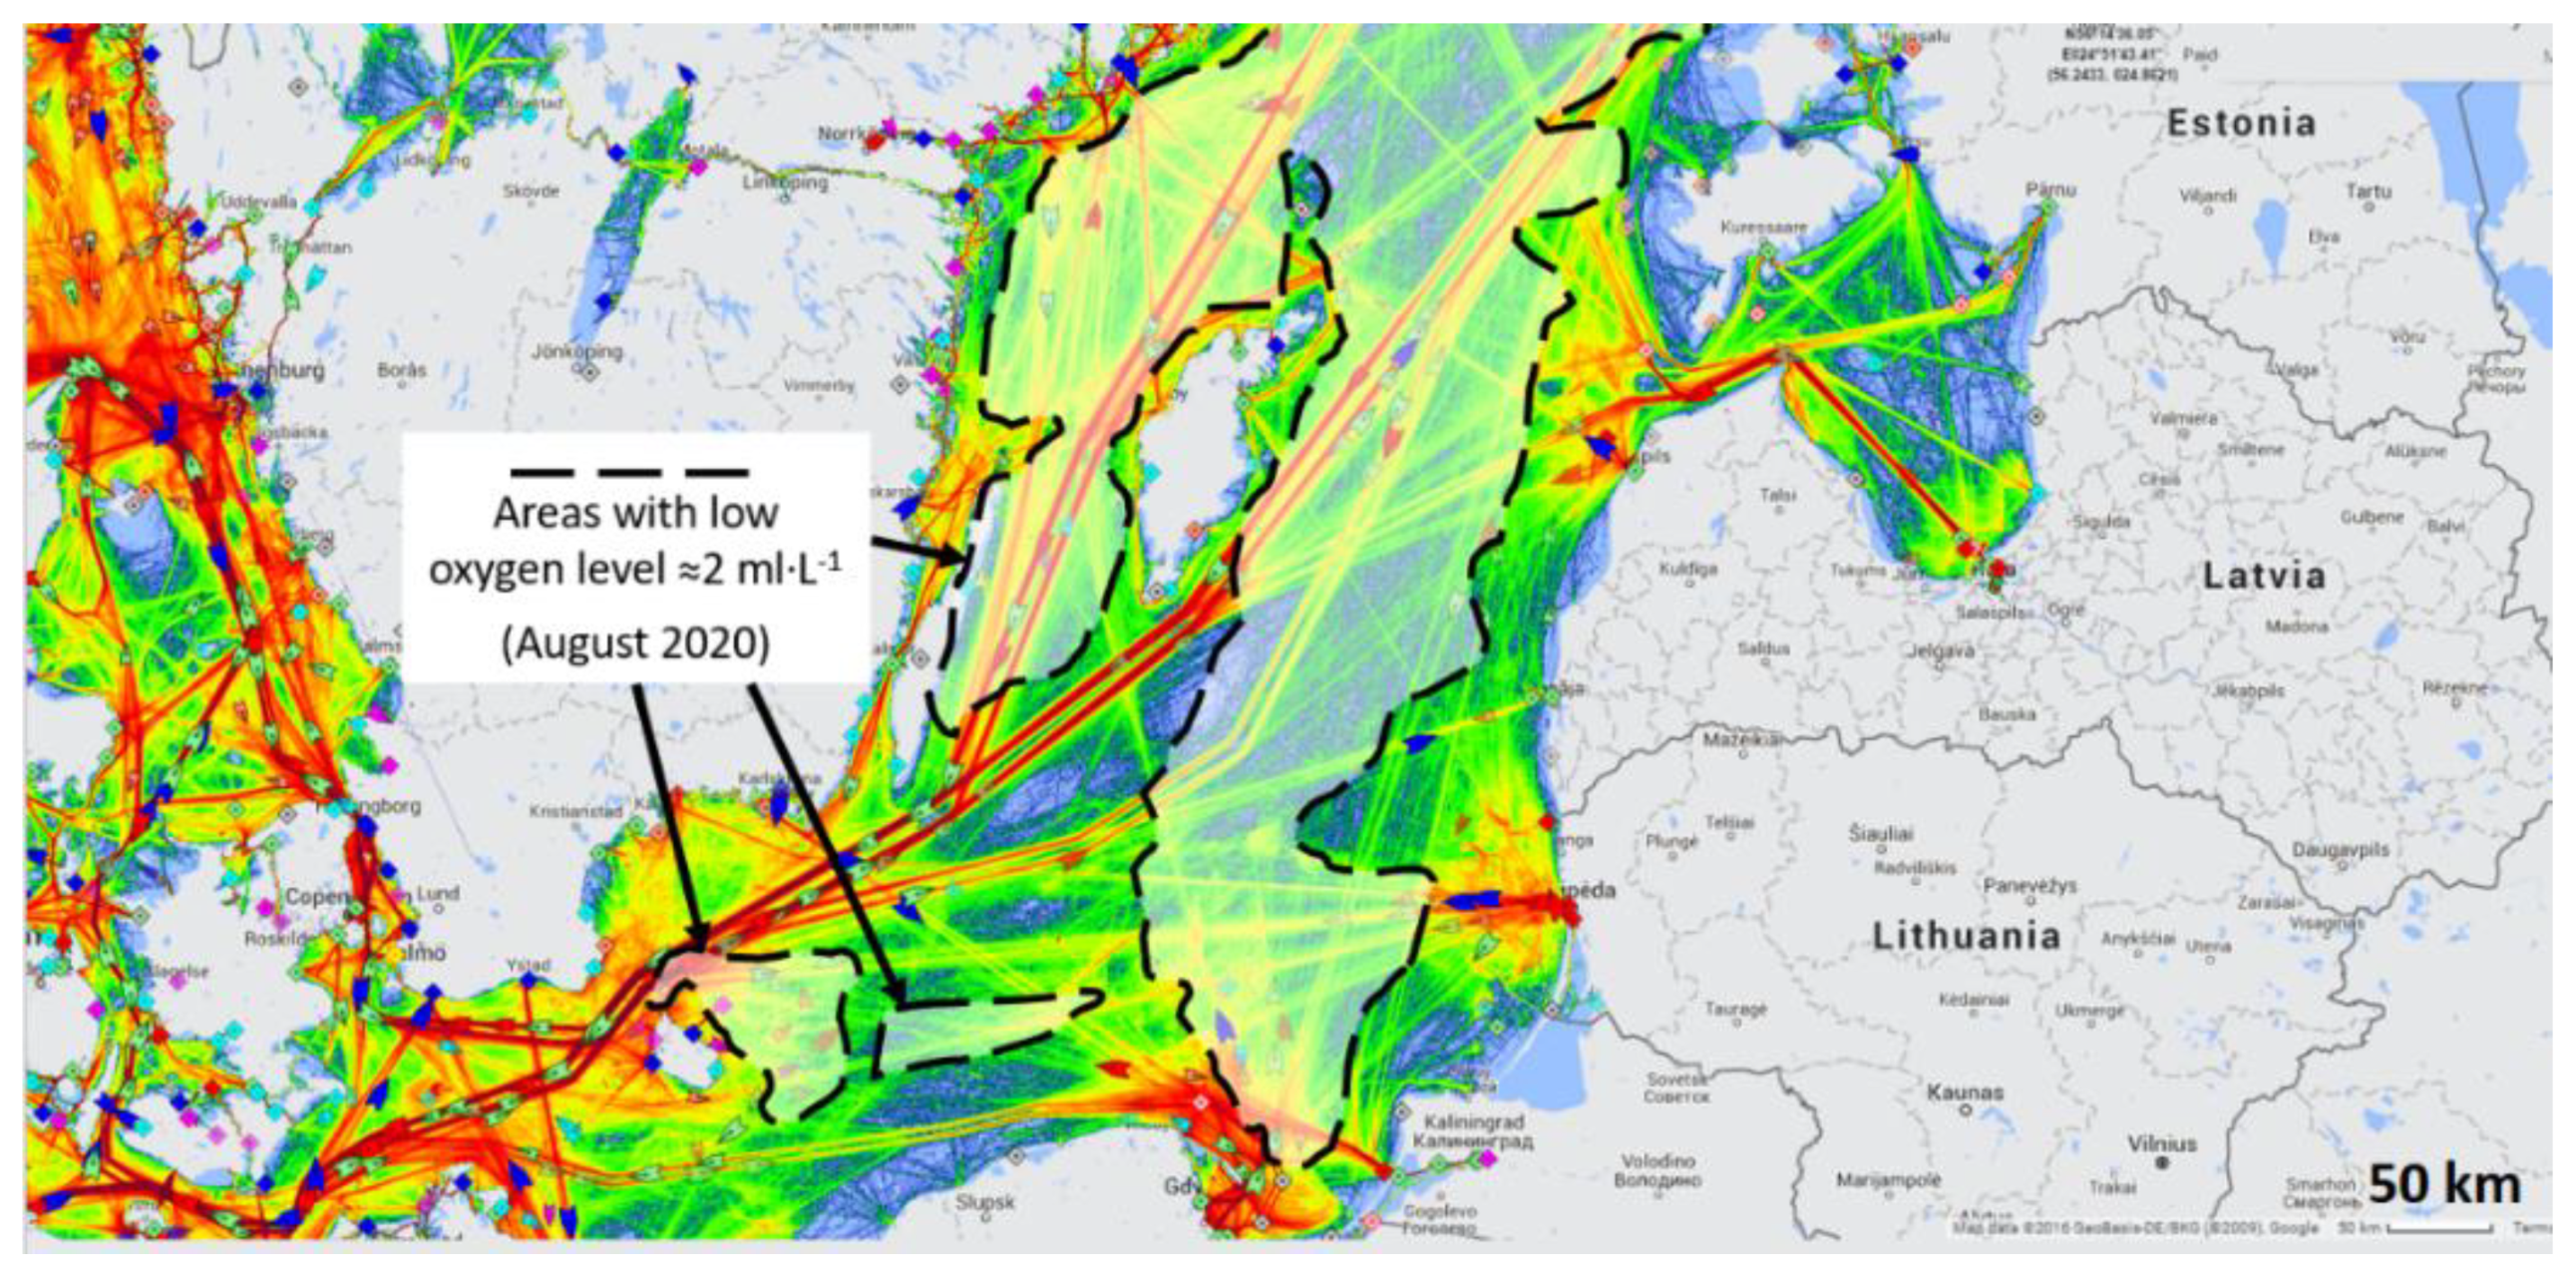
1.1. Problems of Pollution in the Baltic Sea Area
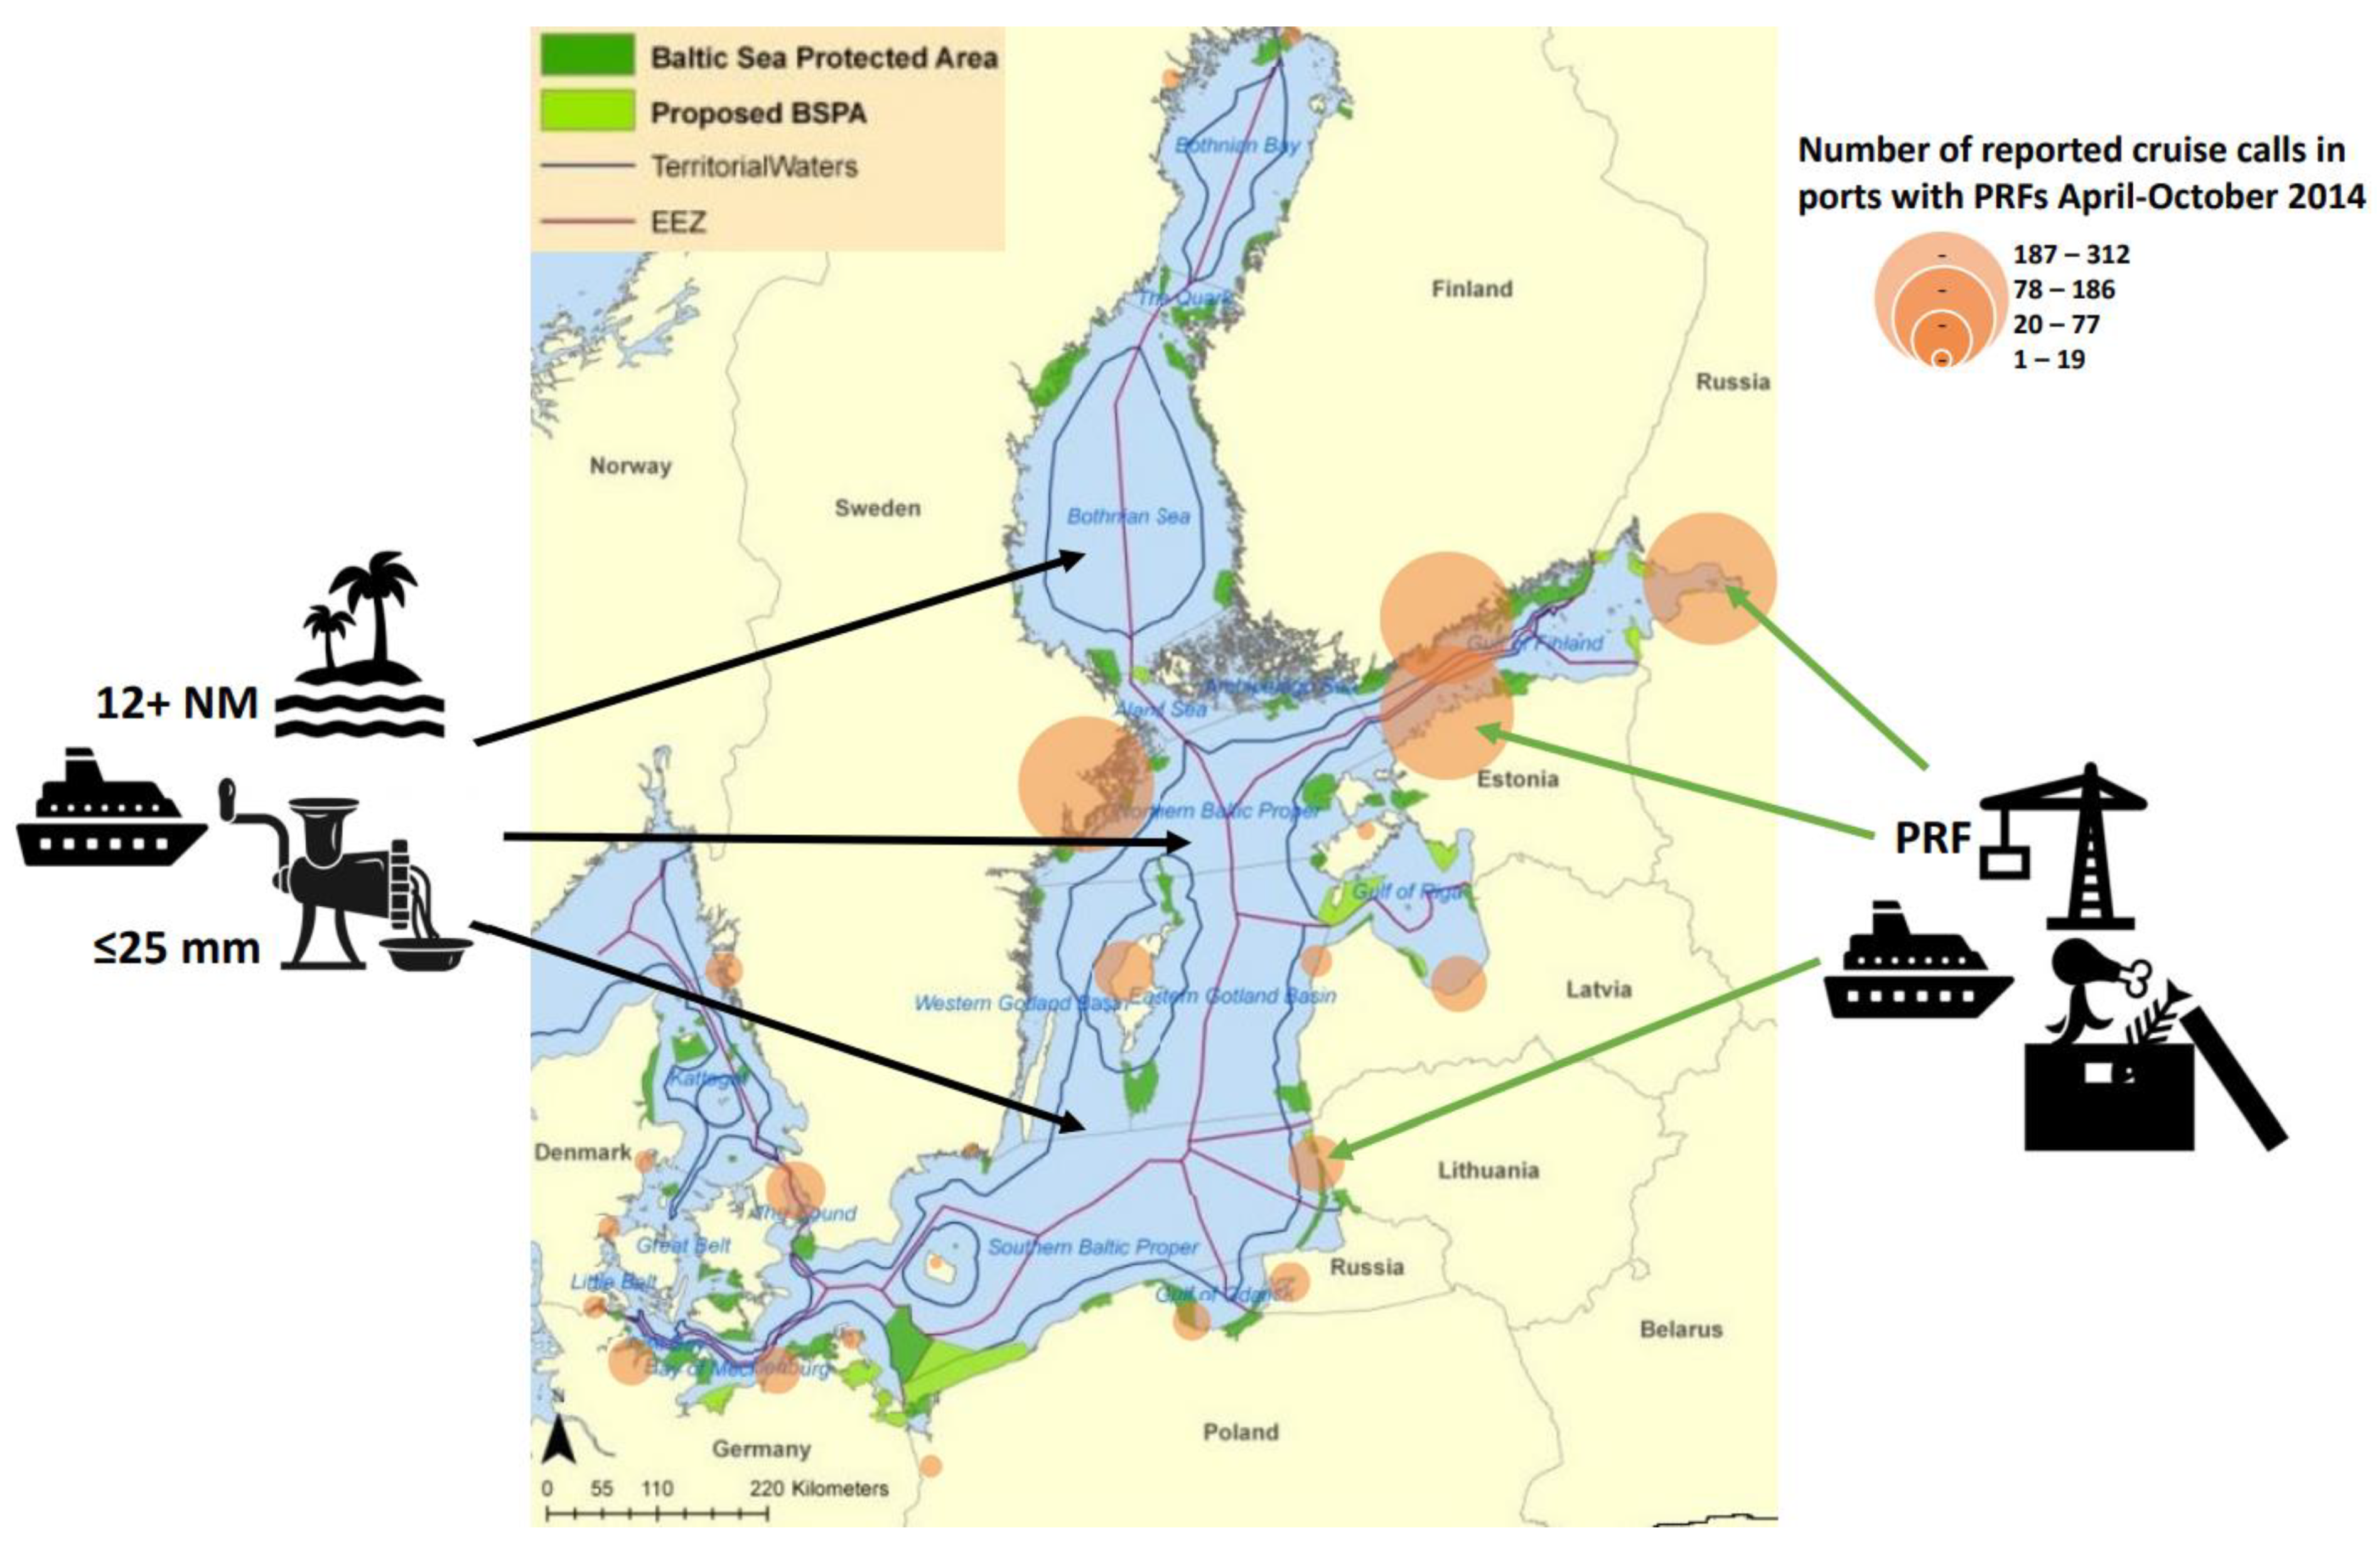
1.2. “Footprint” of the Shipping Vector in the Baltic Sea
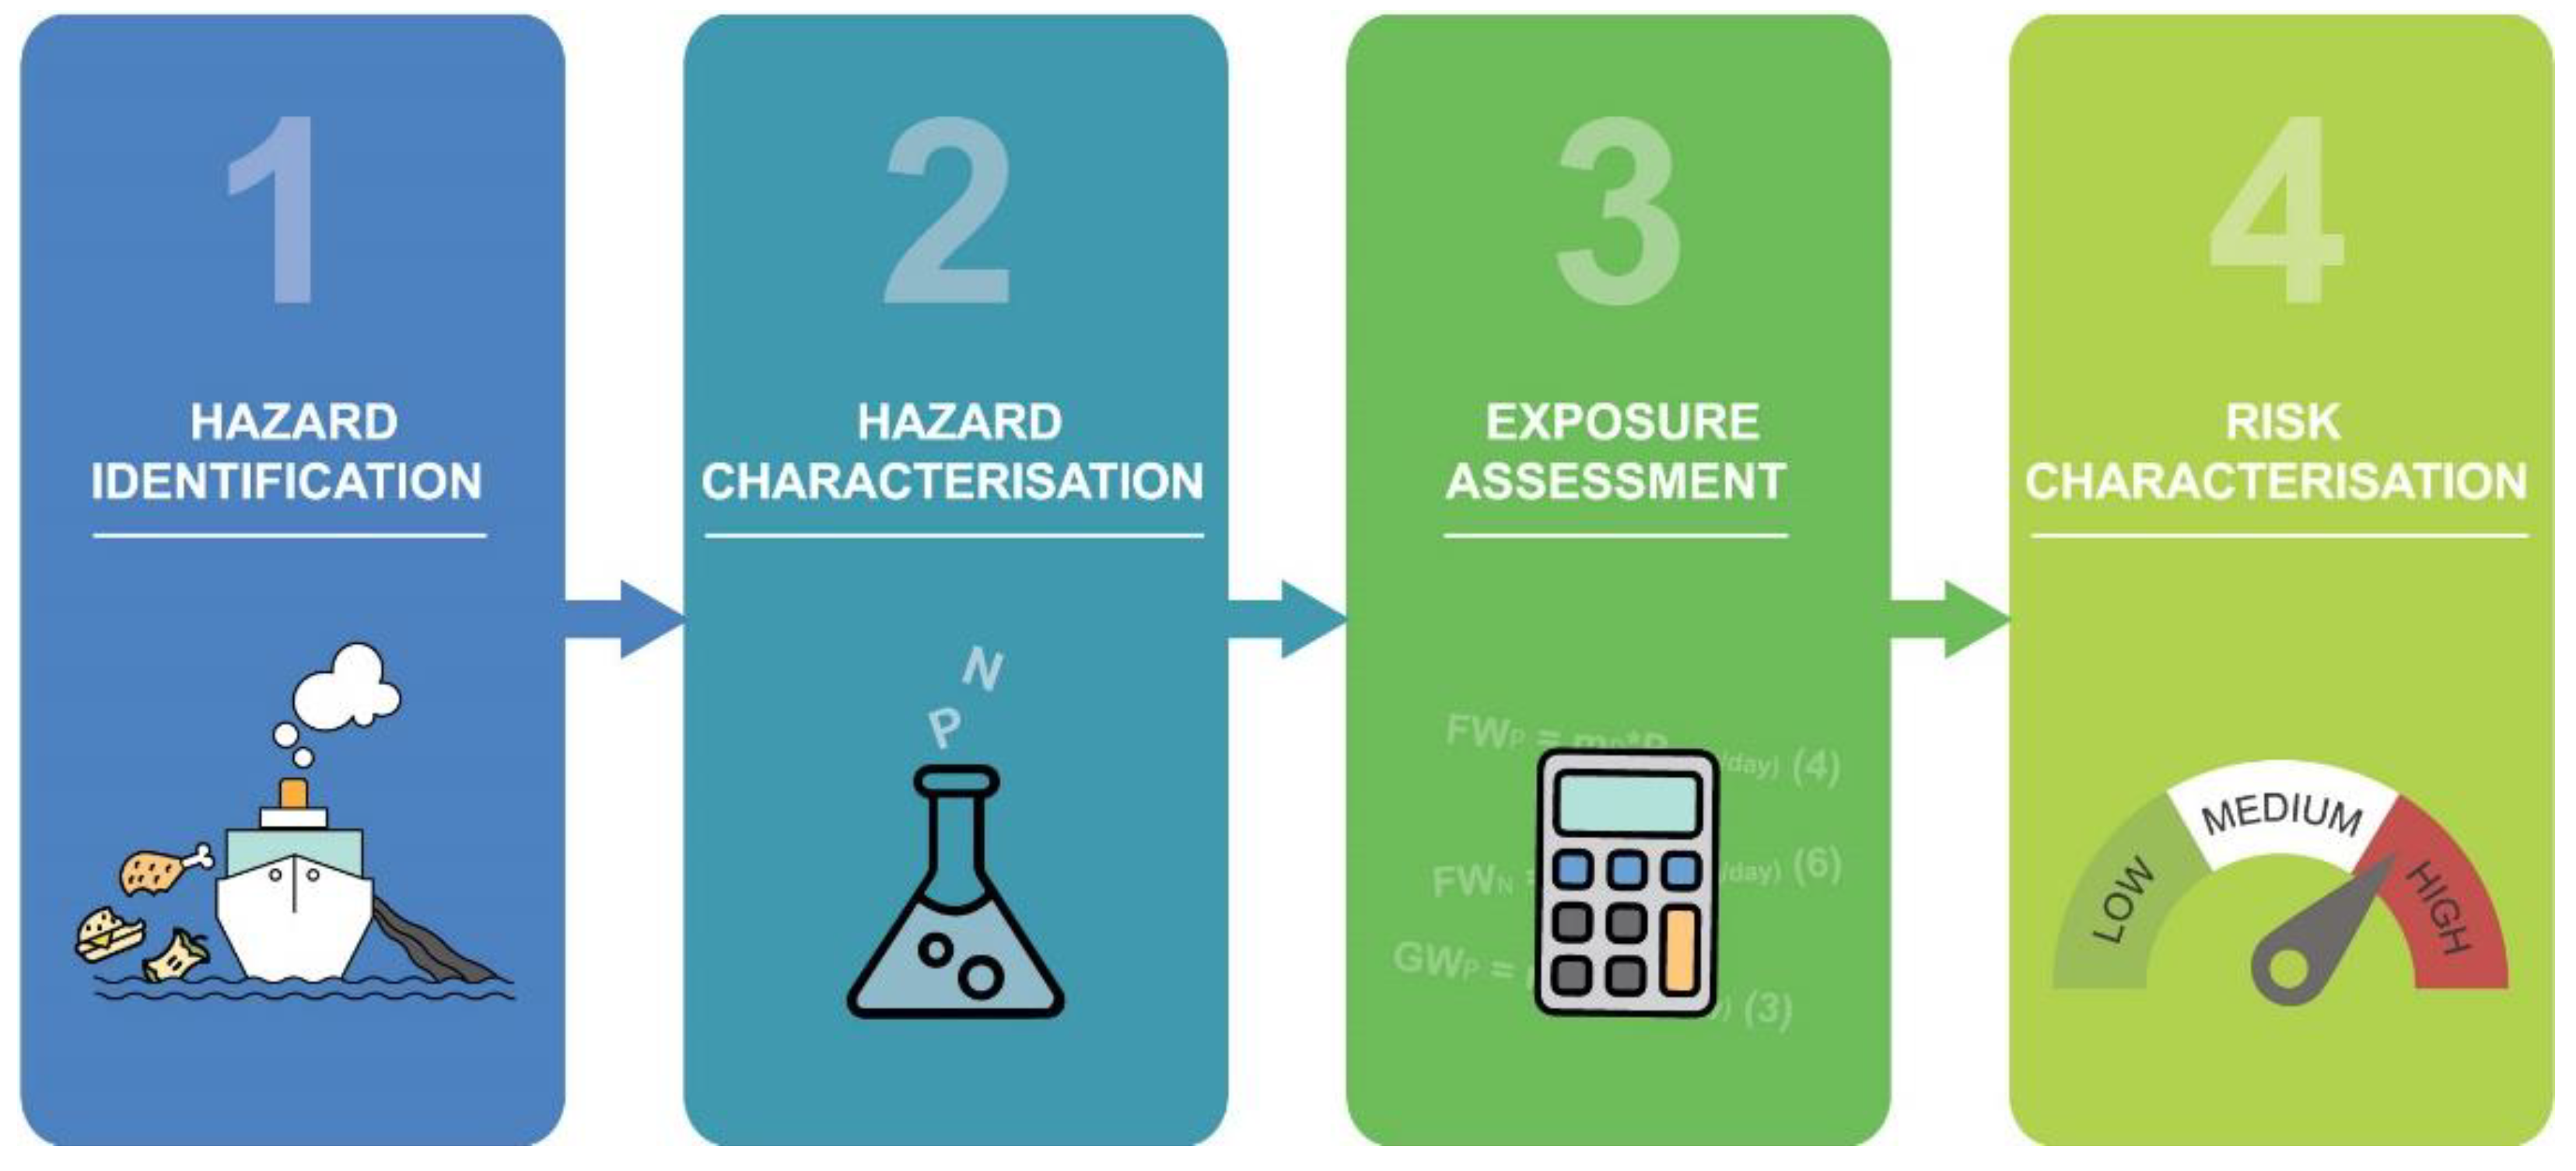
2. Methods
2.1. First Stage—Hazard Identification
2.2. Second Stage—Hazard Characterisation
2.3. Third Stage—Exposure Assessment
2.4. Fourth Stage—Risk Characterisation
3. Results and Discussion
3.1. Identified Hazards
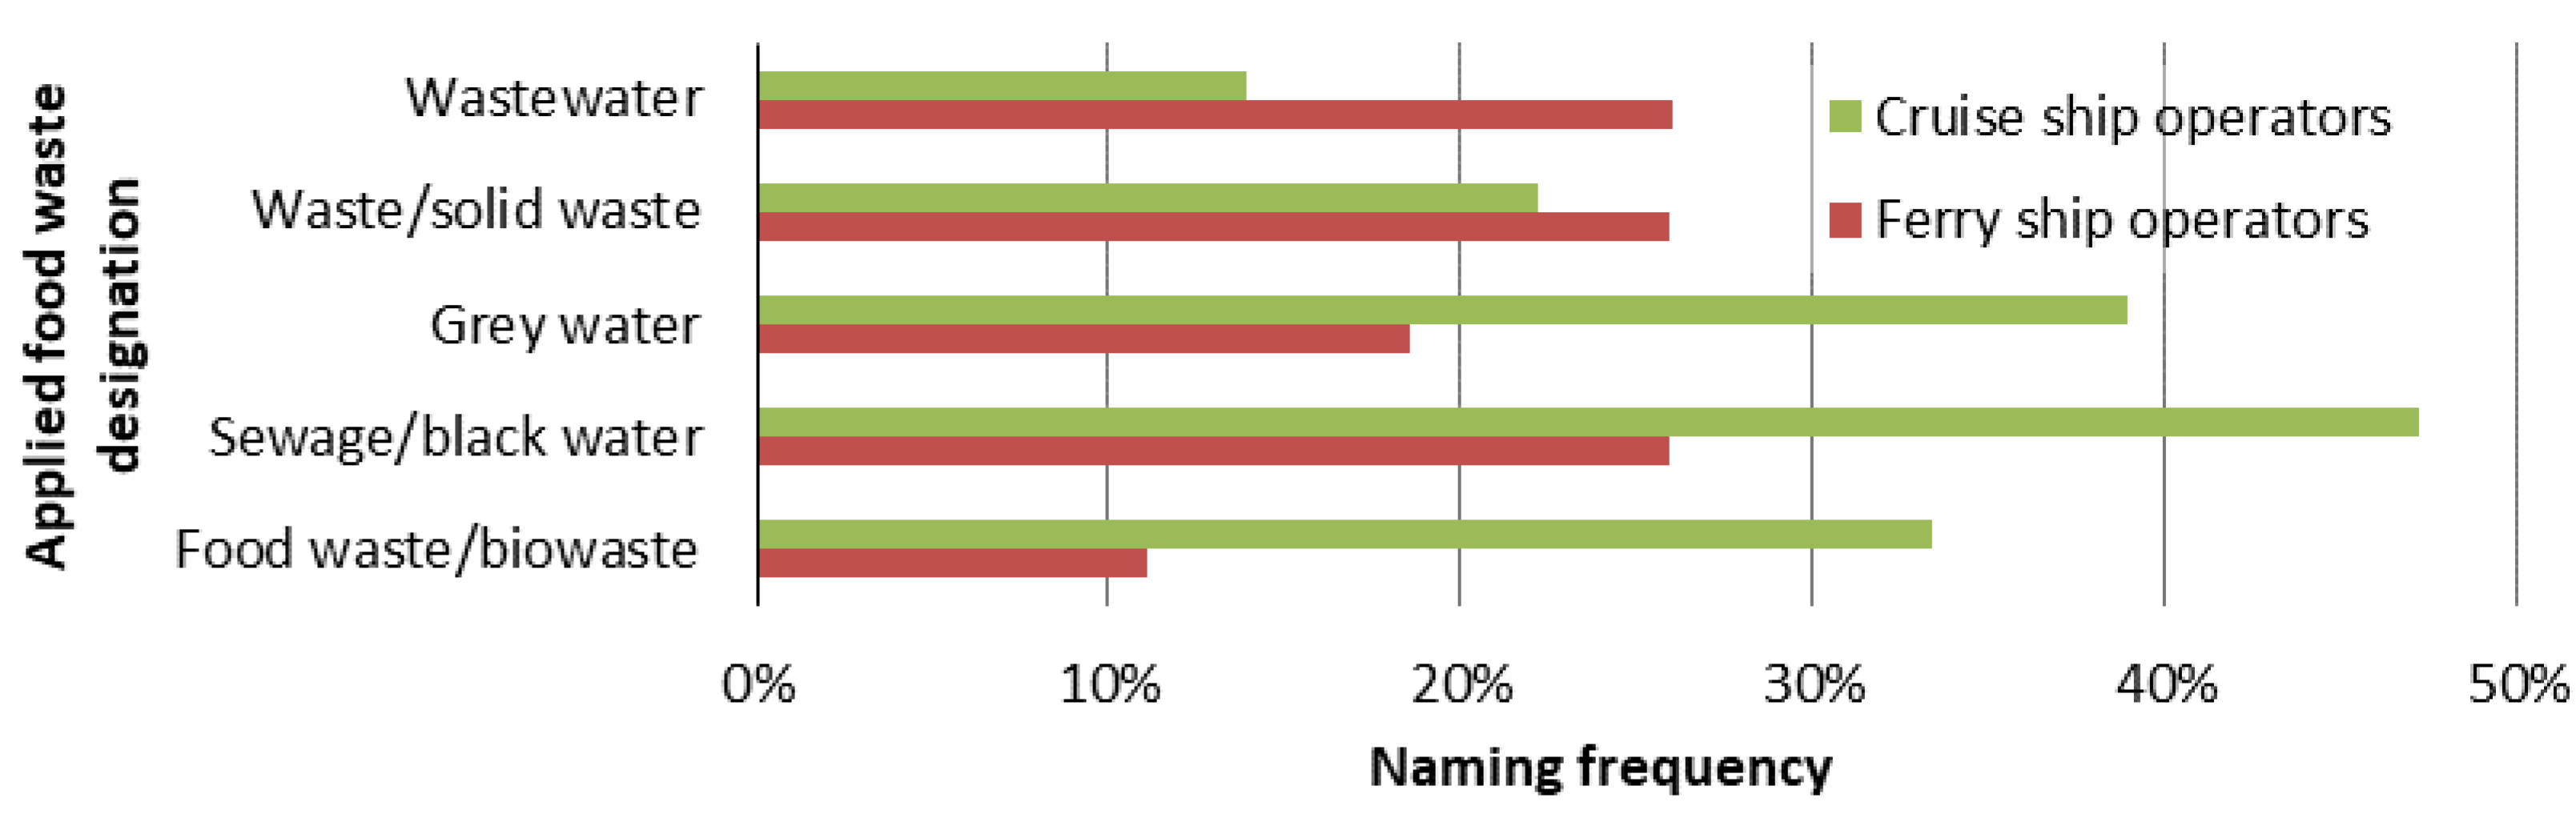
3.1.1. Trends in the Management of Waste from Passenger and Cruise Ships
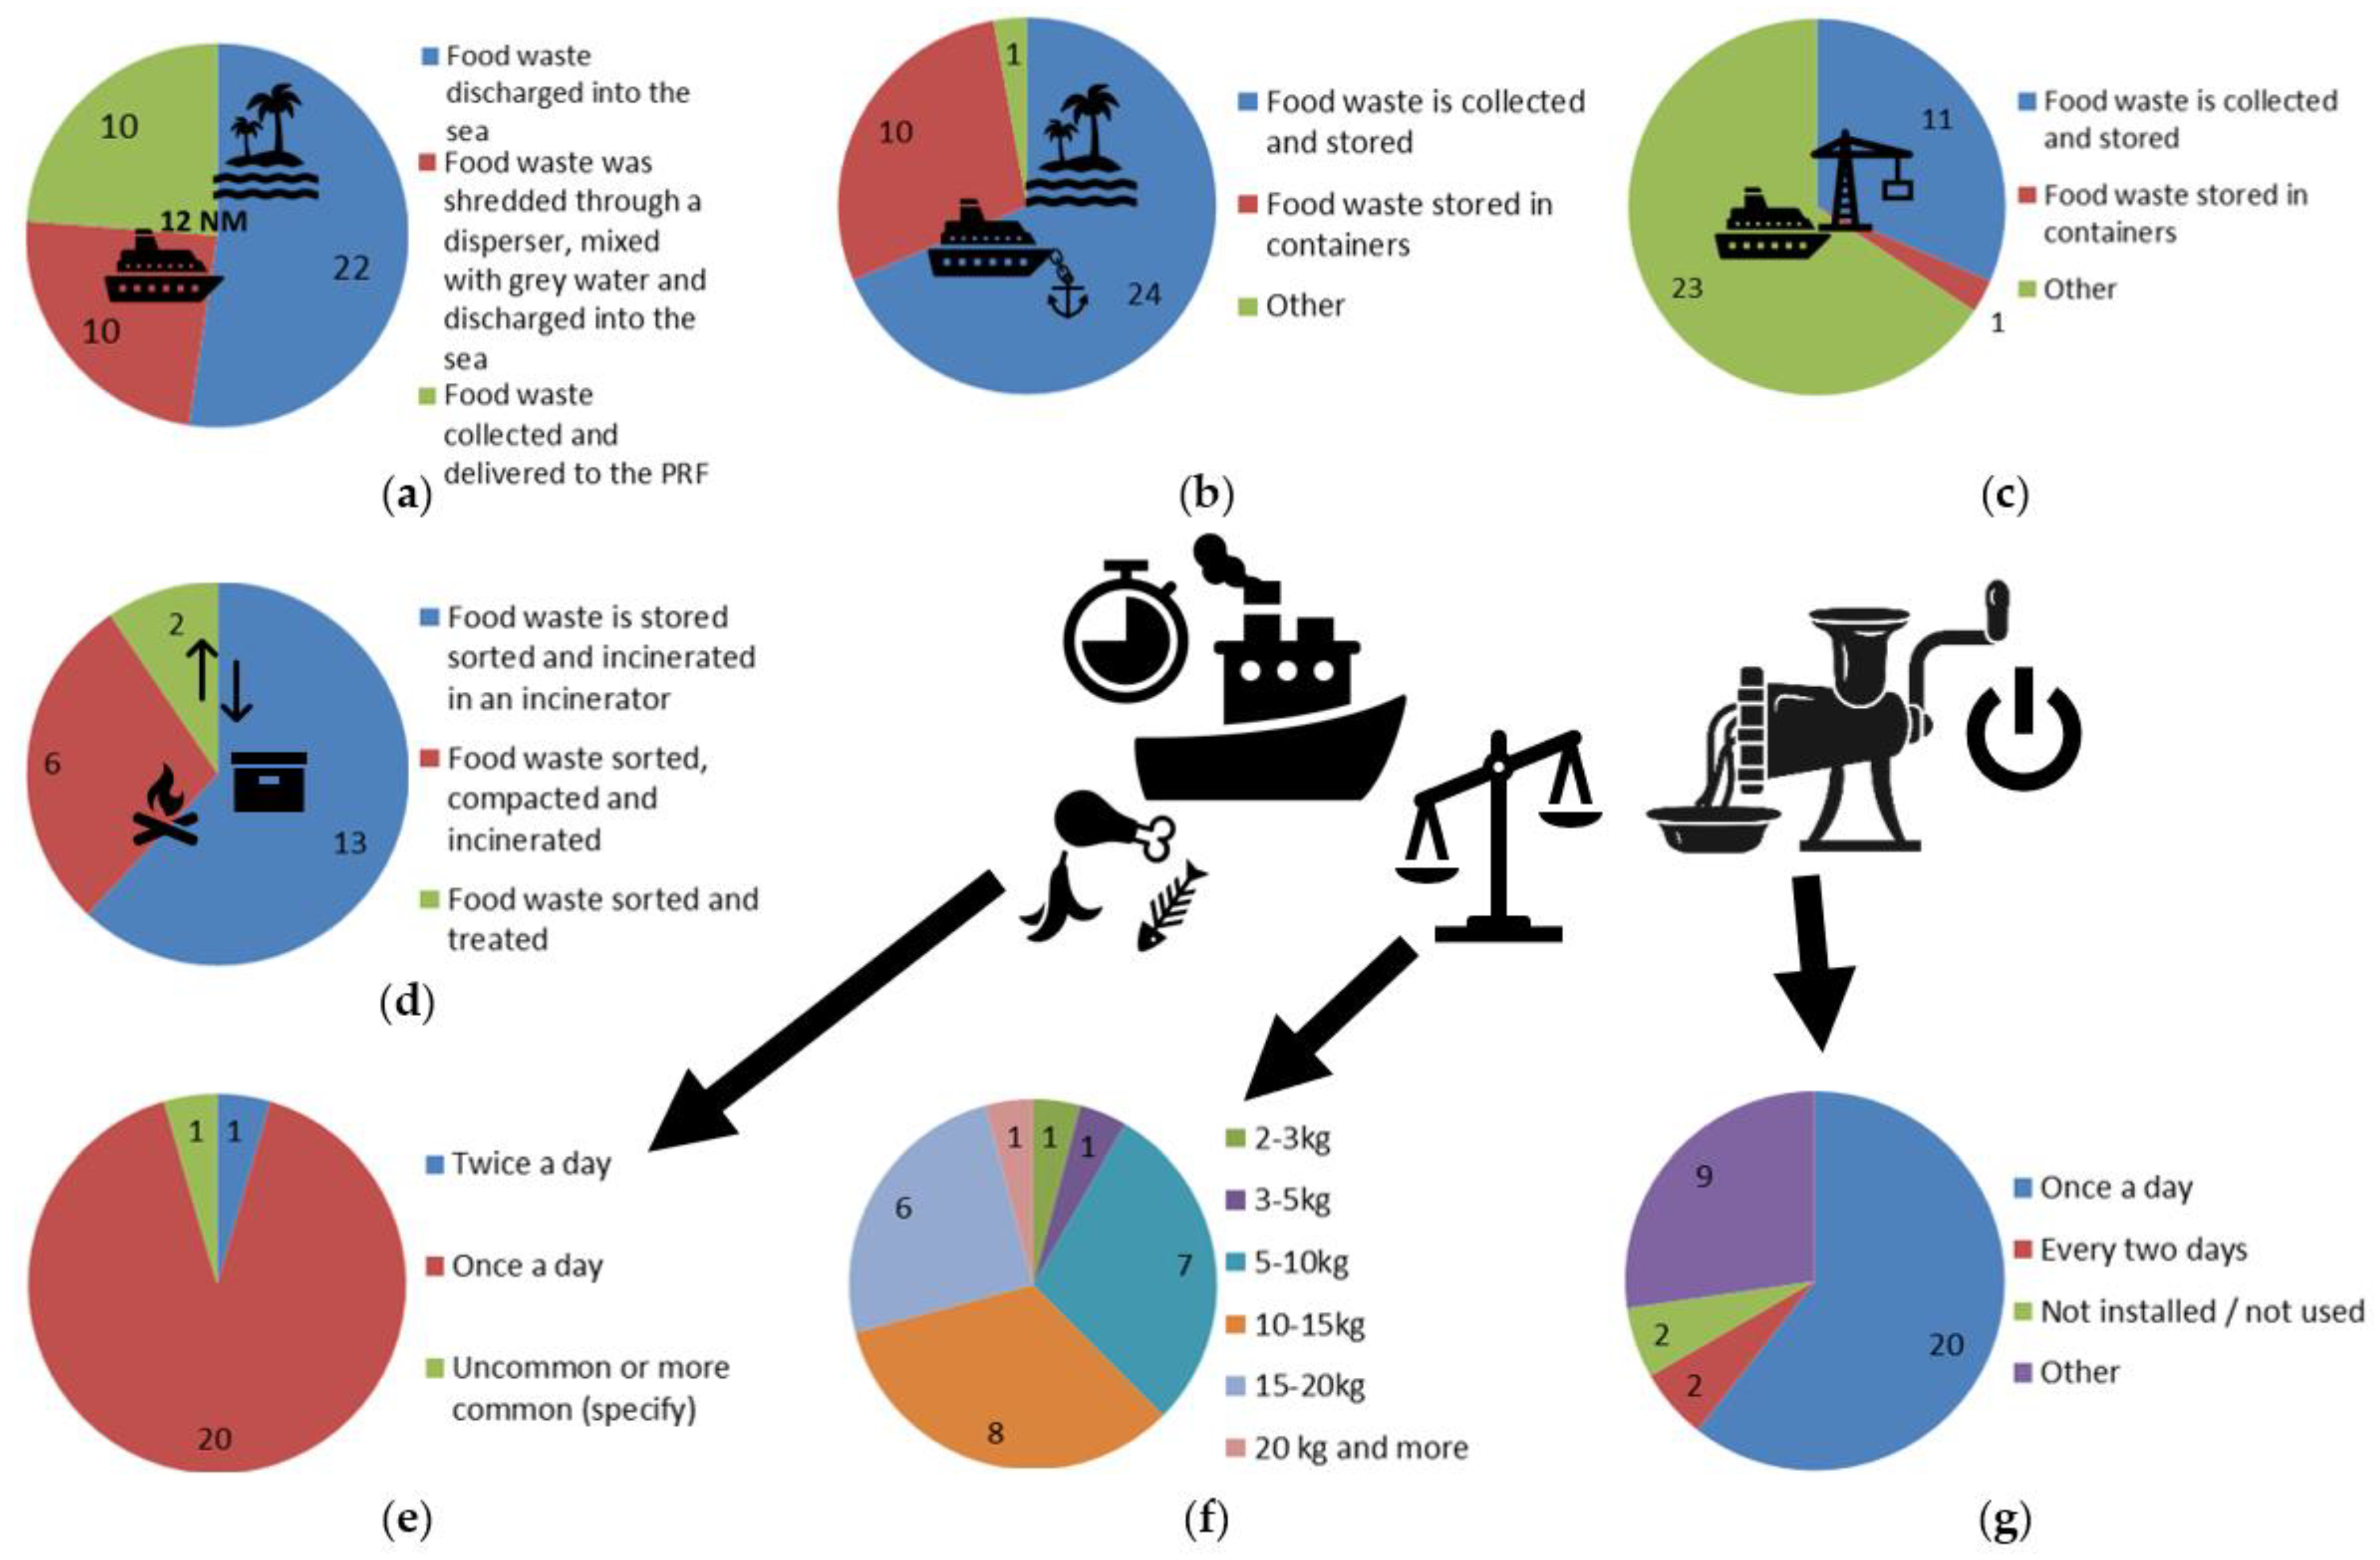
3.1.2. Trends in Ships’ Waste Management
- During sailing on the open waters in the Baltic Sea;
- Close to the shore;
- While anchored in a port.
- Thirteen responses—“food waste was stored, sorted, and incinerated”;
- Six responses—“food waste was sorted, compacted, and incinerated”.
3.2. Physical/Chemical Characterization of Identified Hazards in Greywater
3.3. The Calculation and Exposure Assessment Results for Discharged Food Waste
- —the average amount of food waste generated by each person per day (kg);
- M—the total amount of food waste generated on the ship (kg·day−1);
- P—number of persons (crewmembers).
Results of Daily Nutrient Content Model Calculations
- GWP—the quantity of phosphorus in the greywater in one day (g·day−1);
- FWP—the quantity of phosphorus in the food waste in one day (g·day−1);
- GWN—the quantity of nitrogen in the greywater in one day (g·day−1);
- FWP—the quantity of nitrogen in the food waste in one day (g·day−1).
- mP—daily production of phosphorus in greywater per person: 1.9 g;
- Pp—average number of persons on board a typical cargo ship: 20.
- mP—daily production of phosphorus in food waste per person: 0.5 g;
- Pp—average number of persons on board a typical cargo ship: 20.
- mN—daily production of nitrogen in greywater per person: 4.4 g;
- Pp—average number of persons on board a typical cargo ship: 20.
- mN—daily production of nitrogen in food waste per person 1.7 g;
- Pp—average number of persons on board a typical cargo ship: 20.
- GWB—estimated volume of greywater on board tankers (L·person−1·day−1): 109.3 L;
- Pp—average number of persons on board tankers: 20 crewmembers;
- mP—total phosphorus content of sample S1: 71.00 mg·L−1;
- mP—total phosphorus content of sample S2: 22.00 mg·L−1;
- mP—total phosphorus content of sample S3: 1.67 mg·L−1.
- GWB—estimated volume of greywater on board tankers (L·person−1·day−1): 109.3 L;
- Pp—average number of persons on board tankers: 20 persons (crewmembers);
- mN—total nitrogen content of sample S1: 238.00 mg·L−1;
- mN—total nitrogen content of sample S2: 74.50 mg·L−1;
- mN—total nitrogen content of sample S3: 1.26 mg·L−1.
3.4. The Result of Risk Characterization
4. Discussion
5. Conclusions and Future Perspectives
Author Contributions
Funding
Acknowledgments
Conflicts of Interest
References
- Marine Vessel Traffic Baltic Sea Ais Ship Traffic LIVE Map. Available online: https://www.marinevesseltraffic.com/BALTIC-SEA-AIS/ship-traffic-tracker (accessed on 11 July 2021).
- Lastumäki, I. Recent Monitoring Results: The State of the Gulf of Finland Better than in the Past Few Years, the Bothnian Sea Is Becoming Eutrophic. Available online: https://www.ymparisto.fi/en-US/Sea/Recent_monitoring_results_The_state_of_t(58962) (accessed on 11 July 2021).
- Byrnes, T.A.; Dunn, R.J.K. Boating- and Shipping-Related Environmental Impacts and Example Management Measures: A Review. J. Mar. Sci. Eng. 2020, 8, 908. [Google Scholar] [CrossRef]
- The Marine Environment Protection Committee. RESOLUTION MEPC.201(62). Adopted on 15 July 2011. In Amendments to the Annex of the Protocol of 1978 Relating to the International Convention for the Prevention of Pollution from Ships, 1973; International Maritime Organization: London, UK, 2011; pp. 1–14. [Google Scholar]
- IMO. Prevention of Pollution by Sewage from Ships. Available online: https://www.imo.org/en/About/Conventions/Pages/International-Convention-for-the-Prevention-of-Pollution-from-Ships-(MARPOL).aspx (accessed on 11 July 2021).
- The Marine Environment Protection Committee. RESOLUTION MEPC.284.(70). Adopted on 28 October 2016. In 2012 Guidelines on Implementation of Effluent Standards and Performance Tests for Sewage Treatment Plants; International Maritime Organization: London, UK, 2012; pp. 1–7. [Google Scholar]
- The Marine Environment Protection Committee. RESOLUTION MEPC.227(64). Adopted on 5 October 2012. In 2012 Guidelines on Implementation of Effluent Standards and Performance Tests for Sewage Treatment Plants; International Maritime Organization: London, UK, 2012; pp. 1–19. [Google Scholar]
- European Environment Agency. The European Environment—State and Outlook 2020. Knowledge for Transition to a Sustainable Europe; European Environment Agency: Copenhagen, Denmark, 2019; ISBN 978-92-9480-090-9. [Google Scholar]
- Saraiva, S.; Meier, H.E.M.; Andersson, H.; Höglund, A.; Dieterich, C.; Gröger, M.; Hordoir, R.; Eilola, K. Uncertainties in Projections of the Baltic Sea Ecosystem Driven by an Ensemble of Global Climate Models. Front. Earth Sci. 2019, 6, 18. [Google Scholar] [CrossRef]
- HELCOM Eutrophication. Supplementary Report. HELCOM Thematic Assessment of Eutrophication 2011–2016. Supplementary Report to the ‘State of the Baltic Sea’ Report. In Proceedings of the Baltic Sea Environment Proceedings 156; HELCOM: Helsinki, Finland, 2018; p. 183. [Google Scholar]
- Aigars, J.; Axe, P.; Blomqvist, M.; Carstensen, J.; Claussen, U.; Josefson, A.B.; Lehtinen, V.F.; Järvinen, M.; Kaartokallio, H.; Kaitala, S.; et al. Eutrophication in the Baltic Sea. An Integrated Thematic Assessment of the Effects of Nutrient Enrichment in the Baltic Sea Region. In Proceedings of the Baltic Sea Environment Proceedings No. 115B; Andersen, J.H., Laamanen, M., Eds.; Helsinki Commission—Baltic Marine Environment Protection Commission: Helsinki, Finland, 2009; p. 148. [Google Scholar]
- CE Delft; CHEW. The Management of Ship-Generated Waste On-Board Ships (EMSA/OP/02/2016); EMSA: Delft, The Netherlands, 2017. [Google Scholar]
- Fisgativa, H.; Tremier, A.; Dabert, P. Characterizing the Variability of Food Waste Quality: A Need for Efficient Valorisation through Anaerobic Digestion. Waste Manag. 2016, 50, 264–274. [Google Scholar] [CrossRef] [PubMed]
- Swanson, R.L.; Young, R.R.; Ross, S.S. An Analysis of Proposed U.S. Navy Shipborne Waste Handling Practices to Address MARPOL Annex V Provisions. Coast. Manag. 1996, 24, 41–59. [Google Scholar] [CrossRef]
- Nawadra, S.; Polglaze, J.; Provost, I.L.; Hayes, T.; Lindsay, S.; Pasisi, B.; Hillman, S.; Hilliard, R. Improving Ships’ Waste Management in Pacific Islands Ports; SPREP: Apia, Samoa, 2002; ISBN 982-04-0246-8. [Google Scholar]
- Wilewska-Bien, M.; Granhag, L.; Andersson, K. The Nutrient Load from Food Waste Generated Onboard Ships in the Baltic Sea. Mar. Pollut. Bull. 2016, 105, 359–366. [Google Scholar] [CrossRef] [PubMed]
- Covello, V.T.; Merkhofer, M.W. Risk Assessment Methods—Approaches for Assessing Health and Environmental Risks, 1st ed.; Springer: Boston, MA, USA, 1993; ISBN 978-1-4899-1218-3. [Google Scholar]
- HELCOM. Baltic Sea Sewage Port Reception Facilities. HELCOM Overview 2014; Backer, H., Frias, M., Nicolas, F., Eds.; Revised Se.; HELCOM: Helsinki, Finland, 2015; ISBN 978-952-67205-9-3. [Google Scholar]
- Det Norske Veritas. Risk Management in Marine and Subsea Operations. Recommended Practice No. DNV-RP-H101, 1st ed.; DET NORSKE VERITAS: Høvik, Norway, 2003. [Google Scholar]
- European Parliament, C. of the E.U. Directive (EU) 2019/883 of the European Parliament and of the Council of 17 April 2019 on Port Reception Facilities for the Delivery of Waste from Ships, Amending Directive 2010/65/EU and Repealing Directive 2000/59/EC (Text with EEA Relevance). Available online: https://eur-lex.europa.eu/legal-content/EN/TXT/PDF/?uri=CELEX:32019L0883&from=EN (accessed on 11 July 2021).
- RBP Rīgas Brīvostas Pārvaldes 2020. Gada 19. Novembra Lēmums Nr. 105 “Par Rīgas Ostas Maksu Apstiprināšanu” (Decision No. of the Freeport of Riga Authority of 19 November 2020 105 “On Approval of Port of Riga Fees”). Available online: https://www.vestnesis.lv/op/2021/4.5 (accessed on 11 July 2021).
- Kļaviņš, M.; Cimdiņš, P. Ūdeņu Kvalitāte Un Tās Aizsardzība: Pārejas Procesi, Garās Līnijas, Nelineārās Ķēdes (Water Quality And Its Protection: Transition Processes, Long Lines, Nonlinear Circuits); LU Akadēmiskais apgāds: Riga, Latvia, 2004; ISBN 9984770575. [Google Scholar]
- FIWA. Finnish Industrial Wastewater Guide. Conveyin Non-Domestic Wastewater to Sewers; Publicatio; Finnish Water Utilities Association: Helsinki, Finland, 2018; ISBN 978-952-6697-38-3. [Google Scholar]
- Raudsepp, U.; Maljutenko, I.; Kõuts, M.; Granhag, L.; Wilewska-Bien, M.; Hassellöv, I.-M.; Eriksson, K.M.; Johansson, L.; Jalkanen, J.-P.; Karl, M.; et al. Shipborne Nutrient Dynamics and Impact on the Eutrophication in the Baltic Sea. Sci. Total Environ. 2019, 671, 189–207. [Google Scholar] [CrossRef] [PubMed]
- Marashlian, N.; El-Fadel, M. The Effect of Food Waste Disposers on Municipal Waste and Wastewater Management. Waste Manag. Res. J. A Sustain. Circ. Econ. 2005, 23, 20–31. [Google Scholar] [CrossRef] [PubMed]
- GESAMP. Sources, Fate and Effects of Microplastics in the Marine Environment: Part Two of a Global Assessment; Kershaw, P., Ed.; GESAMP Reports & Studies Series No. 93; IMO: London, UK, 2016; ISSN: 1020-4873. [Google Scholar]
- European Maritime Safety Agency. Study on Ships Producing Reduced Quantities of Ships Generated Waste—Present Situation and Future Opportunities to Encourage the Development of Cleaner Ships. Final Report EMSA /OP/05/05; EMSA: Hamburg, Germany, 2005. [Google Scholar]
- Strazza, C.; Magrassi, F.; Gallo, M.; del Borghi, A. Life Cycle Assessment from Food to Food: A Case Study of Circular Economy from Cruise Ships to Aquaculture. Sustain. Prod. Consum. 2015, 2, 40–51. [Google Scholar] [CrossRef]
- Olson, P.H. Handling of Waste in Ports. Mar. Pollut. Bull. 1994, 29, 284–295. [Google Scholar] [CrossRef]
- Ytreberg, E.; Eriksson, M.; Maljutenko, I.; Jalkanen, J.P.; Johansson, L.; Granhag, L. Chemicals and Nutrients in Grey Water from Ships. Chemical Risk Assessment of Grey Water Contaminants and Grey Water Nutrient Contribution to Eutrophication of Baltic Sea Basins. In Proceedings of the Baltic Marine Environment Protection Commission, Lisbon, Portugal, 23–26 September 2019; HELCOM: Lisbon, Portugal, 2019; p. 32. [Google Scholar]
- Jalkanen, J.-P.; Johansson, L.; Wilewska-Bien, M.; Granhag, L.; Ytreberg, E.; Eriksson, K.M.; Yngsell, D.; Hassellöv, I.-M.; Magnusson, K.; Raudsepp, U.; et al. Modelling of Discharges from Baltic Sea Shipping. Ocean Sci. 2021, 17, 699–728. [Google Scholar] [CrossRef]
- HELCOM. Baltic Sea Protected Areas (BSPA). Available online: http://archive.iwlearn.net/helcom.fi/environment2/biodiv/en_GB/bspas/index.html (accessed on 18 July 2021).
- Leal Filho, W.; Kovaleva, M. The State of the Problem of Food Waste in the Baltic Region Countries. In Food Waste and Sustainable Food Waste Management in the Baltic Sea Region; Environmental Science and Engineering; Springer International Publishing: Cham, Switzerland, 2015; pp. 107–176. ISBN 978-3-319-10905-3. [Google Scholar]
- Koboević, Ž.; Kurtela, Ž. Comparison of Marine Sewage Treatment Systems. In Proceedings of the 14th International Conference on Transport Science—ICTS 2011, Portorož, Slovenia, 27 May 2011; Geertman, S., Ed.; Springer: Portorož, Slovenia, 2011; p. 10. [Google Scholar]
- Talvitie, J.; Mikola, A.; Koistinen, A.; Setälä, O. Solutions to Microplastic Pollution—Removal of Microplastics from Wastewater Effluent with Advanced Wastewater Treatment Technologies. Water Res. 2017, 123, 401–407. [Google Scholar] [CrossRef] [PubMed] [Green Version]
- Stenmarck, Å.; Magnus Jensen, C.; Quested, T.; Moates, G. Estimates of European Food Waste Levels; EU FUSIONS: Stockholm, Sweden, 2016; ISBN 978-91-88319-01-2. [Google Scholar]
- Worldometer Current World Population. Available online: https://www.worldometers.info/world-population/ (accessed on 11 July 2021).
- FAO; IFAD; UNICEF; WFP; WHO. The State of Food Security and Nutrition in the World 2018. Building Climate Resilience for Food Security and Nutrition; Food and Agriculture Organization of the United Nations: Rome, Italy, 2018; ISBN 978-92-5-130571-3. [Google Scholar]
- Cabinet of Ministers, Regulations Regarding Discharge of Polluting Substances into Water; Cabinet of Ministers: Riga, Latvia, 2002.
- U.S. Environmental Protection Agency. Final Issuance of National Pollutant Discharge Elimination System (NPDES) Vessel General Permit (VGP) for Discharges Incidental to the Normal Operation of VesselsFact Sheet; U.S. Environmental Protection Agency: Washington, DC, USA, 2013.
- Peng, L.; Fu, D.; Qi, H.; Lan, C.Q.; Yu, H.; Ge, C. Micro- and Nano-Plastics in Marine Environment: Source, Distribution and Threats—A Review. Sci. Total Environ. 2020, 698, 134254. [Google Scholar] [CrossRef] [PubMed]
- Mato, Y.; Isobe, T.; Takada, H.; Kanehiro, H.; Ohtake, C.; Kaminuma, T. Plastic Resin Pellets as a Transport Medium for Toxic Chemicals in the Marine Environment. Environ. Sci. Technol. 2001, 35, 318–324. [Google Scholar] [CrossRef] [PubMed]
- Khatmullina, L.; Chubarenko, I. Transport of Marine Microplastic Particles: Why Is It so Difficult to Predict? Anthr. Coasts 2019, 2, 293–305. [Google Scholar] [CrossRef] [Green Version]
- Conley, D.J.; Björck, S.; Bonsdorff, E.; Carstensen, J.; Destouni, G.; Gustafsson, B.G.; Hietanen, S.; Kortekaas, M.; Kuosa, H.; Markus Meier, H.E.; et al. Hypoxia-Related Processes in the Baltic Sea. Environ. Sci. Technol. 2009, 43, 3412–3420. [Google Scholar] [CrossRef] [PubMed] [Green Version]
- Vahtera, E.; Conley, D.J.; Gustafsson, B.G.; Kuosa, H.; Pitkänen, H.; Savchuk, O.P.; Tamminen, T.; Viitasalo, M.; Voss, M.; Wasmund, N.; et al. Internal Ecosystem Feedbacks Enhance Nitrogen-Fixing Cyanobacteria Blooms and Complicate Management in the Baltic Sea. AMBIO J. Hum. Environ. 2007, 36, 186–194. [Google Scholar] [CrossRef]
- Baronins, J.; Podgursky, V.; Antonov, M.; Bereznev, S.; Hussainova, I. Electrochemical Behaviour of TiCN and TiAlN Gradient Coatings Prepared by Lateral Rotating Cathode Arc PVD Technology. Key Eng. Mater. 2016, 721, 414–418. [Google Scholar] [CrossRef]
- Irtiseva, K.; Lapkovskis, V.; Mironovs, V.; Ozolins, J.; Thakur, V.K.; Goel, G.; Baronins, J.; Shishkin, A. Towards Next-Generation Sustainable Composites Made of Recycled Rubber, Cenospheres, and Biobinder. Polymers 2021, 13, 574. [Google Scholar] [CrossRef] [PubMed]
- Irtiseva, K.; Baronins, J.; Krūmiņš, J.; Ozolins, J.; Kļaviņš, M.; Medne, O. Development of Peat Processing Methods for Production of Innovative Products. Key Eng. Mater. 2020, 850, 9–15. [Google Scholar] [CrossRef]
- Shishkin, A.; Baronins, J.; Mironovs, V.; Lukáč, F.; Štubňa, I.; Ozolins, J. Influence of Glass Additions on Illitic Clay Ceramics. Materials 2020, 13, 596. [Google Scholar] [CrossRef] [PubMed] [Green Version]
- Kalnina, R.; Ivaninoka, I. Treatment Methods of Ships Sewage: A Theoretical Analysis. In Transport Means 2020: Proceedings of the 24th International Scientific Conference, Online, 30 September–2 October 2020; Kaunas University of Technology: Kaunas, Lithuania, 2020; pp. 548–553. [Google Scholar]


| No. | Indicator | Applied Testing Standard | Testing Method |
|---|---|---|---|
| 1 | Ammonium nitrogen (NH4/N) | LVS ISO 7150-1:1984 | Spectrophotometry |
| 2 | Nitrate nitrogen (NO3/N) | LVS ISO 13395:2004 | Spectrophotometry |
| 3 | Nitrite nitrogen (NO2/N) | LVS ISO 6777:1984 + AC:2001 | Spectrophotometry |
| 4 | Total nitrogen (NTotal) | LVS EN ISO 29441:2011 | Combination of flow analysis and spectrometric detection |
| 5 | Phosphate phosphorus (PO4/P) | LVS EN ISO 6878:2005:4 p. | Spectrophotometry |
| 6 | Total phosphorus (PTotal) | LVS EN ISO 6878:2005:7 p | Spectrophotometry |
| 7 | Chemical oxygen demand (COD) | LVS EN ISO 15705:2002 | Photometric |
| 8 | Biochemical oxygen demand (BOD5) | LVS EN 1899-1:2003 | Dilution and seeding method |
| 9 | Suspended substances (SSs) | LVS EN 872:2005 | Gravimetry |
| 10 | pH | LVS EN ISO 10523:2012 | Electrometric |
| No. | Determined Indicator | Tested Samples | MEPC.227 (64) (Annex 22) [7] | ||
|---|---|---|---|---|---|
| S1 | S2 | S3 | |||
| 1 | Ammonium/nitrogen (NH4/N), mg·L−1 | 163 ± 16 | 69 ± 7 | 0.9 ± 0.03 | - |
| 2 | Nitrate nitrogen (NO3/N), mg·L−1 | 0.59 ± 0.05 | 0.26 ± 0.03 | 0.1 ± 0.03 | - |
| 3 | Nitrite nitrogen (NO2/N), mg·L−1 | 0.07 ± 0.07 | 0.12 ± 0.01 | 0.03 ± 0.003 | - |
| 4 | Total nitrogen (NTotal), mg·L−1 | 238 ± 24 | 75 ± 7 | 1.3 ± 0.1 | 20 |
| 5 | Phosphate phosphorus (PO4/P), mg·L−1 | 66.8 ± 6.7 | 21.6 ± 2.2 | 1.04 ± 0.05 | - |
| 6 | Total phosphorus (PTotal), mg·L−1 | 71 ± 7 | 22 ± 2 | 1.67 ± 0.08 | 1 |
| 7 | Chemical oxygen demand (COD), mgO2·L−1 | 1272 ± 127 | 570 ± 57 | 257 ± 26 | 125 |
| 8 | Biochemical oxygen demand (BOD5), mgO2·L−1 | 763 ± 76 | 399 ± 40 | 150 ± 15 | 25 |
| 9 | Suspended substances (SSs), mg·L−1 | 881 ± 88 | 335 ± 34 | 77 ± 7.6 | 35 |
| 10 | pH | 6.8 ± 0.1 | 7.4 ± 0.1 | 7.8 ± 0.1 | 6.0–8.5 |
| Type of Vessel | Food Waste Discharge or Generation Ratios (kg·Person·Day−1) | ||
|---|---|---|---|
| Food Waste Discharged into Environmental Sea Waters | Food Waste Mixed with Greywater and Discharged to Environmental Sea Waters | Estimated Average Amount of Generated Food Waste | |
| Tankers | 0.571 | 0.329 | 0.900 |
| Container cargo | 0.508 | - | 0.508 |
| General/dry cargo | 0.729 | 0.328 | 1.057 |
| Container cargo and general/dry cargo (average) | 0.619 | 0.328 | 0.783 |
| Type of the Vessel | Estimated Food Waste Generation Rate (kg·Person·Day−1) | References |
|---|---|---|
| Tankers | 0.48 | [16,19] |
| Cargo | 0.67 | [16,19] |
| 0.36 | [16] | |
| Navy | 0.6 (crew of about 30 persons) | [15] |
| 0.95 (crew of about 200 persons) | ||
| 1.00 (crew of about 250 persons) | ||
| Cruise | Up to 3.5 | [27] |
| From 1.3 up to 3.5 | [28] | |
| Passenger ships | 1.04 | [16,19] |
| Fishing ships | 0.28 | [16,19] |
| Offshore ships | 0.21 | [16,19] |
| Not specified | From 1.4 up to 2.4 | [29] |
| 0.75 | [15] |
| Type of Vessel | Estimated Volume of Greywater Generation Rate (L·Person·Day−1) [30] | |
|---|---|---|
| Tankers | 105 | |
| Container cargo and general/dry cargo (average) | 119 | |
| Average emission factors for nutrients used in the modelling process (g·person·day−1) [30,31] | ||
| Type of Effluent | Phosphorous (P) | Nitrogen (N) |
| Greywater | 1.9 | 4.4 |
| Food waste | 0.5 | 1.7 |
| Description | Environment | Probability Increases | |||
|---|---|---|---|---|---|
| Very Unlikely (A) | Unlikely (B) | Probably (C) | Highly Likely (D) | ||
| Highly serious (1) | DNC load effect is not acceptable | A1 | B1 | C1 | D1 |
| Serious (2) | DNC load effect is tolerable | A2 | B2 | C2 | D2 |
| Moderate (3) | DNC load effect is acceptable | A3 | B3 | C3 | D3 |
| Insignificant (4) | DNC load effect is negligible | A4 | B4 | C4 | D4 |
| Description of risks | |||||
| High | The risk is considered unacceptable, and measures must be taken (to reduce the likely expected occurrence and/or severity of the consequences) until an acceptable level of risk is reached. This type of food management cannot be considered environmentally friendly in the Baltic Sea as it imposes an unacceptable burden on the DNC. | ||||
| Moderate | The risk should be reduced, if it is feasible on board, and it should meet the requirements of the MEPC.227 (64) as effectively as possible. | ||||
| Low | The risk is considered insignificant because the impact on the DNC load is negligible. | ||||
Publisher’s Note: MDPI stays neutral with regard to jurisdictional claims in published maps and institutional affiliations. |
© 2021 by the authors. Licensee MDPI, Basel, Switzerland. This article is an open access article distributed under the terms and conditions of the Creative Commons Attribution (CC BY) license (https://creativecommons.org/licenses/by/4.0/).
Share and Cite
Kalnina, R.; Demjanenko, I.; Gorbacenko, D.; Priednieks, V.; Baronins, J. Nutrient Analysis of Food Waste from Ships’ Greywater in the Baltic Sea. Water 2021, 13, 2421. https://doi.org/10.3390/w13172421
Kalnina R, Demjanenko I, Gorbacenko D, Priednieks V, Baronins J. Nutrient Analysis of Food Waste from Ships’ Greywater in the Baltic Sea. Water. 2021; 13(17):2421. https://doi.org/10.3390/w13172421
Chicago/Turabian StyleKalnina, Renate, Ieva Demjanenko, Dzesika Gorbacenko, Valdis Priednieks, and Janis Baronins. 2021. "Nutrient Analysis of Food Waste from Ships’ Greywater in the Baltic Sea" Water 13, no. 17: 2421. https://doi.org/10.3390/w13172421
APA StyleKalnina, R., Demjanenko, I., Gorbacenko, D., Priednieks, V., & Baronins, J. (2021). Nutrient Analysis of Food Waste from Ships’ Greywater in the Baltic Sea. Water, 13(17), 2421. https://doi.org/10.3390/w13172421