
Revision of Frequency Estimates of Extreme Precipitation Based on the Annual Maximum Series in the Jiangsu Province in China

Abstract
:1. Introduction
2. Materials and Methods
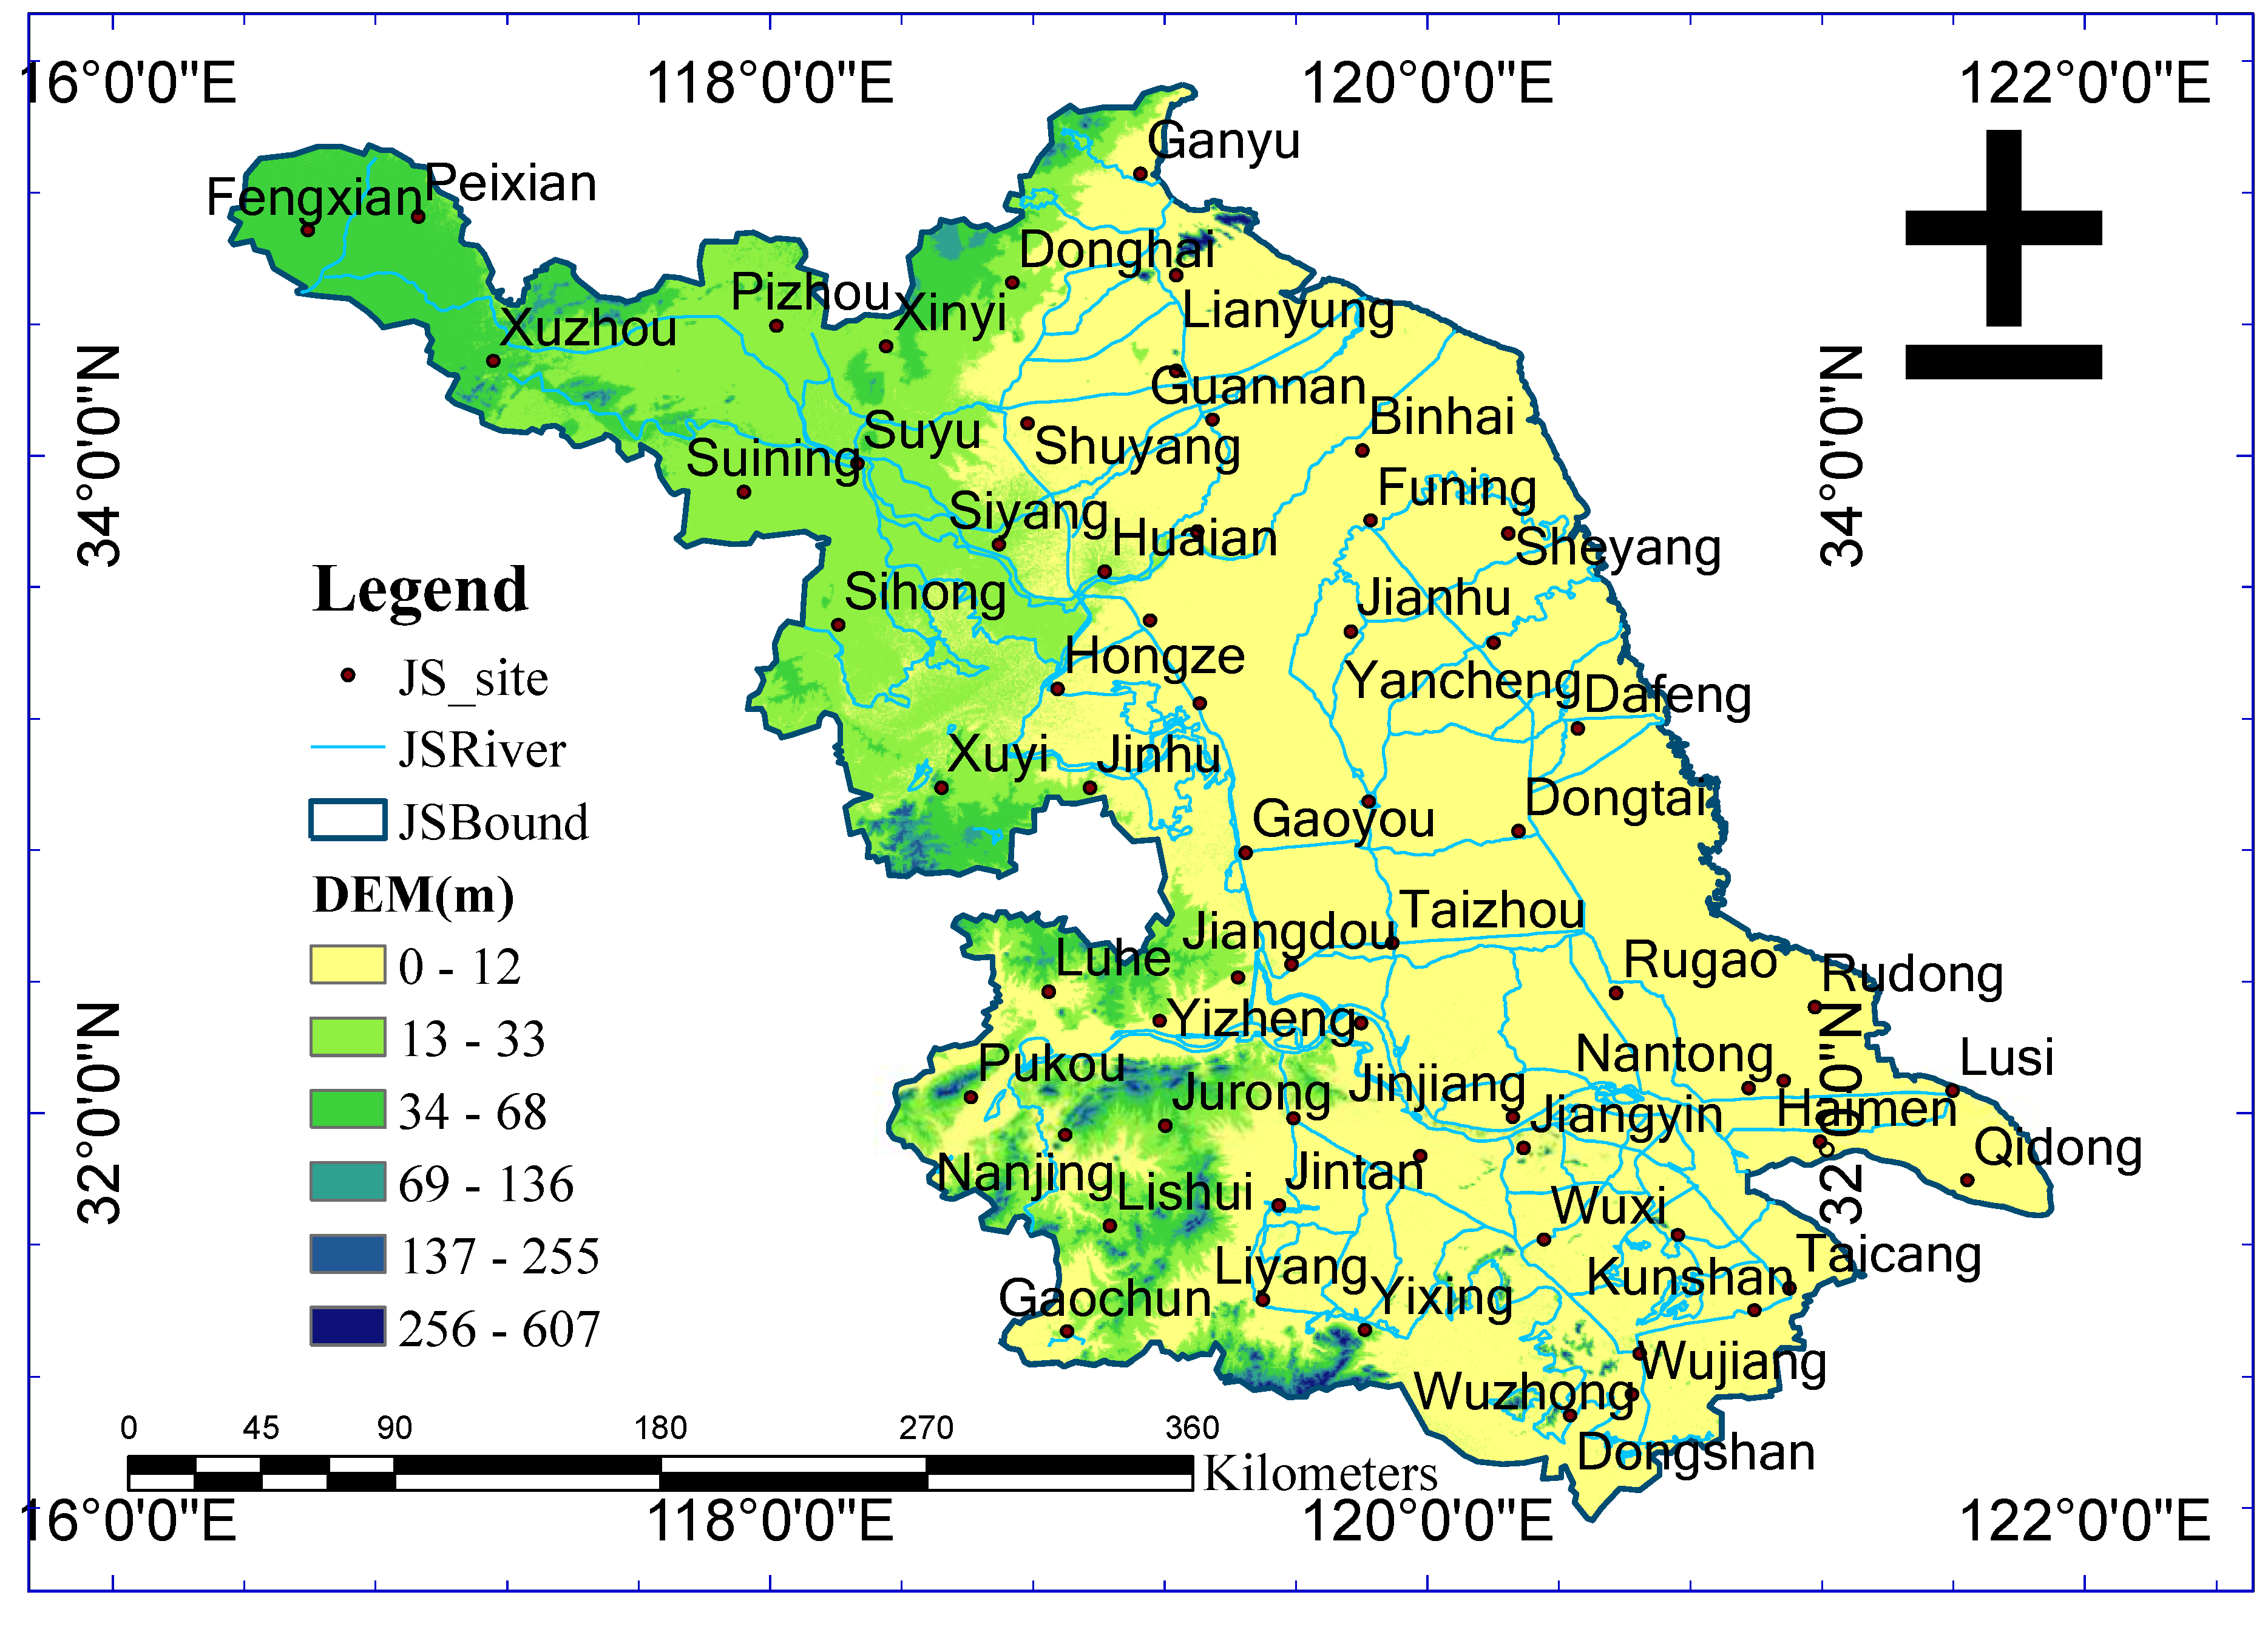
2.1. Study Area
2.2. Data
2.3. Methodology
2.3.1. Regional L-Moments Method
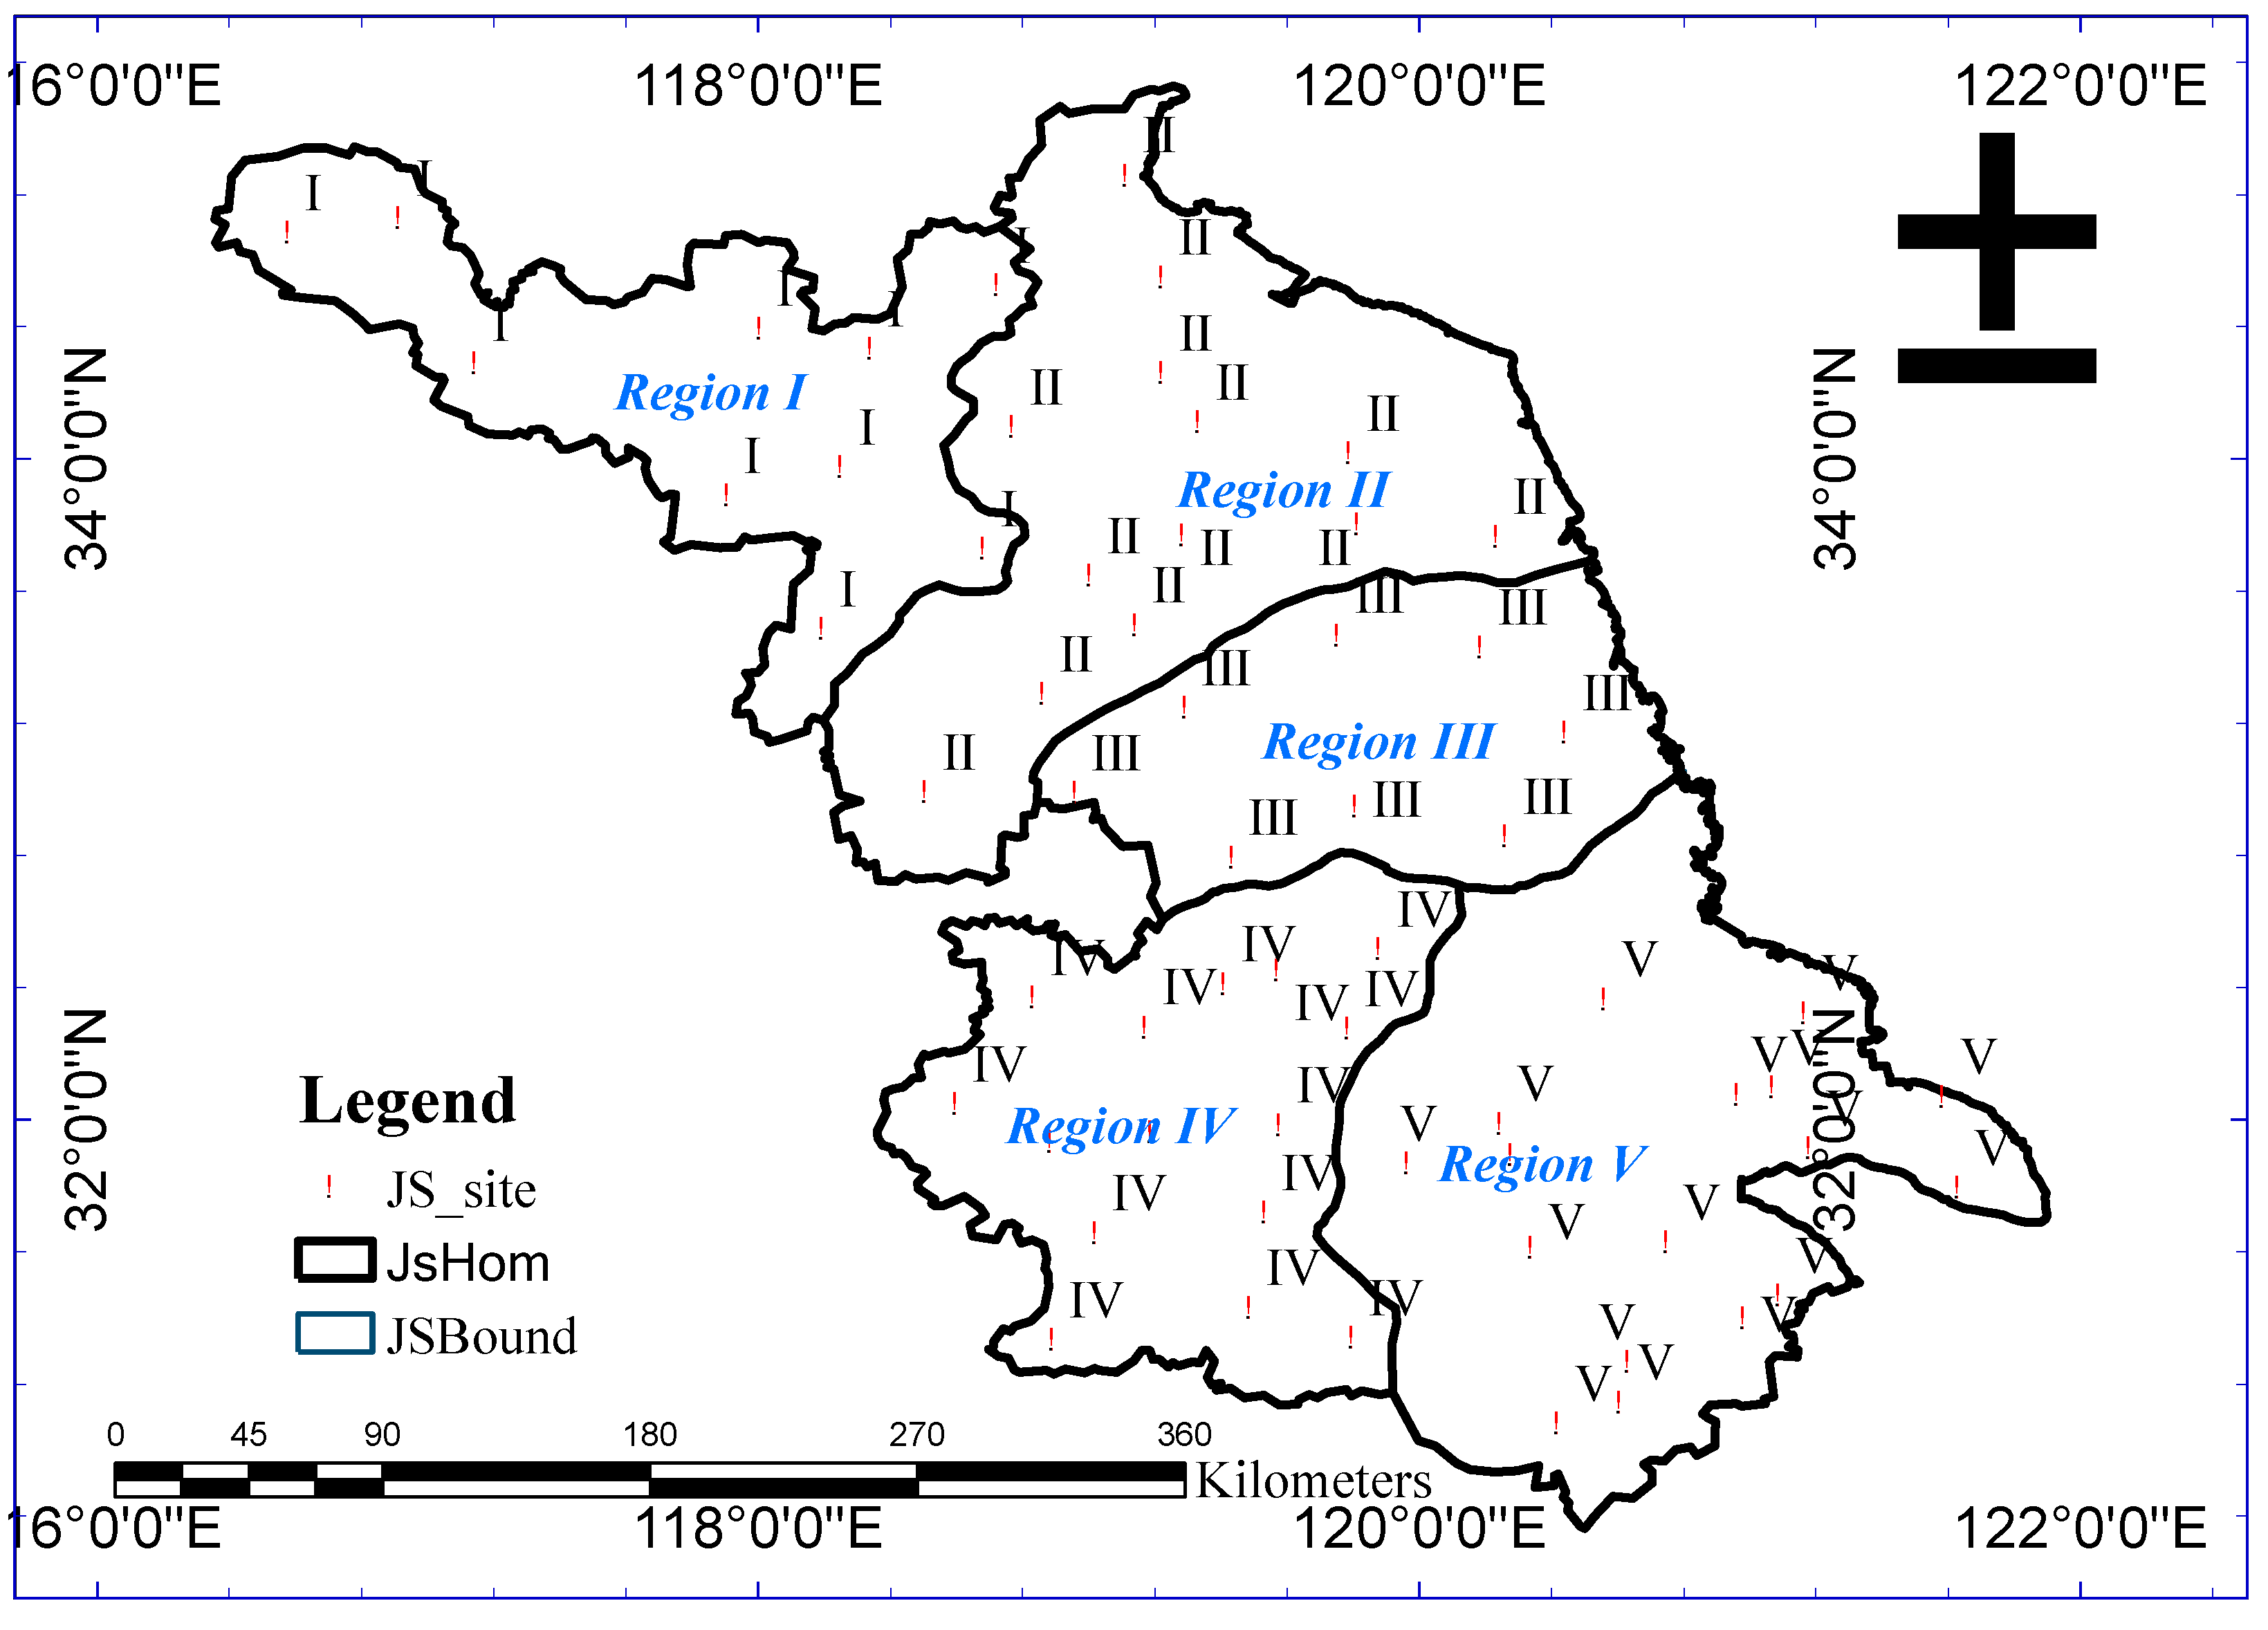
2.3.2. Identification of Homogeneous Regions
2.3.3. The Goodness-of-Fit
2.3.4. Conversion of AES-AMS
3. Results
3.1. Results and Analysis of the Goodness-of-Fit
3.2. Comparison between Exceedance Frequency and Exceedance Probability
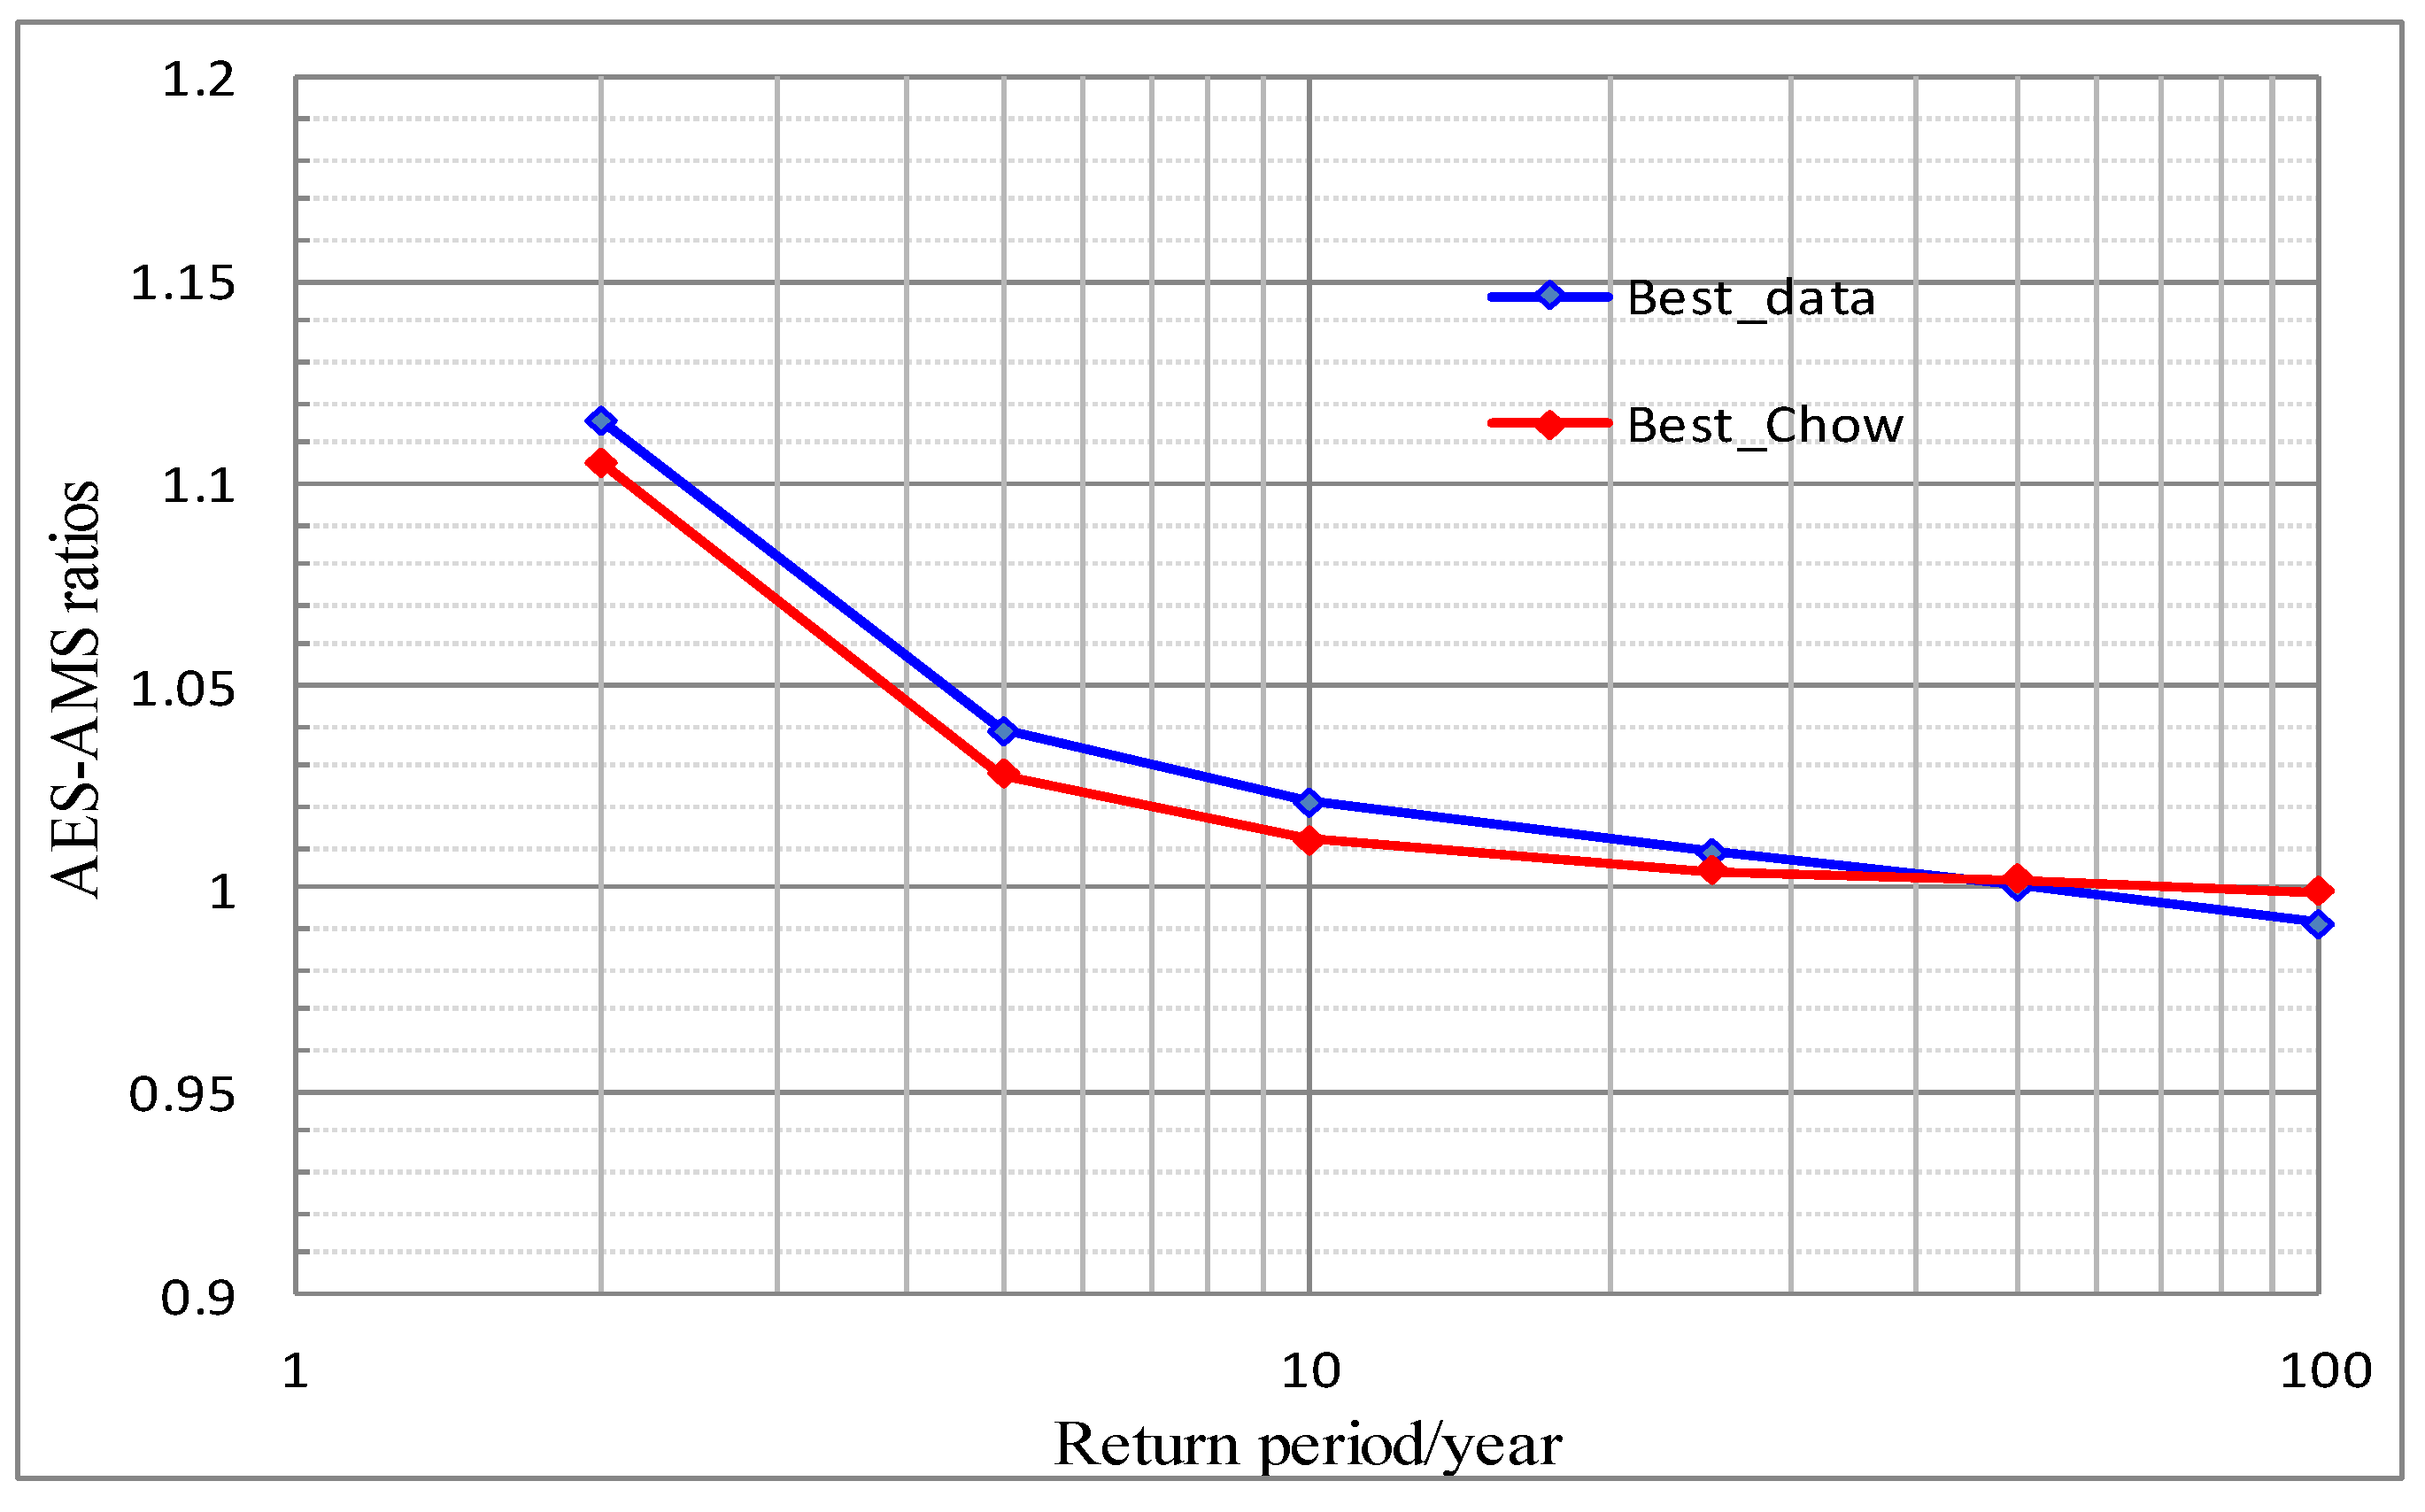
3.3. Verification of the Applicability of Chow’s Equation in the Study
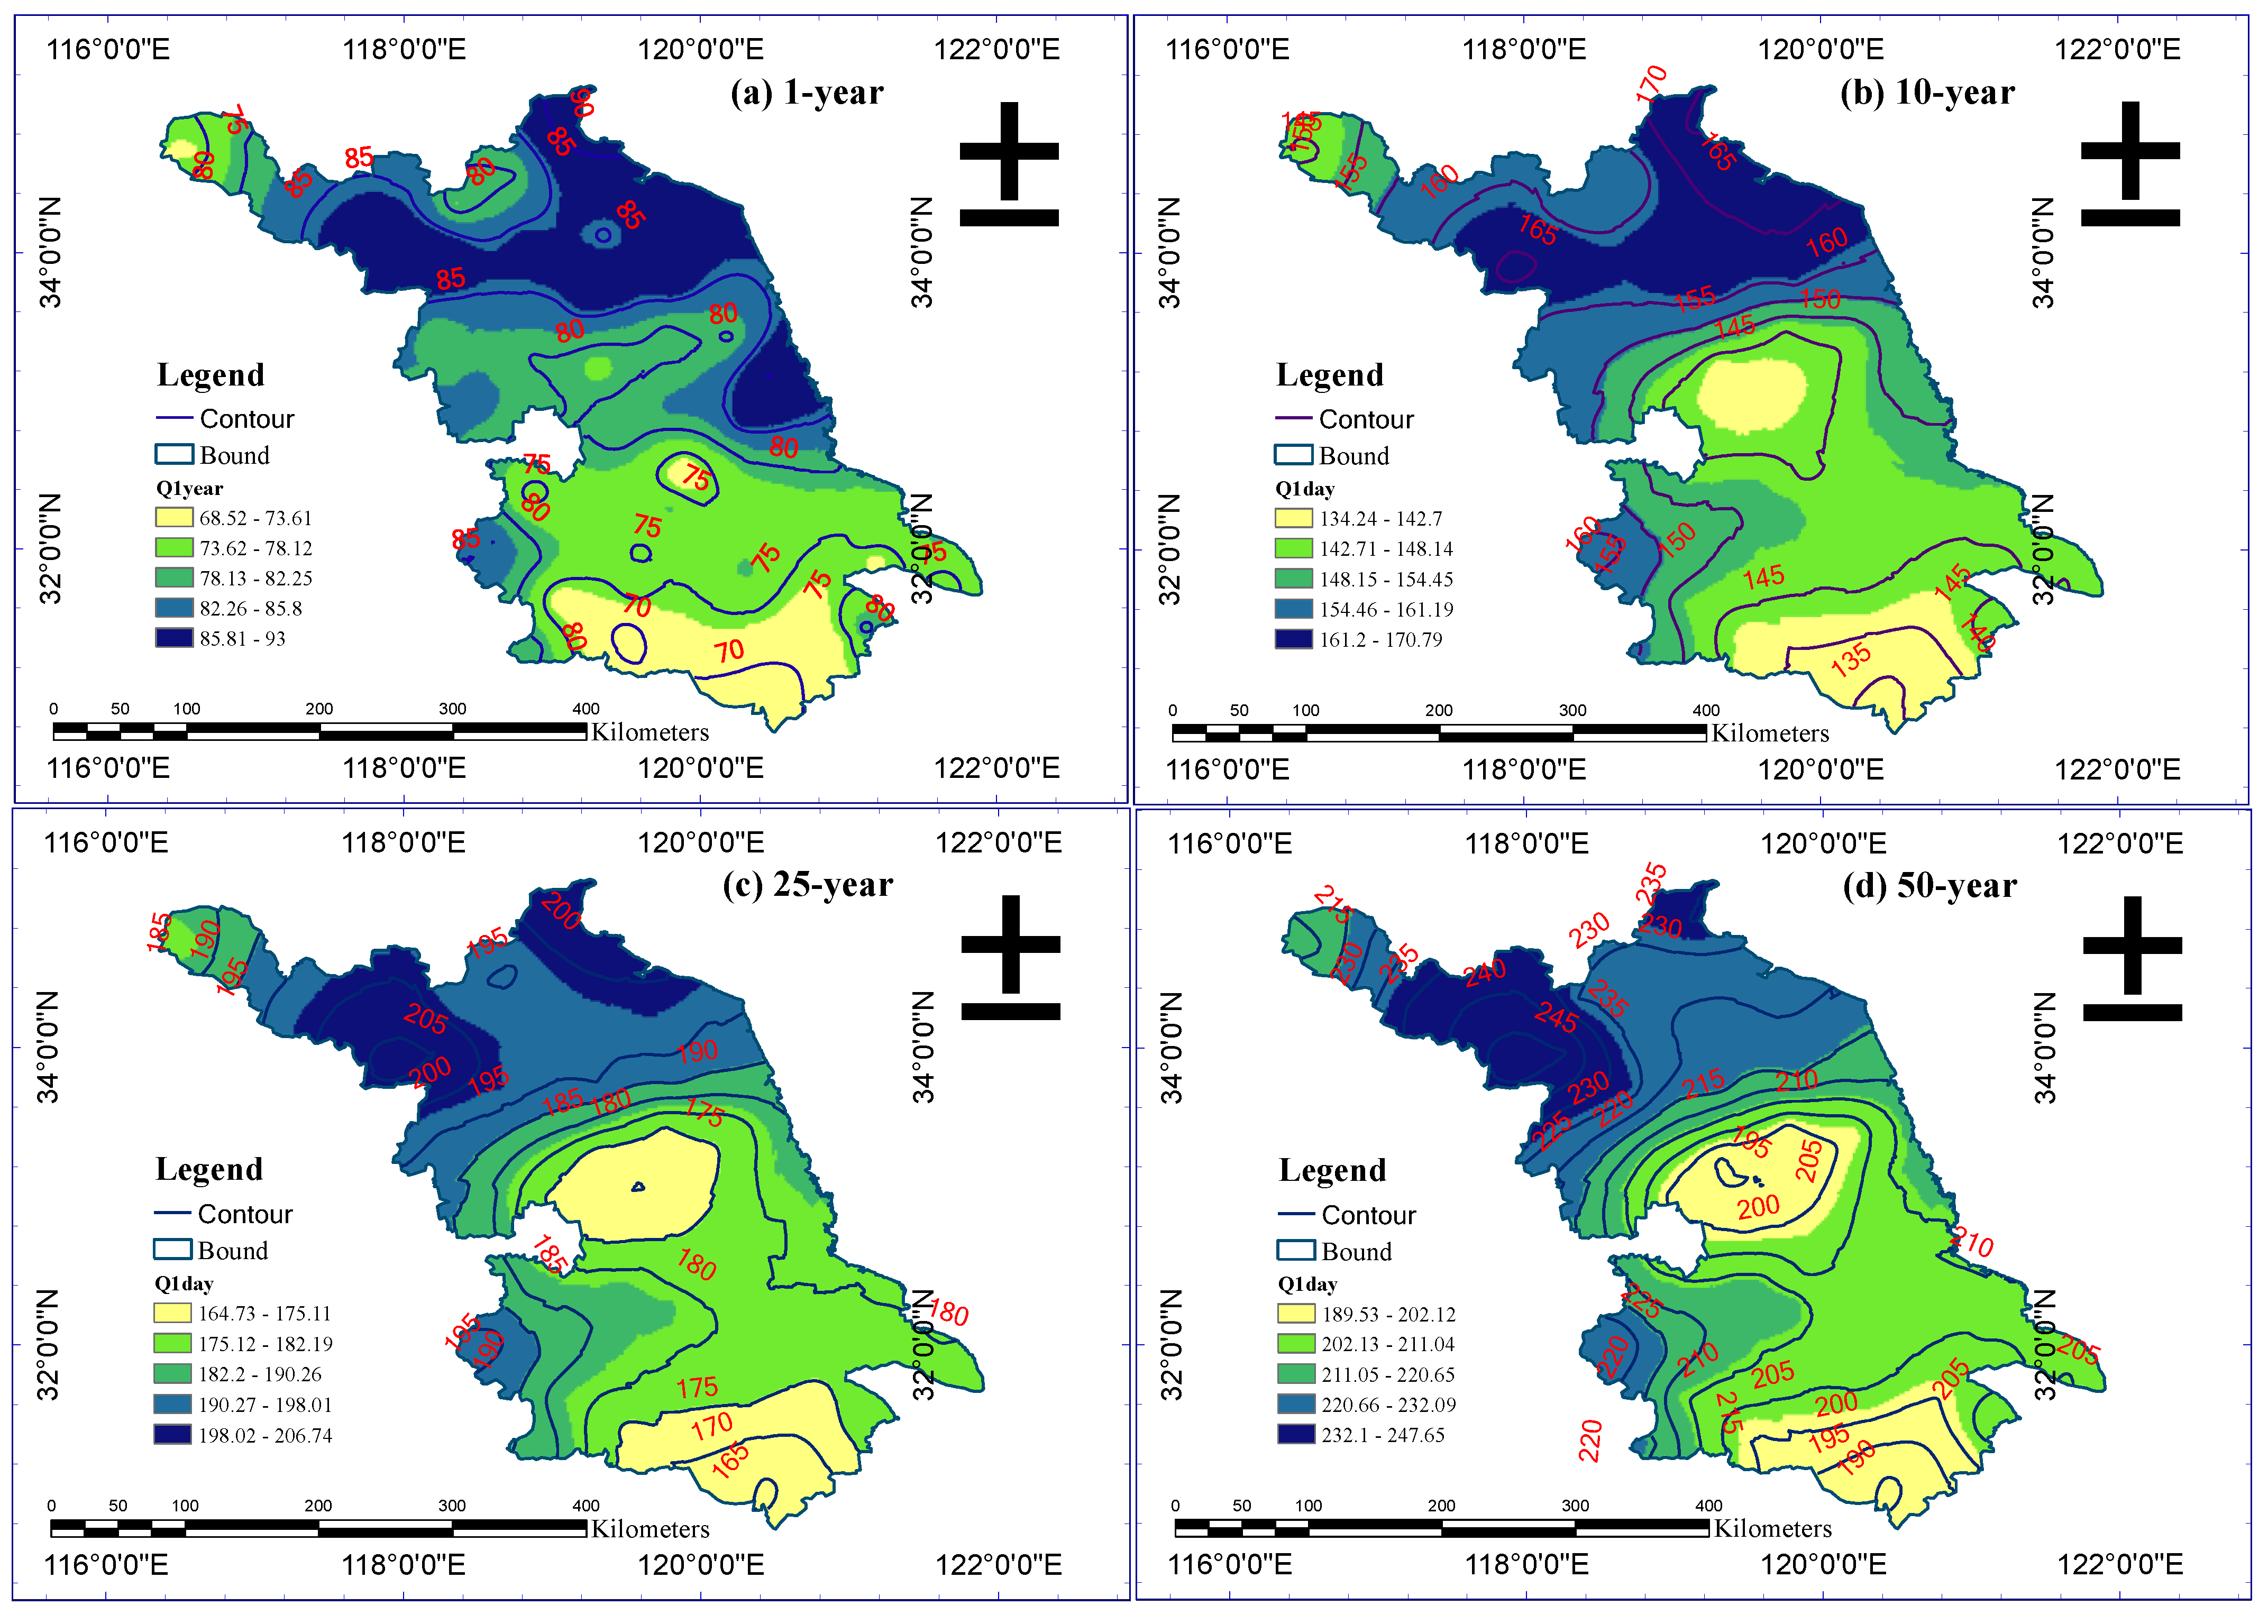
3.4. Reliable Frequency Estimation and Spatiotemporal Analysis
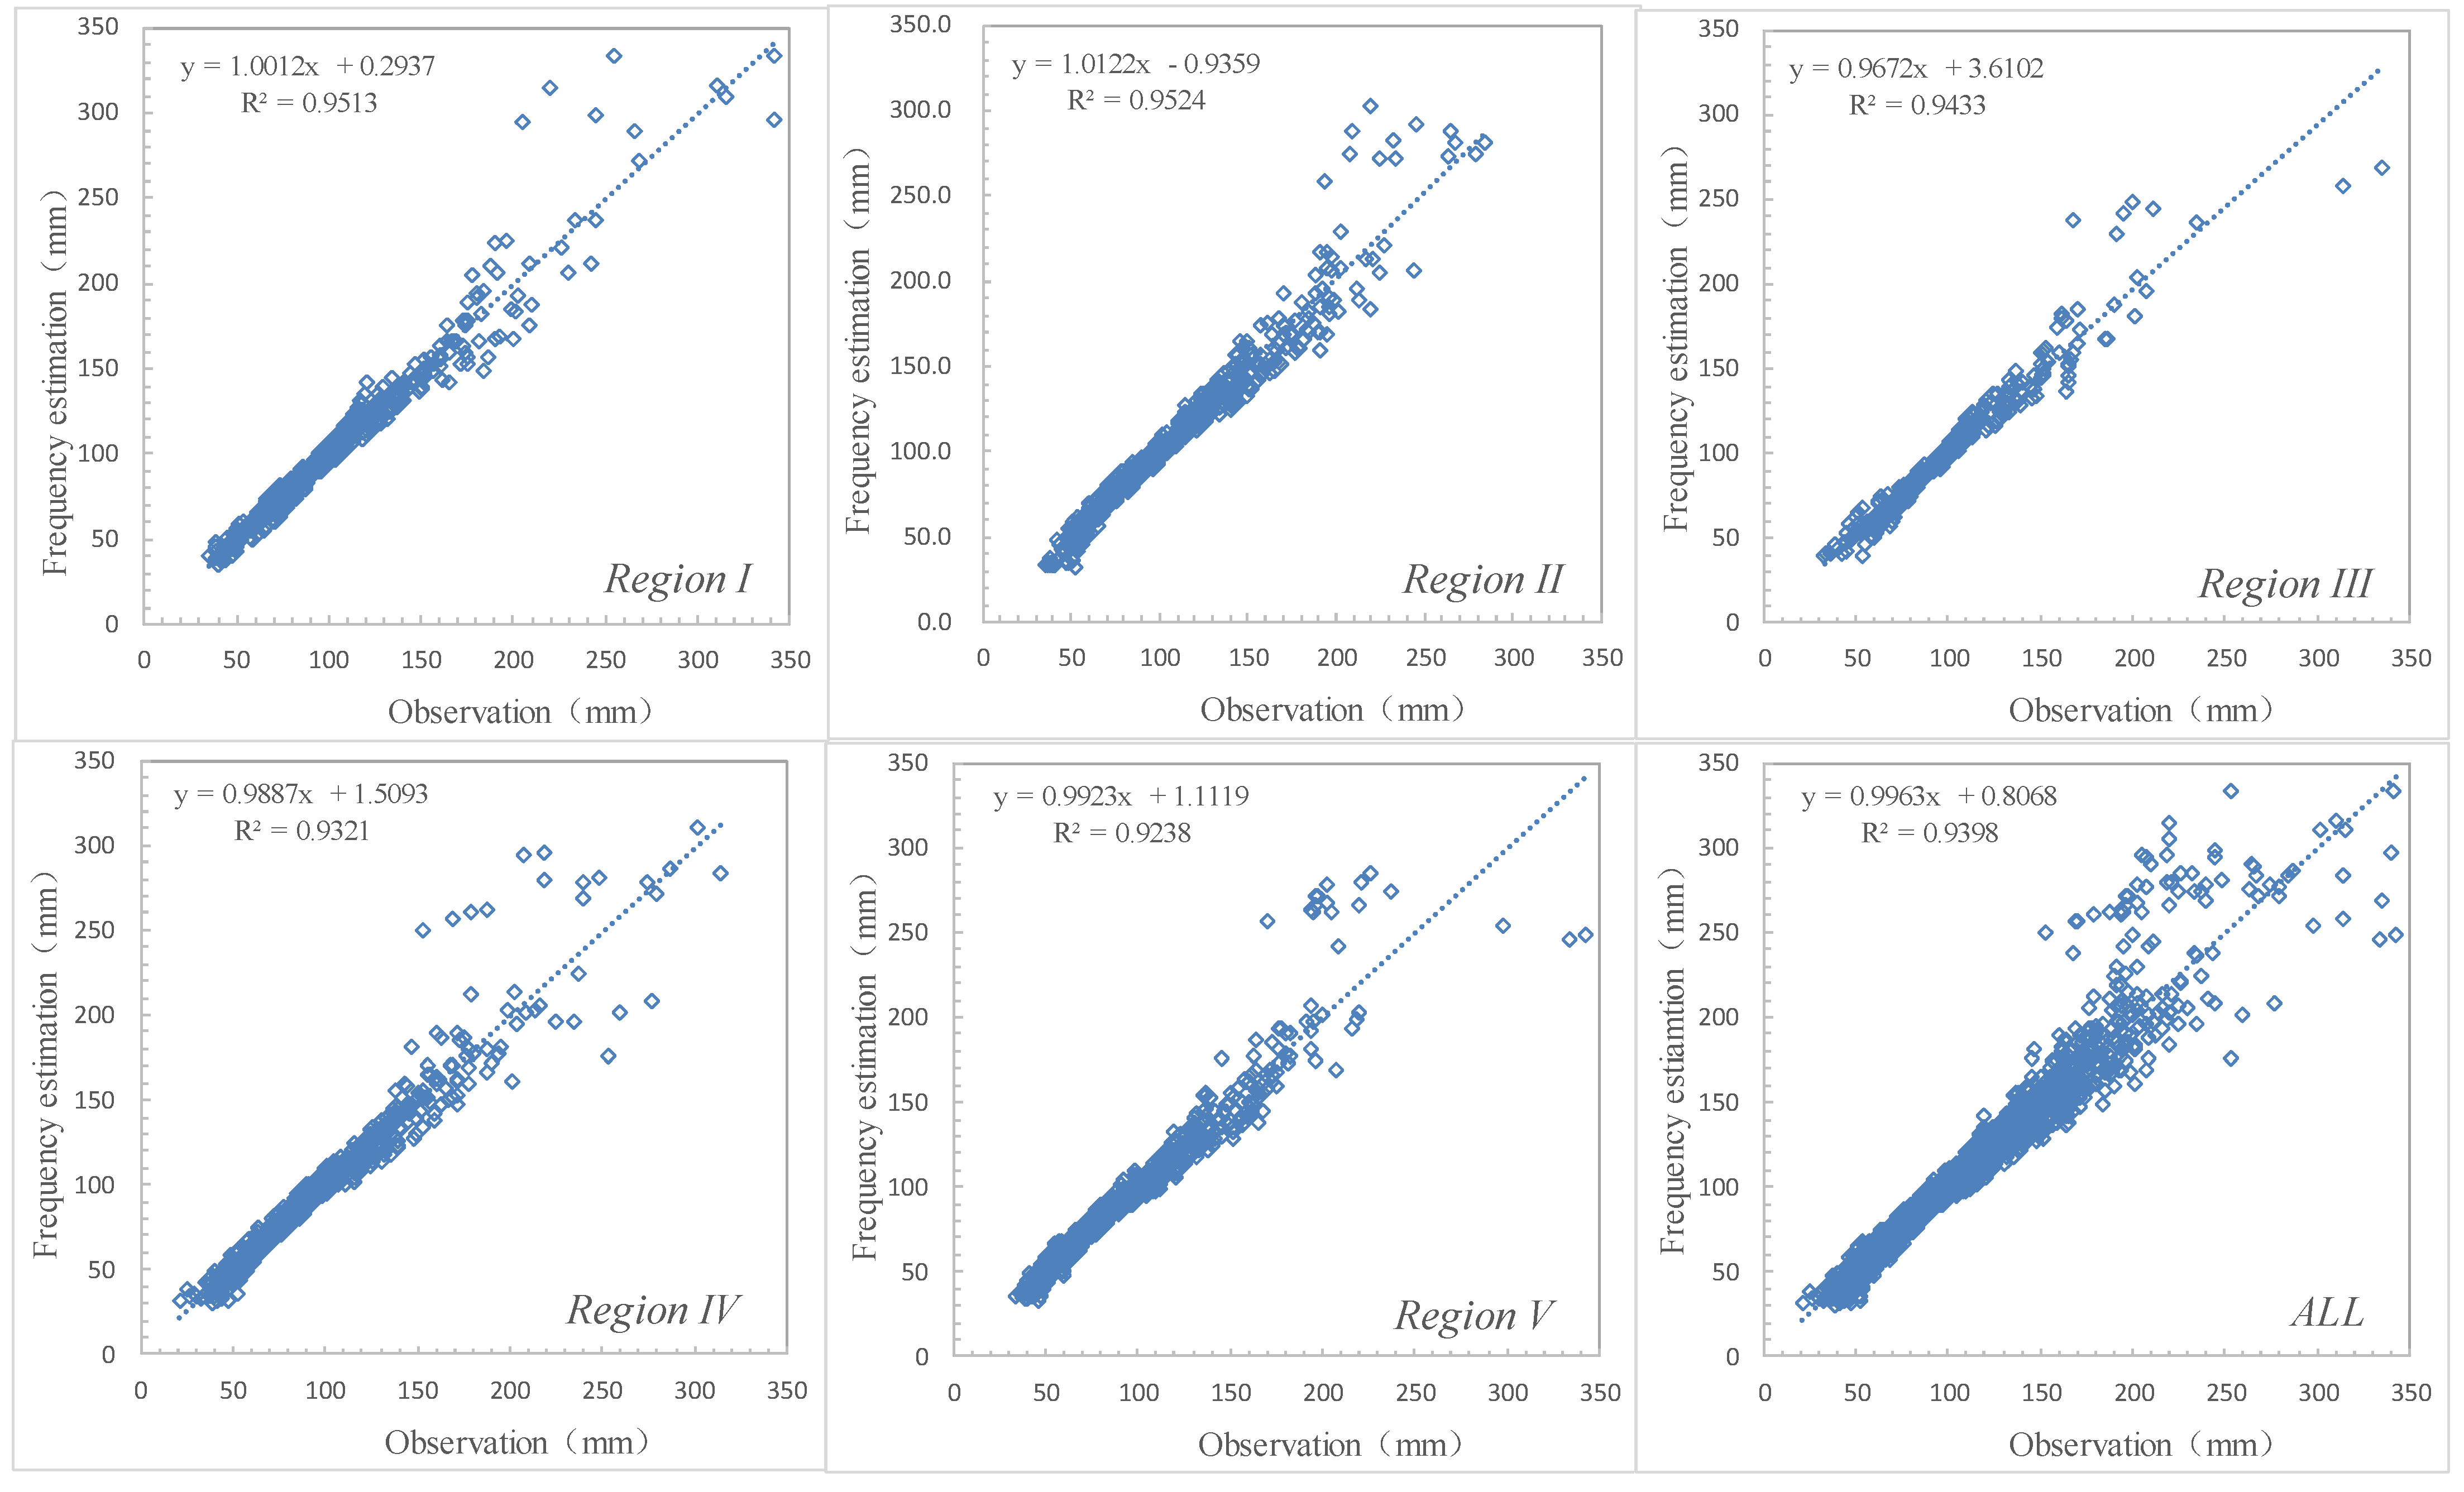
3.5. Validation of Frequency Estimations of Extreme Precipitation
4. Discussion
5. Conclusions
Supplementary Materials
Author Contributions
Funding
Informed Consent Statement
Data Availability Statement
Acknowledgments
Conflicts of Interest
References
- Lin, B.Z.; Shao, Y.H.; Yan, G.X.; Zhang, Y.H. The core research on the development of engineering hydrology calculation promoted by hydrometeorology. New development of hydrological science and technology. In China Hydrology Symposium Proceedings; Hohai University Press: Nanjing, China, 2012; pp. 50–63. [Google Scholar]
- Sun, R.C.; Yuan, H.L.; Liu, X.L.; Jiang, X.M. Evaluation of the latest satellite–gauge precipitation products and their hydrologic applications over the Huaihe River basin. J. Hydrol. 2016, 536, 302–319. [Google Scholar] [CrossRef]
- Ba, H.T.; Cholette, M.E.; Borghesani, P.; Zhou, Y.; Ma, L. Opportunistic maintenance considering non-homogenous opportunity arrivals and stochastic opportunity durations. Reliab. Eng. Syst. Safe 2017, 160, 151–161. [Google Scholar]
- Hailegeorgis, T.T.; Alfredsen, K. Analyses of extreme precipitation and runoff events including uncertainties and reliability in design and management of urban water infrastructure. J. Hydrol. 2017, 544, 290–305. [Google Scholar] [CrossRef]
- Nguyen, T.H.; Outayek, S.E.; Lim, S.H.; Nguyen, V.T.V. A systematic approach to selecting the best probability models for annual maximum rainfalls—A case study using data in Ontario (Canada). J. Hydrol. 2017, 553, 49–58. [Google Scholar] [CrossRef]
- Haddad, K.; Rahman, A. Selection of the best fit flood frequency distribution and parameter estimation procedure—A case study for Tasmania in Australia. Stoch. Environ. Res. Risk Assess. 2011, 25, 415–428. [Google Scholar] [CrossRef]
- Merz, B.; Thieken, A.H. Flood risk curves and uncertainty bounds. Nat. Hazards 2009, 51, 437–458. [Google Scholar] [CrossRef]
- Cunnane, C. Statistical Distributions for Flood Frequency Analysis; Operational Hydrological Report No. 5/33; World Meteorological Organization (WMO): Geneva, Switzerland, 1989. [Google Scholar]
- England, J.F. Flood frequency and design flood estimation procedures in the United States: Progress and challenges. Austral. J. Water Resour. 2011, 15, 33–46. [Google Scholar] [CrossRef]
- Nagy, B.K.; Mohssen, M.; Hughey, K.F.D. Flood frequency analysis for a braided river catchment in New Zealand: Comparing annual maximum and partial duration series with varying record lengths. J. Hydrol. 2017, 547, 365–374. [Google Scholar] [CrossRef]
- Mohssen, M. Partial duration series in the annual domain. In Proceedings of the 18th World IMACS and MODSIM International Congress, Cairns, Australia, 13–17 July 2009; pp. 2694–2700. [Google Scholar]
- Shao, Y.H.; Wu, J.M.; Li, M. Study on quantile estimates of extreme precipitation and their spatiotemporal consistency adjustment over the Huaihe River basin. Theor. Appl. Climatol. 2017, 127, 495–511. [Google Scholar] [CrossRef]
- Hosking, J.R.M.; Wallis, J.R. Regional Frequency Analysis: An Approach Based on L-Moments; Cambridge University Press: Cambridge, UK, 1997. [Google Scholar]
- Neves, M.; Gomes, D.P. Geo-statistics for spatial extremes: A case study of maximum annual rainfall in Portugal. Procedia Environ. Sci. 2011, 7, 246–251. [Google Scholar] [CrossRef] [Green Version]
- Kuo, Y.M.; Chu, H.J.; Pan, T.Y.; Yu, H.L. Investigating common trends of annual maximum rainfalls during heavy rainfall events in southern Taiwan. J. Hydrol. 2011, 409, 749–758. [Google Scholar] [CrossRef]
- Shao, Y.H.; Wu, J.M.; Ye, J.Y.; Liu, Y.H. Frequency analysis and its spatiotemporal characteristics of precipitation extreme events in China during 1951-2010. Theor. Appl. Climatol. 2015, 121, 775–787. [Google Scholar] [CrossRef]
- Tiwari, H.; Rai, S.P.; Sharma, N.; Kumar, D. Computational approaches for annual maximum river flow series. Ain Shams Eng. J. 2017, 8, 51–58. [Google Scholar] [CrossRef]
- Chow, V.T.; Maidment, D.R.; Mays, L.W. Applied Hydrology; McGraw-Hill: New York, NY, USA, 1988; pp. 380–385. [Google Scholar]
- Madsen, H.; Pearson, C.P.; Rosbjerg, D. Comparison of annual maximum series and partial duration series methods for modeling extreme hydrologic events 1. At-site modeling. Water Resour. Res. 1997, 33, 747–757. [Google Scholar] [CrossRef]
- Lin, B.Z.; Bonnin, G.M.; Martin, D.; Parzybok, T.M.; Riley, D. Regional frequency studies of annual extreme precipitation in the United States based on regional L-moments analysis. In Proceedings of the World Environmental and Water Resource Congress, Omaha, NE, USA, 21–25 May 2006; pp. 1–11. [Google Scholar]
- Chow, V.T. Handbook of Applied Hydrology; McGraw-Hill: New York, NY, USA, 1964. [Google Scholar]
- Wu, J.M.; Lin, B.Z.; Pu, J. Underestimation of precipitation quantile estimates based on AMS data. J. Nanjing Univ. Inf. Sci. Technol. Nat. Sci. Ed. 2016, 8, 374–379. [Google Scholar]
- Bhunya, P.K.; Berndtsson, R.; Jain, S.K.; Kumar, R. Flood analysis using negative binomial and Generalized Pareto models in partial duration series (PDS). J. Hydrol. 2013, 497, 121–132. [Google Scholar] [CrossRef]
- Karim, F.; Hasan, M.; Marvanek, S. Evaluating Annual Maximum and Partial Duration Series for Estimating frequency of Small Magnitude Floods. Water 2017, 9, 481. [Google Scholar] [CrossRef] [Green Version]
- Agilan1, V.; Umamahesh, N.V. Non-Stationary Rainfall Intensity-Duration-Frequency Relationship: A comparison between Annual Maximum and Partial Duration Series. Water Resour. Manag. 2017, 31, 1825–1841. [Google Scholar] [CrossRef]
- Begueria, S. Uncertainties in partial duration series modeling of extremes related to the choice of threshold value. J. Hydrol. 2005, 303, 215–230. [Google Scholar] [CrossRef] [Green Version]
- Nibedita, G.; Ramakar, J. Flood Frequency Analysis of Tel Basin of Mahanadi River System, India using Annual Maximum and POT Flood Data. Aquat. Procedia 2015, 4, 427–434. [Google Scholar]
- Ahmadi, F.; Radmaneh, F.; Parham, G.A.; Mirabbasi, R. Comparison of the performance of power law and probability distributions in the frequency analysis of flood in Dez Basin, Iran. Nat. Hazards 2017, 87, 1313–1331. [Google Scholar] [CrossRef]
- United States Water Resources Council. Guidelines for Determining Flood Flow Frequency; Bull. 17B; Hydrology Community, Water Resources Council: Washington, DC, USA, 1982.
- Franchini, M.; Galeati, G.; Lolli, M. Analytical derivation of the flood frequency curve through partial duration series analysis and a probabilistic representation of the runoff coefficient. J. Hydrol. 2005, 303, 1–15. [Google Scholar] [CrossRef]
- Claps, P.; Laio, F. Can continuous stream flow data support flood frequency analysis? An alternative to the partial duration series approach. Water Resour. Res. 2003, 39, 12–16. [Google Scholar] [CrossRef] [Green Version]
- Takeuchi, K. Annual maximum series and partial duration series-evaluation of Langbein’s formula and Chow’s discussion. J. Hydrol. 1984, 68, 275–284. [Google Scholar] [CrossRef]
- Ghahraman, B.; Khalili, D. A revisit to partial duration series of short duration rainfalls. Iran. J. Sci. Technol. 2004, 28, 547–558. [Google Scholar]
- SAS. SAS/STAT User’s Guide, Release 6.03; SAS Institute: Cary, NC, USA, 1988. [Google Scholar]
- Pilon, P.J.; Condie, R.; Harvey, K.D. Consolidated Frequency Analysis Package (CFA), User Manual for Version 1-DEC Pro Series; Water Resources Branch, Inland Waters Directorate, Environment Canada: Ottawa, ON, USA, 1985. [Google Scholar]
- Adamowski, K.; Liang, G.C.; Patry, G.G. Annual maxima and partial duration flood series analysis by parametric and non-parametric methods. Hydrol. Process 1998, 12, 1685–1699. [Google Scholar] [CrossRef]
- Adamowski, K. Regional analysis of annual maximum and partial duration flood data by nonparametric and L-moment methods. J. Hydrol. 2000, 229, 219–231. [Google Scholar] [CrossRef]
- Salinas, J.L.; Castellarin, A.; Kohnová, S.; Kjeldsen, T.R. Regional parent flood frequency distributions in Europe-Part 2: Climate and scale controls. Hydrol. Earth Syst. Sci. 2014, 18, 4391–4401. [Google Scholar] [CrossRef] [Green Version]
- Ball, J.; Babister, M.; Nathan, R.; Weeks, W.; Weinmann, E.; Retallick, M.; Testoni, I. Australian Rainfall and Runoff: A Guide to Flood Estimation; Geoscience Australia: Canberra, Australia, 2016.
- SL44. Regulation for Calculating Design Flood of Water Resources and Hydropower Projects in China; China WaterPower Press: Beijing, China, 2006. [Google Scholar]
- Vogel, R.M.; Fennessey, N.M. L-Moment diagrams should replace product moment diagrams. Water Resour. Res. 1993, 29, 1745–1752. [Google Scholar] [CrossRef]
- Delicadoa, P.; Goriab, M.N. A small sample comparison of maximum likelihood, moments and L-moments methods for the asymmetric exponential power distribution. Comput. Stat. Data Anal. 2008, 52, 1661–1673. [Google Scholar] [CrossRef]
- Gubareva, T.S.; Gartsman, B.I. Estimating distribution parameters of extreme hydrometeorological characteristics by L-moments method. Water Resour. 2010, 37, 437–445. [Google Scholar] [CrossRef]
- Norbiato, D.; Borga, M.; Sangati, M.; Zanon, F. Regional Frequency Analysis of Extreme Precipitation in the eastern Italian Alps and the August 29, 2003 Flash Flood. J. Hydrol. 2007, 345, 149–166. [Google Scholar] [CrossRef]
- Zakaria, Z.A.; Shabri, A. Regional frequency analysis of extreme rainfalls using partial L-moments method. Theor. Appl. Climatol. 2013, 113, 83–94. [Google Scholar] [CrossRef]
- Du, H.; Xia, J.; Zeng, S.D. Regional frequency analysis of extreme precipitation and its spatio-temporal characteristics in the Huai River Basin, China. Nat. Hazards 2014, 70, 195–215. [Google Scholar] [CrossRef]
- Neykov, N.M.; Neytchev, P.N.; Gelder, P.H.A.J.M.V.; Todorov, V.K. Robust detection of discordant sites in regional frequency analysis. Water Resour. Res. 2007, 43, 1–10. [Google Scholar] [CrossRef] [Green Version]
- Yang, T.; Shao, Q.X.; Hao, Z.C.; Chen, X.; Zhang, Z.X.; Xu, C.Y.; Sun, L.M. Regional frequency analysis and spatio-temporal pattern characterization of rainfall extremes in the Pearl River Basin, China. J. Hydrol. 2010, 380, 386–405. [Google Scholar] [CrossRef]
- Hu, C.; Xia, J.; She, D.X.; Xu, C.Y.; Zhang, L.P.; Song, Z.H.; Zhao, L. A modified regional L-moment method for regional extreme precipitation frequency analysis in the Songliao River Basin of China. Atmos. Res. 2019, 230, 104629. [Google Scholar] [CrossRef]
- Deng, P.D. Review on probability and application of two sampling methods for urban storm. Water Wastewater Eng. 2006, 32, 39–42. [Google Scholar]


| N/A | 1 | 1.0 | 0.0 * |
| 1.44 | 2 | 0.50 | 0.50 |
| 4.48 | 5 | 0.20 | 0.80 |
| 9.49 | 10 | 0.10 | 0.90 |
| 24.50 | 25 | 0.04 | 0.96 |
| 49.50 | 50 | 0.02 | 0.98 |
| Test Index | Distribution | Homogeneous Region | ||||
|---|---|---|---|---|---|---|
| I | II | III | IV | V | ||
| Z | GLO | −0.17 | 2.63 | −0.28 | 2.00 | 2.47 |
| GEV | −1.39 | 0.26 | −1.66 | 0.05 | 0.37 | |
| GNO | −2.05 | −0.25 | −2.05 | −0.78 | −0.56 | |
| GPA | −4.46 | −5.11 | −4.87 | −4.71 | −4.79 | |
| PE3 | −3.21 | −1.35 | −2.83 | −2.27 | −2.24 | |
| Zmin | GLO | GNO | GLO | GEV | GEV | |
| RMSE | GLO | 0.0404 | 0.0650 | 0.0401 | 0.0591 | 0.0655 |
| GEV | 0.0424 | 0.0445 | 0.0509 | 0.0395 | 0.0447 | |
| GNO | 0.0834 | 0.0466 | 0.0604 | 0.0452 | 0.0470 | |
| GPA | 0.0555 | 0.0885 | 0.1239 | 0.0811 | 0.0773 | |
| PE3 | 0.1057 | 0.0546 | 0.0797 | 0.0632 | 0.0628 | |
| RMSEmin | GLO | GEV | GLO | GEV | GEV | |
| Region | Return Period (R.P.)/Exceedance Probability (E.P.) | |||||
|---|---|---|---|---|---|---|
| 2-yr | 5-yr | 10-yr | 25-yr | 50-yr | 100-yr | |
| 0.50 | 0.20 | 0.10 | 0.04 | 0.02 | 0.01 | |
| I | 0.518 | 0.210 | 0.124 | 0.051 | 0.022 | 0.012 |
| II | 0.505 | 0.201 | 0.106 | 0.045 | 0.021 | 0.011 |
| III | 0.500 | 0.201 | 0.120 | 0.044 | 0.020 | 0.010 |
| IV | 0.508 | 0.217 | 0.101 | 0.041 | 0.022 | 0.013 |
| V | 0.502 | 0.202 | 0.106 | 0.044 | 0.021 | 0.009 |
| Average E.P. | 0.507 | 0.206 | 0.111 | 0.045 | 0.021 | 0.011 |
| Real R.P. | 1.97-yr | 4.85-yr | 8.99-yr | 22.25-yr | 47.49-yr | 91.87-yr |
| Site Name | Quantile Estimates Based on AES Data | |||||
|---|---|---|---|---|---|---|
| 2-yr | 5-yr | 10-yr | 25-yr | 50-yr | 100-yr | |
| Fengxian | 92.2 | 117.3 | 139.7 | 175.1 | 206.8 | 243.3 |
| Peixian | 98.4 | 125.2 | 149.1 | 186.9 | 220.7 | 259.7 |
| Pizhou | 106.6 | 135.6 | 161.5 | 202.4 | 239.0 | 281.2 |
| Xuzhou | 103.2 | 131.3 | 156.4 | 196.0 | 231.5 | 272.4 |
| Xinyi | 98.2 | 124.9 | 148.8 | 186.4 | 220.2 | 259.1 |
| Donghai | 98.9 | 125.9 | 149.9 | 187.9 | 221.9 | 261.1 |
| Suining | 115.4 | 146.8 | 174.9 | 219.2 | 258.9 | 304.6 |
| Suyu | 116.5 | 148.2 | 176.5 | 221.2 | 261.3 | 307.5 |
| Siyang | 104.9 | 133.4 | 158.9 | 199.1 | 235.2 | 276.7 |
| Sihong | 104.5 | 132.7 | 154.9 | 185.5 | 209.6 | 234.5 |
| Quantile estimates based on AMS data and Chow’s equation | ||||||
| Fengxian | 91.0 | 116.6 | 139.1 | 174.9 | 207.9 | 246.9 |
| Peixian | 99.4 | 127.4 | 152.0 | 191.1 | 227.2 | 269.8 |
| Pizhou | 106.0 | 135.9 | 162.1 | 203.8 | 242.2 | 287.6 |
| Xuzhou | 103.9 | 133.2 | 158.8 | 199.7 | 237.3 | 281.9 |
| Xinyi | 96.8 | 124.1 | 148.0 | 186.1 | 221.2 | 262.7 |
| Donghai | 99.0 | 126.9 | 151.4 | 190.3 | 226.2 | 268.6 |
| Suining | 111.7 | 143.2 | 170.8 | 214.7 | 255.2 | 303.1 |
| Suyu | 111.9 | 143.4 | 171.0 | 215.0 | 255.5 | 303.5 |
| Siyang | 105.6 | 135.3 | 161.4 | 202.9 | 241.1 | 286.4 |
| Sihong | 100.0 | 128.2 | 152.9 | 192.2 | 228.5 | 271.4 |
| Mean RE (%) | 1.72 | 1.60 | 1.41 | 1.68 | 2.49 | 3.64 |
| Homogeneous Regions | RE (%) | RMSE (mm) | r |
|---|---|---|---|
| Region I | 5.47 | 0.101 | 0.975 |
| Region II | 5.31 | 0.093 | 0.975 |
| Region III | 4.77 | 0.09 | 0.971 |
| Region IV | 5.88 | 0.118 | 0.965 |
| Region V | 5.96 | 0.119 | 0.961 |
| All | 5.56 | 0.107 | 0.969 |
Publisher’s Note: MDPI stays neutral with regard to jurisdictional claims in published maps and institutional affiliations. |
© 2021 by the authors. Licensee MDPI, Basel, Switzerland. This article is an open access article distributed under the terms and conditions of the Creative Commons Attribution (CC BY) license (https://creativecommons.org/licenses/by/4.0/).
Share and Cite
Shao, Y.; Zhao, J.; Xu, J.; Fu, A.; Wu, J. Revision of Frequency Estimates of Extreme Precipitation Based on the Annual Maximum Series in the Jiangsu Province in China. Water 2021, 13, 1832. https://doi.org/10.3390/w13131832
Shao Y, Zhao J, Xu J, Fu A, Wu J. Revision of Frequency Estimates of Extreme Precipitation Based on the Annual Maximum Series in the Jiangsu Province in China. Water. 2021; 13(13):1832. https://doi.org/10.3390/w13131832
Chicago/Turabian StyleShao, Yuehong, Jun Zhao, Jinchao Xu, Aolin Fu, and Junmei Wu. 2021. "Revision of Frequency Estimates of Extreme Precipitation Based on the Annual Maximum Series in the Jiangsu Province in China" Water 13, no. 13: 1832. https://doi.org/10.3390/w13131832
APA StyleShao, Y., Zhao, J., Xu, J., Fu, A., & Wu, J. (2021). Revision of Frequency Estimates of Extreme Precipitation Based on the Annual Maximum Series in the Jiangsu Province in China. Water, 13(13), 1832. https://doi.org/10.3390/w13131832