Article

Untapped Potential of Moving Bed Biofilm Reactors with Different Biocarrier Types for Bilge Water Treatment: A Laboratory-Scale Study

by
Aikaterini A. Mazioti
1,*,
Loukas E. Koutsokeras
2,3,
Georgios Constantinides
2,3 and
Ioannis Vyrides
1
1
Department of Chemical Engineering, Cyprus University of Technology, Anexartisias 57 Str., Lemesos 3036, Cyprus
2
Department of Mechanical Engineering and Materials Science and Engineering, Cyprus University of Technology, Kitiou Kyprianou 45, Lemesos 3041, Cyprus
3
Research Unit for Nanostructured Materials Systems, Cyprus University of Technology, Kitiou Kyprianou 36, Lemesos 3041, Cyprus
*
Author to whom correspondence should be addressed.
Water 2021, 13(13), 1810; https://doi.org/10.3390/w13131810
Submission received: 30 April 2021 / Revised: 8 June 2021 / Accepted: 28 June 2021 / Published: 29 June 2021
(This article belongs to the Section Wastewater Treatment and Reuse)

Abstract

:
Two labscale aerobic moving bed biofilm reactor (MBBR) systems, with a different type of biocarrier in each (K3 and Mutag BioChip), were operated in parallel for the treatment of real saline bilge water. During the operation, different stress conditions were applied in order to evaluate the performance of the systems: organic/hydraulic load shock (chemical oxygen demand (COD): 9 g L−1; hydraulic retention time (HRT): 48–72 h) and salinity shock (salinity: 40 ppt). At the same time, the microbiome in the biofilm and suspended biomass was monitored through 16S rRNA gene analysis in order to describe the changes in the microbial community. The dominant classes were Alphaproteobacteria (families Rhodospirillaceae and Rhodobacteraceae) and Bacteroidia (family Lentimicrobiaceae), being recorded at high relative abundance in all MBBRs. The structure of the biofilm was examined and visualized with scanning electron microscopy (SEM) analysis. Both systems exhibited competent performance, reaching up to 86% removal of COD under high organic loading conditions (COD: 9 g L−1). In the system in which K3 biocarriers were used, the attached and suspended biomass demonstrated a similar trend regarding the changes observed in the microbial communities. In the bioreactor filled with K3 biocarriers, higher concentration of biomass was observed. Biofilm developed on Mutag BioChip biocarriers presented lower biodiversity, while the few species identified in the raw wastewater were not dominant in the bioreactors. Through energy-dispersive X-ray (EDX) analysis of the biofilm, the presence of calcium carbonate was discovered, indicating that biomineralization occurred.

1. Introduction

Industrial wastewater has always been a challenge for biological treatment processes. Wastewater produced by industrial applications usually contains hazardous substances, which directly affect microbial growth [1]. Though biological processes may decrease the treatment costs of industrial wastewater, it is usually hard to achieve a stable performance while ensuring that disposal standards are met [2]. Sudden changes in the produced wastewater characteristics (e.g., volume, toxicity, composition, etc.) are frequently the cause leading to unstable performance [3]. In the last decade, as the next-generation sequencing (NGS) analysis of environmental samples has become more accessible, it is possible to identify the microbial groups involved in a treatment process [4]. With this tool available, the potential of biological processes can be further explored. The performance of the bioprocess and the response of the microbial community to inflow wastewater changes can be monitored [5] at a small scale, where real industrial conditions can be simulated. By determining the microbial diversity and monitoring adaptation, we can consolidate our understanding of the bioprocess and guarantee that the core mechanisms for biodegradation exist in our process.
In the present study, an industrial wastewater type that is produced by the shipping industry at large volumes on annual basis was examined [6]. Bilge wastewater (or bilge water) is saline, has a high content of organic compounds, and is produced by every type of vessel; it is a mixture of gray waters, seawater, and rinsing water enriched with various liquids and chemicals (such as cleaning and degreasing solvents, grease, hydraulic fluids, detergents, oil additives, and others) used during the operation and maintenance of the ship [7]. Bilge wastewater’s main characteristics are directly related to the vessel (i.e., age, use, type of cargo transported, etc.), and present high differentiation from ship to ship. Furthermore, the complexity of this wastewater type may alter over time, as different operational or maintenance activities may occur on the vessel. With these particularities, it is hard to establish a biological treatment process with competent and stable performance, either in onshore facilities or aboard a vessel [6,8]. Though bilge wastewater is a highly toxic type of wastewater [8], its biodegradation has been studied in the past, pointing out several isolated strains and groups of microorganisms involved in the process [8,9,10,11,12,13].
To propose an efficient treatment method, moving bed biofilm reactors (MBBRs) were chosen for investigation. MBBRs are well known for properties such as robustness, small space requirements, and high performance [14]—achieved by developing biomass on suspended biocarriers in the form of biofilm [15,16]. In recent studies examining aerobic MBBRs for wastewater treatment, microbial diversity has been examined under different influencing parameters—such as treatment temperature [17], the presence of pesticides in wastewater [18], and different biocarrier types for (1) textile wastewater treatment [19] and (2) palm oil mill effluent treatment [20]—providing valuable knowledge regarding species presence and succession over time. A relevant study of high impact and novelty managed to relate the microbial dynamics to the micropollutants’ biodegradation kinetics under feast–famine adaptation periods in MBBRs [21], tracing a new pathway for the understanding of—and designing of tools for—MBBRs. Through another approach, and with the use of imported datasets, NGS analysis and targeted microorganism identification could also be used to predict and evaluate the operational performance of systems for specific pollutants (such as micropollutants), as proposed by Wolff et al. [22]. Regarding oily types of saline wastewater and treatment with aerobic processes involving biofilms, Sun et al. [23] tested a biofilm-MBR system for the treatment of ships’ wastewater streams. Similarly, Mancini et al. [24] operated a pilot MBR for low-strength bilge water treatment (chemical oxygen demand (COD) ≈ 1 g L−1). On the other hand, Vyrides et al. [25] tested three pilot-scale MBBRs operated with Mutag BioChips at different filling ratios (10%, 20%, and 40%), treating high-strength bilge water. To mention other studies, Ahmadi et al. [26] used bioaugmentation in MBBRs to treat saline petrochemical wastewater; Yu et al. [27] monitored the membrane biofouling of an MBBR-MBR treating saline wastewater; and Xu et al. [28] recently tested a halophilic MBBR-MBR for the treatment of saline wastewater. There is a gap in knowledge regarding MBBRs’ potential to treat real, high-strength saline bilge water, and there are no insights regarding biofilm microbial communities’ formation and adaptation to the operational conditions.
The aim of this study was to investigate the potential of lab-scale MBBRs to treat real, high-strength saline bilge water, as well as to determine the microbial communities involved in the process. For this reason, three lab-scale MBBRs were operated under continuous flow mode and aerobic conditions. Two different biocarrier types were compared to define their suitability for efficient performance, and to compare the biofilm formed on each one. Two MBBRs containing K3-type biocarriers were operated in series (System A), and one MBBR containing Mutag BioChip biocarriers (System B) was operated in parallel with the first reactor of System A. Different operational conditions were tested, creating an organic/hydraulic load shock and a salinity shock. These two case scenarios are likely to occur in large-scale applications, and may disrupt the biological process. During these time periods, the microbial diversity in the biofilm was examined, along with the suspended fraction of the biomass, with 16S rRNA gene analysis. From each bioreactor, the biocarriers were observed, and the biofilm structure was examined with scanning electron microscopy (SEM). To the best of our knowledge this is the first study examining the microbial profiles for different types of carriers and under different operational conditions (organic load, salinity) in MBBRs treating real bilge water.

2. Materials and Methods

2.1. Chemicals and Analytical Methods

For the measurement of temperature, salinity, pH, and DO, portable instruments were used (Consort C6030) coupled with the appropriate electrodes.
Quantification of total suspended solids (TSS) and mixed liquor suspended solids (MLSS) was performed according to standard methods [29]. The quantification of the biofilm as attached biomass was calculated as in a previous study [30] for K3-type biocarriers, and also by removing the biofilm and measuring the dried weight difference (105 °C for ≥1 h), as described by Falås et al. [31]. For the quantification of biomass attached to Mutag-BioChip-type carriers—and as the biofilm could not be removed due to biocarrier morphology—the dry weight of 10 biocarriers sampled from the bioreactor was compared to the average dry weight (105 °C for ≥1 h) of 10 biofilm-free biocarriers [32]. The weight difference was calculated in three replicates for each biocarrier type.
For the quantification of chemical oxygen demand in bilge wastewater, the closed reflux, colorimetric method was used, as proposed by standard methods [29]. In order to take into consideration the oxidation of chloride ions, an appropriate modification to the method occurred, as described in a previous study [8]. The absorbance of digested samples was measured at 600 nm or 420 nm using a portable spectrophotometer (Hach DR1900).

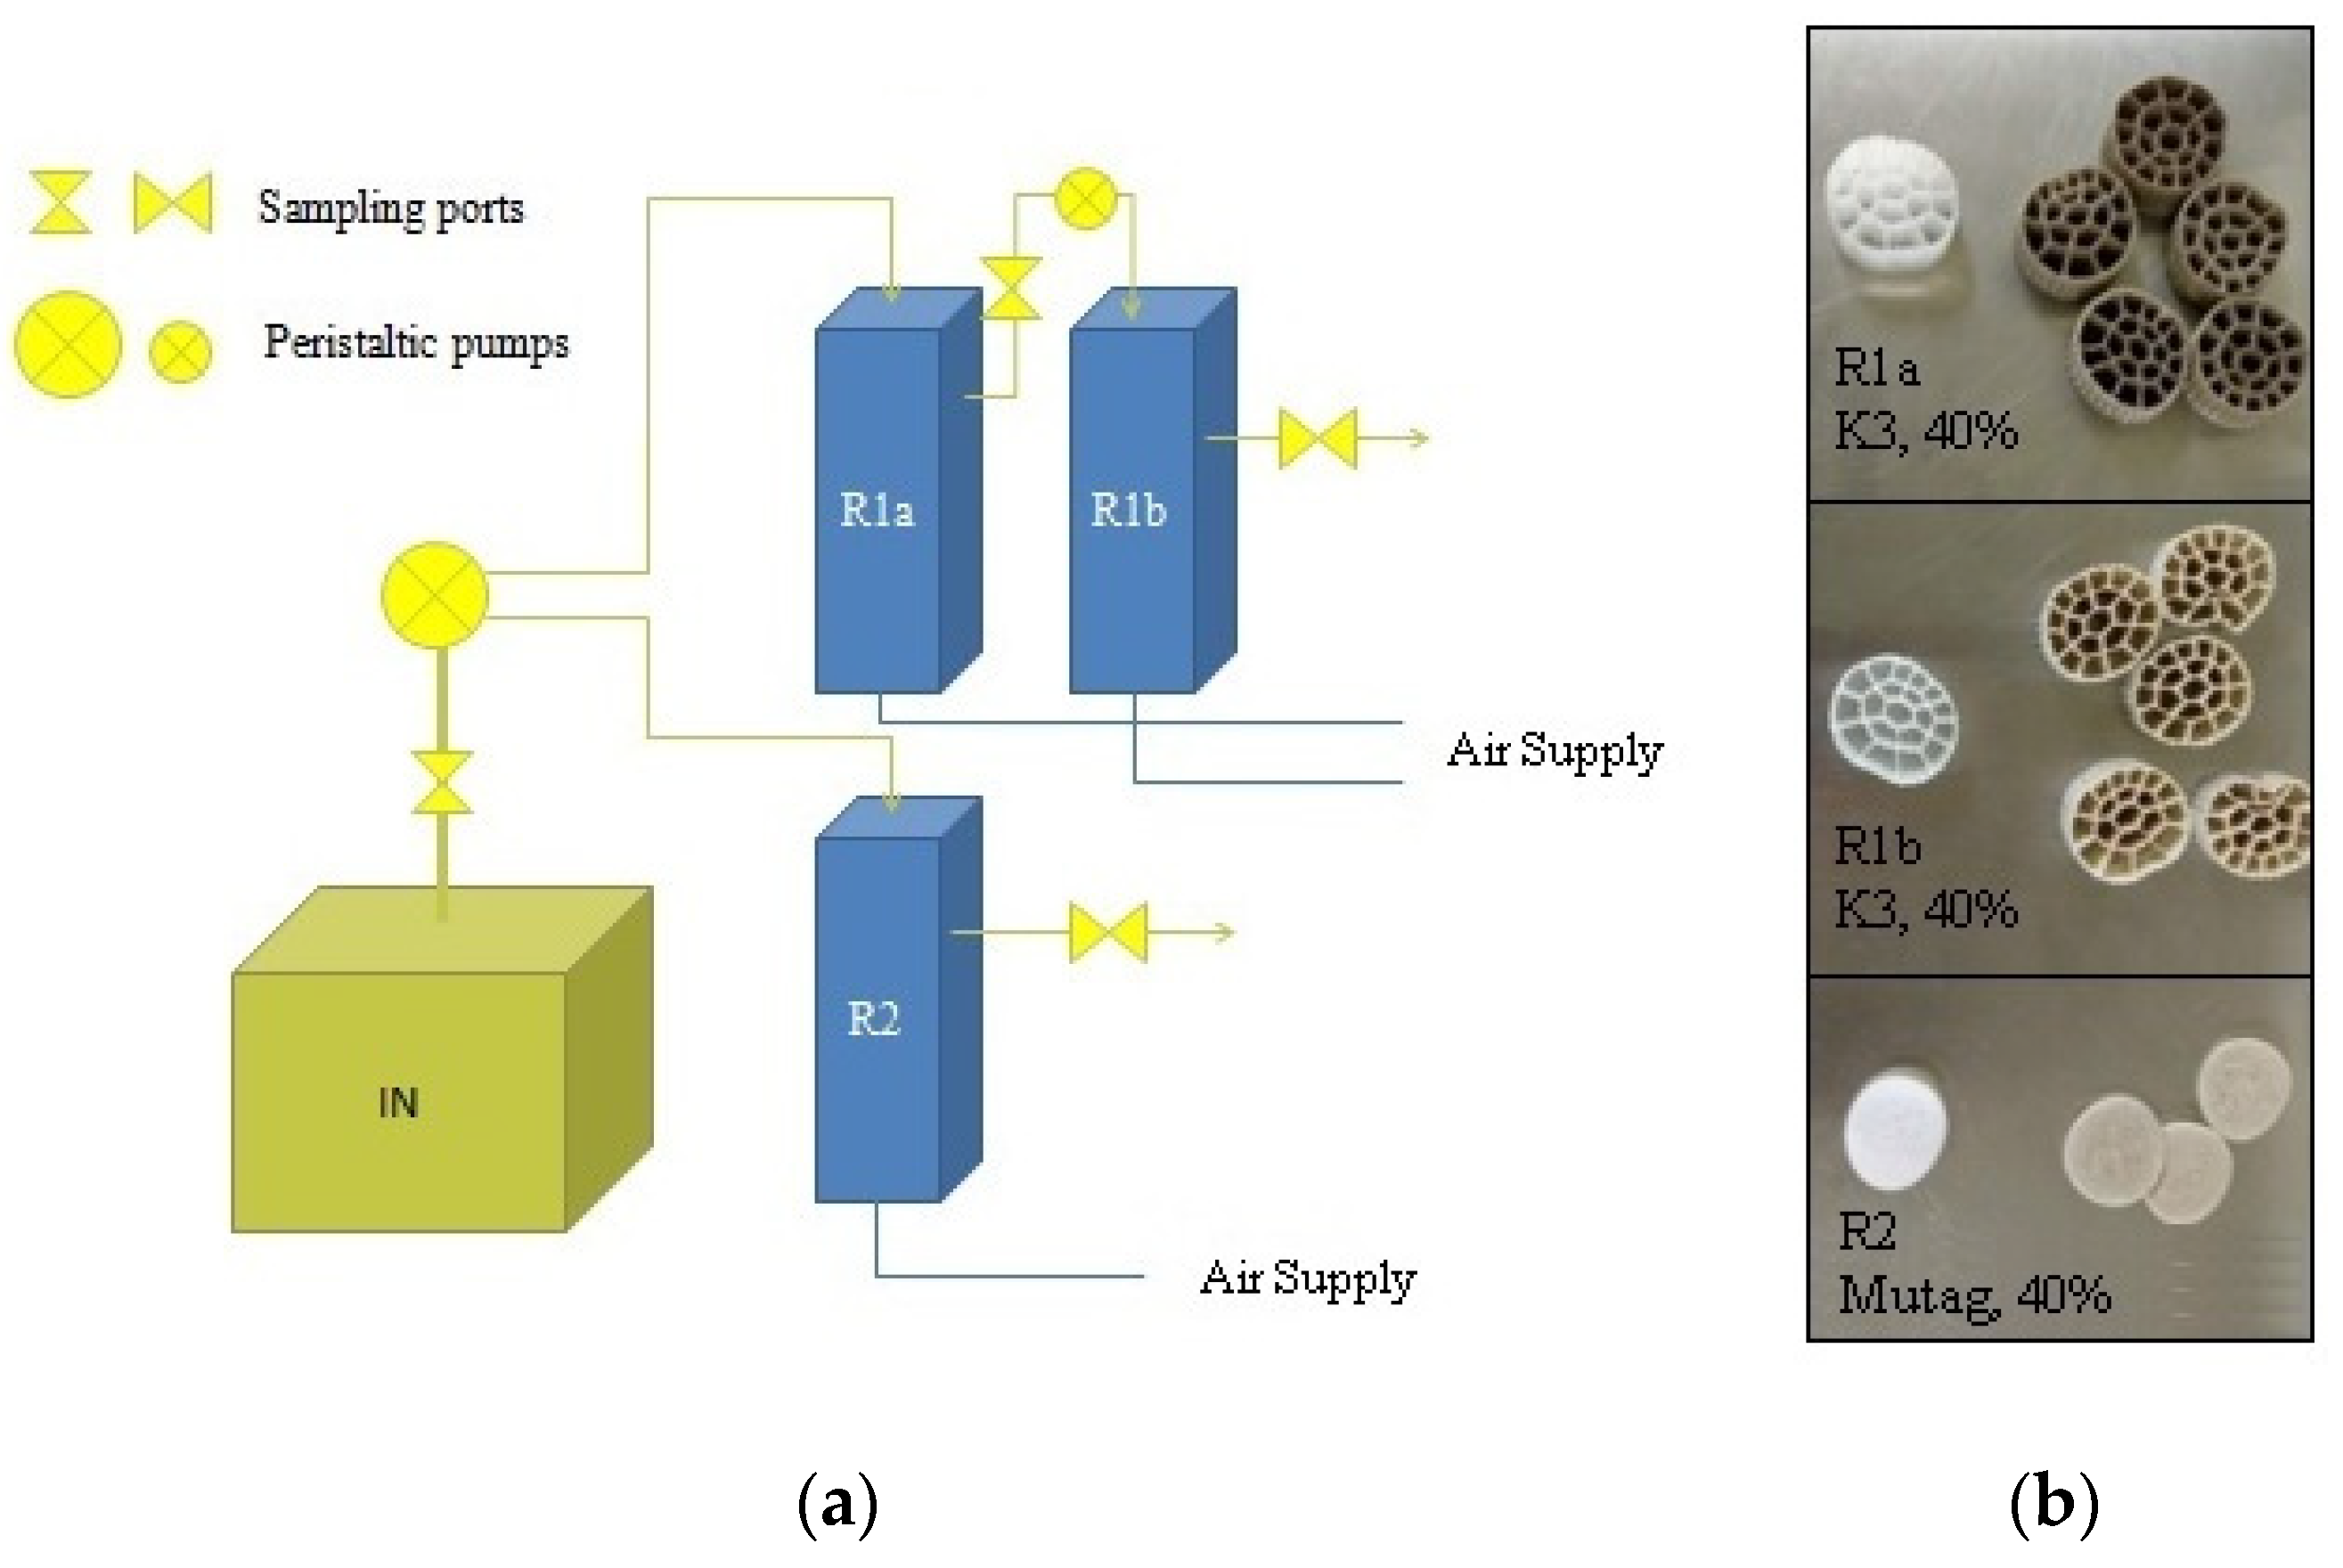
2.2. MBBR Setup and Operation

Two systems were created and operated under continuous flow mode (Figure 1) and stable room temperature (22 ± 2 °C). System A consisted of two MBBRs operated in series (Reactor 1a (R1a), and Reactor 1b (R1b)), filled at a ratio of 40% with K3-type polyethylene biocarriers (diameter 25 mm; height 12 mm; purchased from Cz Garden Supply). System B consisted of one MBBR (Reactor 2 (R2)), filled at a ratio of 40% with Mutag-BioChip-type polyethylene biocarriers (diameter 25 mm; height 1 mm; provided by Ecofuel Ltd.). These two biocarriers were chosen for comparison as they present a significant structural difference (height) and promote a different means of biofilm development. In K3 biocarriers, the biofilm is developed in the large and smooth internal protected area of the biocarrier, while in Mutag BioChip biocarriers, the biofilm is developed in the pores of the media, in a more restricted space. Each bioreactor consisted of a rectangular tank made of glass, with a working volume of 3 L. The top of each bioreactor was closed with a removable plastic lid. The desired flow rate from the equilibration tank to reactors R1a and R2, as well as from R1a to R1b, was achieved and controlled with an Ismatec Reglo ICC peristaltic pump, operated with 2.79-mm PVC solvent/hydrocarbon Ismatec tubing (Cole-Parmer, Vernon Hills, IL, USA). Continuous aeration provided at the lower part of each MBBR (using Sera Air 257 R pumps; Sera, Germany) ensured aerobic conditions, as well as appropriate mixing conditions of the wastewater and constant suspension and circulation of the biocarriers in the bioreactors. Dissolved oxygen (DO) levels in the liquid phase of each bioreactor were 2–3 mg L−1 throughout the experiment.
For each system, operational periods are described in Table 1. For System A, the startup began in October 2019, and the system was operated for 223 days, while for System B the startup began in March 2020, and operation lasted for 109 days. Since March 2020, the two systems were operated in parallel; thus, R1a and R2 had the same inflow wastewater and identical operational conditions.
Both systems were supplied with real industrial wastewater occurring from trade ship bilges (provided by Ecofuel LTD, Zygi, Cyprus). The wastewater was sampled on a weekly basis and stored in the laboratory at room temperature in sealed tanks until being placed in the systems equilibration tank. The wastewater’s main characteristics were its high salinity (20–40 ppt) and high COD levels (2–9 g L−1) (see Table 1).
All bioreactors were monitored for their biodegradation performance, measuring basic parameters on a routine weekly basis (i.e., COD, pH, salinity, DO). Biomass concentration measurements, microbial profile analysis, SEM observations, and toxicity tests were conducted less frequently, with sampling times shown in Table 1.

2.3. Microbial Profile Analysis

2.3.1. Sampling Campaigns

Two next-generation sequencing batch analyses were performed; the first was to examine the biomass alteration in System A after an organic and hydraulic load shock (A), while the second was to compare the alterations observed in both systems over a longer operational period during a salinity shock and an organic and hydraulic load shock (B). Batch 1: During this sampling campaign, the suspended and attached biomass from System A was examined 31 days after the startup, and after a 10-day shock period, where the systems’ HRT decreased significantly and the inflow COD increased. Batch 2: During this sampling campaign, the suspended and attached biomass of System A and System B, as well as the biodiversity of the wastewater, was examined. Three sampling times were chosen (Table 1)—Sampling Time I: System A, operational day 173, and System B, operational day 61; Sampling Time II: System A, operational day 209, and System B, operational day 96; and Sampling Time IIΙ: System A, operational day 223, and System B, operational day 109.

2.3.2. Next-Generation Sequencing

From all collected samples, total genome DNA was extracted in our laboratory using the genomic DNA kit for stool samples (NucleoSpin DNA Stool). For Batch 1, the sequencing analysis was performed by DNASense (Denmark), as described in a previous work [8]. For Batch 2, the sequencing analysis was performed by Novogene Europe (UK), and the main analysis steps are summarized below. For amplicon generation, 16S rRNA genes of distinct regions V3–V4 were amplified using specific primers: (341F) CCTAYGGGRBGCASCAG, and (806R) GGACTACNNGGGTATCTAAT. All polymerase chain reactions (PCRs) were carried out with Phusion® High-Fidelity PCR Master Mix (New England Biolabs). For the quantification and qualification of PCR products, a loading buffer was mixed with PCR products, and electrophoresis on 2% agarose gel was operated for detection. Samples with bright main strips between 400 and 450 bp were chosen for further experiments. For PCR product mixing and purification, PCR products were mixed in equidensity ratios, and then the mixture of PCR products was purified using a Qiagen Gel Extraction Kit (Qiagen, Hilden, Germany). Sequencing libraries were generated using the NEBNext Ultra DNA Library Pre ® Kit for Illumina, following the manufacturer’s recommendations, and index codes were added. The library quality was assessed on the Qubit@ 2.0 Fluorometer (Thermo Scientific, Waltham, MA, USA) and Agilent Bioanalyzer 2100 system. Finally, the library was sequenced on an Illumina platform and 250-bp paired-end reads were generated. Paired-end reads were assigned to samples based on their unique barcodes, and then truncated by cutting off the barcode and the primer sequence. Paired-end reads were merged using FLASH [33]—which was designed to merge paired-end reads when at least some of the reads overlap the read generated from the opposite end of the same DNA fragment—and the splicing sequences were called raw tags. Quality filtering on the raw tags was performed under specific filtering conditions in order to obtain the high-quality clean tags [34] according to the QIIME quality-controlled process [35]. The tags were compared with the reference database using the UCHIME algorithm [36] to detect chimera sequences, and then the chimera sequences were removed [37]; then, the effective tags were finally obtained. For the production of operational taxonomic units (OTUs), sequence analysis was performed using UPARSE software [38]. Sequences with ≥97% similarity were assigned to the same OTUs.

2.4. Scanning Electron Microscopy

Scanning electron microscopy (SEM) was used to evaluate the biofilm formation on the biocarriers at two different time periods (Sampling Times II and IIΙ; see Section 2.3.1.). The biofilm was immobilized by immersing each biocarrier in a 2.5% glutaraldehyde with 0.05 M KNO3 solution for 4 h. Then, the biofilm was dehydrated by immersing each biocarrier in a sequence of 30%, 50%, 70%, 85%, 90%, and 100% ethanol solutions (15 min in each solution), and the biocarriers were finally dried overnight at 35 °C [39,40,41]. Biocarriers and parts of biocarriers were mounted on aluminum stubs using double-sided carbon tape, and then sputter-coated with a few nm of Au (SC7640 Sputter Coater, Quorum Technologies, Kent, UK) to prevent charging effects. Images were collected using the secondary electron detector at 20 kV acceleration voltage and at various working distances between 10 and 20 mm. The elemental composition of the biofilm and biocarriers was examined via energy-dispersive X-ray Spectroscopy (EDX) using the integrated EDAX system and software in SEM.

2.5. Equations

COD removal in batch reactors was calculated according to Equation (1):
Removal   % = ( 1 COD out COD in ) × 100
where CODin is the COD value at the inflow wastewater of an MBBR (mg L−1), and CODout is the value at the outflow wastewater of an MBBR (mg L−1).

3. Results

3.1. Performance of MBBRs
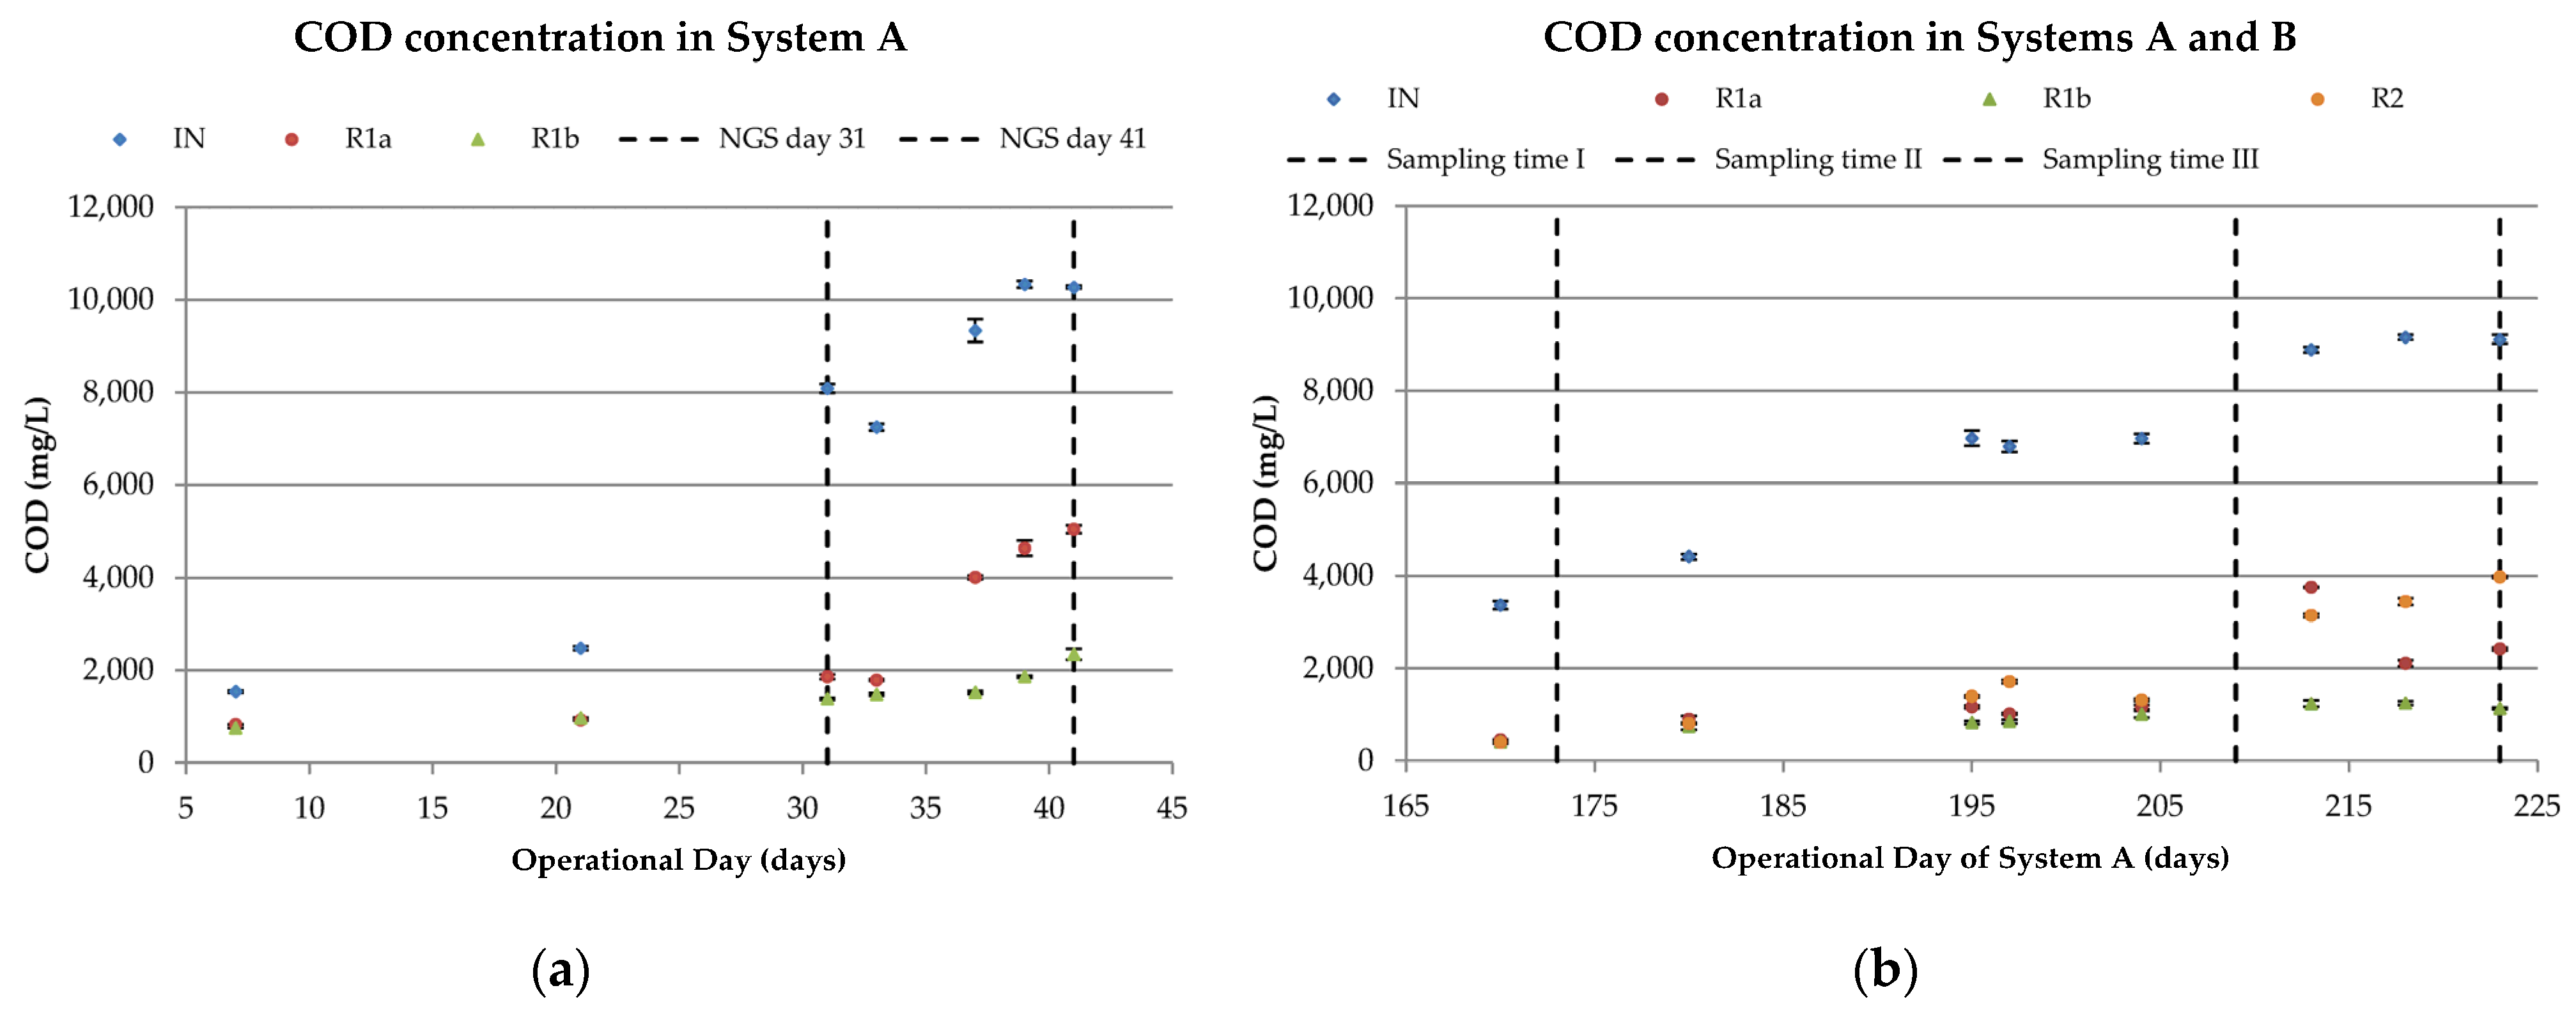
3.1.1. COD Removal

The concentration of dissolved COD in the liquid phase in both systems is presented in Figure 2. For the first period examined, where System A was operated alone (Figure 2a), the system achieved up to 78.6 ± 4.1% COD removal during the hydraulic and organic load shock (A) between the 31st and 41st days of operation (HRT: 2 days in each reactor; inflow COD: 9054 ± 608 mg L−1). For the same period, the removal observed in the first and second reactors (R1a and R1b) was 56.5 ± 10.9% and 47.6 ± 16.0% COD removal, respectively. The contribution of both bioreactors was important in preserving the outflow COD of the system at a concentration of 1908 ± 240 mg L−1. For the second period, where Systems A and B were operated in parallel (Figure 2b), the observed removal during the salinity load shock (salinity: 40 ppt; HRT: 5 days in each reactor; inflow COD: 6286 ± 626 mg L−1) was 86.2 ± 2.2% and 78.7 ± 5.1% COD removal for Systems A and B, respectively. It is worth mentioning that System A had double the total HRT (10 days) compared to System B (5 days), as System B consisted of only one MBBR. In reactors R1a and R2, where operational parameters were identical but the type of biocarrier differed (K3 in R1a and Mutag BioChip in R2), 82.8 ± 2.7% and 78.7 ± 5.1% COD removal, respectively, was recorded. Reactor R1b (treating R1a effluent) recorded low removal efficiency (18.7 ± 10.2%), probably due to low inflow COD (R1b inflow: 1060 ± 65 mg L−1) and due to the low BOD5:COD ratio that this wastewater type presents [8]. During the second hydraulic and organic load shock (B) (HRT: 3 days in each reactor; inflow COD: 9051 ± 83 mg L−1), 86.6 ± 0.5% and 61.1 ± 3.0% COD removal for Systems A and B, respectively was recorded. R1a again recorded higher removal efficiency than R2 (69.4 ± 5.8% vs. 61.1 ± 3.0%), and during this period the removal efficiency of R1b was significant (54.5 ± 9.6%), while its inflow COD was 2761 ± 65 mg L−1. The abiotic degradation of the examined wastewater was investigated in a previous study [8], indicating that no significant COD deterioration could occur in the absence of microbial activity. Therefore, biodegradation is considered to be the main removal mechanism of the wastewater’s organic load.

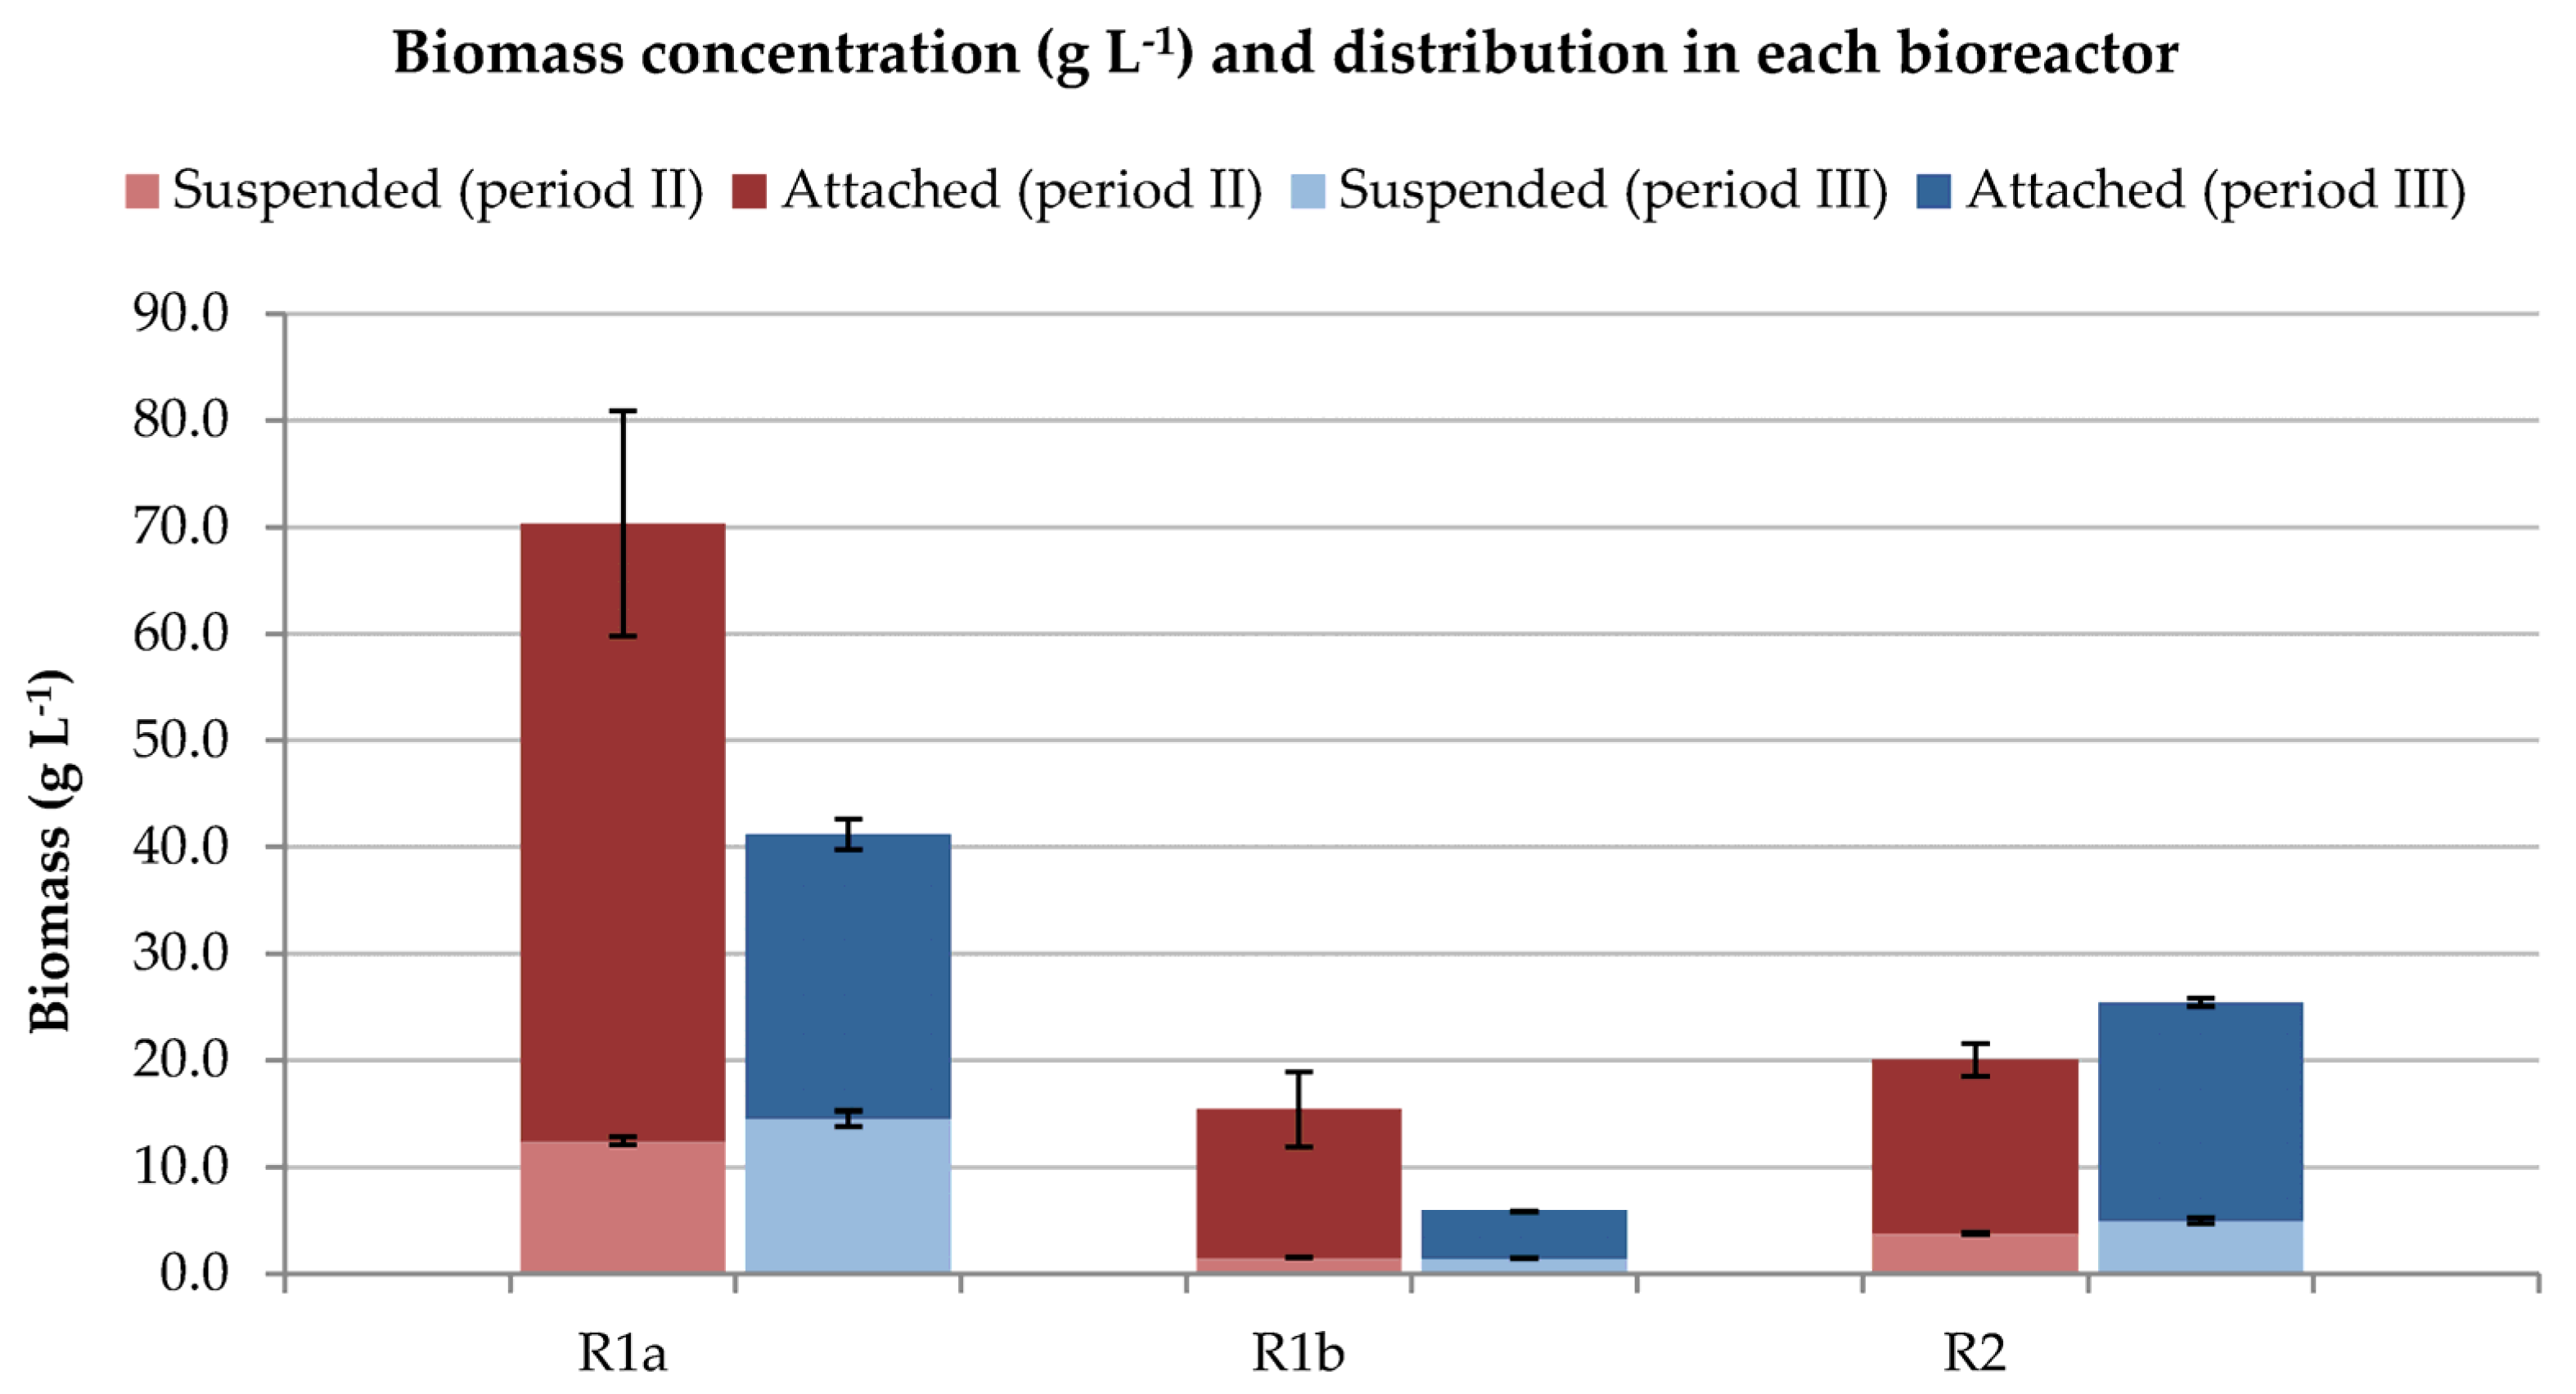
3.1.2. Biomass Concentration

The attached and suspended biomass concentrations in each bioreactor were measured (Figure 3) at the end of the salinity load shock period (Sampling Time II) and the hydraulic and organic load shock (B) (Sampling Time III). The biomass measured in all cases—but especially in R1a—was surprisingly high, compared to average values [32]. It is worth mentioning that the organic load in the present study was high (3–4.5 kg COD m−3 d−1), which could explain the extensive growth of the biomass. Another fact that could have led to overestimation of biomass values could be the high content of minerals and compounds (such as CaCO3) that were present in the biofilm structure (further discussed in Section 3.3 and Section 4.2). Therefore, the weight values of the biomass measurements included the weight of minerals that could not be quantified separately. The trend of the attached biomass concentration presented in Figure 3 is in correlation with the trend of the biofilm visually observed at the same periods (see Figure S1), with K3 forming a thick biofilm in R1a and a very thin biofilm in R1b, while Mutag BioChip had a consistent dark color, indicating constant pore filling of the biocarrier. The overall better performance of R1a regarding COD reduction could be attributed to the higher amount of biomass in the bioreactor in both sampling time periods. Comparing reactors R1a and R2, higher biomass concentration (suspended and attached) was observed in the reactor where K3 media was used (R1a), indicating that biofilm may grow to a higher extent on this type of carrier (under the same filling ratio), and that detachment may contribute to higher suspended biomass concentration in the liquid phase. During hydraulic/organic shock load (B) at day 223, the biomass in R1a and R1b decreased; despite that, the overall COD removal efficiency of System A remained stable. On the other hand, in R2, the concentration of biomass remained stable, but the performance of the system declined during the hydraulic/organic shock load (B) period.

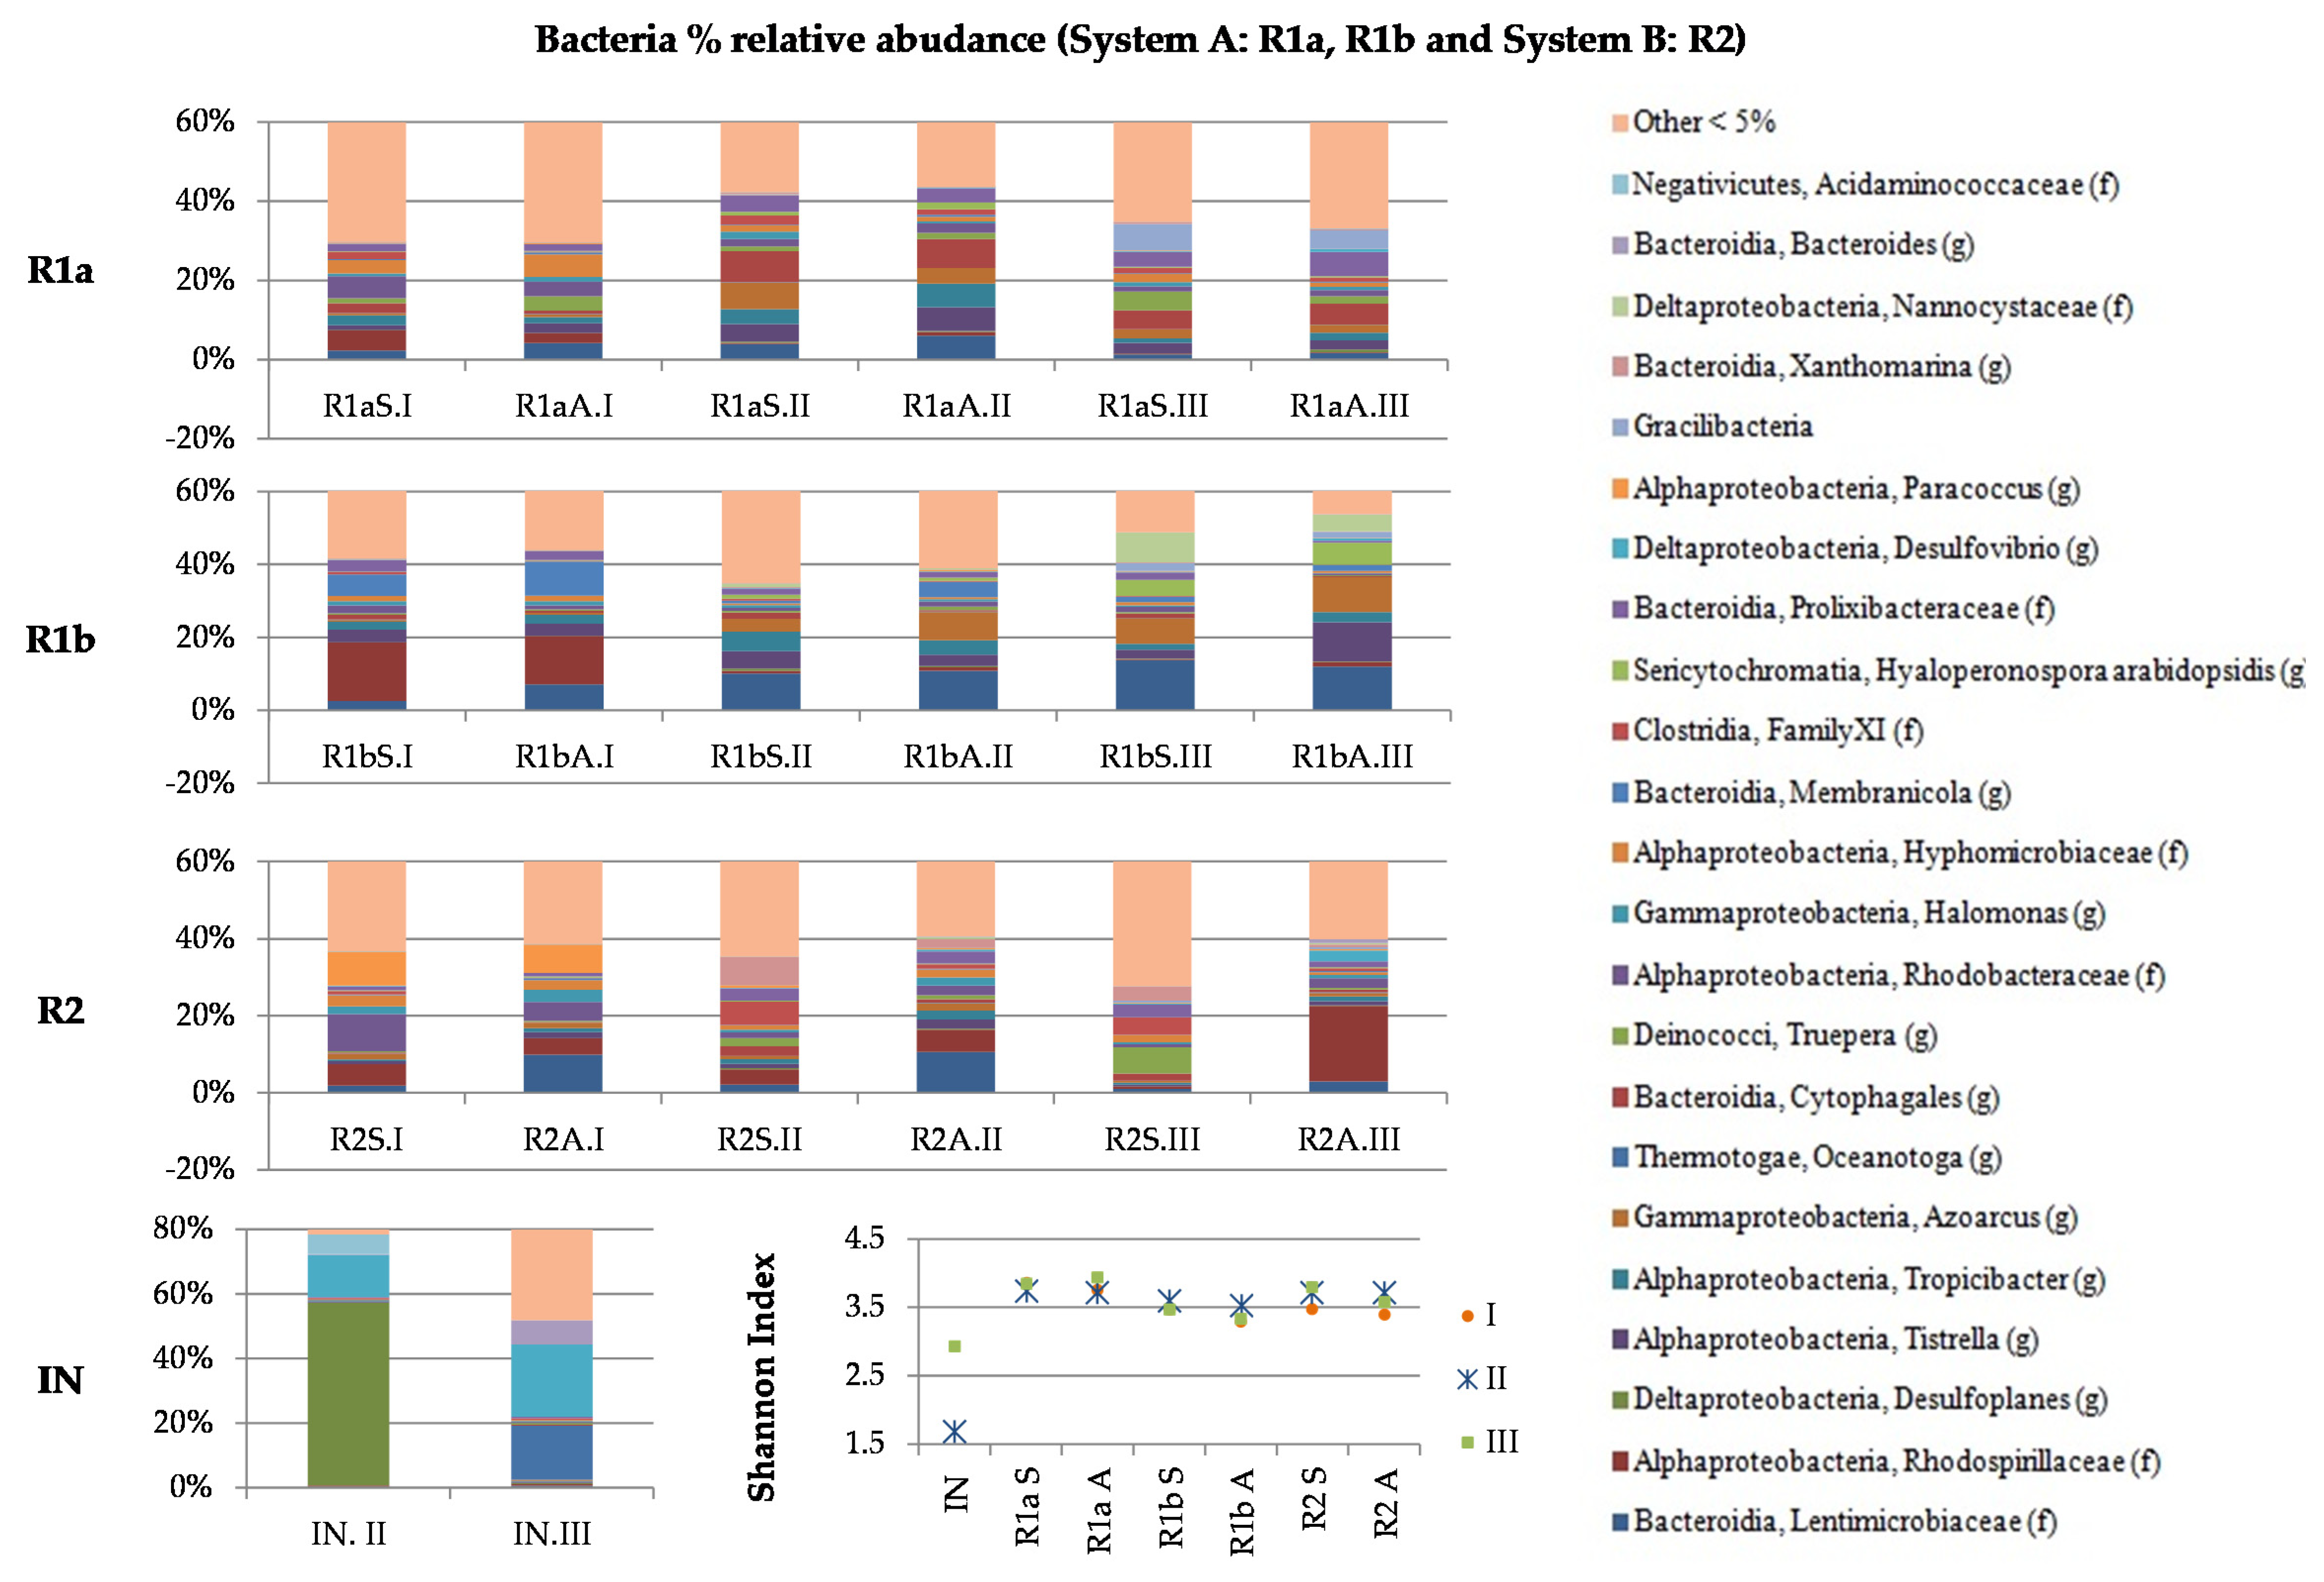
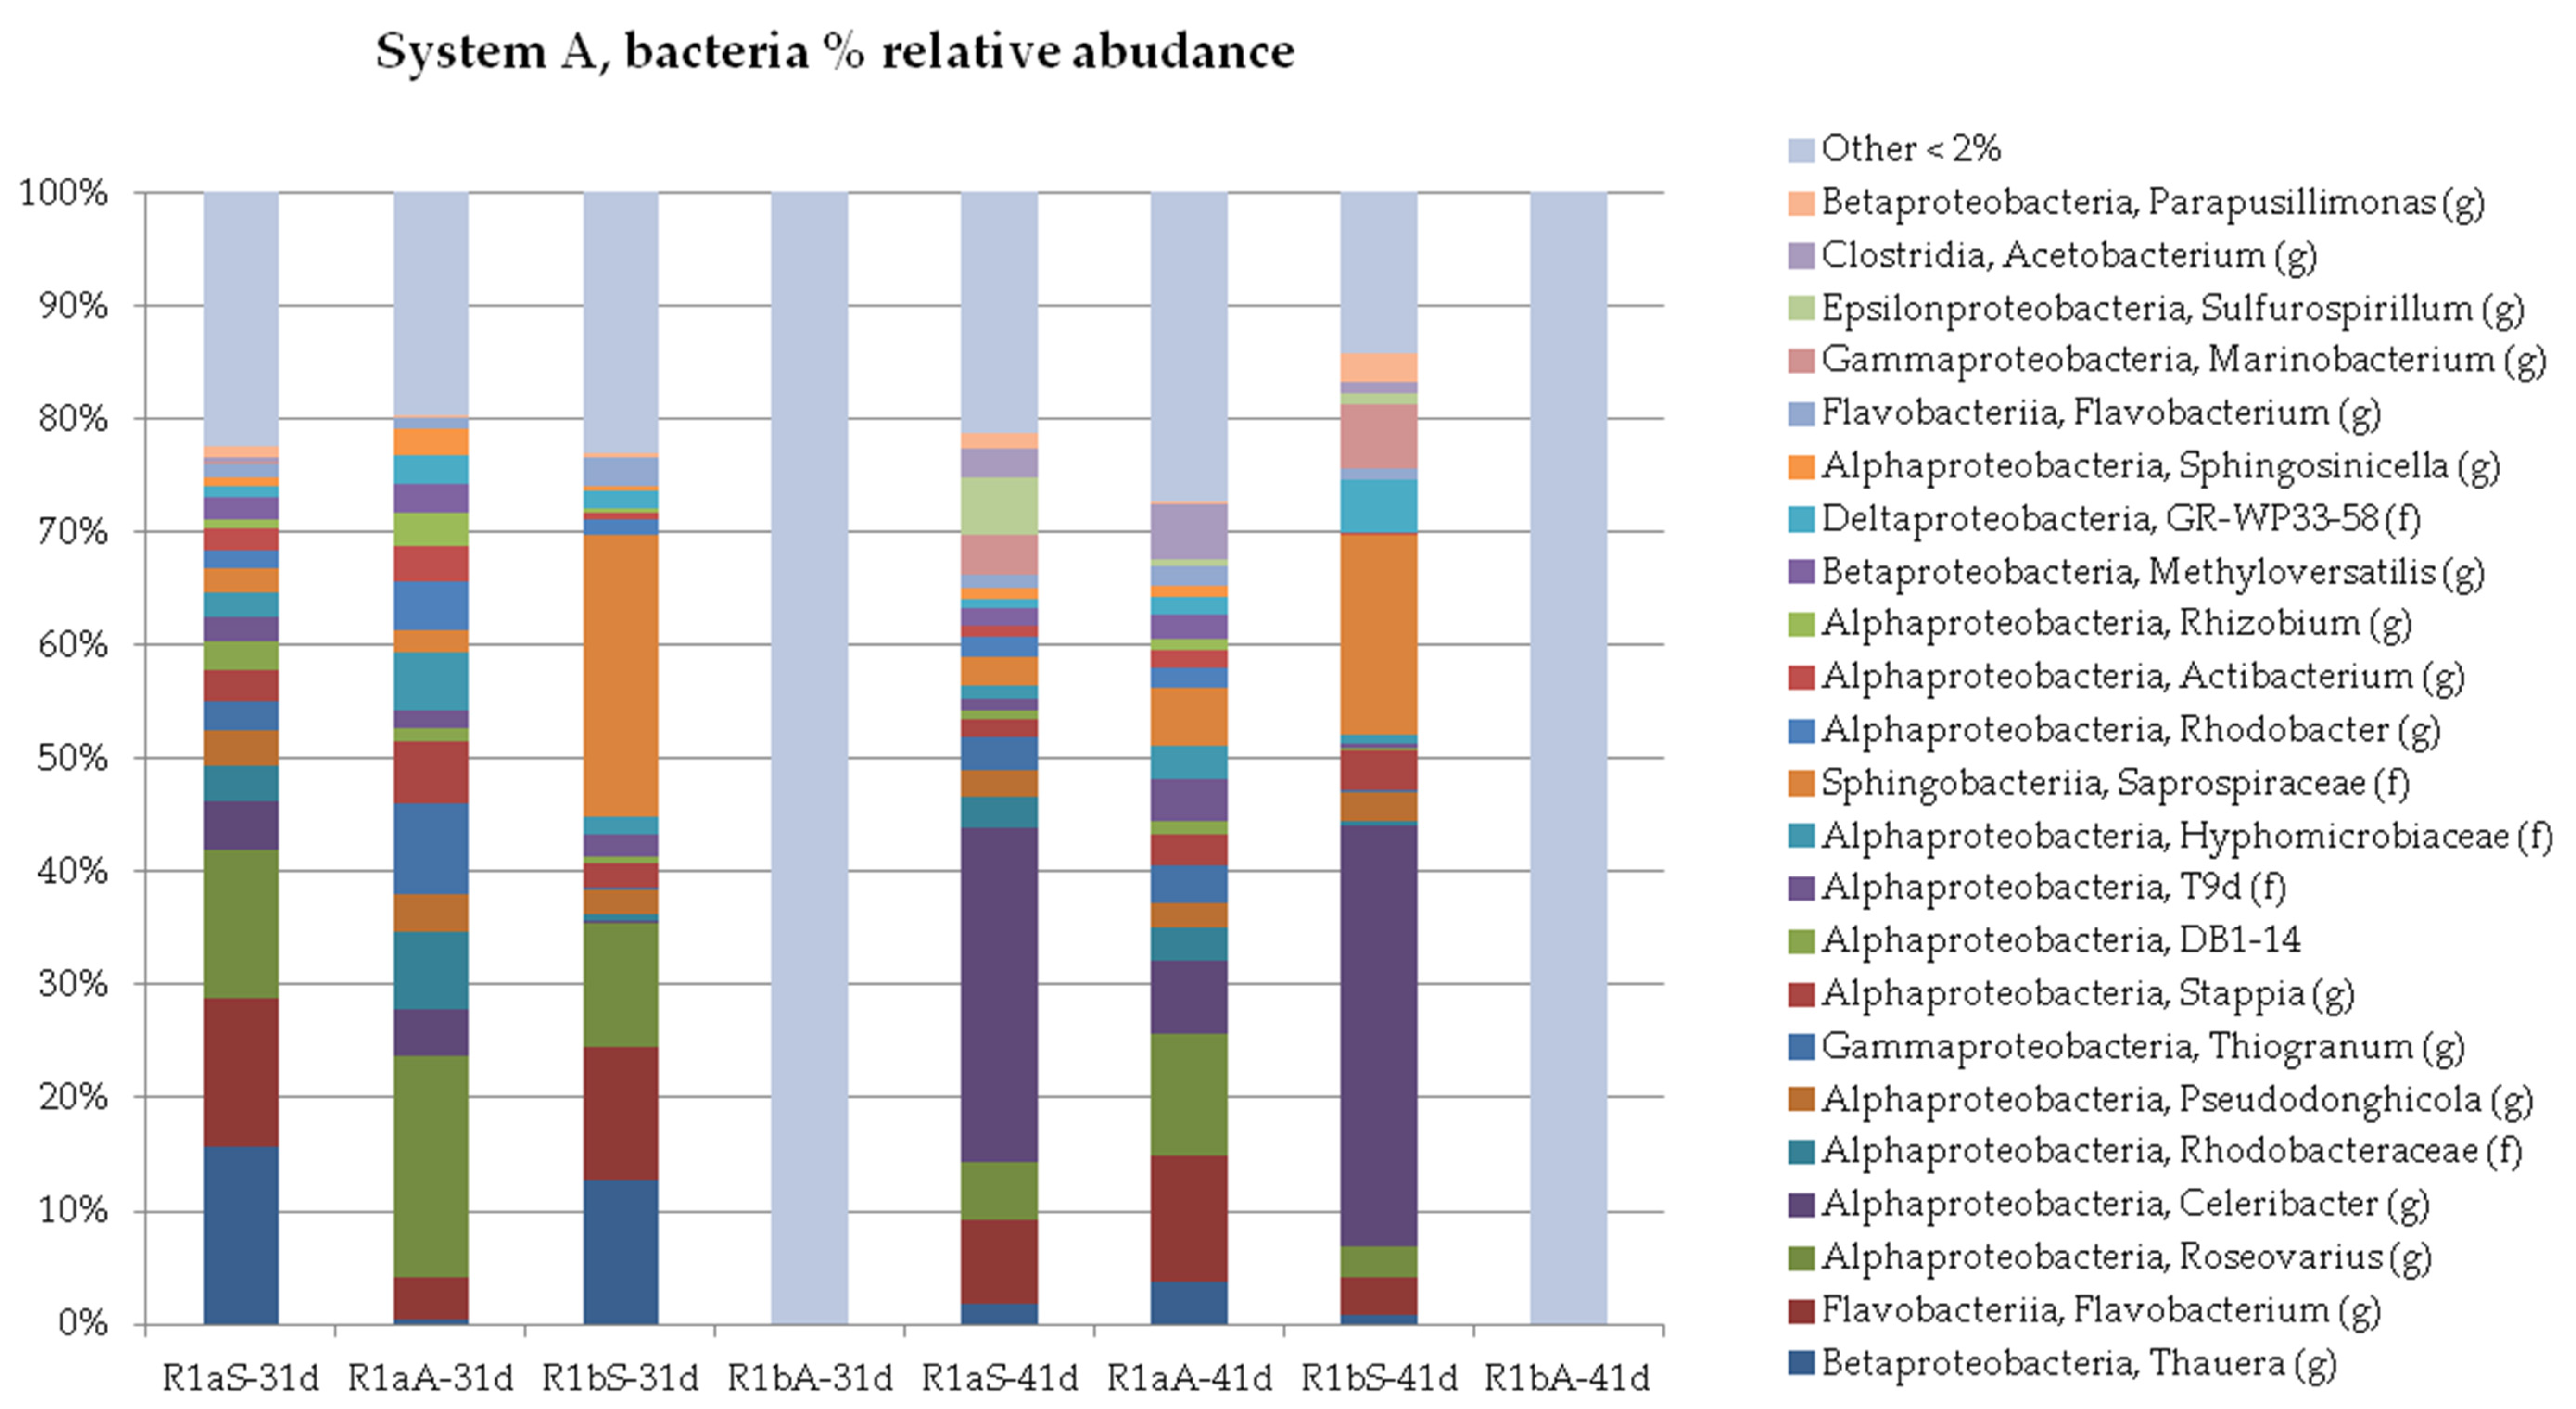
3.2. Microbial Profile

3.2.1. Organic and Hydraulic Shock Load (A)

The microbial profile of System A was compared 31 days after the startup and 10 days after a stress period where the HRT decreased from 5 to 2 days in each MBBR and the inflow COD suddenly increased from ≈ 2.000 mg L−1, maintained during the startup, to 8000–10,000 mg L−1. The relative abundance of bacteria (class and genus/family) in each bioreactor (R1a, R1b) and each type of biomass (suspended, attached) was compared for these two time periods (days 31 and 41) (Figure 4 and Table S1). It is worth mentioning that during the 41 first days of operation, no biofilm could be observed on the biocarriers in R1b; therefore, the COD removal observed (Section 3.1.1.) should be attributed to the suspended biomass activity. The following genera—Thauera (Betaproteobacteria), Flavobacterium (Flavobacteriia), and Roseovarius (Alphaproteobacteria)—that were initially present in the suspended biomass of both bioreactors at percentages greater than 10% significantly decreased in the suspended biomass after these 10 days of operation.
Interestingly, the relative abundance of Thauera and Flavobacterium increased in the biofilm of the first reactor. The genus Celeribacter (Alphaproteobacteria) presented impressive growth in the suspended biomass, with five times greater relative abundance in the first reactor (R1a), and growth from 0.2% to 37.2% in the second reactor (R1b), during this 10-day time period. The following genera—Marinobacterium (Gammaproteobacteria), Sulfurospirillum (Epsilonproteobacteria) and Acetobacterium (Clostridia)—presented growth in both reactors, with Acetobacterium especially developing in the biofilm of R1a (from 0% to 4.8%).

3.2.2. Salinity Load Shock

The relative abundance of bacteria (class and genus/family) before and after a high salinity period was examined (Ι, ΙΙ), and is demonstrated in Figure 5, for each bioreactor (R1a, R1b, and R2) and each type of biomass (suspended, attached). Before the salinity load shock (Sampling Time I), the dominant bacteria groups in the suspended biomass of System A were Alphaproteobacteria class: Rhodospirillaceae (5.2% in R1a and 16.0% in R1b) and Rhodobacteraceae (5.5% in R1a and 2.1% in R1b) and Bacteroidia class: Membranicola (5.9% in R1b), while in the biofilm the dominant groups were Bacteroidia: Lentimicrobiaceae (4.1% in R1a and 7.1% in R1b) and Membranicola (9.4% in R1b), and Alphaproteobacteria: Rhodospirillaceae (2.6% in R1a and 13.2% in R1b) and Hyphomicrobiaceae (5.7% in R1a). In System B, a similar trend was observed, with Bacteroidia: Lentimicrobiaceae present in the biofilm (9.8% in R2), and Alphaproteobacteria: Rhodospirillaceae (5.5% in the suspended biomass, 4.4% in the biofilm of R2) and Rhodobacteraceae (9.7% in the suspended biomass, 4.8% in biofilm of R2) being the dominant bacterial groups. In system B, the Alphaproteobacteria Paracoccus—a Gram-negative, denitrifying, non-motile bacterium that may have been facilitated to grow by the biocarrier structure—was identified at a high abundance (8.7% in the suspended biomass, 7.4% in the biofilm of R2), in contrast with System A, where it was not significantly observed (less than 0.3%).
By the end of the high-salinity load period (37 days after; Sampling Time II), the trend for Bacteroidia: Lentimicrobiaceae remained similar for all reactors, while Membranicola—previously present in R1b—significantly decreased in both the suspended fraction (0.8% from 5.9%) and the biofilm (4.2% from 9.4%). On the other hand, from the Bacteroidia class, the genus Cytophagales significantly developed in R1a in both suspended and attached biomass (7.8% and 7.3%, respectively), and at a lower rate in R1b and R2. The family Prolixibacteraceae presented—in both phases (suspended and attached)—an increase in the reactors accepting raw wastewater (R1a and R2), and a decrease in the second-stage reactor (R1b). On the other hand, and from the same class (Bacteroidia), the genus Xanthomarina developed in the suspended fraction (7.3%) and the biofilm (2.3%) in R2, where Mutag BioChip biocarriers were used. From the Alphaproteobacteria class, a small increase was observed for the genera Tistrella and Tropicibacter in all bioreactors, but at a higher rate in the biofilm of R1a. From the same class, the families Rhodospirillaceae, Rhodobacteraceae, and Hyphomicrobiacea decreased in all reactors, apart from Rhodospirillaceae in the biofilm of R2, where a small increase was observed. Finally, the genus Azoarcus from the class Gammaproteobacteria increased significantly in both reactors of System A (both in suspended and attached biomass), while from the class Clostridia, the family XI increased importantly (6.1% from 0.8%) in the suspended biomass of System B (R2). Despite the increase in salinity, Alphaproteobacteria remained the predominant class in both the biofilm and the attached biomass of the bioreactors.

3.2.3. Organic and Hydraulic Shock Load (B)

The relative abundance of bacteria (class and genus/family) after the hydraulic and organic shock load (B) that followed the salinity load shock period (Section 3.2.2.) was examined, and is demonstrated in Figure 5 (Sampling Times ΙΙ and ΙΙΙ), for each bioreactor (R1a, R1b, and R2) and each type of biomass (suspended, attached). For the bioreactors R1a and R2 receiving the high organic load, the Bacteroidia: Lentimicrobiaceae and the Alphaproteobacteria: Tistrella and Tropicibacter presented a significant decrease, while in R1b the family Lentimicrobiaceae increased, reaching 13.7% and 12.0% in the suspended and attached biomass, respectively, while the genus Tistrella increased from 3.1% to 10.8% in the biofilm. In System A, the Gammaproteobacteria: Azoarcus significantly decreased in R1a (approximately 50% decrease) and presented an increase in R1b in both the suspended (reached 7.1% from 3.4%) and attached (reached 9.5% from 7.8%) biomass. Furthermore, for both biomass conditions in R1a, from the class Bacteroidia the genus Cytophagales presented a small decrease, while the family Prolixibacteraceae slightly increased, and from the class Deinococci, the genus Truepera increased. In R1b, an important presence was recorded for the class Sericytochromatia, with the species Hyaloperonospora arabidopsidis, and the family Nannocystaceae from the class Deltaproteobacteria. On the other hand, for R2 the most significant alterations, apart from those already mentioned, were the increase in Alphaproteobacteria: Rhodospirillaceae in the biofilm (reached 19.6% from 5.8%), and the increase in Deinococci: Truepera in the suspended biomass (from 2.1% to 6.8%). It is worth mentioning that after this organic/hydraulic shock period the phylum Gracilibacteria was identified in R1a (6.8% in suspended, 4.7% in attached), R1b (2.3% in suspended, 1.8% in attached), and R2 (0.5% in suspended, 0.5% in attached), having been scarcely identified in all previous periods (less than 0.1%).
Regarding the biodiversity of the influent wastewater (IN), the Shannon Index was of low value compared to the samples from the bioreactors (Figure 5). Furthermore, the genera identified in the incoming wastewater (Sampling Times II and III) did not seem to influence the dominance of genera in the bioreactors.

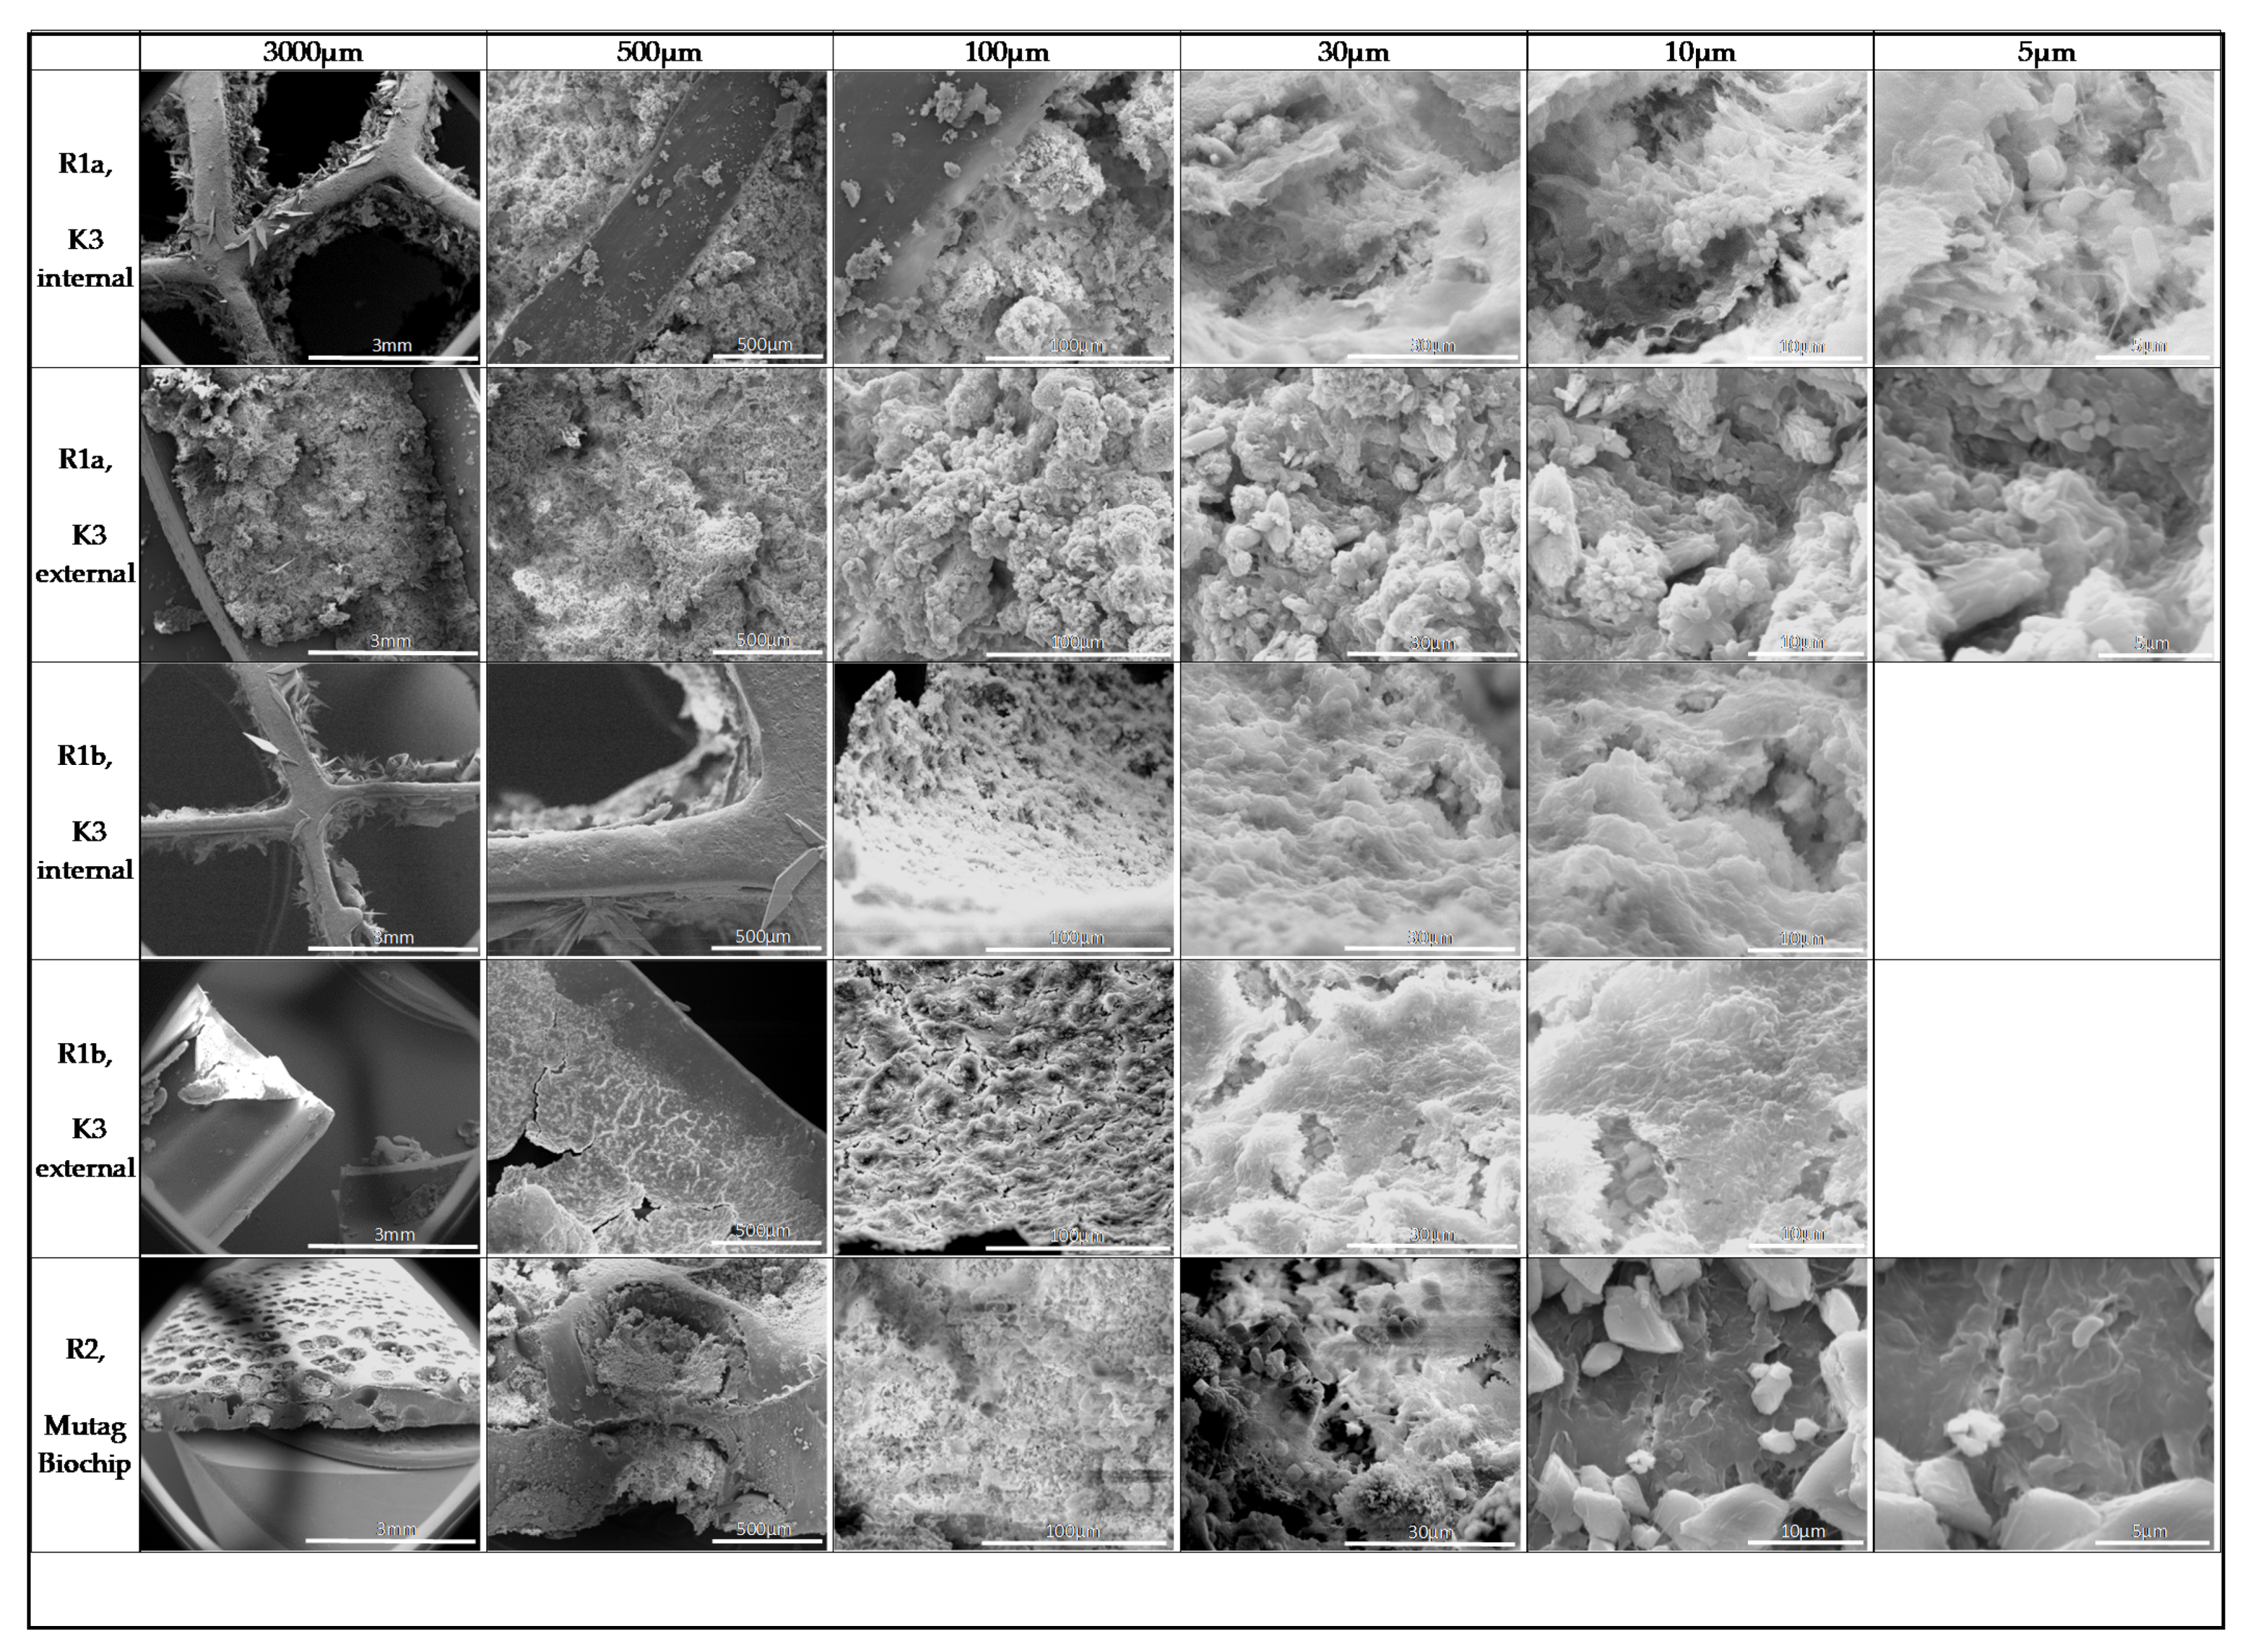
3.3. Biofilm Structure

The biofilm that was formed in each bioreactor was examined with SEM, and a grid was assembled for visual comparison (Figure 6). Each biocarrier was examined at the same time (Sampling Time III), at its original form and at sections, to see the biofilm’s formation on external and internal parts of the surface. Regarding K3 biocarriers, a continuous biofilm was formed, covering all of the internal protected areas of the biocarrier, and part of the external areas as well. On the carriers from R1a, a thick biofilm was formed, and the morphology of the layers looked more various compared to biocarriers from R1b, where a thinner biofilm was observed, and the morphology presented lower differentiation. Regarding the Mutag BioChip biocarrier, biofilm grew in small cavities in the porous phase of the biocarrier. Therefore, a continuous biofilm was not formed; instead, all of the biomass was arbitrated in the pores, forming small spots of biomass without continuity between them. The thickness of each biofilm did not seem to influence the biodiversity observed (see Figure 5). On both biocarriers, crystal-shaped materials were identified, either involved with the biofilm or installed on the biocarrier surface. Through EDΧ analysis, it was ascertained that the following elements were highly present on the biocarriers and in the biofilms: calcium (Ca), carbon (C), and oxygen (O) (Figure S2). Therefore, it is safe to conclude that biomineralization took place to a large extent, forming calcium carbonate (CaCO3).

4. Discussion

4.1. Comparison of the Two Biocarrier Types

Regarding the performance of each bioreactor, it was discovered that R1a (where K3 biocarriers were used) had an overall higher performance in terms of COD reduction compared to R2—where operational conditions were the same, but Mutag BioChip biocarriers were used. Furthermore, during the examination of the microbial profile (Figure 5 and Table S2) in both systems, it was observed that the relative abundance and groups of bacteria in the suspended biomass of system A (K3 biocarriers) had similarities with the bacteria in the biofilm, following a similar trend to dynamic changes. This could be related to the structure of the biocarrier, which allows a continuous growth of biofilm on the surface and at height. Detachment occurs as the biofilm has freedom of space to develop, thus constantly inoculating the suspended liquid of the bioreactor, and leading to important similarities in the microbial profiles of both biomass types (suspended and attached). On the other hand, in system B (Mutag BioChip), this trend was not observed, and at all sampling times the suspended and attached biomass had differences between them. Again, this can be attributed to the structure of the biocarrier, which only allows growth of the biofilm in small cavities, preventing uncontrolled growth of the biofilm and, thus, decreasing detachment.

4.2. Microbial Diversity in Relevant Studies

During the present study, Alphaproteobacteria was found to be the most predominant class (see Tables S1 and S2) in all reactors and types of biomasses (suspended and attached), and this is in line with a previous study [8] examining different culturing conditions for the aerobic biodegradation of real bilge wastewater. In contrast, Nisenbaum et al. [42] found that Gammaproteobacteria was the dominant class (58%), whereas the Alphaproteobacteria was the second dominant class, with 28% relative abundance in experiments where microbial consortiums were exposed to bilge wastewater. This difference could be attributed to the different compositions of bilge wastewater and the initial inoculum.
Regarding the genera recorded in this study during organic and hydraulic load shocks, similarities with other studies exist. Recently, Mazioti et al. [8] identified Celeribacter as the second genus recorded in high abundance in open mixed aerobic cultures treating bilge wastewater. Cao et al. [43] isolated Celeribacter indicus P73T from deep-sea sediment from the Indian Ocean that could biodegrade polycyclic aromatic hydrocarbons. Yang et al. [44] isolated Celeribacter marinus from coastal seawater from the Yellow Sea of Korea. According to Procópio [45], the Celeribacter genus is related to the biodegradation of hydrocarbons in marine environments, and some species can be thiosulfate oxidizers. Sieber et al. [46] used Gracilibacteria from an enrichment experiment inoculated from the Gulf of Mexico to investigate hydrocarbon degradation. Tian et al. [47] found high abundance of Lentimicrobiaceae in biofilms at a sequencing batch biofilm reactor, and its main role was related to denitrification. Regarding the genus Tistrella, Zhao et al. [48] isolated Tistrella sp. strain ZP5, which had a high performance in phenanthrene biodegradation.
The identified genera detected after the salinity shock were also found in other studies examining hydrocarbon biodegradation. More specifically, Xue et al. [49] used a membrane bioreactor with a submerged flat-sheet ceramic microfiltration membrane to treat oil sands process-affected water, and found a high abundance of Cytophagales in the bioreactor. According to Xue et al. [49] Cytophagia has been associated with the biodegradation of hydrocarbons. Denaro et al. [50] examined the biofilm formed in polyethylene terephthalate (PET) biofilms, and Prolixibacteraceae was identified as the most abundant within the Bacteroidetes. Djahnit et al. [51] found that isolated Xanthomarina gelatinilytica can degrade 17% of crude oil after 1 week of incubation. Yao et al. [52] found Xanthomarina as one of the more dominant genera in aerobic granular sludge treating hypersaline wastewater.

4.3. Biomineralization in Biofilms

The precipitation of minerals because of the activity of microorganisms is known as biomineralization, which is a naturally occurring process combining the formation of minerals with the mediation of metabolic activity of organisms [53]. The presence of CaCO3 in biofilms was ascertained in this study, and is discussed in the literature [54]; it can be formed as a first step in the extracellular phase or in the biofilm cell, and in a second step saturation storage will lead to crystal nucleation [55]. Furthermore, structures such as those observed on 10 μm Mutag BioChip biocarriers (Figure 6) could be related to various forms of toluene that are usually present in bilge wastewater [7], such as p-toluenesulfonamide [56]. In a similar system to the one examined in the current study, Gonzalez-Martinez et al. [57] identified bacteria that can form calcium carbonate and struvite biominerals, while using a bench-scale moving bed bioreactor-membrane bioreactor to treat urban wastewater. According to Gonzalez-Martinez et al. [57], isolation of mineral-forming strains on calcium carbonate and struvite media revealed six major colonies (genera Lysinibacillus, Trichococcus, Comamonas, and Bacillus) with a carbonate or struvite precipitation capacity in the biofouling on the membrane surface, and showed that heterotrophic bacteria with the ability to precipitate calcium carbonate and struvite constituted ~7.5% of the total platable bacteria.

5. Conclusions

The biodegradation potential of lab-scale MBBR systems was investigated for the treatment of real bilge water. The operation of two MBBRs in series increased the performance regarding COD removal, with the second reactor recording significant performance during shock loading periods. The operation of MBBRs in series could provide stable performance for the treatment of this wastewater type. The use of K3-type biocarriers promoted slightly higher performance. Alphaproteobacteria and Bacteroidia were the dominant classes throughout the experimental period. Sudden alterations of the operational parameters led to differentiation in the relative abundance of the observed genera, with no significant decrease of the MBBRs’ performance. Therefore, the adaptation of microbial communities was rapid, and the performance of the process was stable. The families Rhodospirillaceae and Rhodobacteraceae (from the class Alphaproteobacteria) and Lentimicrobiaceae (from the class Bacteroidia) were present at a high relative abundance in all MBBRs. Within both suspended and attached biomass, the identified microbial communities had more similarities in bioreactors where K3 biocarriers were used. On the other hand, Mutag BioChip biocarriers promoted higher diversity between attached and suspended biomass. This can be attributed to the structure of the biocarriers, and the development of biofilm in the pores of the media. Through SEM and EDX analysis of the biofilm, biomineralization was proved to occur. A combination of the two biocarrier types could be tested in the future for improving performance.

Supplementary Materials

The following are available online at https://www.mdpi.com/article/10.3390/w13131810/s1: Table S1: Relative abundance, illustrated in Figure 4, Table S2: Relative abundance, illustrated in Figure 5, Figure S1: Visual observation of dried biofilm, Figure S2: EDX report from biofilm and biocarriers.

Author Contributions

A.A.M.: conceptualization, methodology, investigation, validation, visualization, writing—original draft preparation; L.E.K.: investigation, writing—review and editing; G.C.: writing—review and editing. I.V.: conceptualization, project administration, supervision, writing—review and editing. All authors have read and agreed to the published version of the manuscript.

Funding

This work was co-funded by the European Regional Development Fund and the Republic of Cyprus through the Research and Innovation Foundation (Grant number: OPPORTUNITY/0916/MSCA/0006). Research Program Acronym: MicrobEatBilge.

Data Availability Statement

The datasets used and/or analyzed during the current study are available from the corresponding author on reasonable request.

Acknowledgments

The authors would like to thank Ecofuel LTD for the provision of the wastewater and the biocarriers (Mutag BioChip).

Conflicts of Interest

The authors declare no conflict of interest. The funders had no role in the design of the study, in the collection, analyses, or interpretation of data, in the writing of the manuscript, or in the decision to publish the results.

References

  1. Yu, Y.H.; Su, J.F.; Shih, Y.; Wang, J.; Wang, P.Y.; Huang, C.P. Hazardous wastes treatment technologies. Water Environ. Res. 2020, 92, 1833–1860. [Google Scholar] [CrossRef]
  2. Tian, X.; Song, Y.; Shen, Z.; Zhou, Y.; Wang, K.; Jin, X.; Han, Z.; Liu, T. A comprehensive review on toxic petrochemical wastewater pretreatment and advanced treatment. J. Clean. Prod. 2020, 245, 118692. [Google Scholar] [CrossRef]
  3. Eusebi, A.L.; Massi, A.; Sablone, E.; Santinelli, M.; Battistoni, P. Industrial wastewater platform: Upgrading of the biological process and operative configurations for best performance. Water Sci. Technol. 2012, 65, 721–727. [Google Scholar] [CrossRef]
  4. Garner, E.; Davis, B.C.; Milligan, E.; Blair, M.F.; Keenum, I.; Maile-Moskowitz, A.; Pan, J.; Gnegy, M.; Liguori, K.; Gupta, S.; et al. Next generation sequencing approaches to evaluate water and wastewater quality. Water Res. 2021, 194, 116907. [Google Scholar] [CrossRef] [PubMed]
  5. Aydin, S. Microbial sequencing methods for monitoring of anaerobic treatment of antibiotics to optimize performance and prevent system failure. Appl. Microbiol. Biotechnol. 2016, 100, 5313–5321. [Google Scholar] [CrossRef] [PubMed]
  6. Andersson, K.; Brynolf, S.; Lindgren, J.F.; Wilewska-Bien, M. Shipping and the Environment, 1st ed.; Springer: Berlin/Heidelberg, Germany, 2016; pp. 125–168. [Google Scholar] [CrossRef]
  7. McLaughlin, C.; Falatko, D.; Danesi, R.; Albert, R. Characterizing shipboard bilgewater effluent before and after treatment. Environ. Sci. Pollut. Res. 2014, 21, 5637–5652. [Google Scholar] [CrossRef] [PubMed]
  8. Mazioti, A.A.; Vasquez, M.I.; Vyrides, I. Comparison of different cultures and culturing conditions for the biological deterioration of organic load from real saline bilge wastewater: Microbial diversity insights and ecotoxicity assessment. Environ. Sci. Pollut. Res. 2021. [Google Scholar] [CrossRef] [PubMed]
  9. Nievas, M.; Commendatore, M.; Olivera, N.; Esteves, J.; Bucalá, V. Biodegradation of bilge waste from Patagonia with an indigenous microbial community. Bioresour. Technol. 2006, 97, 2280–2290. [Google Scholar] [CrossRef]
  10. Cerqueira, V.S.; Hollenbach, E.B.; Maboni, F.; Vainstein, M.; Camargo, F.; Peralba, M.D.C.R.; Bento, F.M. Biodegradation potential of oily sludge by pure and mixed bacterial cultures. Bioresour. Technol. 2011, 102, 11003–11010. [Google Scholar] [CrossRef] [PubMed] [Green Version]
  11. Cappello, S.; Santisi, S.; Calogero, R.; Hassanshahian, M.; Yakimov, M. Characterisation of Oil-Degrading Bacteria Isolated from Bilge Water. Water Air Soil Pollut. 2012, 223, 3219–3226. [Google Scholar] [CrossRef]
  12. Feknous, N.; Branes, Z.; Rouabhia, K.; Batisson, I.; Amblard, C. Isolation characterization and growth of locally isolated hydrocarbonoclastic marine bacteria (eastern Algerian coast). Environ. Monit. Assess. 2017, 189, 49. [Google Scholar] [CrossRef]
  13. Uma, V.; Gandhimathi, R. Organic removal and synthesis of biopolymer from synthetic oily bilge water using the novel mixed bacterial consortium. Bioresour. Technol. 2019, 273, 169–176. [Google Scholar] [CrossRef]
  14. Barwal, A.; Chaudhary, R. To study the performance of biocarriers in moving bed biofilm reactor (MBBR) technology and kinetics of biofilm for retrofitting the existing aerobic treatment systems: A review. Rev. Environ. Sci. Biotechnol. 2014, 13, 285–299. [Google Scholar] [CrossRef]
  15. Biswas, K.; Taylor, M.W.; Turner, S.J. Successional development of biofilms in moving bed biofilm reactor (MBBR) systems treating municipal wastewater. Appl. Microbiol. Biotechnol. 2014, 98, 1429–1440. [Google Scholar] [CrossRef]
  16. Huang, H.; Peng, C.; Peng, P.; Lin, Y.; Zhang, X.; Ren, H. Towards the biofilm characterization and regulation in biological wastewater treatment. Appl. Microbiol. Biotechnol. 2019, 103, 1115–1129. [Google Scholar] [CrossRef] [PubMed]
  17. Ahmed, W.; Delatolla, R. Biofilm and microbiome response of attached growth nitrification systems across incremental decreases to low temperatures. J. Water Process Eng. 2021, 39, 101730. [Google Scholar] [CrossRef]
  18. Bouteh, E.; Ahmadi, N.; Abbasi, M.; Torabian, A.; van Loosdrecht, M.C.; Ducoste, J. Biodegradation of organophosphorus pesticides in moving bed biofilm reactors: Analysis of microbial community and biodegradation pathways. J. Hazard. Mater. 2021, 408, 124950. [Google Scholar] [CrossRef]
  19. Liu, Y.; Wang, N.; Wei, Y.; Dang, K.; Li, M.; Li, Y.; Li, Q.; Mu, R. Pilot study on the upgrading configuration of UASB-MBBR with two carriers: Treatment effect, sludge reduction and functional microbial identification. Process Biochem. 2020, 99, 211–221. [Google Scholar] [CrossRef]
  20. Abu Bakar, S.N.H.; Abu Hasan, H.; Mohammad, A.W.; Abdullah, S.R.S.; Haan, T.Y.; Ngteni, R.; Yusof, K.M.M. A review of moving-bed biofilm reactor technology for palm oil mill effluent treatment. J. Clean. Prod. 2018, 171, 1532–1545. [Google Scholar] [CrossRef]
  21. Liang, C.; de Jonge, N.; Carvalho, P.N.; Nielsen, J.L.; Bester, K. Biodegradation kinetics of organic micropollutants and microbial community dynamics in a moving bed biofilm reactor. Chem. Eng. J. 2021, 415, 128963. [Google Scholar] [CrossRef]
  22. Wolff, D.; Krah, D.; Dötsch, A.; Ghattas, A.-K.; Wick, A.; Ternes, T.A. Insights into the variability of microbial community composition and micropollutant degradation in diverse biological wastewater treatment systems. Water Res. 2018, 143, 313–324. [Google Scholar] [CrossRef]
  23. Sun, C.; Leiknes, T.; Weitzenböck, J.; Thorstensen, B. Development of an integrated shipboard wastewater treatment system using biofilm-MBR. Sep. Purif. Technol. 2010, 75, 22–31. [Google Scholar] [CrossRef]
  24. Mancini, G.; Cappello, S.; Yakimov, M.; Polizzi, A.; Torregrossa, M. Biological Approaches to the Treatment of Saline Oily Waste(waters) Originated from Marine Transportation. Chem. Eng. Trans. 2012, 27, 37–42. [Google Scholar] [CrossRef]
  25. Vyrides, I.; Drakou, E.-M.; Ioannou, S.; Michael, F.; Gatidou, G.; Stasinakis, A.S. Biodegradation of bilge water: Batch test under anaerobic and aerobic conditions and performance of three pilot aerobic Moving Bed Biofilm Reactors (MBBRs) at different filling fractions. J. Environ. Manag. 2018, 217, 356–362. [Google Scholar] [CrossRef]
  26. Ahmadi, M.; Ahmadmoazzam, M.; Saeedi, R.; Abtahi, M.; Ghafari, S.; Jorfi, S. Biological treatment of a saline and recalcitrant petrochemical wastewater by using a newly isolated halo-tolerant bacterial consortium in MBBR. Desalination Water Treat. 2019, 167, 84–95. [Google Scholar] [CrossRef]
  27. Yu, Z.; Li, W.; Tan, S. Real-time monitoring of the membrane biofouling based on spectroscopic analysis in a marine MBBR-MBR (moving bed biofilm reactor-membrane bioreactor) for saline wastewater treatment. Chemosphere 2019, 235, 1154–1161. [Google Scholar] [CrossRef] [PubMed]
  28. Xu, M.; Zhou, W.; Chen, X.; Zhou, Y.; He, B.; Tan, S. Analysis of the biodegradation performance and biofouling in a halophilic MBBR-MBR to improve the treatment of disinfected saline wastewater. Chemosphere 2021, 269, 128716. [Google Scholar] [CrossRef] [PubMed]
  29. APHA. Standard Methods for the Examination of Water and Wastewater, 22nd ed.; American Public Health Association; American Water Works Association; Water Environment Federation: Washington, DC, USA, 2012. [Google Scholar]
  30. Mazioti, A.-A.; Stasinakis, A.S.; Pantazi, Y.; Andersen, H.R. Biodegradation of benzotriazoles and hydroxy-benzothiazole in wastewater by activated sludge and moving bed biofilm reactor systems. Bioresour. Technol. 2015, 192, 627–635. [Google Scholar] [CrossRef] [Green Version]
  31. Falås, P.; Baillon-Dhumez, A.; Andersen, H.; Ledin, A.; Jansen, J.L.C. Suspended biofilm carrier and activated sludge removal of acidic pharmaceuticals. Water Res. 2012, 46, 1167–1175. [Google Scholar] [CrossRef]
  32. Fonseca, D.L.; Bassin, J.P. Investigating the most appropriate methods for attached solids determination in moving-bed biofilm reactors. Bioprocess Biosyst. Eng. 2019, 42, 1867–1878. [Google Scholar] [CrossRef]
  33. Magoč, T.; Salzberg, S.L. FLASH: Fast Length Adjustment of Short Reads to Improve Genome Assemblies. Bioinformatics 2011, 27, 2957–2963. [Google Scholar] [CrossRef]
  34. Bokulich, N.A.; Subramanian, S.; Faith, J.J.; Gevers, D.; Gordon, J.I.; Knight, R.; Mills, D.A.; Caporaso, J.G. Quality-filtering vastly improves diversity estimates from Illumina amplicon sequencing. Nat. Methods 2013, 10, 57–59. [Google Scholar] [CrossRef]
  35. Caporaso, J.G.; Kuczynski, J.; Stombaugh, J.; Bittinger, K.; Bushman, F.D.; Costello, E.K.; Fierer, N.; Peña, A.G.; Goodrich, J.K.; Gordon, J.I.; et al. QIIME Allows Analysis of High-Throughput Community Sequencing Data. Nat. Methods 2010, 7, 335–336. [Google Scholar] [CrossRef] [Green Version]
  36. Edgar, R.C.; Haas, B.J.; Clemente, J.C.; Quince, C.; Knight, R. UCHIME Improves Sensitivity and Speed of Chimera Detection. Bioinformatics 2011, 27, 2194–2200. [Google Scholar] [CrossRef] [Green Version]
  37. Haas, B.J.; Gevers, D.; Earl, A.; Feldgarden, M.; Ward, D.V.; Giannoukos, G.; Ciulla, D.; Tabbaa, D.; Highlander, S.K.; Sodergren, E.; et al. Chimeric 16S rRNA sequence formation and detection in Sanger and 454-pyrosequenced PCR amplicons. Genome Res. 2011, 21, 494–504. [Google Scholar] [CrossRef] [Green Version]
  38. Edgar, R.C. UPARSE: Highly accurate OTU sequences from microbial amplicon reads. Nat. Methods 2013, 10, 996–998. [Google Scholar] [CrossRef]
  39. Kleerebezem, R.; Beckers, J.; Pol, L.W.H.; Lettinga, G. High rate treatment of terephthalic acid production wastewater in a two-stage anaerobic bioreactor. Biotechnol. Bioeng. 2005, 91, 169–179. [Google Scholar] [CrossRef] [PubMed]
  40. Li, J.; Liu, Y.-R.; Zhang, L.-M.; He, J.-Z. Sorption mechanism and distribution of cadmium by different microbial species. J. Environ. Manag. 2019, 237, 552–559. [Google Scholar] [CrossRef] [PubMed]
  41. Liu, J.; Zhou, J.; Xu, N.; He, A.; Xin, F.; Ma, J.; Fang, Y.; Zhang, W.; Liu, S.; Jiang, M.; et al. Performance evaluation of a lab-scale moving bed biofilm reactor (MBBR) using polyethylene as support material in the treatment of wastewater contaminated with terephthalic acid. Chemosphere 2019, 227, 117–123. [Google Scholar] [CrossRef] [PubMed]
  42. Nisenbaum, M.; Corti-Monzón, G.; Villegas-Plazas, M.; Junca, H.; Mangani, A.; Patat, M.L.; González, J.F.; Murialdo, S.E. Enrichment and key features of a robust and consistent indigenous marine-cognate microbial consortium growing on oily bilge wastewaters. Biodegradation 2020, 31, 91–108. [Google Scholar] [CrossRef]
  43. Cao, J.; Lai, Q.; Yuan, J.; Shao, Z. Genomic and metabolic analysis of fluoranthene degradation pathway in Celeribacter indicus P73T. Sci. Rep. 2015, 5, 7741. [Google Scholar] [CrossRef] [Green Version]
  44. Yang, J.-A.; Kang, I.; Moon, M.; Ryu, U.-C.; Kwon, K.K.; Cho, J.-C.; Oh, H.-M. Complete genome sequence of Celeribacter marinus IMCC12053T, the host strain of marine bacteriophage P12053L. Mar. Genom. 2016, 26, 5–7. [Google Scholar] [CrossRef]
  45. Procópio, L. Changes in microbial community in the presence of oil and chemical dispersant and their effects on the corrosion of API 5L steel coupons in a marine-simulated microcosm. Appl. Microbiol. Biotechnol. 2020, 104, 6397–6411. [Google Scholar] [CrossRef]
  46. Sieber, C.M.K.; Paul, B.G.; Castelle, C.J.; Hu, P.; Tringe, S.G.; Valentine, D.L.; Andersen, G.L.; Banfield, J.F. Unusual Metabolism and Hypervariation in the Genome of a Gracilibacterium (BD1-5) from an Oil-Degrading Community. mBio 2019, 10. [Google Scholar] [CrossRef] [PubMed] [Green Version]
  47. Tian, Q.; Zhu, J.; Liang, X.; Zhu, Y.; Sand, W.; Yang, J.; Li, F.; Ma, C.; Liu, Y.; Yang, B. Microbial uniqueness of architecture modified loofah sponge as biological filler for efficient nitrogen removal. Bioresour. Technol. Rep. 2018, 3, 95–101. [Google Scholar] [CrossRef]
  48. Zhao, H.-P.; Wang, L.; Ren, J.-R.; Li, Z.; Li, M.; Gao, H.-W. Isolation and characterization of phenanthrene-degrading strains Sphingomonas sp. ZP1 and Tistrella sp. ZP5. J. Hazard. Mater. 2008, 152, 1293–1300. [Google Scholar] [CrossRef]
  49. Xue, J.; Zhang, Y.; Liu, Y.; El-Din, M.G. Treatment of oil sands process-affected water (OSPW) using a membrane bioreactor with a submerged flat-sheet ceramic microfiltration membrane. Water Res. 2016, 88, 1–11. [Google Scholar] [CrossRef]
  50. Denaro, R.; Aulenta, F.; Crisafi, F.; Di Pippo, F.; Viggi, C.C.; Matturro, B.; Tomei, P.; Smedile, F.; Martinelli, A.; Di Lisio, V.; et al. Marine hydrocarbon-degrading bacteria breakdown poly(ethylene terephthalate) (PET). Sci. Total Environ. 2020, 749, 141608. [Google Scholar] [CrossRef] [PubMed]
  51. Djahnit, N.; Chernai, S.; Catania, V.; Hamdi, B.; China, B.; Cappello, S.; Quatrini, P. Isolation, characterization and determination of biotechnological potential of oil-degrading bacteria from Algerian centre coast. J. Appl. Microbiol. 2019, 126, 780–795. [Google Scholar] [CrossRef]
  52. Yao, J.; Li, W.; Ou, D.; Lei, L.; Asif, M.; Liu, Y. Performance and granular characteristics of salt-tolerant aerobic granular reactors response to multiple hypersaline wastewater. Chemosphere 2021, 265, 129170. [Google Scholar] [CrossRef]
  53. Rodríguez-Sánchez, J.; Liberto, T.; Barentin, C.; Dysthe, D.K. Mechanisms of Phase Transformation and Creating Mechanical Strength in a Sustainable Calcium Carbonate Cement. Preprints 2018. [Google Scholar] [CrossRef] [PubMed]
  54. McCutcheon, J.; Southam, G. Advanced biofilm staining techniques for TEM and SEM in geomicrobiology: Implications for visualizing EPS architecture, mineral nucleation, and microfossil generation. Chem. Geol. 2018, 498, 115–127. [Google Scholar] [CrossRef]
  55. Keren-Paz, A.; Kolodkin-Gal, I. A brick in the wall: Discovering a novel mineral component of the biofilm extracellular matrix. New Biotechnol. 2020, 56, 9–15. [Google Scholar] [CrossRef]
  56. Yang, T.-M.; Su, C.-S.; Li, J.-S.; Lu, K.-T.; Yeh, T.-F. Recrystallization and Micronization of p-Toluenesulfonamide Using the Rapid Expansion of Supercritical Solution (RESS) Process. Crystals 2019, 9, 449. [Google Scholar] [CrossRef] [Green Version]
  57. Gonzalez-Martinez, A.; Leyva-Díaz, J.; Rodriguez-Sanchez, A.; Palazon, B.M.; Rivadeneyra, M.A.; Poyatos, J.M.; Martinez-Toledo, M. Isolation and metagenomic characterization of bacteria associated with calcium carbonate and struvite precipitation in a pure moving bed biofilm reactor-membrane bioreactor. Biofouling 2015, 31, 333–348. [Google Scholar] [CrossRef] [PubMed]
Figure 1. Schematic representation of (a) the experimental setup of the lab-scale MBBRs (System A: R1a and R1b; and System B: R2), and (b) the biocarrier type and filling ratio for each bioreactor (before and after biofilm formation).
Water 13 01810 g001
Figure 2. COD concentration (mg L−1) over time (days): (a) inflow and in each reactor of System A; and (b) inflow and in each reactor of Systems A and B during their parallel operation. Sampling time periods where the microbial profiles in each bioreactor were examined are indicated with a vertical dashed line.
Water 13 01810 g002
Figure 3. Biomass concentration (g L−1) and distribution in each bioreactor (attached to biocarriers as biofilm and suspended in the liquid of the bioreactor) over two different sampling periods: after the salinity shock period (Sampling Time II, day 209), and after the hydraulic and organic shock period (Sampling Time III, day 223).
Water 13 01810 g003
Figure 4. Relative abundance of bacteria in suspended and attached biomass in System A (NGS batch analysis 1), before and after exposure to high organic loading conditions and low HRT. Indicated in the x-axis is the name of the reactor (R1a or R1b), the type of biomass sampled (S: suspended, or A: attached), and the sampling date (31d: operational day 31, and 41d: operational day 41).
Water 13 01810 g004
Figure 5. Relative abundance of bacteria in suspended and attached biomass in Systems A and B, at four different sampling times (NGS batch analysis 2). Indicated in the x-axis is the name of the reactor (R1a, R1b, or R2), the type of biomass (S: suspended, or A: attached), and the sampling time (I, II, or III). The Shannon index is displayed for each sample.
Water 13 01810 g005
Figure 6. Images from SEM analysis of biocarriers during Sampling Time III (after organic/hydraulic load shock B).
Water 13 01810 g006
Table 1. Description of operational periods and duration of each period for System A and System B. Inflow wastewater’s main characteristics during each time period.
System A
(Reactors R1a and R1b Connected in Series)
System B
(Reactor R2)
Ιnflow Wastewater Parameters (Mean, SE)
Operational
period description
Duration (days)Operational day at the end of the periodHRT
of each reactor (days)
Operational period descriptionDuration (days)Operational day at the end of the periodHRT
(days)
pHSalinity (ppt)COD
(mg L−1)
Startup31315 No operation7.120.52111 ± 501
Organic/hydraulic load shock (A)10412 7.222.49054 ± 608
Maintenance132173 *7Startup6161 *77.027.64036 ± 909
Salinity load shock36209 **5Salinity load shock3696 **56.240.06286 ± 626
Organic/hydraulic load shock (B)13223 ***3Organic/hydraulic load shock (B)13109 ***35.819.79051 ± 83
* Sampling Time I. ** Sampling Time II. *** Sampling Time III.
Publisher’s Note: MDPI stays neutral with regard to jurisdictional claims in published maps and institutional affiliations.

