1. Introduction
With the scarcity of water resources, the effective distribution of water resources has become a global problem. European water legislation is extremely challenging, and despite their distinctive efforts on water resources, tensions remain between internationalization and regionalization. Freshwater is vital to life, and Europe, which has been regarded as water-rich, also faces a lack of water. Since the beginning of the 21st century, there have been ongoing extreme drought events in Europe, which have had an enormous impact on local agriculture, wine, and forestry. The highly unusual heat in 2003 even caused about 70,000 deaths in southern Europe and a loss of nearly 15 billion euros. In the past 20 years, the occurrence of extreme droughts has meant the most extreme climatic period in the past 2000 years [
1,
2]. The 2020 European drought and record high temperatures created problems for farmers in the United Kingdom, France, the Netherlands, Germany, and some South European countries. The German mother river, the Rhine, dropped to a historic low, making freight in some sections almost impossible. The Hunger Stone can be seen again in the Elbe in Czechia, warning that the current water level is deficient. Across the Channel, the United Kingdom was not spared the drought in 2020, which coincided with Brexit, causing further stress to its population.
In a referendum on 23 June 2016, 51.9% of British citizens voted to leave the European Union (E.U.), a development that shocked the world—suggesting that in addition to rational considerations, cultural [
3,
4], economic [
5,
6], policy factors (accommodating refugees) [
7], and various crises can influence public behavior. While many studies have been conducted, none have studied Brexit from natural resources, primarily virtual water trade. Given the deep economic integration of internal free trade and the development of the E.U.’s economy, there is an implicit flow of trade resources [
8]. Water shortage has become an essential factor that exacerbated the refugee crisis in Europe. Part of the Syrian civil war outbreak was also due to drought and lack of water. Water shortages caused 1.5 million people in Syria (mostly farmers and herders) to lose their livelihoods and they were forced to leave their homes and flee to Europe. Regardless of economics or politics, water resources are critical to the United Kingdom and the European Union. It is worthwhile, therefore, to study Brexit by calculating the flow of water resources in the virtual water trade.
Virtual water is defined as the amount of water used to produce an item from beginning to end, and virtual water trade refers to the flow of virtual water driven by trade between countries or regions. As early as 1993, Allan [
9] proposed the concept of virtual water, and it took nearly 10 years before the scientific community recognized the importance of virtual water for balanced regional and global water security. Water is a renewable resource, but its availability varies in time and space. The current dense web of globalized production and consumption patterns, interlinked by international trade, stresses local water resources in many parts. Hence, in a globalized economy, local water depletion and pollution are often closely tied to in situ water use and consumption elsewhere, where water is used to produce commodities. Consequently, embodied or virtual water flows around the globe are associated with traded commodities.
Most studies have focused on water-scarce regions and emphasized virtual water transfer from water-abundant regions to water-scarce ones. However, this is not a long-term sustainable solution, since water-abundant regions might also face water challenges. Moreover, water-abundant regions can face water management problems such as pollution and low efficiency. Therefore, to gain insight into this issue, we must understand the water footprint and virtual water flows of water-rich regions. Few relevant studies [
10], however, have investigated water-rich regions. Many countries solve their water problems through commodity trade. Such dependencies not only affect the Middle East but also Germany, Belgium, and the Netherlands. Middle Eastern nations, however, are more sensitive to being dependent on food imports, which is caused by foreign domination.
Many studies have examined E.U. trade and foreign trade [
11,
12]. However, intra-E.U. trade, and especially with the U.K., is less discussed. Because of the profit-seeking behavior of trade, countries forget to protect their own water resources. Therefore, “embodied” or “virtual” water flows between the U.K. and the E.U. are associated with traded commodities. Implicit water flow can be observed in the trade flow between the United Kingdom (U.K.) and the E.U. Compared to econometric approaches, the advantage of an input–output analysis is its ability to assess virtual water in trade. Based on these considerations, our study will analyze the reasons for Brexit from the perspective of virtual water resources, based on the World Input–Output Tables (WIOT) database and multi-regional input–output analysis (MRIO). Considering the influences of driving forces, this study combined logarithmic mean Divisia index (LMDI) models to identify the maximum impacts, and make suggestions for a future trade cooperation in the U.K. after Brexit.
3. Results
The E.U. is the U.K.’s main trading partner. The U.K. depends on the E.U. for 52.97% and 55.16% of its exports and imports, respectively; thus, Brexit will first affect trade. Due to the elimination of trade barriers within the E.U., the E.U. is the U.K.’s largest trading partner (see
Figure 1). In 2019, the E.U. accounted for 47.6% of the U.K.’s total exports, as compared to 8.8% and 3.1% for the U.S. and China, respectively. The E.U. was also the U.K.’s largest importing economy, accounting for 52.3% of the U.K.’s total imports, compared to 6.7% and 6.6% for China and the U.S., respectively. After Brexit, trade will be greatly affected, and the reasons behind Brexit are, thus, worth discussing.
3.1. Variation in Worldwide Virtual Water Flows, 2000–2014
Virtual water flows played an increasingly important role in global water use during the period 2000–2014. In 2000, with the free and open world trade, the total virtual water flows amounted to 1.99 × 10⁵ Gm³, which increased to 2.17 × 10⁵ Gm³ in 2006, and in the following years, due to the economic and financial crisis affecting world trade, the virtual water flow fluctuated and finally increased to 3.13 × 10⁵ Gm³ in 2013. In other words, during the 15-year period, the quantity of virtual water flows increased by more than 157%, and the share of virtual water-related withdrawals increased. In addition, the direction of inter-country virtual water flows also changed during the same period.
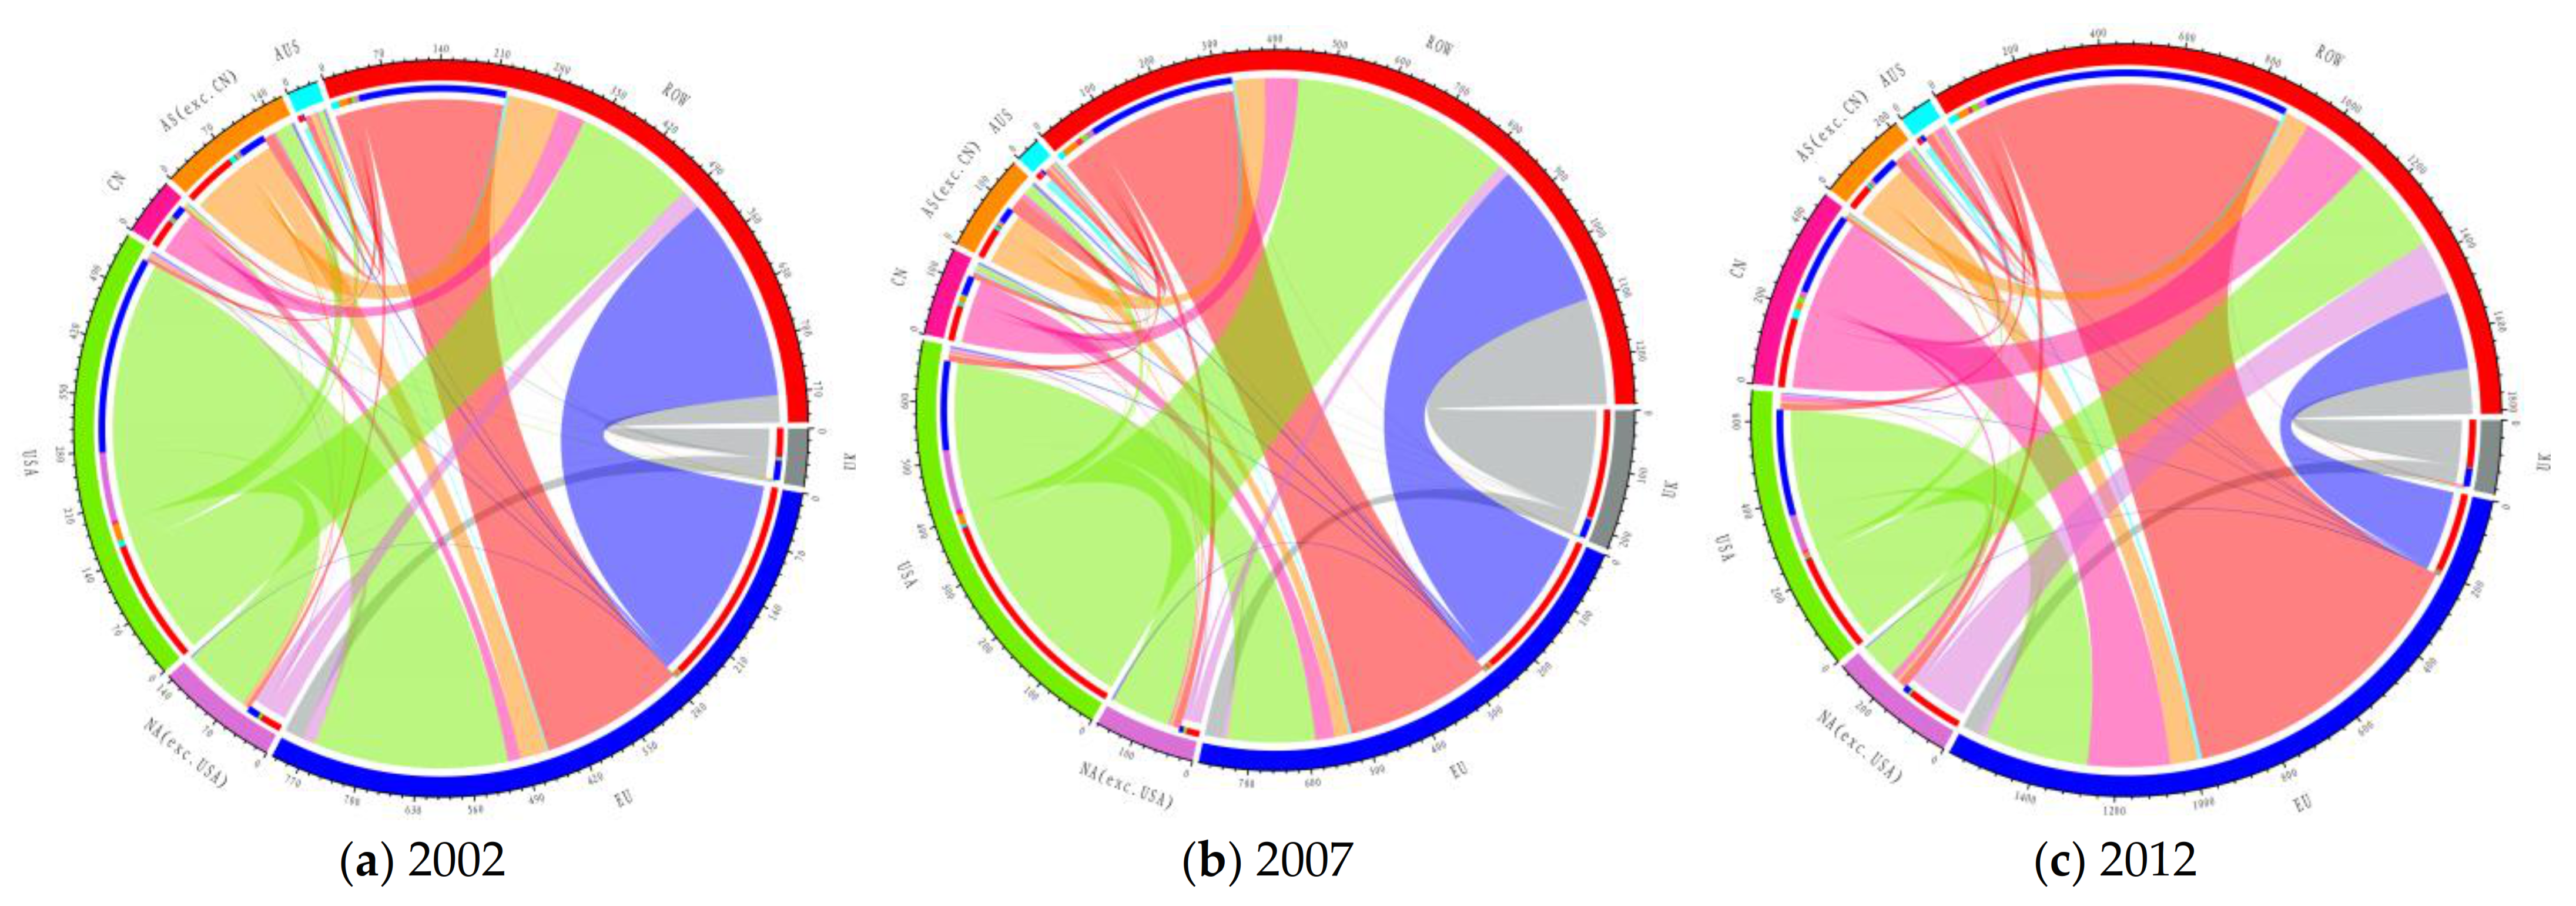
Figure 2 shows that a larger share of virtual water was exported to the world from the E.U., which imported comparably less virtual water. The main importer countries and regions were China, non-China Asia, the U.K., and the U.S. The E.U. and the ROW (rest of the world) were the main exporters to the U.K., which is partly dependent on the E.U. Based on the theory of comparative advantage and resource endowment theory, these countries import more agricultural products, which involve a lot of water resources. The virtual water trade can effectively alleviate the shortage of water resources in water-shortage areas. During 2000–2014, China was further strengthened as a major virtual water importer, while the U.S.’s share of virtual water imports decreased.
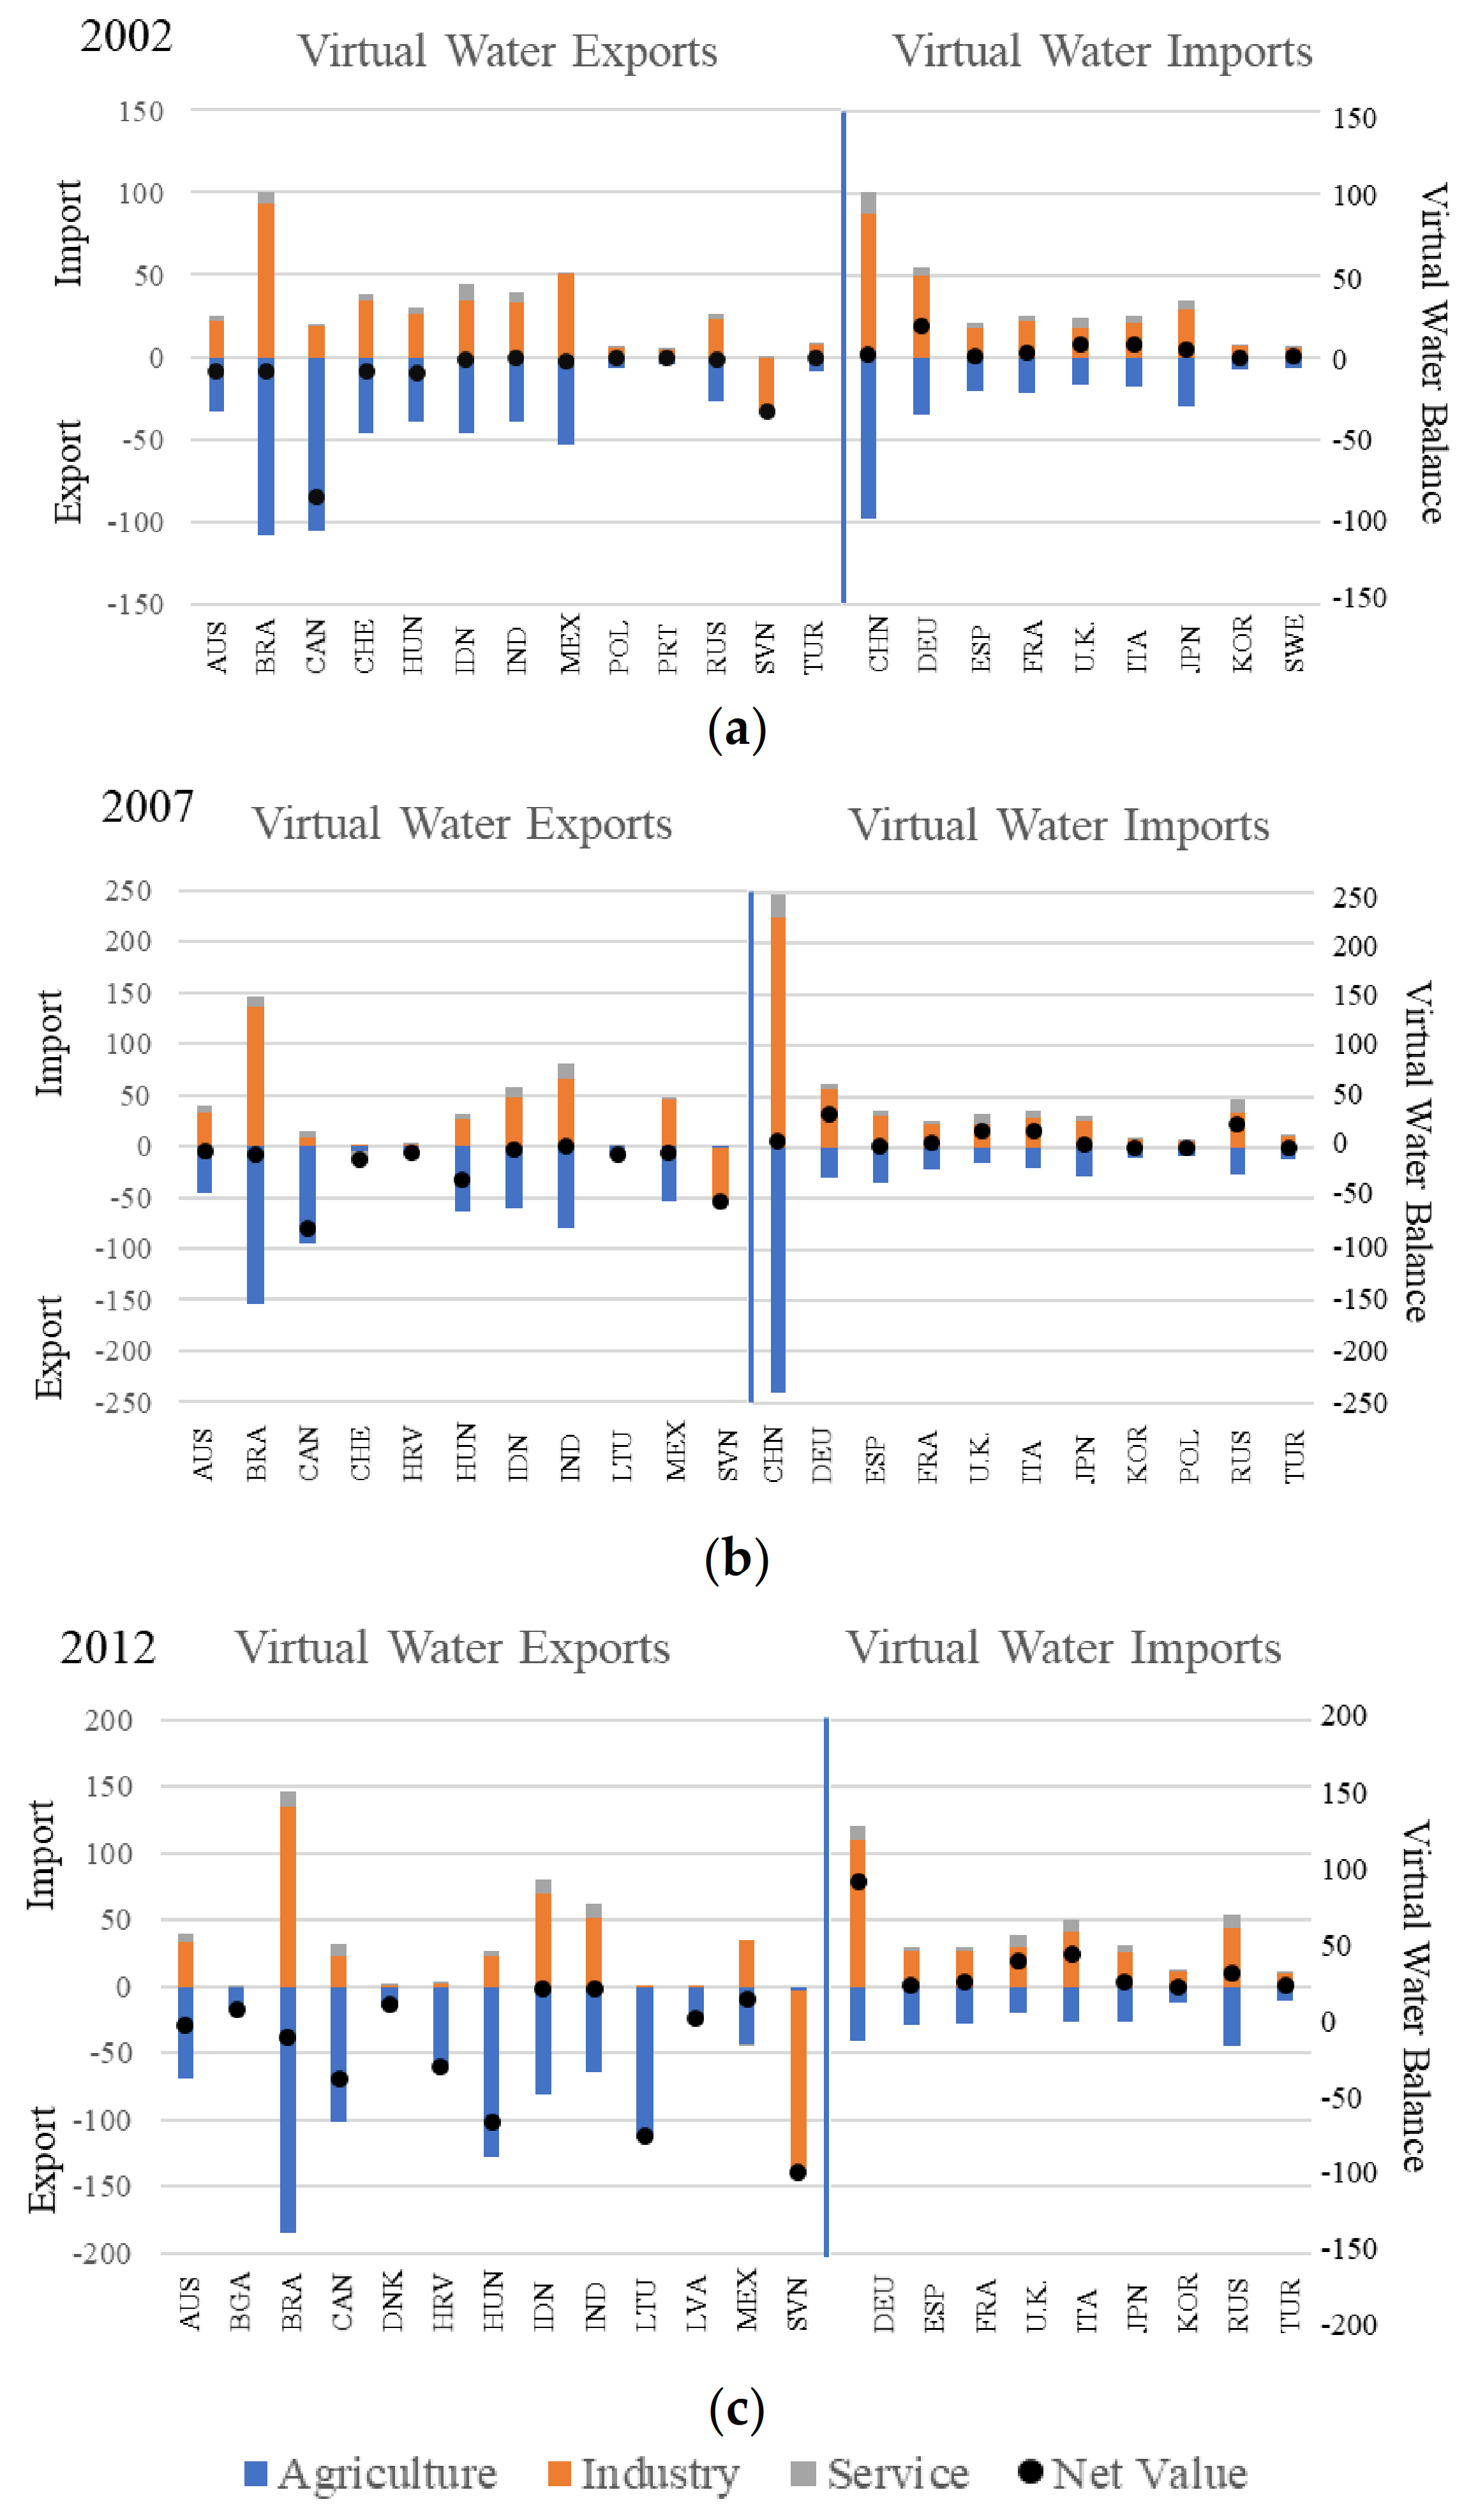
The 56 sectors were classified according to agriculture, industry, or services. Virtual water flows (containing exports and imports) related to the agriculture sector increased from 3.80 × 10⁴ Gm³/y in 2002, to 4.49 × 10⁴ Gm³/y in 2007, and to 5.13 × 10⁵ Gm³/y in 2012, accounting for about 49.5% of the total virtual water flows. Among all countries studied, virtual water flows increased on average from 5.38% to 29.37% during 2000–2014. The high growth rate is attributed to growing global trade and the amounts of virtual water flow hidden in that economy. The growth rate of virtual water flows from 2000 to 2001 in the U.K. was −9.29%, which continued after 2001; the figure changed to 38.81% from 2013 to 2014. Thus, with the E.U. having been a vital part of the U.K.’s partnership, Brexit will inevitably affect the U.K.’s virtual water imports and exports.
To further reveal the virtual water flows of each country, given the great differences in the order of magnitude,
Figure 3 excludes the largest (i.e., the U.S. and Norway) and the smallest (i.e., Finland) virtual water countries and portrays 22 countries occupying the middle positions. Notably, China’s virtual water flows increased annually. Since the data growth in 2008 was 1.27 Gm³, which is large compared to some other countries, China was excluded from 2008 to 2014. Among these countries, since animals and plants contain large amounts of virtual water (with animals having higher levels of virtual water than plants), agriculture remained the highest virtual water flow sector [
23].
3.2. Variation in Virtual Water Flows in the U.K. during 2000–2014
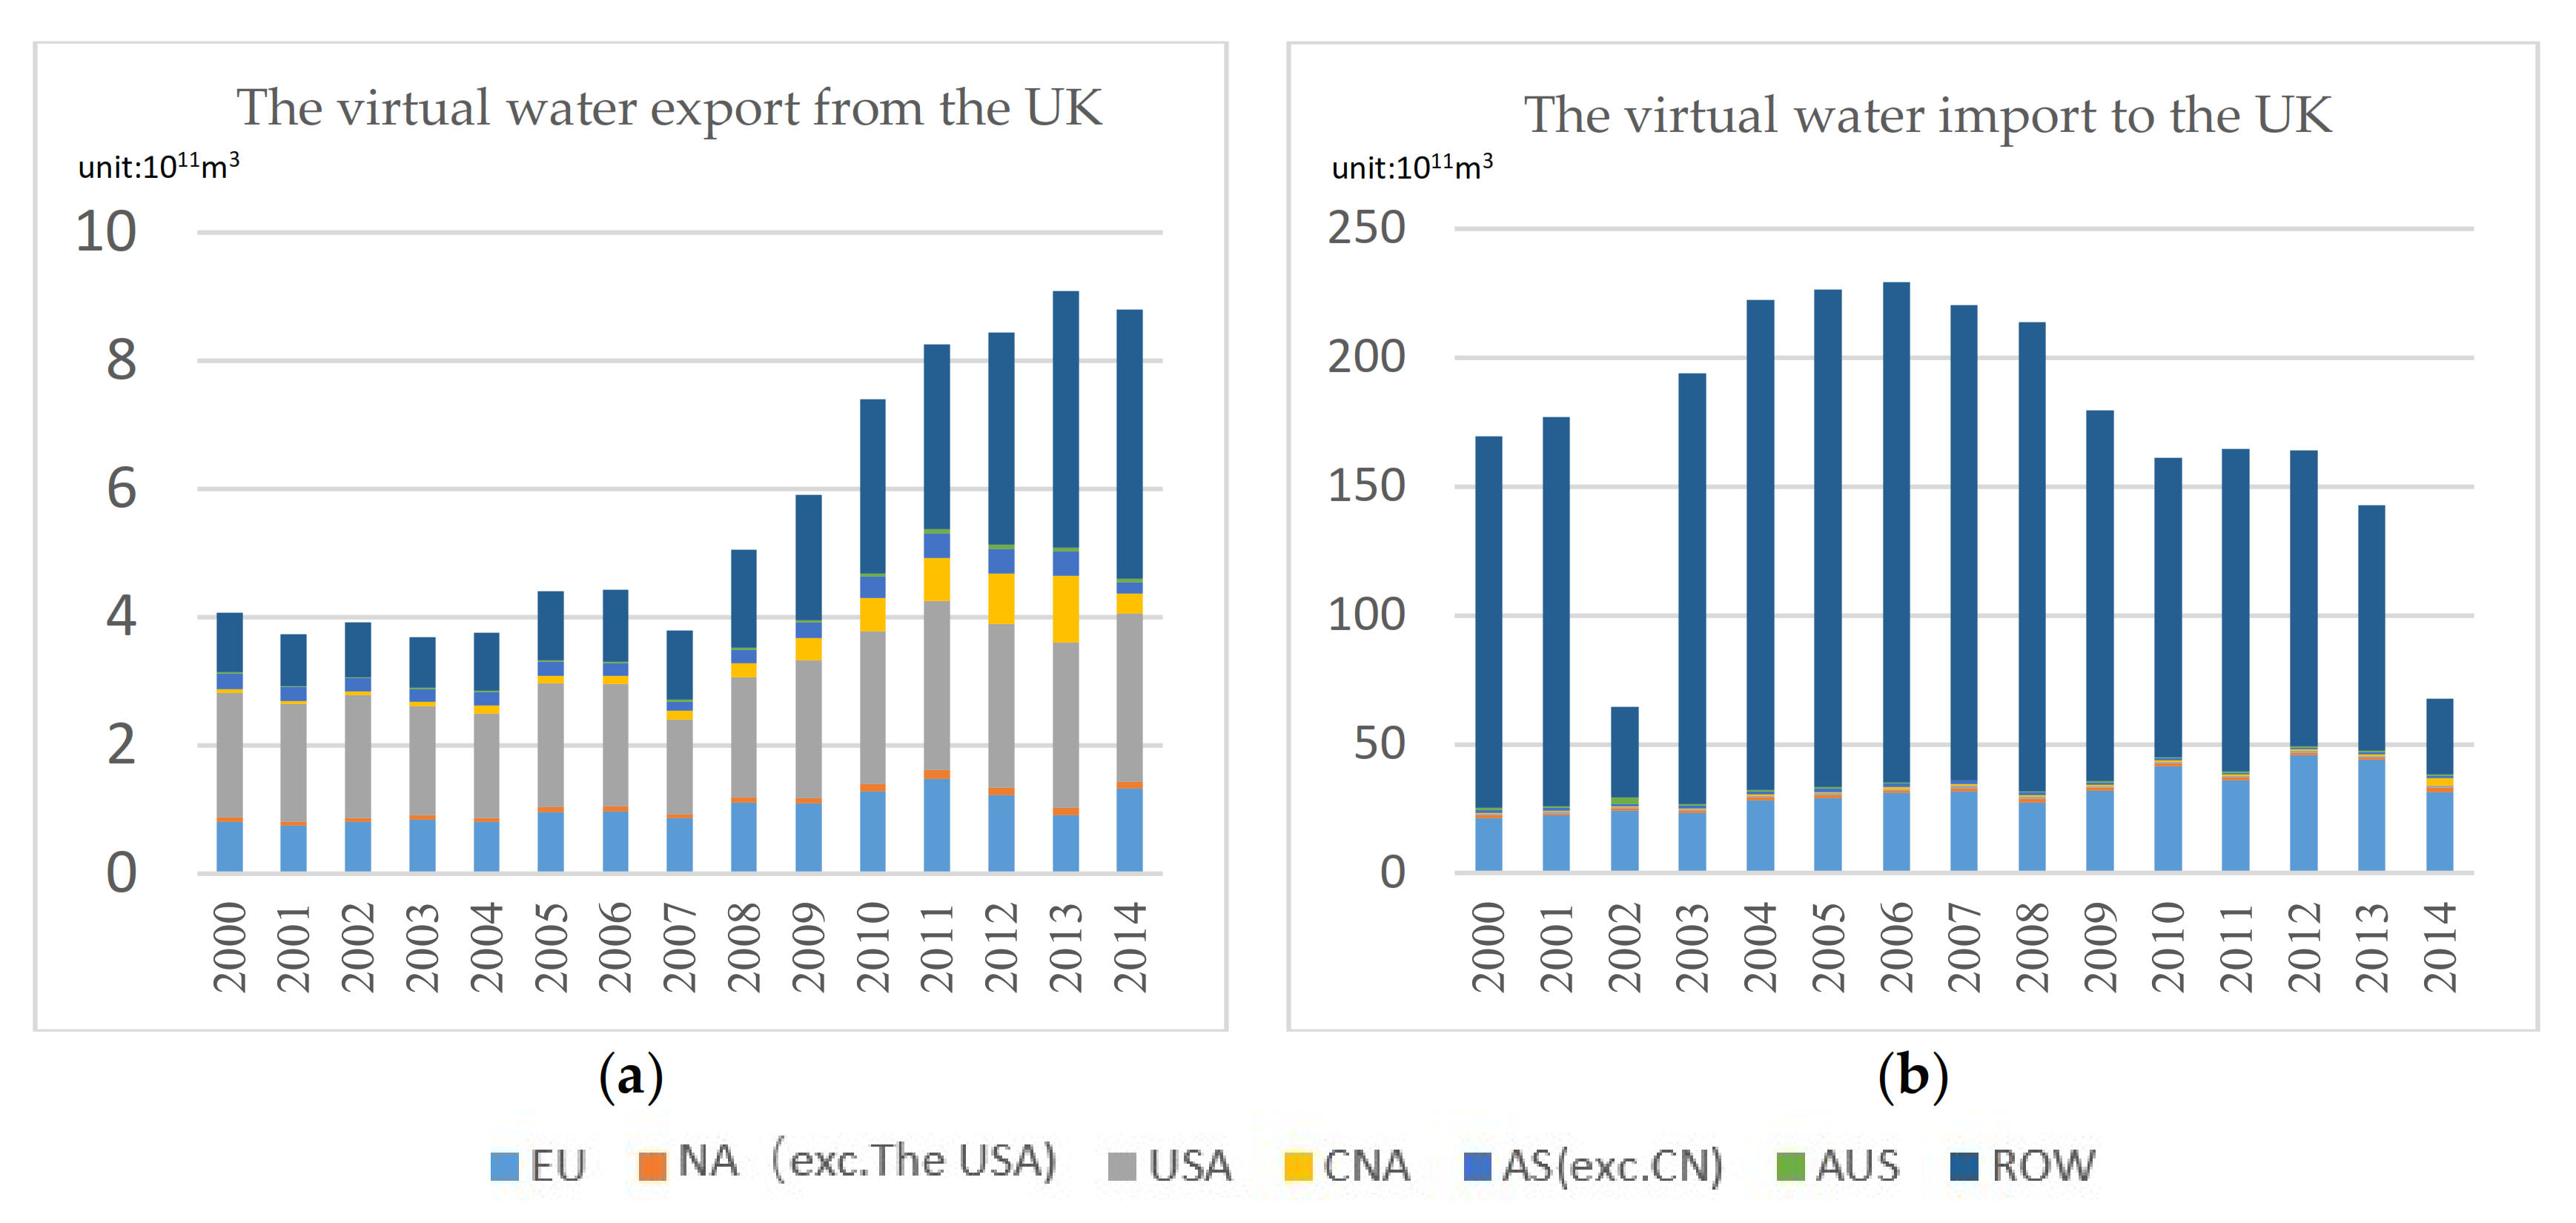
As shown in
Figure 4, the U.K. is an importer in the virtual water trade. Its total virtual water export flow was 84.67 Gm³, and its total import flow was 2595.42 Gm³. About 1.44% and 0.03% of these virtual water imports came from the E.U. and the U.S., respectively, but exports to the E.U. were lower compared to U.K. exports to the U.S. (0.05% and 0.1%, respectively). As trade between China and the U.K. has increased, non-China Asia’s virtual flow to the U.K. has declined. With Brexit, tariffs will be established with the E.U., which in turn will lessen trade between the U.K. and the E.U. Thus, from the perspective of virtual water, Brexit is unwise since it will affect the trade flow of virtual water.
3.3. Driving Forces in the E.U. behind Global Virtual Water Flows
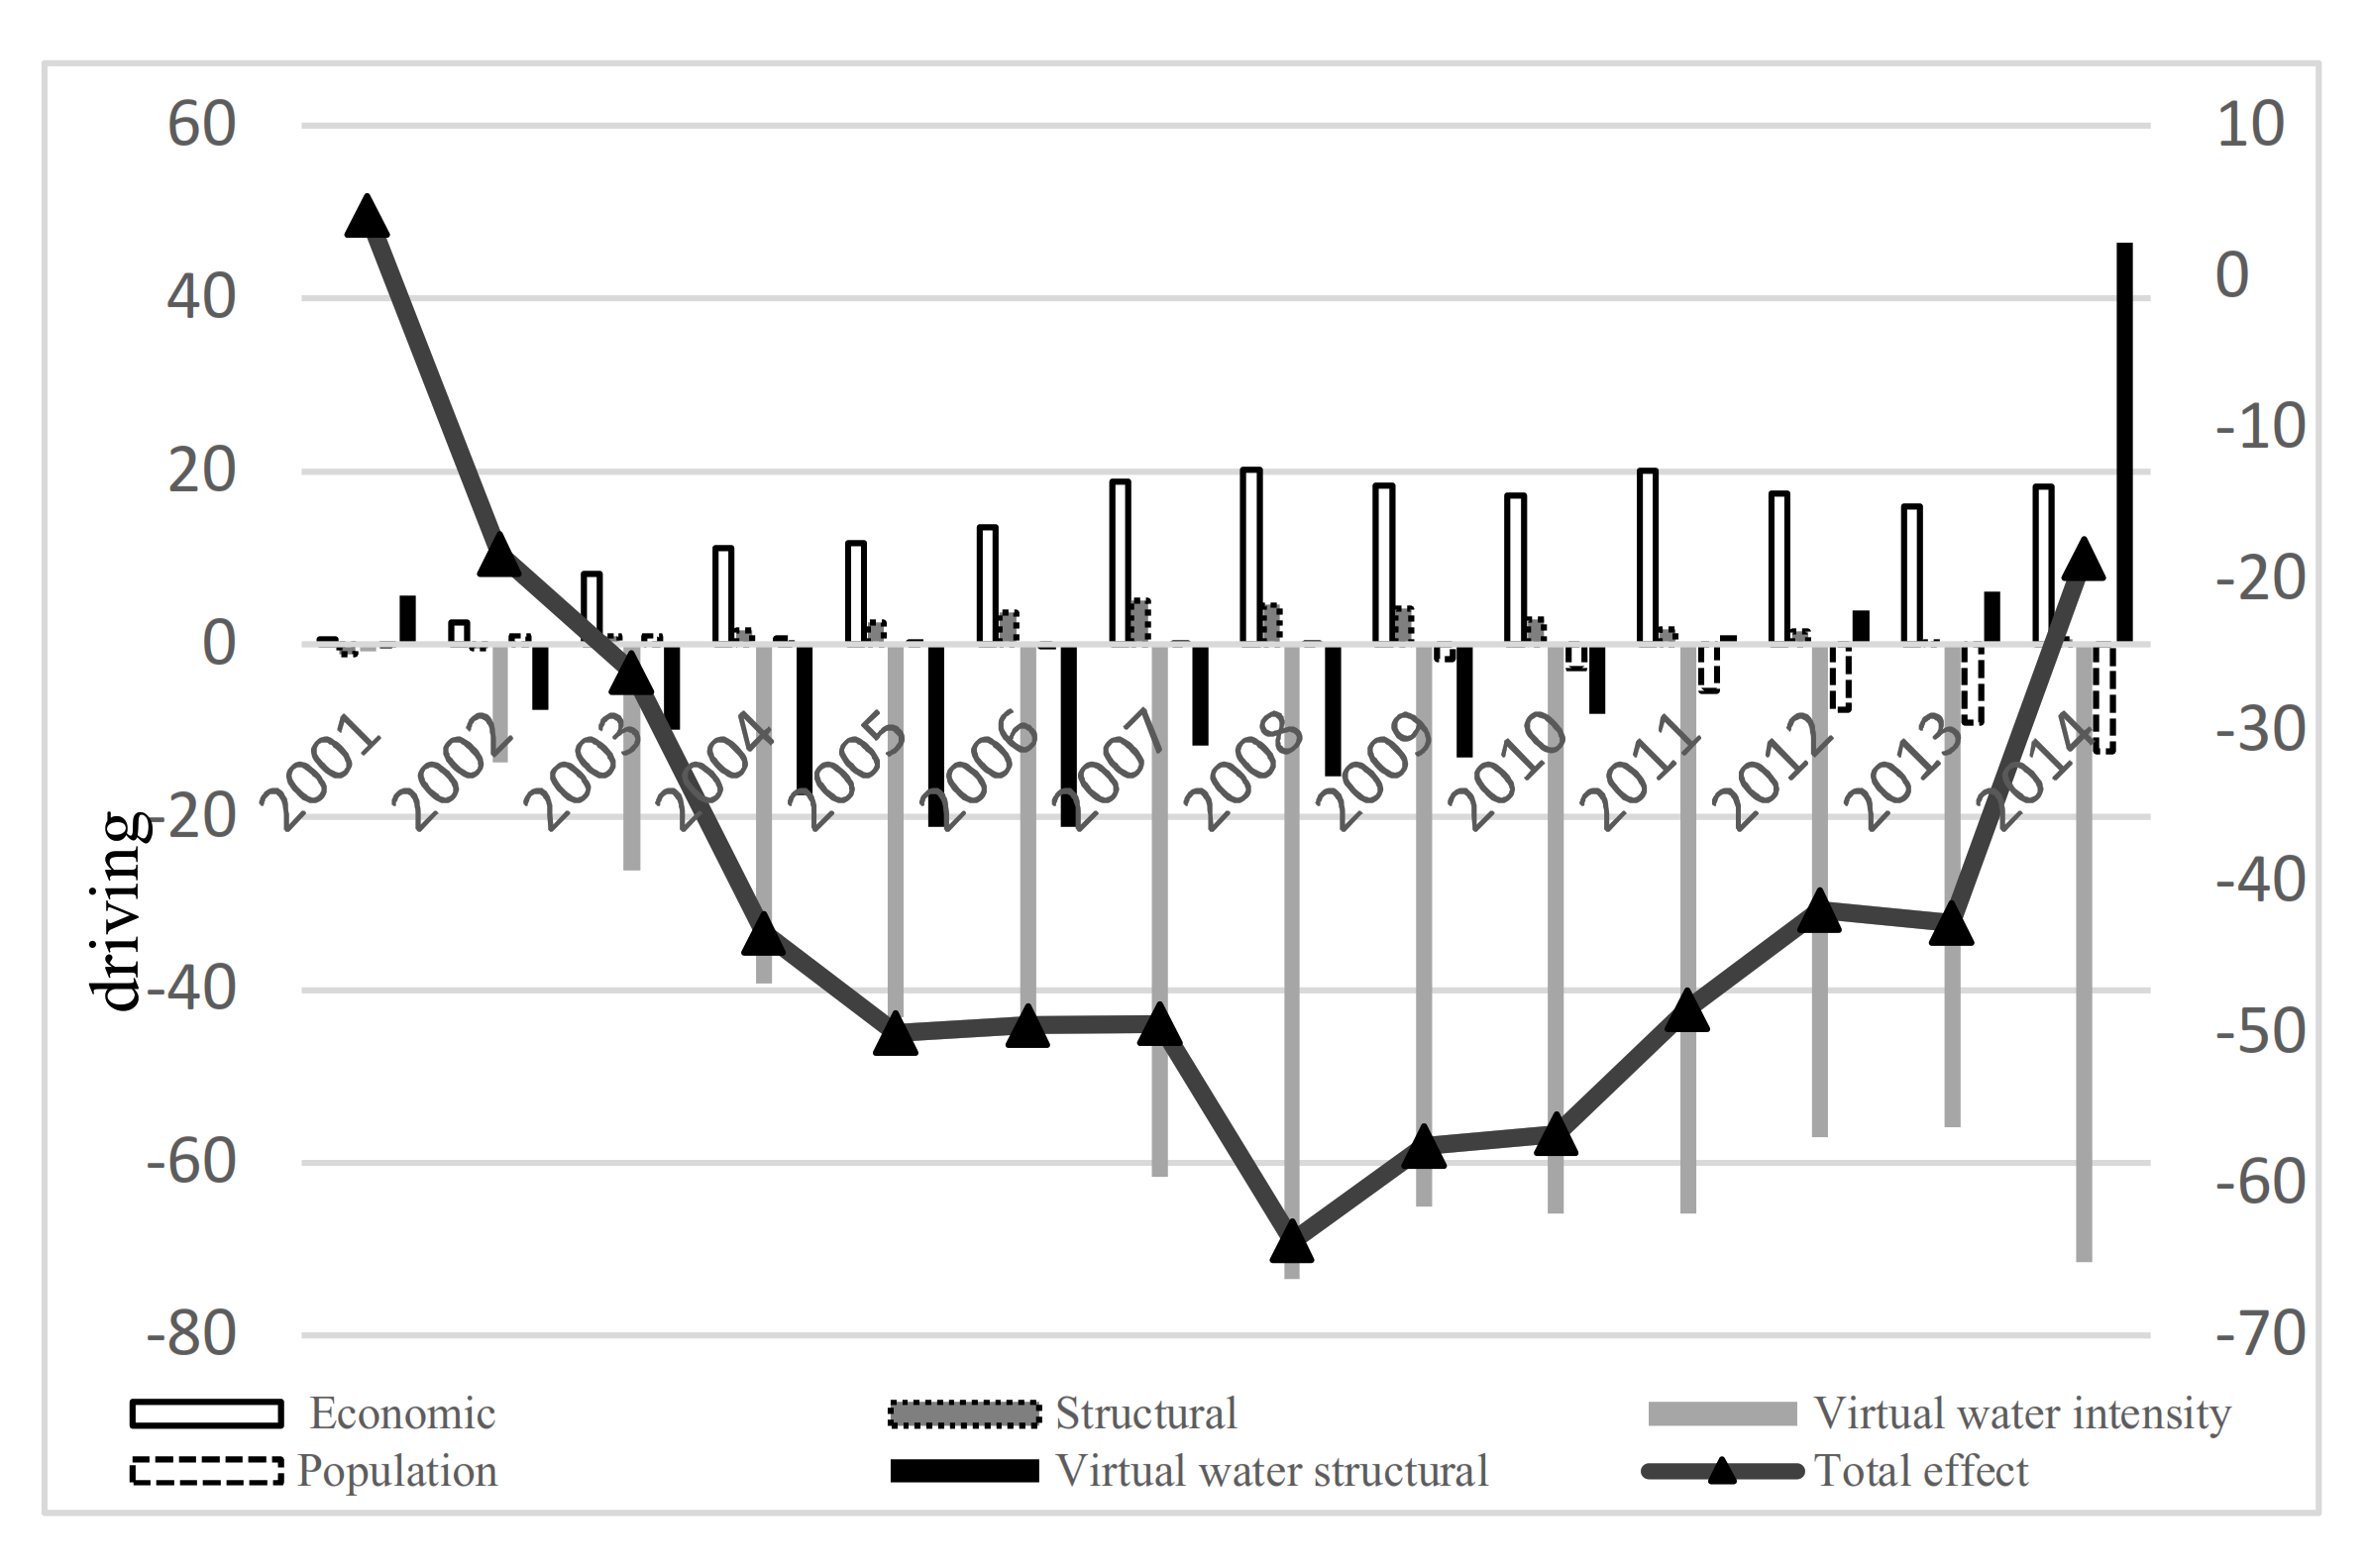
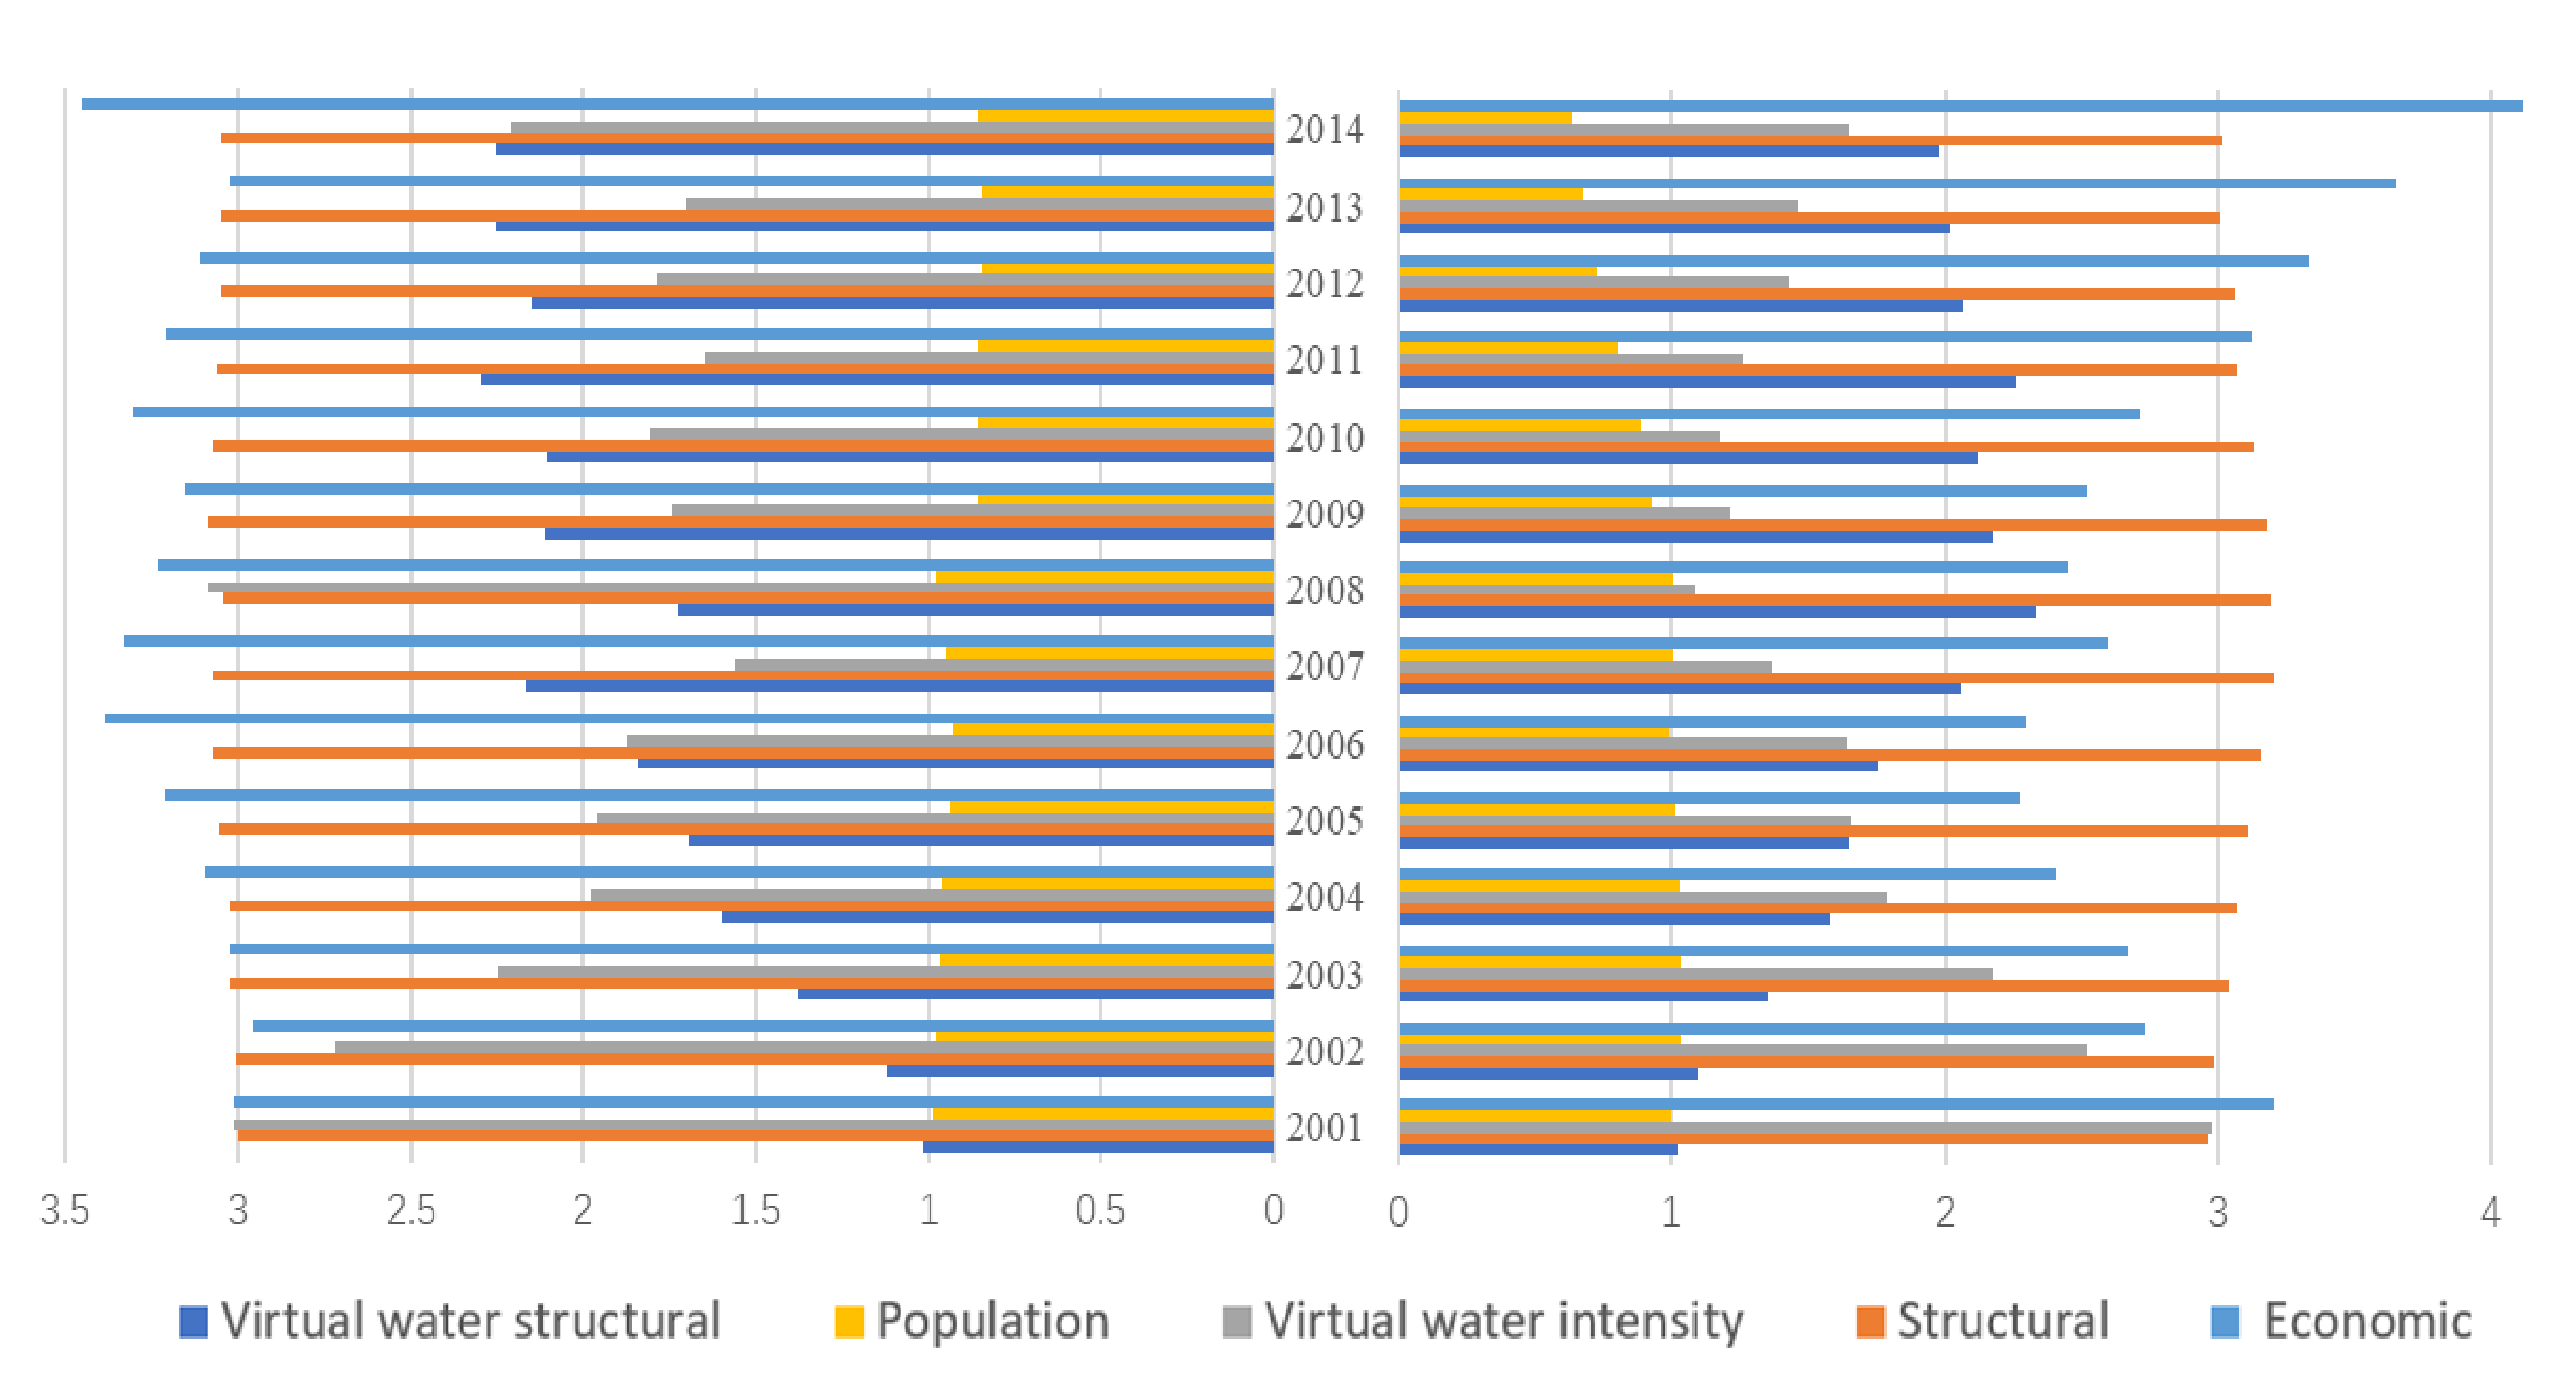
Using Equations (4)–(7), the population, economic, structural, intensity, and virtual water structural effects that drive the total virtual water flows of the E.U. were analyzed. The contribution of the economic effect to virtual water exports was positive every year during 2002–2014 but negative in 2001. The contribution of the structure effect was positive overall, and virtual water exports increased annually, except in 2001 and 2002. The contribution of the virtual water intensity effect was negative overall. The contributions of structural and population effects were generally positive and negative, respectively. Whether imported or exported, the effect of population on virtual water flow was slight. Structural and economic effects played important roles in virtual water flows, though the structural effect was steadier. Virtual water structural effects first increased, then decreased; conversely, virtual water intensity first decreased, then increased.
3.3.1. The Economic Effect
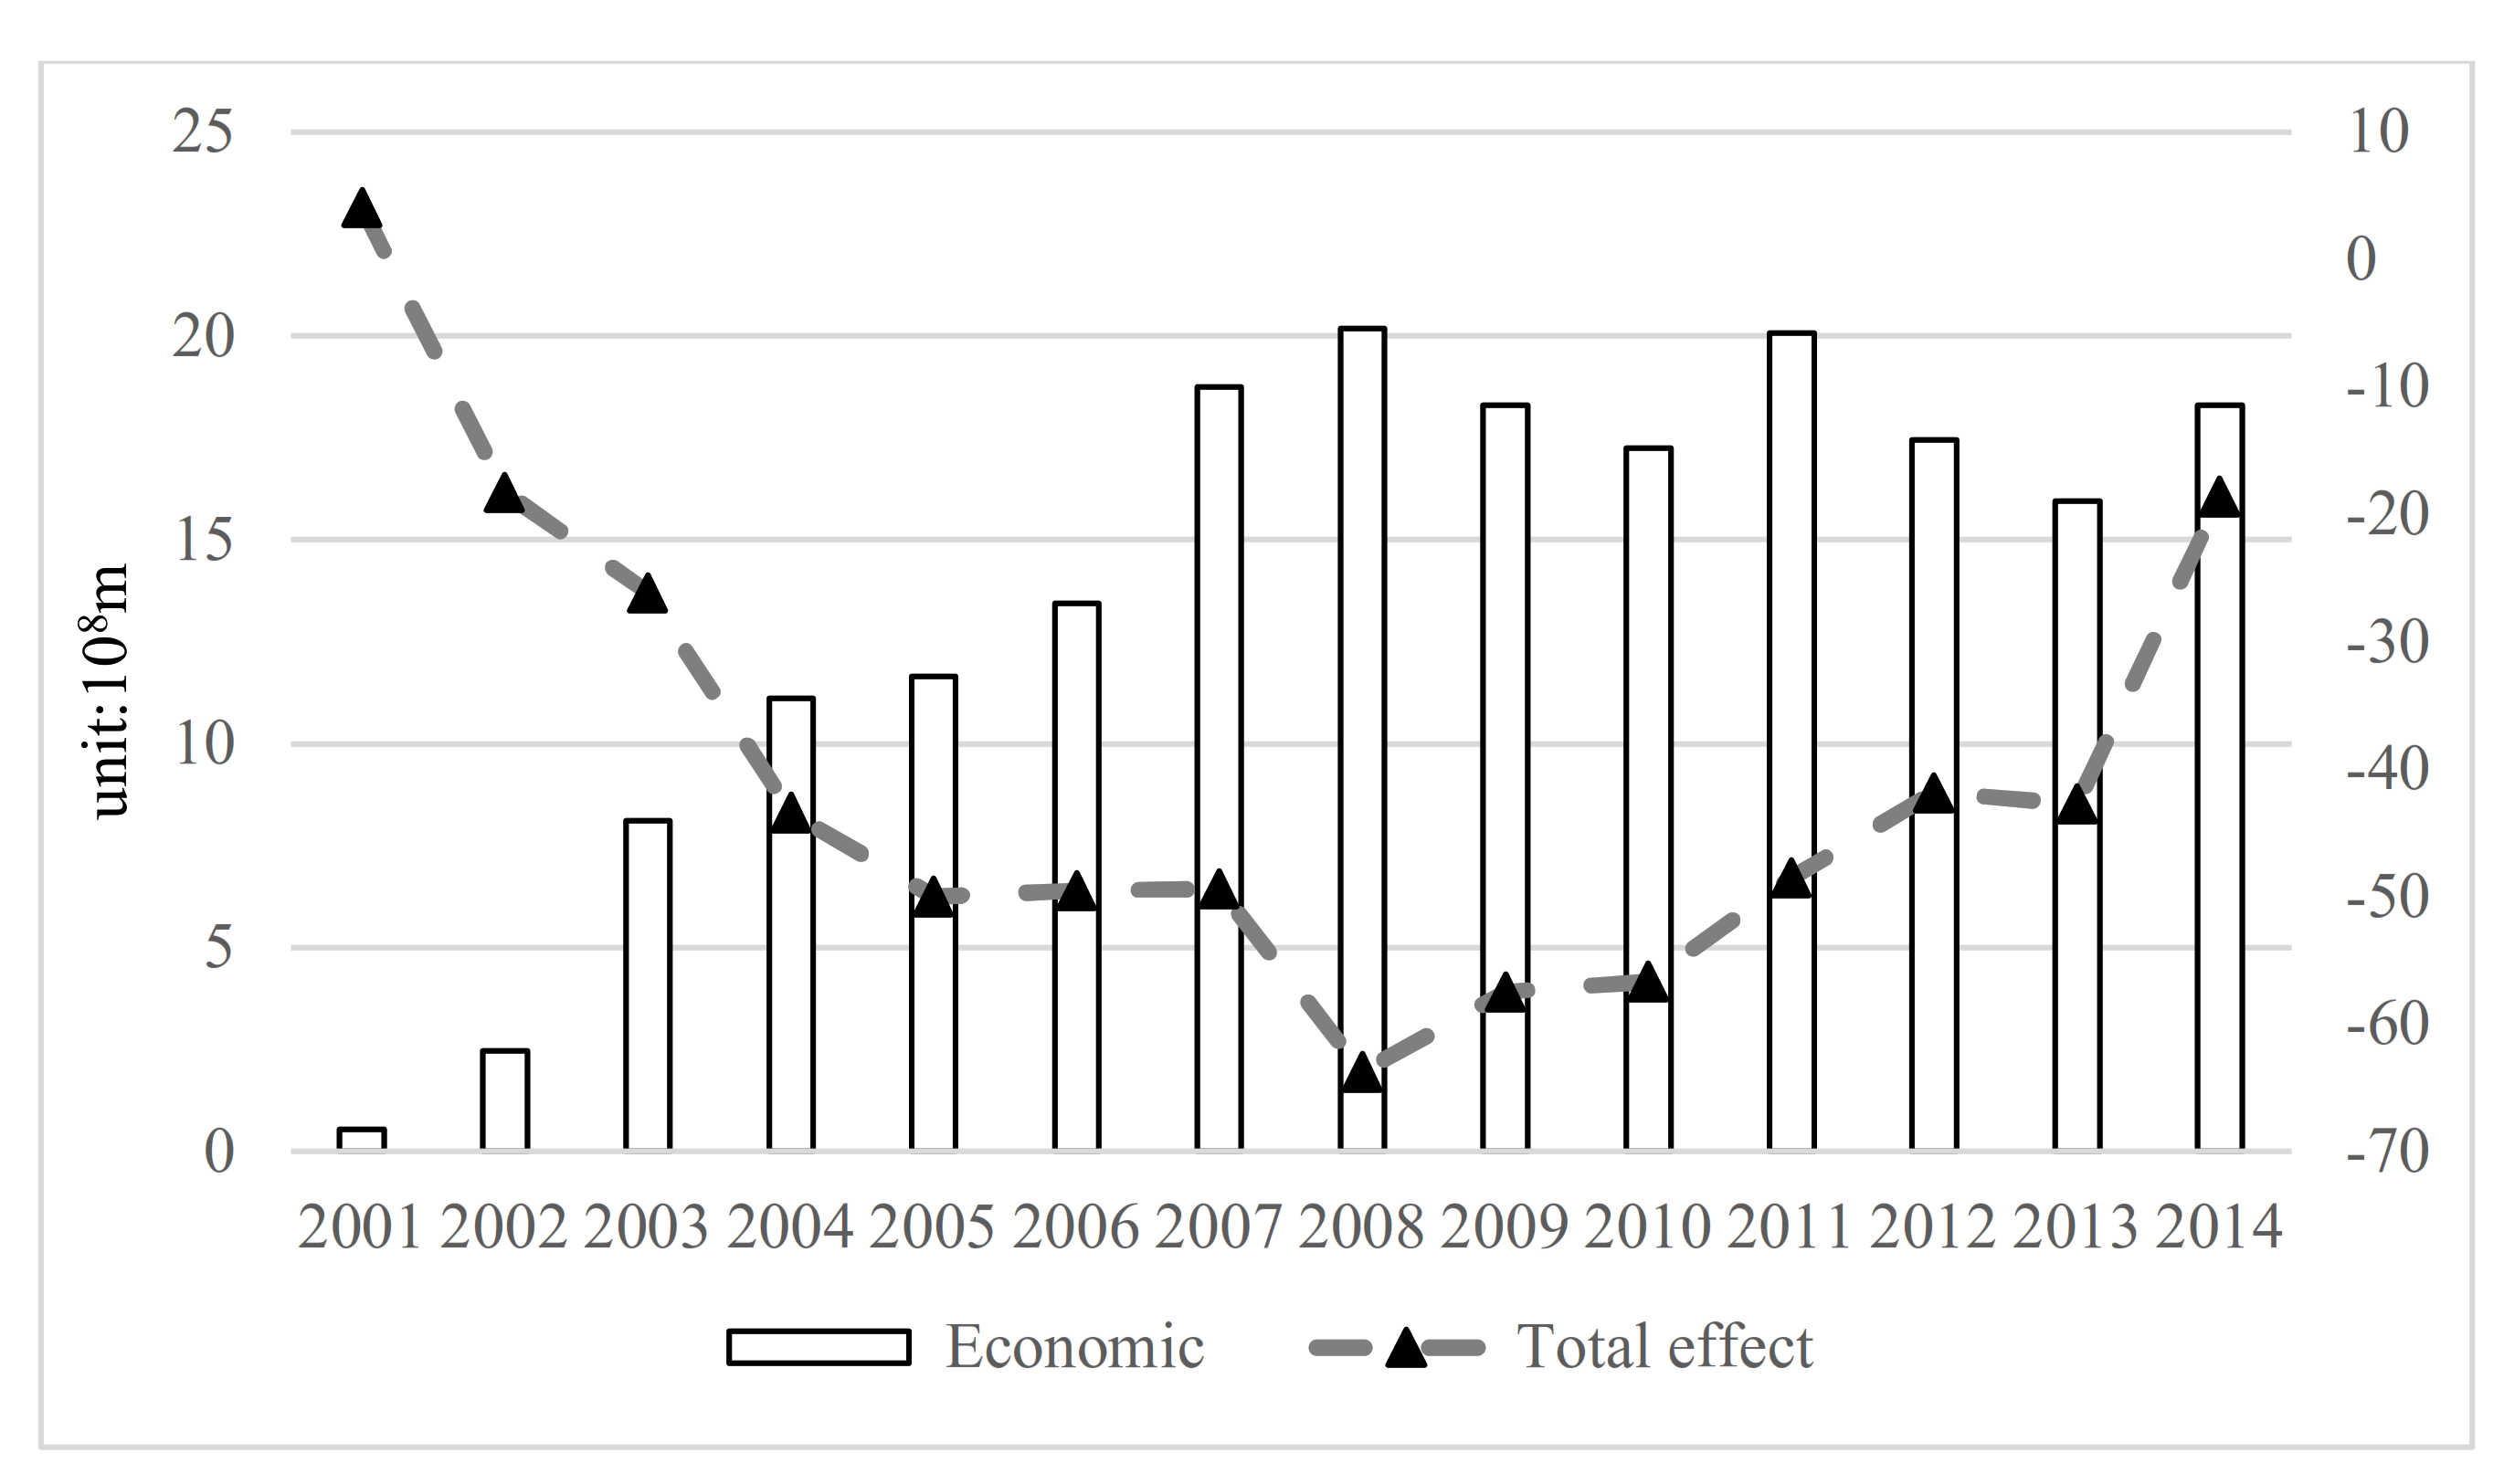
Per capita GDP was used to represent the economic effect, which reflects living standards.
Figure 5 shows that the economic scale effect positively influences virtual water exports. During the study period, its cumulative contribution to virtual water exports was 1936 million m³, indicating that the economic effect is the most important driving factor for the growth of virtual water exports in the E.U. The E.U.’s overall per capita GDP rose from 15,600.68 dollars per person in 2000 to 34,509.48 dollars per person in 2014; the growth rate was 121%.
Figure 6 shows the relationship between virtual water exports and per capita GDP during the study period. Between 2005 and 2014, virtual water exports and per capita GDP increased simultaneously. This suggests that the effect of economics on the increase in virtual water exports was gradually strengthened. This also reflects the socioeconomic development to some extent, with human development and water resources following the inevitable trend in tandem.
3.3.2. The Population Effect
A region’s resident population represented the population effect.
Figure 7 shows that the population effect positively influenced virtual water exports during 2001–2008 and became negative during 2009–2014; however, the impact was small. The cumulative effect was −362 million m³. The average annual population growth of the E.U. was 0.28% during 2000–2014. Population increases usually cause increases in consumption and an expansion of economic scale, thereby increasing virtual water consumption and positively affecting virtual water exports; yet, the effect was limited, as
Figure 7 shows.
3.3.3. Structural Effect
The structural effect mainly reflects the influence of different industrial structure changes on virtual water exports. Between 2003 and 2014, industrial structure slightly increased the growth of virtual water exports; the cumulative contribution effect was 276 million m³. To quantify the impact of different industries on virtual water exports, virtual water exports were compared in three sectors. Although agriculture occupies a large proportion, its value has been decreasing; however, industry and services have been increasing. This indicates that the industrial structure of E.U. organizations tends toward low water consumption, and the industrial virtual water use structure is becoming increasingly reasonable.
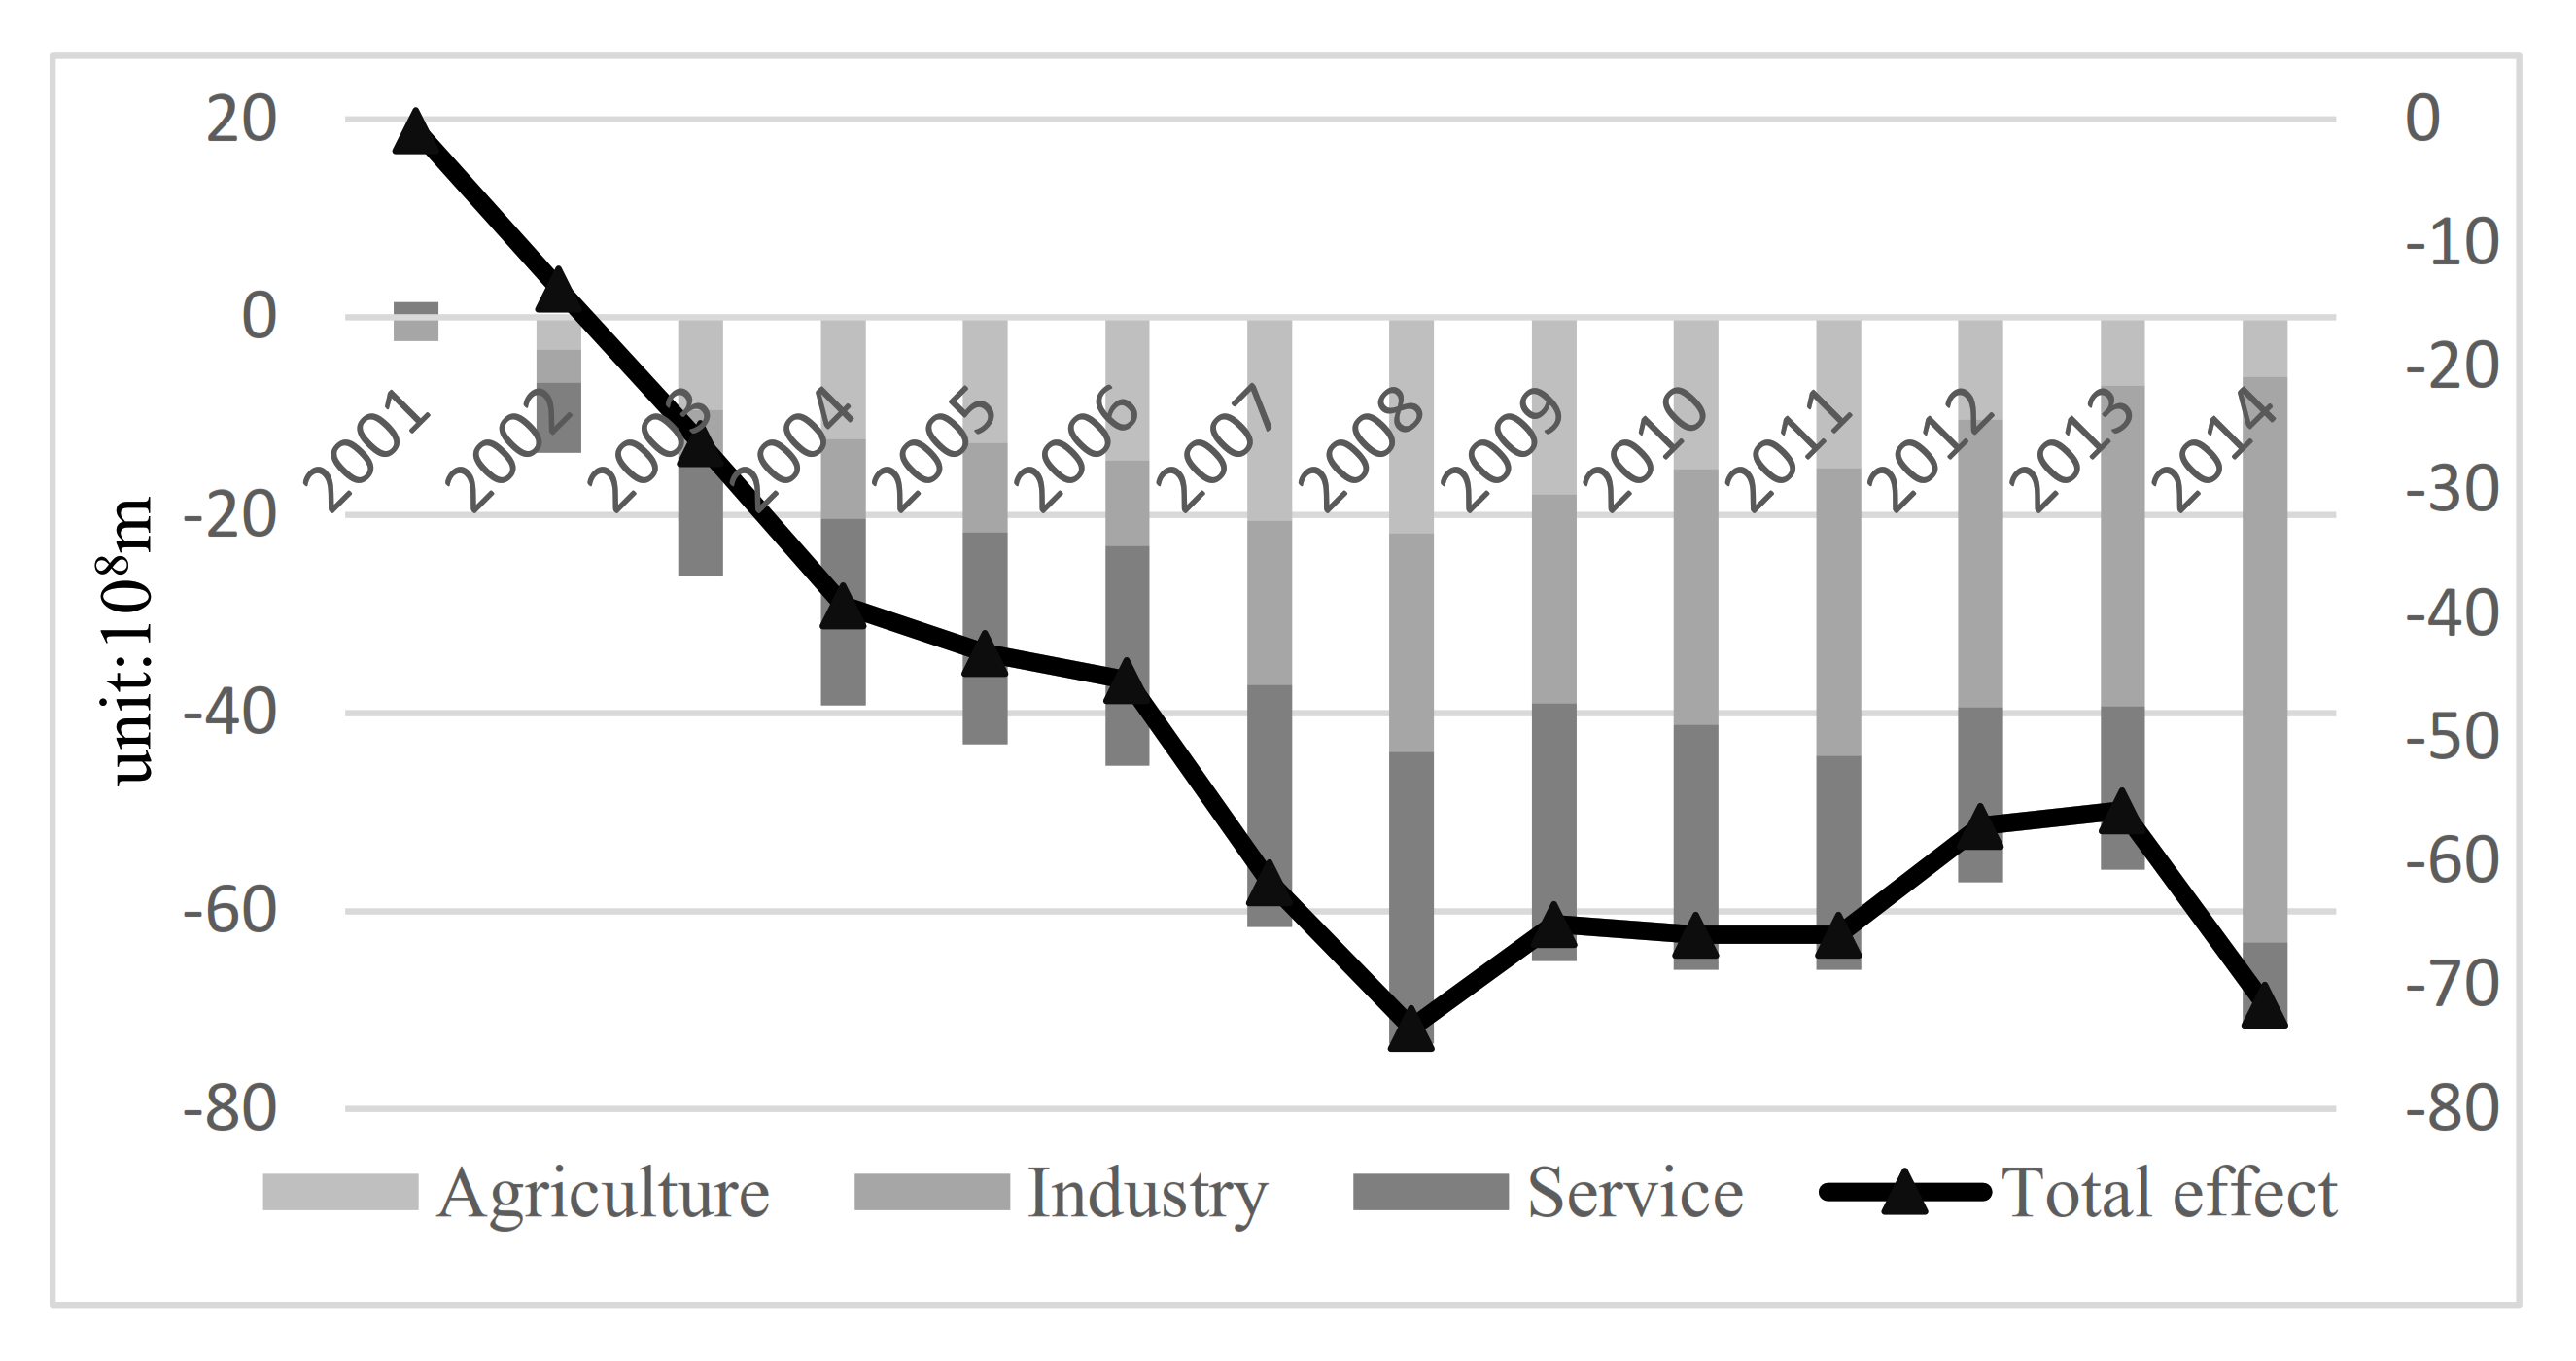
3.3.4. The Virtual Water Intensity Effect
Figure 8 shows that between 2000 and 2014, the effect of virtual water intensity on virtual water exports was inhibited; the cumulative contribution effect was −6849 million m³. Virtual water consumption per 10,000 dollars of GDP in the E.U. palpably decreased. Analyzing the effects of virtual water intensity in the industrial structure (
Figure 8), virtual water use intensity in agriculture was −13.7 million in 2001. The negative effect peaked at −2180 million in 2008 and then gradually decreased, reaching −603 million in 2014. Meanwhile, virtual water use intensity in industry was 230 million and then continuously increased, reaching −5179 million in 2014. The effect of service virtual water intensity on virtual water exports generally increased.
3.3.5. Virtual Water Structural Effect
The virtual water structural effect reflects the influence of structural changes in virtual water use on total virtual water flows. The agriculture sector had a low share of virtual water exports, and the effect of agricultural virtual water use on virtual water exports was negative; its cumulative effect was −826 million m³. Meanwhile, the industrial sector accounted for a large proportion of virtual water exports, and the effect of industrial virtual water use on virtual water exports was positive; the cumulative effect was 204 million m³. There was a slightly negative influence of the effect of service virtual water use on virtual water export; the cumulative effect was −2482.47 m³.
Based on the above analysis, the overall economic level of the E.U. is high, and it has sustained high growth. The pull effect on the growth of virtual water consumption has gradually weakened but has always constituted a strong pull effect. Therefore, to achieve “zero growth” or “negative growth” in virtual water resources, it is necessary to weaken the increase in water consumption caused by economic growth by optimizing industrial structure, improving water efficiency, and expanding virtual water imports. The E.U.’s water efficiency is dominated by the secondary industry. Thus, it is necessary to further reduce the proportion of the agriculture sector and improve the efficiency of agricultural water use, to popularize advanced water-saving technologies, rationally distribute the crop-planting structure, and optimize allocation of agricultural water resources. Second, the water-efficiency driving effect of the secondary industry is significant, and water-saving awareness needs to be further strengthened by closing or reducing high water consumption industries and encouraging low water consumption industries to meet the needs of water control.
4. Discussion
4.1. Findings
Using an MRIO approach and studying 43 countries and regions, this study found that virtual water flow played an increasingly important role in global water use between 2000 and 2014. There were more than 1014 m³ virtual water exports and imports annually. The E.U. is a virtual water exporter relative to virtual water imports, and about 31% of virtual water exports were to the U.S. in 2000. With its growing share in the world economy, China has also become a major importer of the E.U.’s virtual water. The U.K. is a net virtual water importer, mainly from the E.U. However, virtual water exports from the U.S. to the U.K. are negligible. After Brexit, trade between the U.K. and the E.U. will be restricted, and other countries will inevitably reestablish trade agreements with the U.K., which will also affect the volume and content of trade. This will inevitably affect the U.K.’s virtual water imports.
The U.S. and China are virtual water net import countries. China mainly imports agricultural virtual water, while the U.S. mainly imports industry virtual water. China is a water-shortage country and importing large quantities of agricultural virtual water can alleviate the country’s water crisis. However, some countries are water-shortage countries because of economics and technology and must export water-intensive products such as agricultural products. These countries need to adjust their industrial structure, learn industrial technologies from developed countries, and transform their industrial virtual water export structure.
Based on the LMDI results, the economic development contributed the most to increases of virtual water exports. The per capita GDP increased by more than 121% during the past 15 years, and the E.U. has maintained a high economic development rate. Its continuation will amplify the impact of virtual water flows on future local water scarcity. Therefore, it is necessary to actively import virtual water to compensate for the use of local water resources. Water-intensive products (e.g., crops and fruits) can be imported while labor-intensive or technology-intensive products can be exported.
LMDI showed that while population increases positively affected virtual water exports, the effect was limited. The industrial structure of the E.U. is inclined toward low water consumption, and the industrial virtual water use structure is becoming efficient. The effect of virtual water intensity on industrial water consumption is negative, as this consumption in each industry is palpably decreasing.
4.2. Policy Implications
Brexit will profoundly affect the policy direction of the E.U. At the economic and trade levels, while an E.U. member, the U.K. had always been a main driving force to promote trade liberalization. It is also important to maintain balance between liberal and conservative parties within the E.U. The withdrawal of the U.K. imposes changes on the current global trade governance pattern, which will force the E.U. to adjust its policies on investment review, trade remedies, and government intervention in the economy. As for the long-term U.K.–E.U. trade negotiations that have attracted the attention of various parties, the U.K. has set three major red lines for withdrawing from the E.U.: not accepting the jurisdiction of the European Court; having independent trade policies; and ending the free movement of people. The E.U. emphasizes equal rights and obligations. How the core differences will be resolved in the future remains unclear.
The diplomatic philosophy between the U.K. and the E.U. is more compatible than transatlantic diplomatic coordination. More critically, after the split, the two parties’ dependence on each other will increase. The U.K. has lost its natural voice of foreign policy, and the E.U. has lost its organic combination of major international organizations, as well as its second-largest economy. It will take time to determine how to build close diplomatic coordination between the U.K. and the E.U., and whether the E.U. can maintain its original diplomatic attention to the Asia-Pacific region outside of China.
For the U.K., Brexit does not represent victory but a new stage of uncertainty. After Brexit, the U.K. will seek more global positioning. Whether the U.K. aims to promote free trade, promote a “rules-based international order,” or respond to global climate change, China will undoubtedly be an important partner.


