Article

Flood Control Risk Identification and Quantitative Assessment of a Large-Scale Water Transfer Project

State Key Laboratory of Simulation and Regulation of Water Cycle in River Basin, China Institute of Water Resources and Hydropower Research, Beijing 100038, China
*
Author to whom correspondence should be addressed.
Water 2021, 13(13), 1770; https://doi.org/10.3390/w13131770
Submission received: 28 May 2021 / Revised: 23 June 2021 / Accepted: 23 June 2021 / Published: 26 June 2021

Abstract

:
Flood control risk is one of the main risks affecting the safe operation of large-scale water transfer projects. Systematically identifying the flood control risk in the project and carrying out risk classification and hierarchical management are problems for project managers. Based on the theory of system and risk assessment, this paper starts with the various risk sources and risk events involved in the whole process of the flood disaster chain, the risk of flood disaster factors, the exposure of the disaster-bearing body, and the vulnerability of the disaster-originating environment are combined. Then, we systematically and comprehensively identify the flood control risks of a large-scale water transfer project, which are divided into four types of risk elements: rainfall–runoff; confluence and flow capacity; the geological characteristics of canal section; economic and social layouts. Specific risk factors are identified for each type of risk element, and a flood control risk evaluation index system for a water transfer project is proposed. According to the framework of the analytic hierarchy process (AHP), a quantitative assessment of comprehensive flood control for water transfer projects is carried out. Taking the middle route of the South-to-North Water Transfer Project in China as an example, this paper evaluates the integrated flood control risks of 39 engineering units, identifies six units with higher risk levels, analyzes the causes, and suggests engineering and non-engineering countermeasures to prevent and reduce the occurrence of risk accidents. This method is not only used for comprehensive flood control risk assessment and risk management in the operation and management stage of the large-scale inter-basin water transfer project, but also has a reference value in considering the optimal layout of the project water transmission line from the perspective of flood control in the planning and design stage.

1. Introduction

Due to the limitations of natural endowment conditions and the rapidly increasing demand for water [1], water shortage has become a key factor restricting social and economic development in many countries and regions [2,3,4,5]. The construction of a large-scale inter-basin water transfer project is an important measure to solve the uneven spatial and temporal distribution of water resources in time and space, and to support the sustainable economic and social development of water-affected receiving regions [6,7,8,9]. The so-called ‘water transfer project’ means ‘to divert, regulate, and supply water from water rich areas to water deficient areas’, to realize the optimal allocation of water resources. The water transfer project is a large-scale series system with long engineering routes [10], often crossing different basins and river systems, passing through different climate zones and water receiving areas [11,12]. The project climate and underlying surface conditions are complex and diverse, and there are many uncertainties and risk factors, among which flood control risk is one of the main risks affecting the safe operation of the large-scale water transfer project [13,14].
At present, there are more qualitative descriptions and fewer quantitative assessments of flood control risk analysis of large-scale water transfer projects. For the identification of risk factors—flood risk, earthquake, freezing and other natural disasters, are generally regarded as a class of factors that affect the safe operation of the project [15]. Hydrologic risk factors are given more attention, but the flood risk of the project is not (systematically and comprehensively) identified in combination with the structural characteristics of different cross-sectional buildings and the engineering geological characteristics of the canal section. Tian Ying et al. [16] identified the risk factors of floods, earthquakes, and other geological disasters, which may lead to dam collapse, as engineering risk factors of cross-border river safety. In terms of quantitative assessment, the comprehensive flood control risk of a certain channel section is analyzed from the perspective of the possibility of water damage in the cross-sectional buildings [17,18]. For example, whether the designed rainstorm (flood) in the basin above the cross-sectional area (exceeding the design standard of the cross-sectional building) is taken as the measurement standard, or the probabilistic inference network method is used to evaluate the flood risk degree of each channel by integrating the flood level and anti-risk ability level. Song Qian et al. [18] identified some risk factors—flood damage, earthquake damage, freezing disaster, inadequate design, construction, and operation maintenance, based on the failure modes of cross buildings. Zhu Yuan et al. [19] adopted the method of combination, established the flood risk calculation framework of the main canal, and proposed a two-dimensional composite event risk calculation model. Liu Heng et al. [20] proposed a failure risk calculation model, which is suitable for cross-sectional buildings under various flood conditions. The basic premise of the probabilistic combination method [21] is as follows: it is assumed that the cross-sectional buildings will be destroyed, and the water supply of the main canal will be interrupted when the cross-sectional buildings is subjected to a flood exceeding the standard design. However, in the actual situation, this is not necessarily the case, and the method is relatively complicated and not convenient for general technical and engineering management personnel.
From the perspective of hydrological factors, torrential rain is the source of risk for catastrophic floods, and the rise in the river water level is a risk event caused by torrential rain; considering the safety of the water transfer project, the rise in the upstream water level of the crossing building is the risk source of engineering diseases, and flood damage to the project is a risk event. In turn, this may adversely affect local flood control on the left and right banks of the main canal. Therefore, in view of super-large and complex engineering systems, such as water transfer projects, based on the systematic identification of various risk sources, risk events, their causes, and the potential consequences, and based on the risk assessment theory, flood risk assessment of the whole disaster chain process should be carried out by integrating risk factors, such as the risk of flood disaster factors, the exposure of the disaster-bearing body and the vulnerability of the disaster pregnant environment.
In view of the deficiencies of the existing flood control risk assessment method, this paper proposes a flood control risk identification and assessment method for large-scale water transfer projects. From the perspective of the whole rainfall–runoff chain, flood process, and flood impact, combined with the characteristics of the different water conveyance canal sections, and the structural characteristics and flow capacity of the cross-sectional buildings, the authors comprehensively and systematically analyzed the flood control risk of upstream flood factors regarding the safety and local impact of the canal section, and constructed a flood control risk rating index system for the water transfer project. At the same time, a comprehensive quantitative assessment method is proposed to determine the flood risk level of the canal section, which could provide scientific support for decision-making on flood risk management for the water transfer project.

2. Flood Control Risk Identification and Assessment Methods

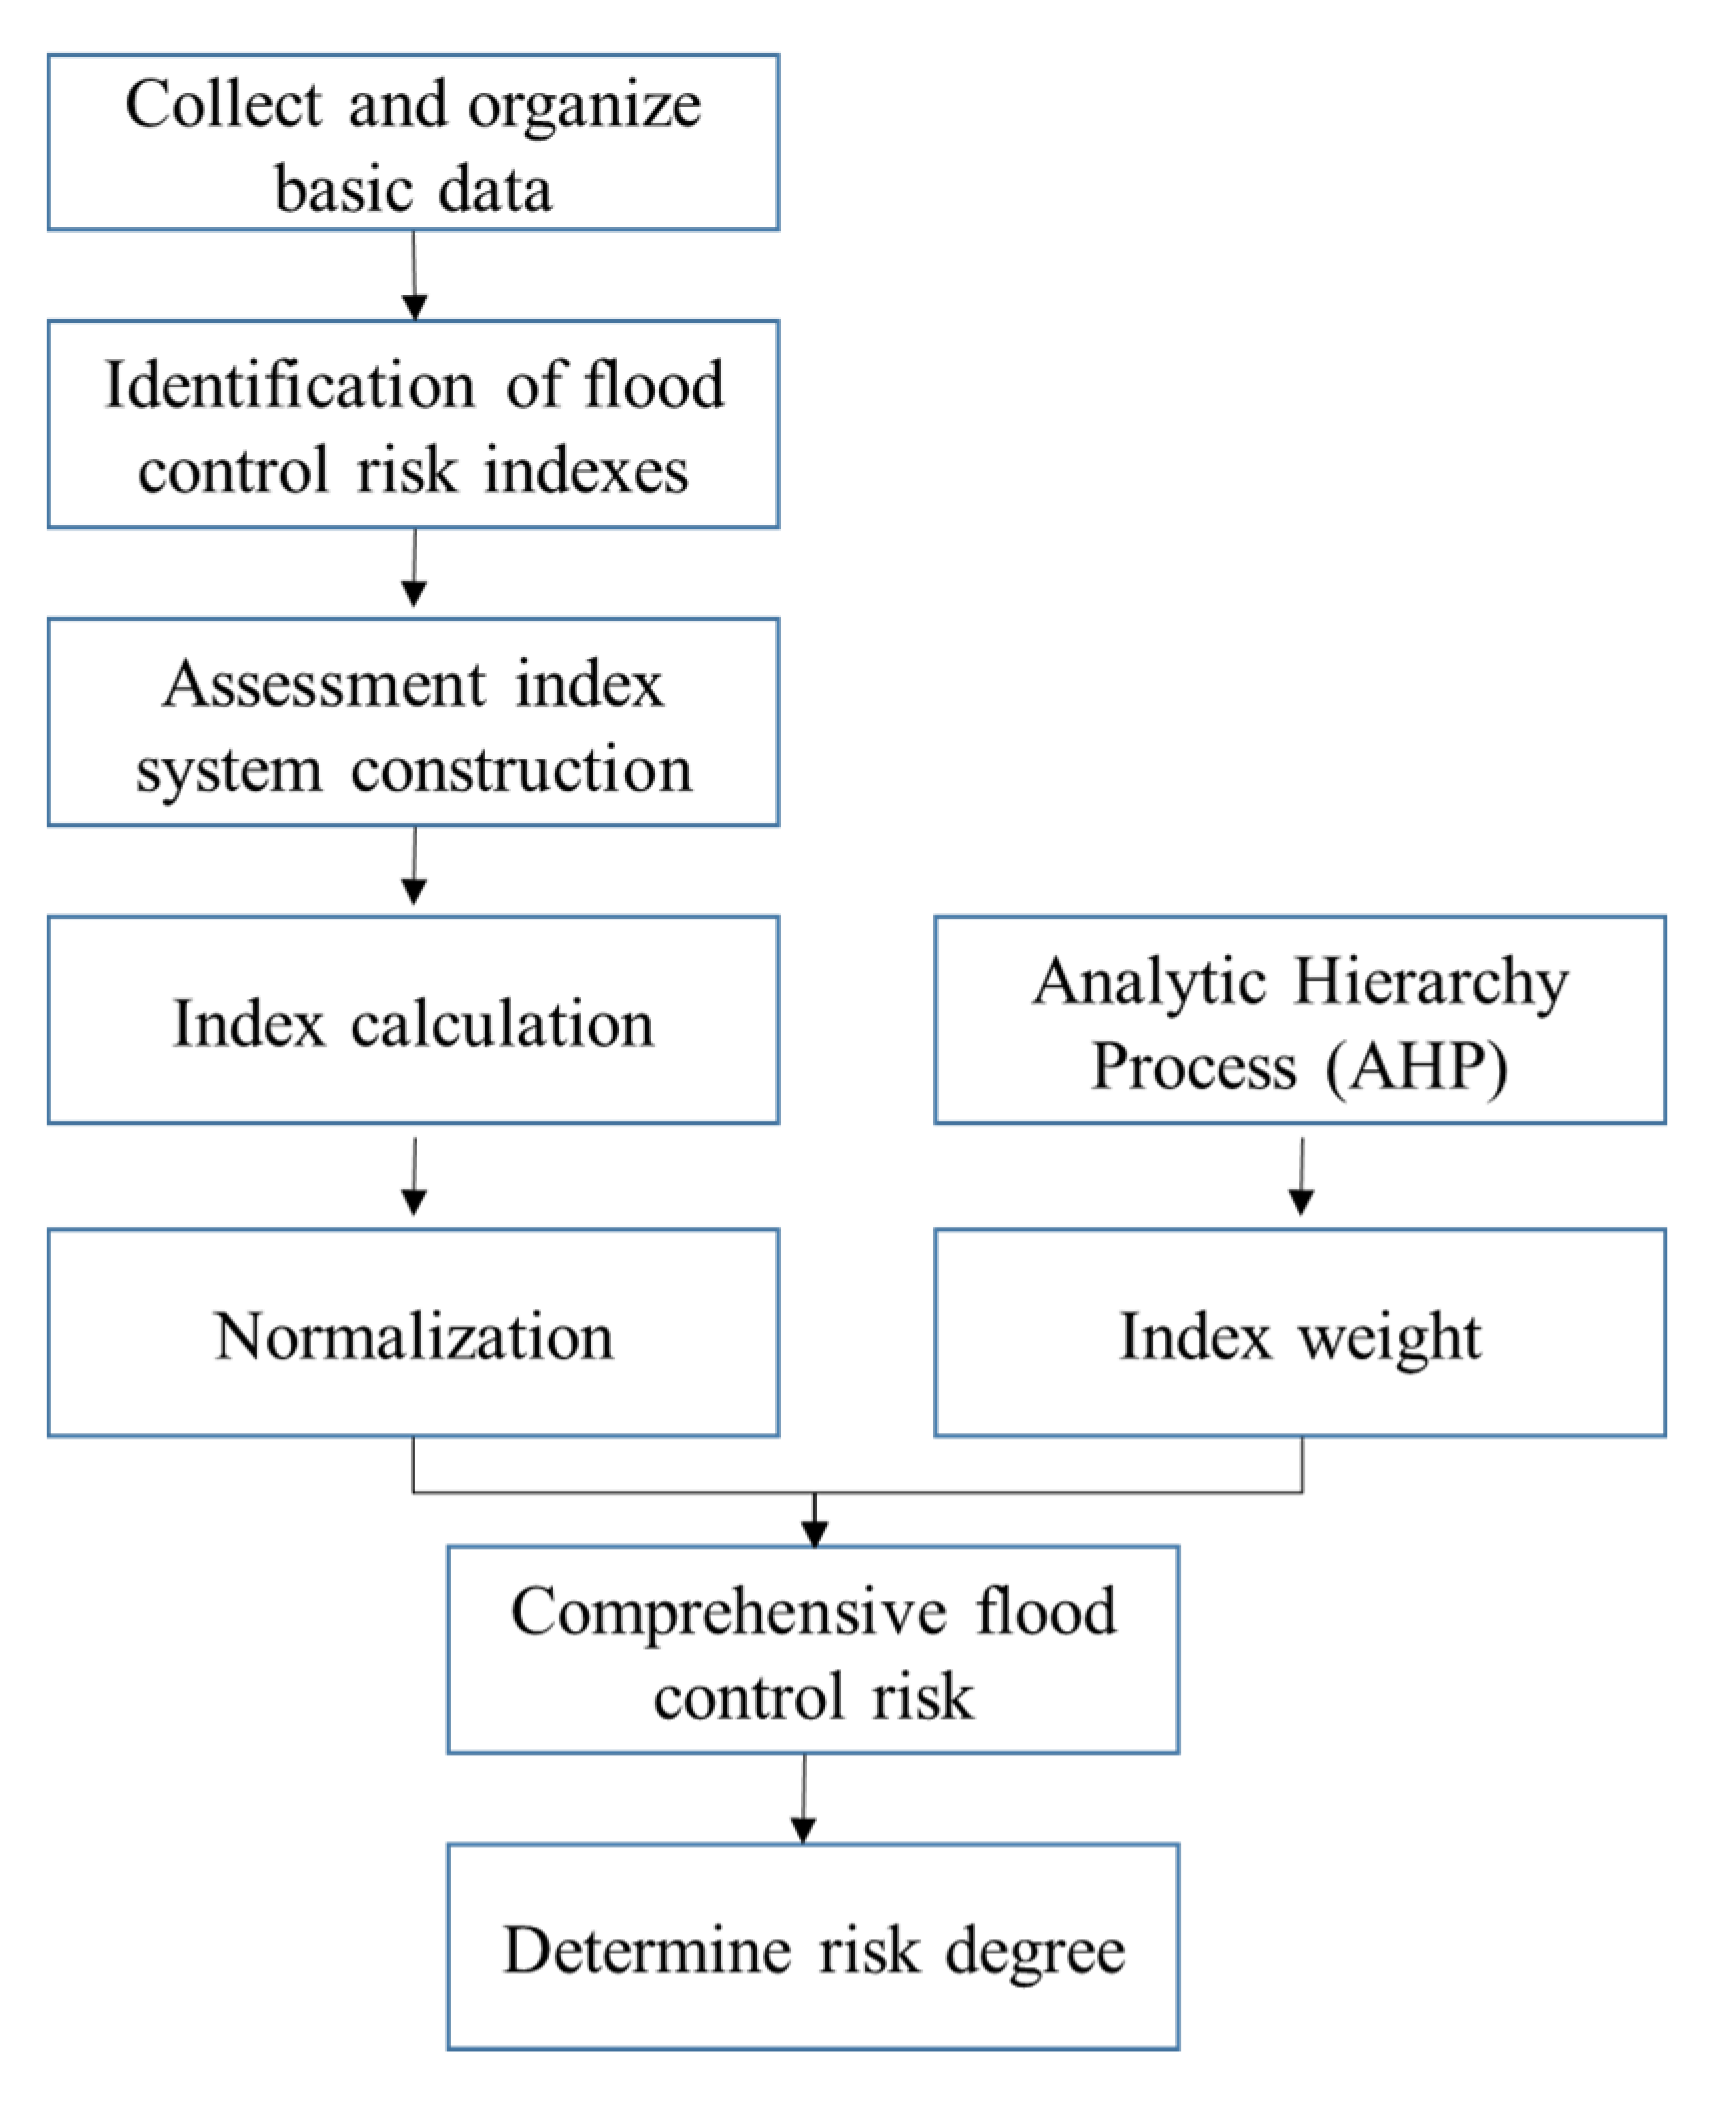
The overall idea and technical process of flood control risk identification and an assessment of a large-scale water transfer project are shown in Figure 1. Based on the systematic and comprehensive identification of flood control risk factors, the risk factors are refined and decomposed, the flood risk indexes are reasonably determined, the assessment index system and calculation method are constructed, the risk indexes are normalized, the weight of each index is calculated using AHP, the comprehensive flood control risk assessment model is established, and the comprehensive flood control risk and its grade are determined.

2.1. Flood Control Risk Identification of Large-Scale Water Transfer Project

A large-scale water transfer project has the characteristics of long lines, variable climate, geography, hydrology, and underlying surface conditions, and complex structures of cross-sectional buildings. Starting with all kinds of risk sources and risk events involved in the whole process of the flood disaster chain, combined with risk theory, flood control risk factors of the large-scale water transfer project include some aspects: rainfall–runoff, confluence, and flow capacity, the geological characteristics of canal section, and economic and social layout. Among them, the risk of rainfall–runoff includes the rainfall intensity, rainfall, and flood volume in the upstream catchment area of the crossing building, which reflects the risk of flood disaster factors. The risk of confluence and flow capacity are reflected in confluence path merging, concentrated outflow, blocked drainage channels, the narrow flood section of upstream and downstream rivers of buildings, significant changes in river topography, siltation of buildings, or risks of easy blockage. Those factors will lead to changes in flood process, such as high water levels, increase in flow velocity, and erosion to the source, which will aggravate the flood risk and increase the uncertainty risk of crossing building structures. The risk factors of the engineering geological characteristics of the canal section reflect the exposure of the disaster-bearing body, including adverse geological sections (expansive soil, high groundwater level, etc.) and deep excavated canal sections. The corresponding risk events are the risk of water destruction, external flood intrusion, and slope instability, respectively. The economic and social layout risks account for the adverse impacts of floods on the local economy and society in the project area, such as the distribution of towns and villages within a certain range of the project area, which reflects the vulnerability of the disaster environment.

2.2. Assessment Index System of Flood Control Risk

Based on the systematic identification of flood control risk factors of a large-scale water transfer project, considering the availability of data and relative independence of indicators, four types of risks are refined and decomposed, the assessment indicators are reasonably determined, and a flood control assessment index system for a water transfer project with a certain hierarchical structure is constructed.
Specifically, the rainfall–runoff risk assessment index selects three indicators: a maximum 1-day rainfall in 50 years, a maximum 3 days rainfall in 50 years, and the proportion of construction land area. Among them, the maximum 1 d rainfall reflects the rainfall intensity and corresponds to the peak flow; the maximum 3 d rainfall focuses on the total rainfall and corresponds to the magnitude of the flood. The selection of 1 d, 3 d, and 50 years design frequencies are mainly based on the practical experience of the built, large-scale water transfer project, determined by taking the upstream confluence area of the project, the characteristics of the rainstorm flood, and other factors into account. The proportion of construction land area represents the impervious surface of the upstream catchment area. The more impervious area is not conducive to the infiltration of rainfall, and is easier for rapid flow generation, leading to an increase in flow generation, increase in flood volume, and advance in flood peak, etc.
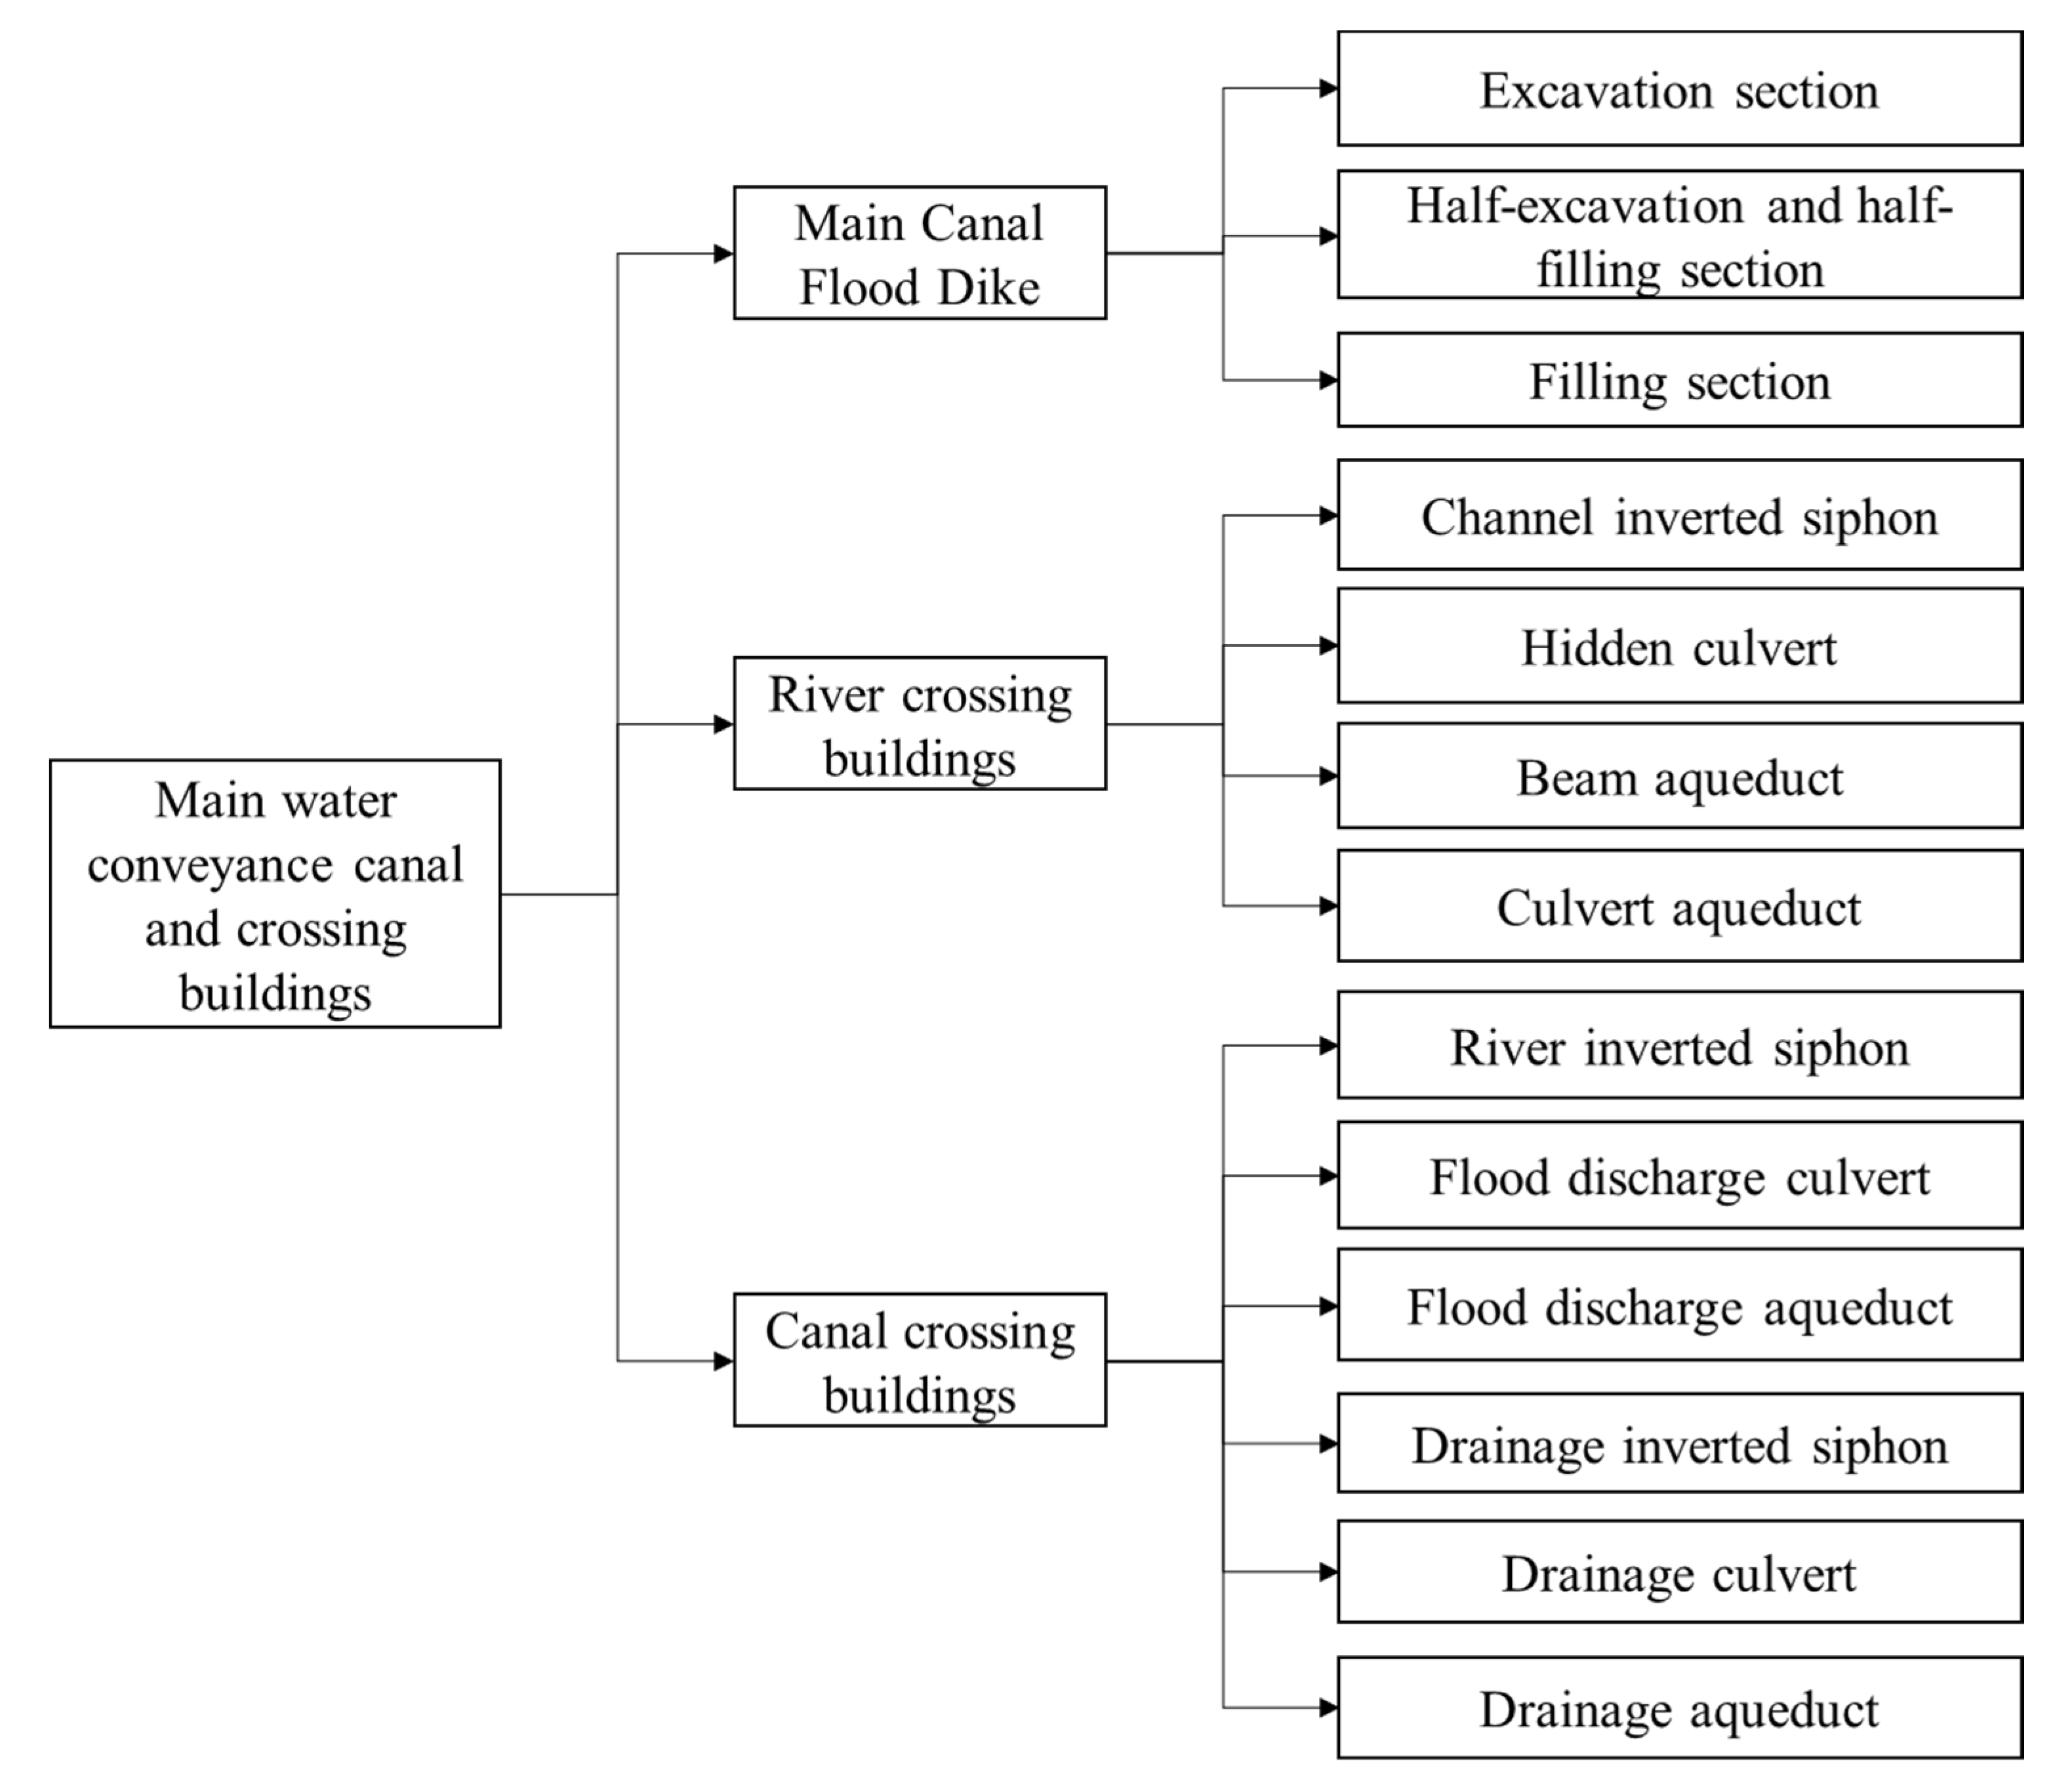
There are six indicators for the risk assessment index of the confluence and flow capacity, which are a narrow flood passage, changes in river topography, confluence path merging, presence (or absence) of drainage channels, self-blockage of buildings, and the risk of easy blockage of buildings. According to the relative position and the elevation of the canal (river) bottom of the main canal and the crossing river, this can be divided into two types of crossing building: the canal crossing river buildings; that is, the main canal crossing the natural river by building an artificial water conveyance channel (structural type: beam aqueduct, culvert aqueduct, channel inverted siphon and culvert); or the river crossing canal building; that is, artificial flood drainage channels built to allow natural water to pass through (or across) the main canal (structural types: flood discharge aqueduct, river inverted siphon, and flood discharge culvert), as shown in Figure 2. According to the catchment area thresholds above the cross-sectional buildings, they could be divided into large cross-sectional buildings and left bank drainage buildings. Differences in the river size and the cross-sectional buildings structure type lead to different risk factors and assessment indexes. Among them, two indexes—narrow flood passages and river topography change—are for larger rivers, and the other four indexes are for rivers with a smaller catchment area, upstream of the project.
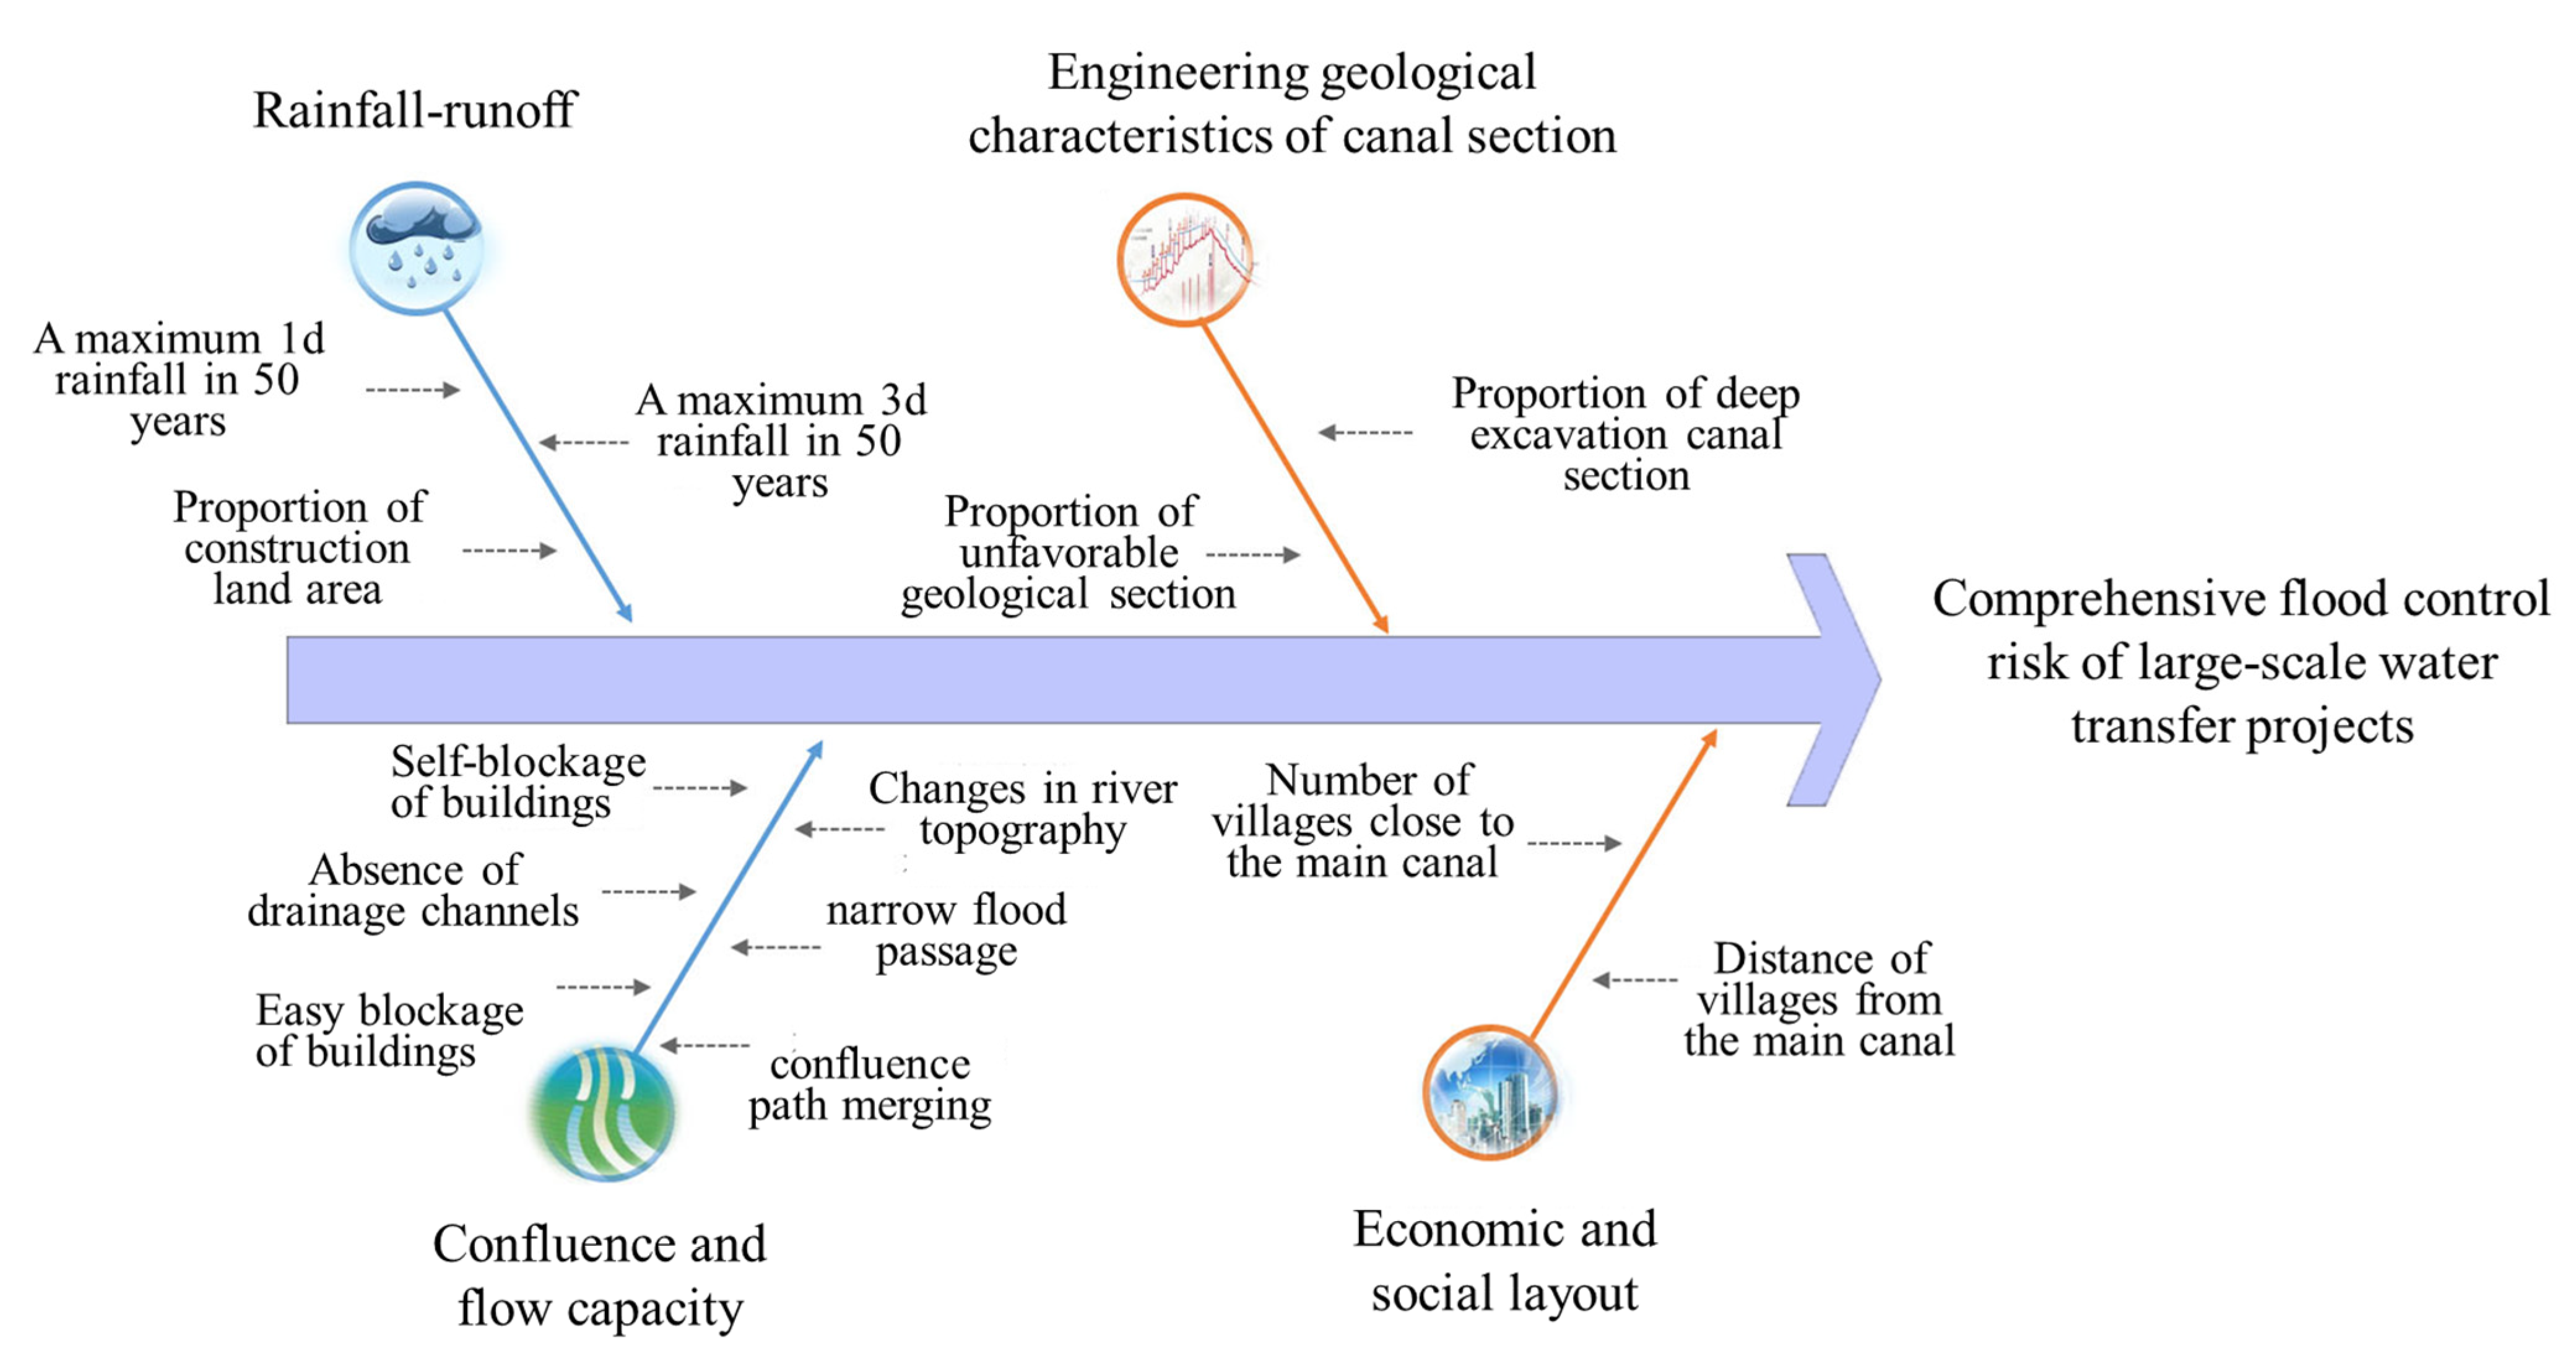
The risks of geological characteristics at the canal section are characterized by an unfavorable geological section and a deep excavation canal section. The risk of an economic–social layout is represented by the distance of villages (towns) from the main canal and the number of villages (towns) close to the main canal. Referring to the relevant experience of a project and the trial calculation results of substandard flooding, the villages, and towns within 1 km upstream and 3 km downstream of the main canal are mainly considered. The overall flood control risk identification and index decomposition of large-scale water transfer project are shown in Figure 3.

2.3. Index Calculation and Normalization

2.3.1. Basic Index Calculation

In the risk assessment index of rainfall–runoff, the calculation of the maximum 1-day rainfall in 50 years and the maximum 3-day rainfall in 50 years is, first, based on the long sequence of daily rainfall data of meteorological stations in the project area. The annual maximum 1- and 3-d rainfall series data are obtained and arranged in descending order, then the frequency analysis method is used to calculate the maximum 1- and 3-d rainfall in 50 years for each station. According to China’s criterion, ‘Regulation for calculating design flood of water resources and hydropower projects’, the frequency analysis steps are as follows: first, the expected formula is adopted to calculate the empirical frequency. Second, a linear moment method is used to calculate the initial parameters. Third, the Pearson III hydrological frequency distribution line is selected for parameter estimation. Fourth, the computer-optimized line fitting method is used to determine the parameters. Furthermore, using the Kriging interpolation method, the point data of each station are interpolated and distributed to the spatial surface, to obtain the grid data of regional rainfall, and finally the maximum 1- and 3-d rainfalls in 50 years in the upstream catchment area of the channel section can be evaluated. The proportion of construction land area is obtained by evaluating the ratio of construction land area and total catchment area in the upstream catchment area of the canal section.
Among the risk assessment index of confluence and flow capacity, the index value of narrow flood discharge sections is obtained by the ratio of the number of rivers with a narrow flood passage compared to the total number of larger rivers in the assessment channel section. The index value of river topography changes is obtained by the ratio of the number of rivers with sand mining pits (1 km upstream and 3 km downstream of the crossing section) to the total number of rivers in the assessment channel. The index value of confluence path merging is obtained by the ratio of the current number of rivers in the assessment channel to the total number of rivers before the project construction, the latter of which can be obtained based on the actual investigation, or extracted by the project areal DEM. The index value of the presence (or absence) of drainage channels is represented by the proportion of the number of projects with no drainage channels or unsmooth drainage in the left bank drainage project. The index value of the self-blockage of buildings, and the risk of easy blockage of buildings, are obtained by the ratio of the number of left bank buildings with self-blockage or easy blockage (drainage-inverted siphon, drainage aqueduct, etc.) to the total number of left bank drainage buildings.
The two indexes, the unfavorable geological section proportion and the deep excavation canal section proportion, which are related to the risk of the engineering geological characteristics of the canal section, are, respectively, calculated by the length of the bad geological section (e.g., the section of expansive soil and high groundwater level), and the length of the deep excavation section (generally more than 20 m [22]) compared to the total length of the assessment section. For the risk index of the economic and social layout, the sum of the number of villages and towns on both sides, within the range of 1 km upstream to 3 km downstream the canal section, is taken as the index value of the number of villages (towns) close to the main canal. Taking the range of 1 km upstream and 3 km downstream as the boundary, the average distance (km) between villages (towns) and the main canal is calculated, divided by 1 km and 3 km, respectively, and the smaller value is taken as the index of the distance between the villages (towns) and the main canal.

2.3.2. Unification of Basic Index Attributes

Each basic flood control risk index attribute can be divided into a positive index and negative index. For the positive index, the higher the index value, the greater the flood risk degree. For the negative index, the higher the index, the lower the flood risk degree. In flood risk assessment indexes—different measurement indexes have different attributes, and cannot be added directly. It is necessary to convert the negative index into the positive index, so that all the indexes have the same risk effect [23].
Most of the indicators listed in Table 1 are positive indexes, among which the “Confluence path merge” and “Distance between villages (towns) from the main canal” are negative indexes.

2.3.3. Dimensionless of Basic Indexes

Some basic flood risk indexes have different dimensions and magnitudes, which cannot be directly integrated, and the original indexes need to be dimensionless [24]. Most of the indexes listed in Table 1 are in the range of 0–1, such as the proportion of construction land area, the risk assessment index of confluence and flow capacity, and the risk of the engineering geological characteristics of the canal section, while the maximum 1- and 3-d rainfall in 50 years, and the number of villages (towns) close to the main canal are specific values, which need to be normalized.
At present, commonly used dimensionless methods mainly include extremum, standardization, normalization, and standard deviation. Among them, the extremum method can minimize the order of magnitude difference between the indexes and keep the coefficient of variation unchanged [25]. In this paper, the maximum method of the extremum is adopted in the dimensionless of basic indexes. The formula is as follows:
  Z i j = x i j M j , Among   them ,   M j = max ( x 1 j , x 2 j , x m j )
where x i j represents the original data, and Z i j represents the dimensionless result of x i j .

2.4. Determination of Index Weight

The analytic hierarchy process (AHP) is a decision-making method that combines qualitative analysis and quantitative calculation, proposed by the American operations researcher, Professor T. L. Saaty, in the 1970s [26]. By integrating the decision-making thinking of the decision-makers (regarding complex objects), the decision-maker’s thinking process (again, regarding complex objects) is made hierarchical and quantitative, and a series of mathematical operations are carried out to obtain different weights, providing a basis for the selection of the best plan [27,28]. The AHP steps are as follows: (i) the hierarchical structure model is established; (ii) the judgment matrix is constructed; (iii) the maximum eigenvalue of the judgment matrix and its corresponding eigenvector are calculated; (iv) the consistency of the judgment matrix is checked; (v) finally, the hierarchy is sorted [29,30].

2.5. Comprehensive Flood Risk Assessment Model

According to the concept of risk and the calculation formula of flood risk indexes, the following comprehensive flood risk assessment model is established.
FR = R + F + C + S
R = i = 1 3 Z R i × W R i × W R i
F = i = 1 6 Z F i × W F i × W F i
C = i = 1 2 Z C i × W C i × W C i
S = i = 1 2 Z S i × W S i × W S i
where FR is the index of comprehensive flood control risk, and R, F, C, S are the flood control risk index of four first-class risk indexes, namely, rainfall–runoff, confluence and flow capacity, engineering geological characteristics of the canal section, and economic and social layout risk. Z R i , Z F i , Z C i , Z S i are the index values of secondary flood control risk indexes under four primary flood control risk indexes. W R i , W F i , W C i , W S i are the weight values of rainfall–runoff, confluence and flow capacity, the engineering geological characteristics of the canal section, and economic and social layout risk, W R i , W F i , W C i , W S i are the secondary weight values, after the four primary flood control risk index weights.

2.6. Determination of Comprehensive Flood Control Risk Level of Canal Section

According to the established comprehensive flood control risk assessment model, the flood risk quantification index (FR) of the evaluation channel section is calculated. The greater the risk index value, the higher the risk degree. The Natural Breaks (Jenks) tool in the ArcGIS 10.1 platform is used to grade the flood comprehensive risk index; this method uses the minimum variance sum to determine the optimal classification result. Compared with other classification methods, the goodness of variance fit [31] is the highest, which objectively reflects the statistical characteristics of data distribution. In this study, the comprehensive flood control risk level of the water transfer project is divided into four levels: no risk, low risk, medium risk, and high risk.

3. Application Examples

3.1. Project Overview

The middle route of the South-to-North Water Transfer Project is a large system [32] consisting of the Danjiangkou Reservoir’s water diversion hub, the main water canal, and the water supply areas of various provinces and cities along the way. The total length of the main canal is 1432 km, which is the longest water diversion line and the largest water delivery flow in the world at present [33]. In this study, 39 management canal sections on the 1277 km main canal, from Taocha sluice to Juma River in Beijing, were selected as the assessment objects, including 618 canal-crossing building units.

3.2. Date Description

We collected daily rainfall data from 1961 to 2011 (from the national basic weather station in the project area and surrounding areas), land-use data in 2010, 90 m DEM data, and the engineering geological characteristics of water canal sections, cross-sectional buildings, and nearby upstream and downstream rivers, including the narrowing of flood discharge sections, self-blockage building and blockage risk, outlet drainage conditions, river terrain change, and economic and social layout information on both sides of the channel.
The information sources are listed in Table 2.

3.3. Identification of Flood Control Risk Indexes

3.3.1. Rainstorm Flood Risk

The main canal of the South-to-North Water Transfer Project spans three provinces and municipalities, Henan, Hebei, and Beijing, including the temperate monsoon climate zone. The area in front of the Funiu Mountains and the Taihang Mountain piedmont, to the west side, are the main high-value (and frequent) rainstorm/flood areas in China. There were two famous torrential rains of “63.8” and “75.8” at home and abroad respectively. Due to the influence of topography, there are multiple rainstorm centers [34] in the catchment areas of the Taihang Mountain, Funiu Mountains, and Songshan Mountain, in the upper reaches of the main canal, including Jizhong and Caoping in Lushan County on the upper reaches of the Shahe River; Hebi and Xinlin to Nanzhai on the upper reaches of Qihe River; ZhangMo to Pusaling on the upper reaches of the Weihe River, on the west side of Lincheng County; Tuanbokou to Xinkai on the upper reaches of Cihe River; Zijingguan, Daliangang, and Manshui River of Beijing on the upper reaches of Juma River. The distribution of rainstorm centers is shown in Figure 4.
In addition, with the development of urbanization, the impervious surface and runoff yield increases, and the risk of rainstorms and flooding intensifies. At the same time, due to the impact of global climate change, local heavy rainfall events show a trend of frequent recurrence, which increases the uncertainty of rainstorm flood risks [35,36,37].

3.3.2. Confluence and Flow Capacity Risk

After the construction of the main canal, the conditions of runoff generation and confluence of the river changed. Some original slope flow areas changed to concentrated flow, some small rivers were merged and rerouted, and the natural flood discharge channel on the left bank was cut off and changed, which may lead to a high water level in the river. In recent years, the social economy along the main canal has developed rapidly, and the design conditions of crossing rivers and the local social and economic situations have undergone some changes. The drainage channel on the right bank was inconsistent with the design conditions, and the flood discharge conditions of upstream and downstream rivers have changed, resulting in a reduction in the actual discharge capacity compared with the design conditions. Human activities, such as sand mining and occupying the river channel, have aggravated the river channel erosion, reduced the buried depth (and bearing capacity) of the channel pier foundation, and caused the collapse of (and damage to) the head/river slope. There was a risk of drainage channel blockage of due to the presence of household garbage and firewood floating objects near the entrance of buildings, or steep mountains and poor vegetation conditions. The changes in the underlying surface and construction conditions of these rivers reduced the flow capacity and increased the flood risk of the river.

3.3.3. Risk of the Geological Characteristics of Canal Section

Along the middle route of the South-to-North Water Transfer Project, there are expansive soil and high groundwater sections, which belong to unfavorable geological sections. Expansive soil has weak expansibility, which reflects the non-uniformity of expansion potential in the horizontal and vertical directions. When a substandard flood occurs, the amount and intensity of rainfall are high, and the groundwater level will rise rapidly within a short time period, which will lead to the deformation of the slope toe of the expansive soil canal section and, with the continuous rainfall, different degrees of canal slope instability will occur. The high underground water level can damage the roof support of the lining slab of the channel, which easily leads to slope instability, concrete bulging and cracking, landslides, and other accidents. The fully excavated canal section is long, and a few canal sections have a depth of more than 30 m. The main flood control risks are external flood flowing into the canal and the instability of the canal slope, caused by prolonged and continuous rainfall during the flood season, which will affect the safe operation of the project.

3.3.4. Economic and Social Layout

The east side of the main canal are the Beijing–Guangzhou Railway, as well as many large- and medium-sized cities that are densely populated. The society and economy along the main canal are being developed, which means that the villages and asset distributions on the left and right banks of the main canal continue to increase. Once the flood on the left bank exceeds the standard, it will lead to accidents involving one or more cross-sectional buildings, affect the water supply of the main canal, and pose a great threat to people’s lives and properties on both sides.

3.4. Construction of Assessment Index System and Index Calculation Processing

According to the flood control risk assessment index system construction method for water transfer projects (Section 2.2), the comprehensive flood control risk assessment index system for the middle route of the South-to-North Water Transfer Project was constructed, including four first-level indexes and 13 s-level indexes, as detailed in Table 1. A total of 13 assessment index values out of 39 assessment units were calculated, respectively, according to the calculation and normalization method (Section 2.3). The specific results are shown in Appendix A.

3.5. Index Weight Calculation

By adopting the AHP, the weight of the flood risk assessment index of the middle route of the South-to-North Water Transfer Project was calculated through the steps used to determine the target and assessment index set, construct the judgment matrix, calculate the weight matrix, and perform a consistency test, as shown in Table 3.

3.6. Comprehensive Flood Control Risk Level

The flood risk index FR of 39 assessment units of the middle route of the South-to-North Water Transfer Project were calculated. The comprehensive flood risk assessment criteria of the middle route of the South-to-North Water Transfer Project were obtained using the Natural Breaks (Jenks) classification in the ArcGIS10.1 platform, as shown in Table 4.
Finally, the comprehensive flood risk assessment levels of each assessment unit of the main canal were obtained, of which 6 were high risk areas, 14 of the remaining units were medium-risk areas, 13 were low-risk areas, and 6 were no-risk areas; the specific results are shown in Table 5.

4. Results Analysis and Discussion

4.1. Spatial Distribution of Flood Control Risks

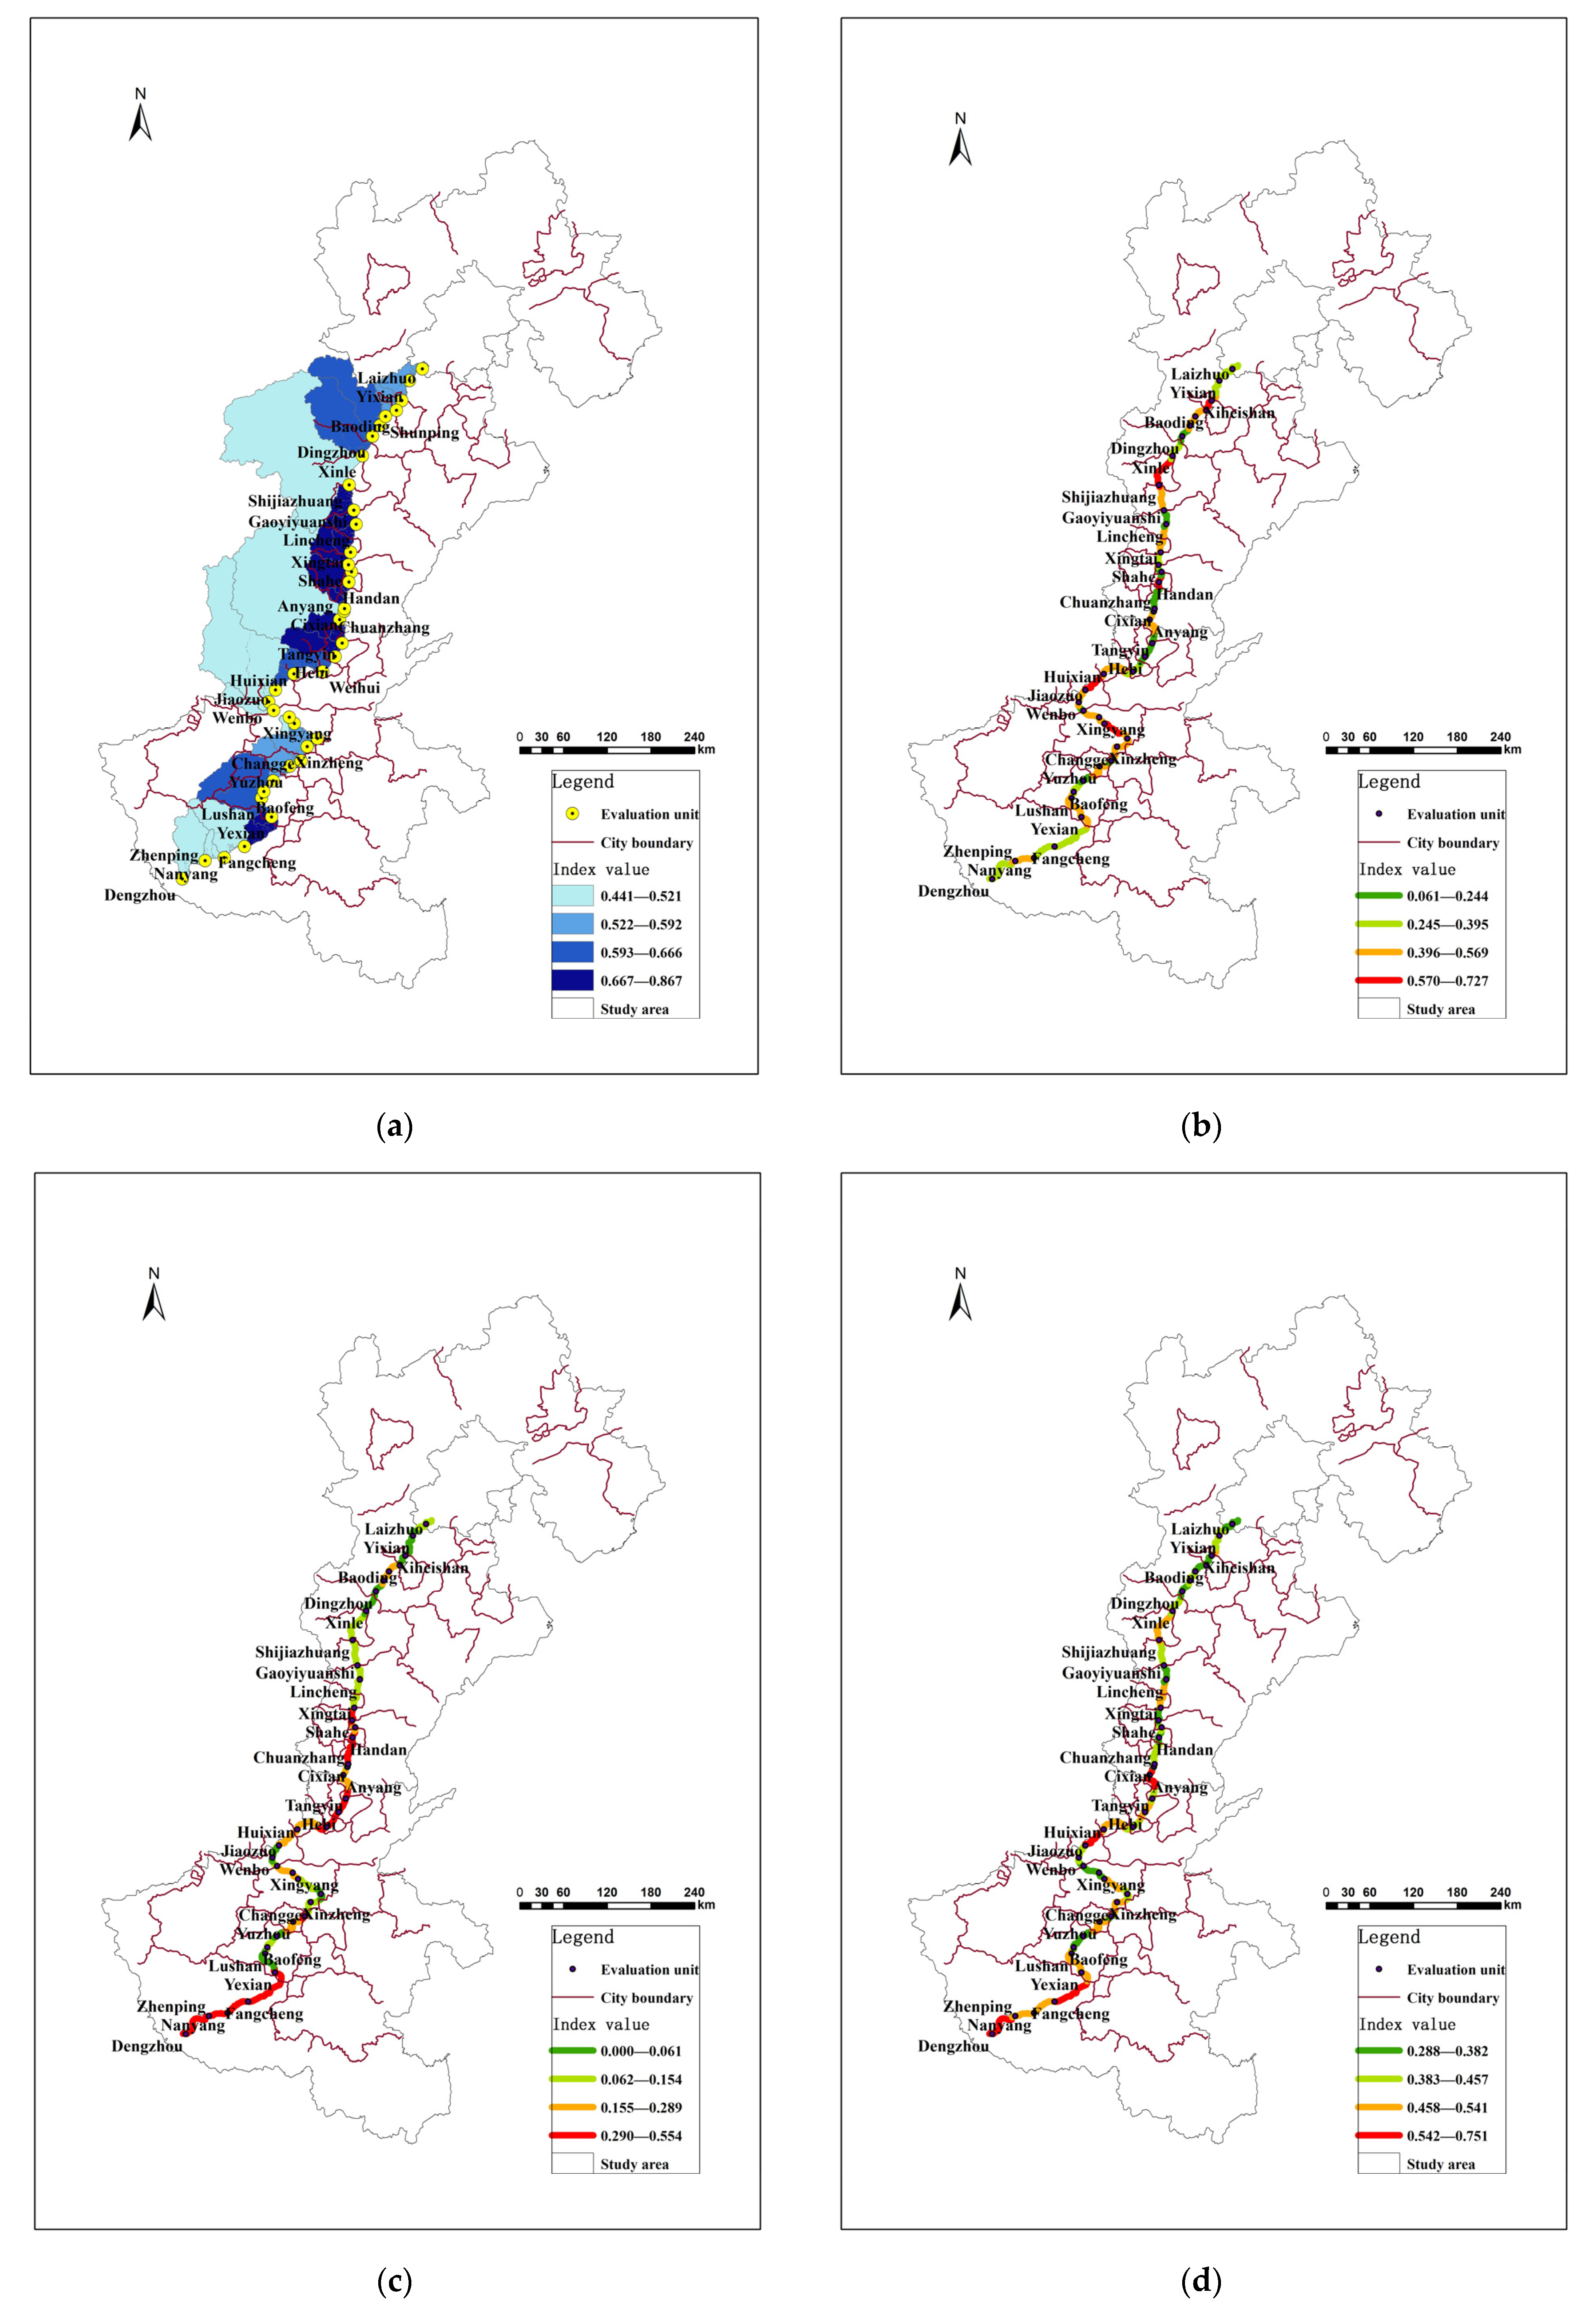
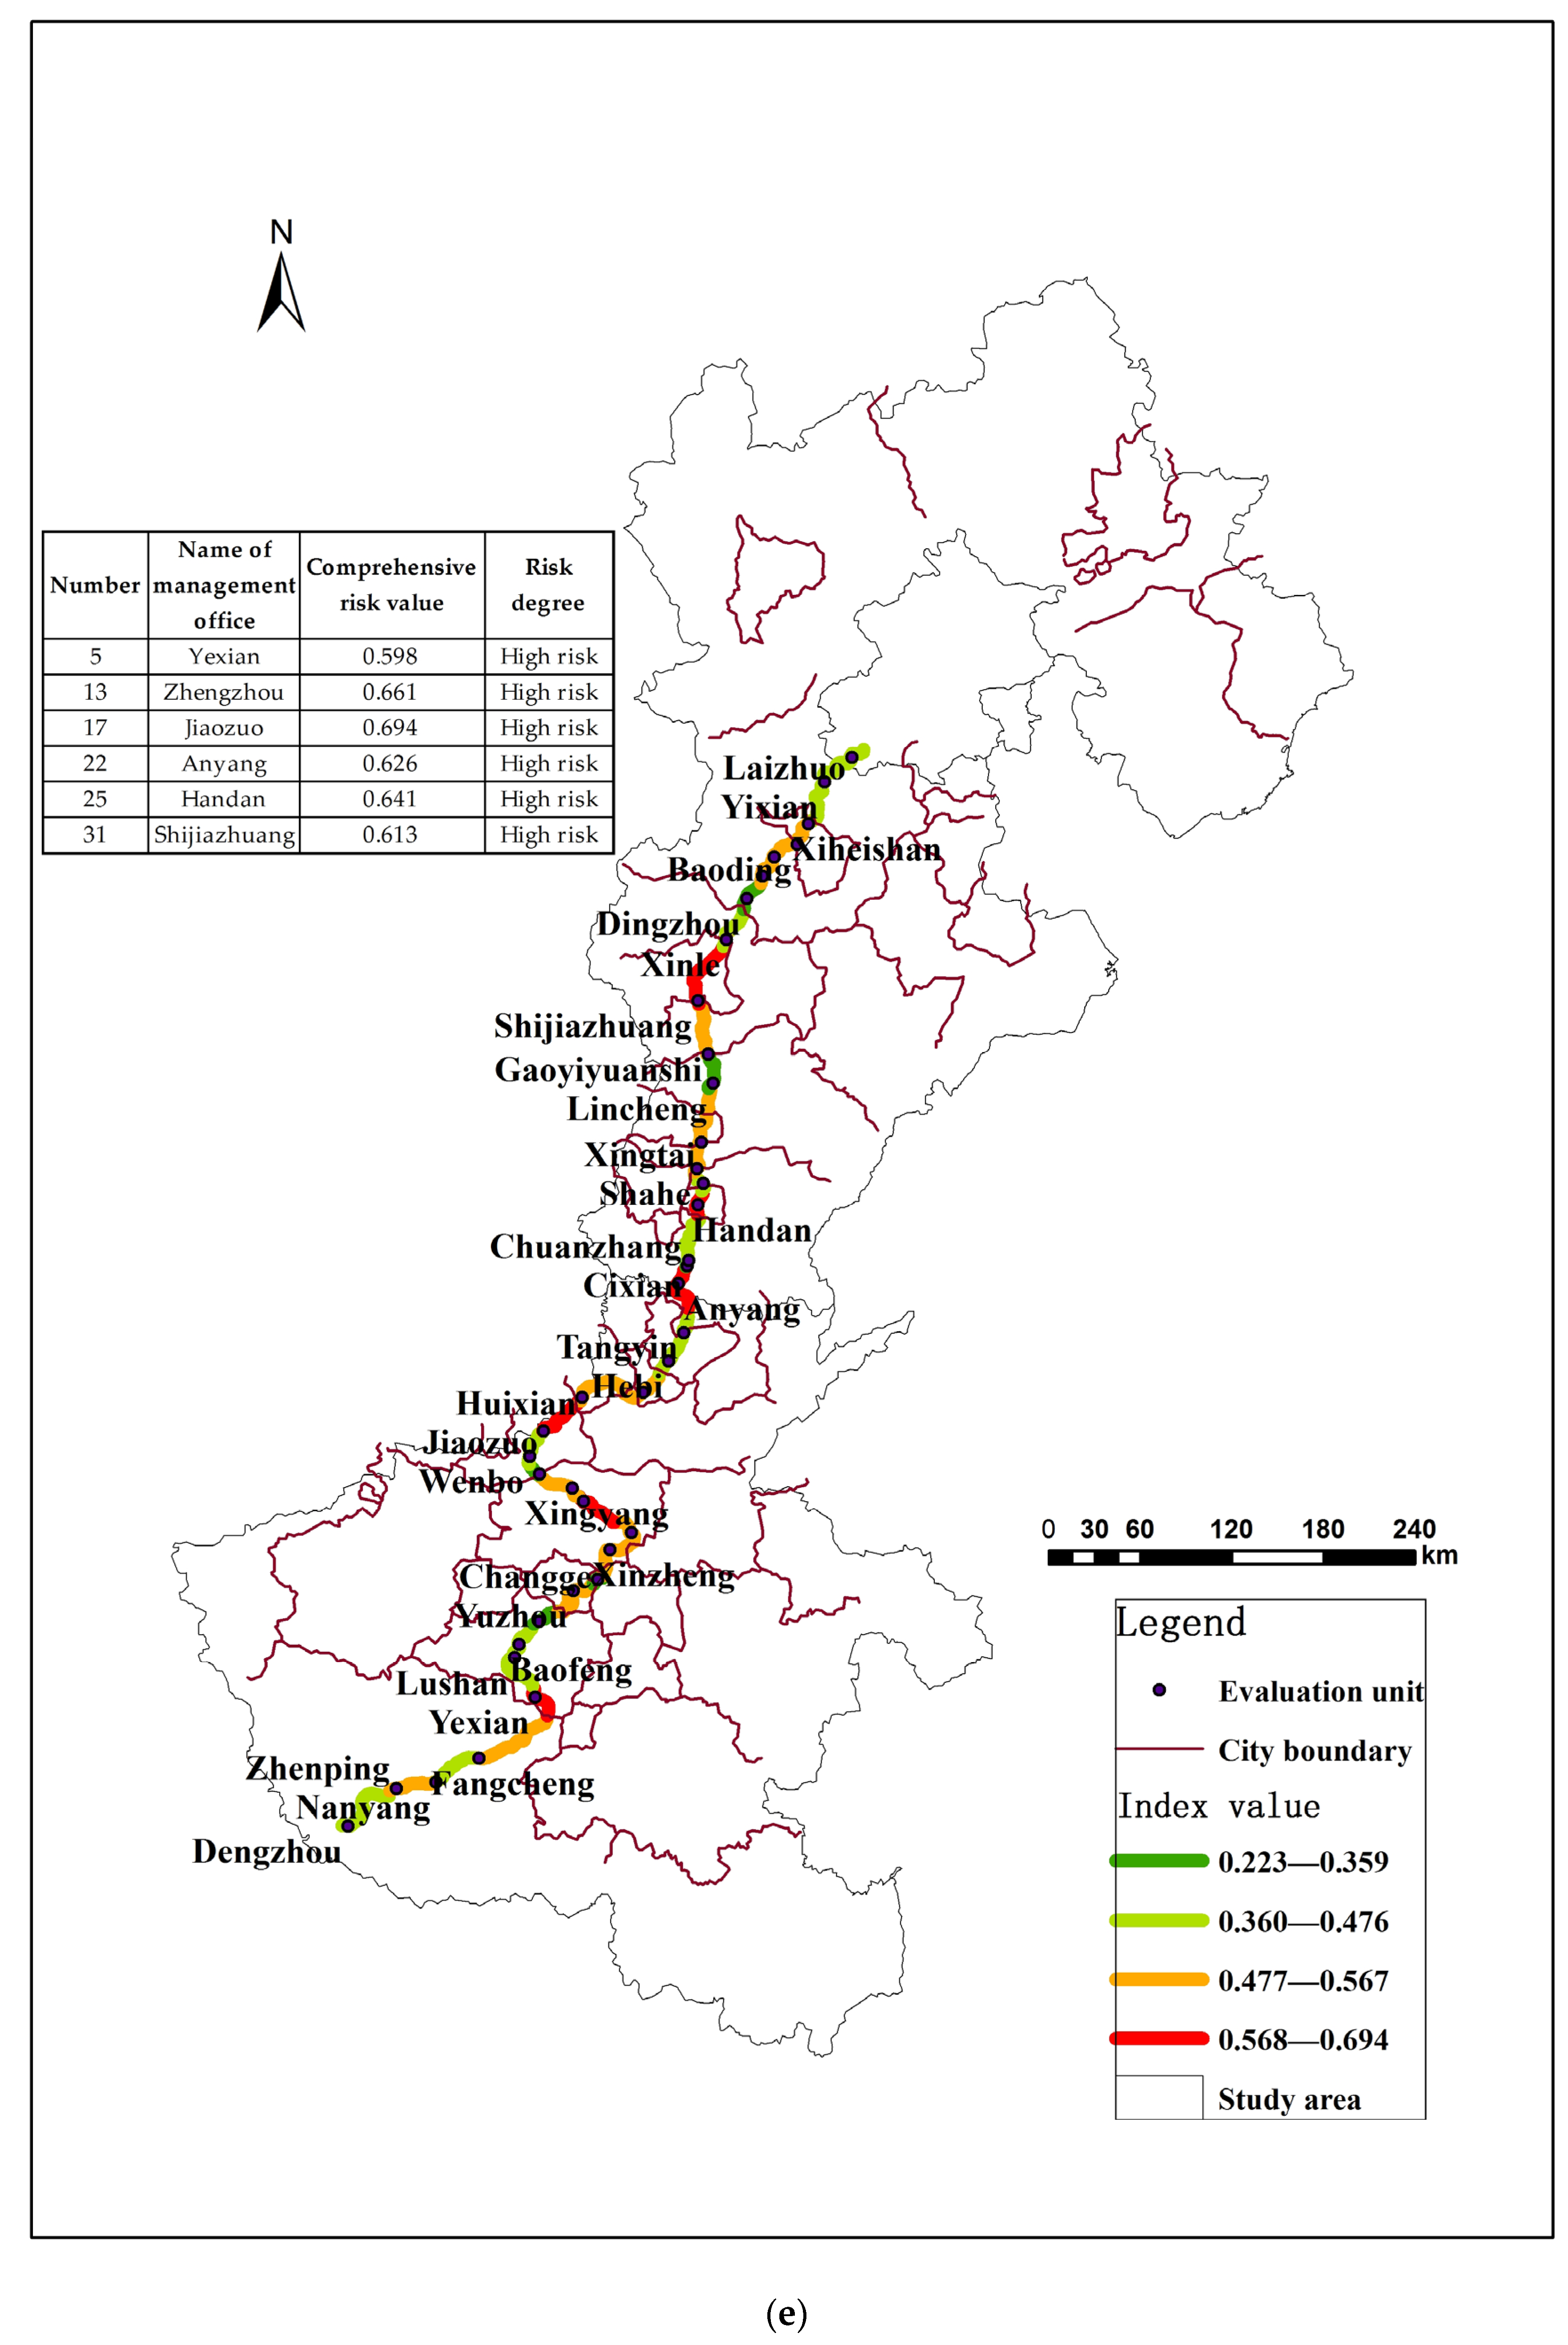
According to the assessment results of the middle route of the South-to-North Water Transfer Project, the four single index risk spatial distribution maps of rainfall–runoff, confluence and flow capacity, the geological characteristics of canal section, the economic and social layout, as well as the comprehensive flood control risk spatial distribution map, were drawn, as shown in Figure 5.
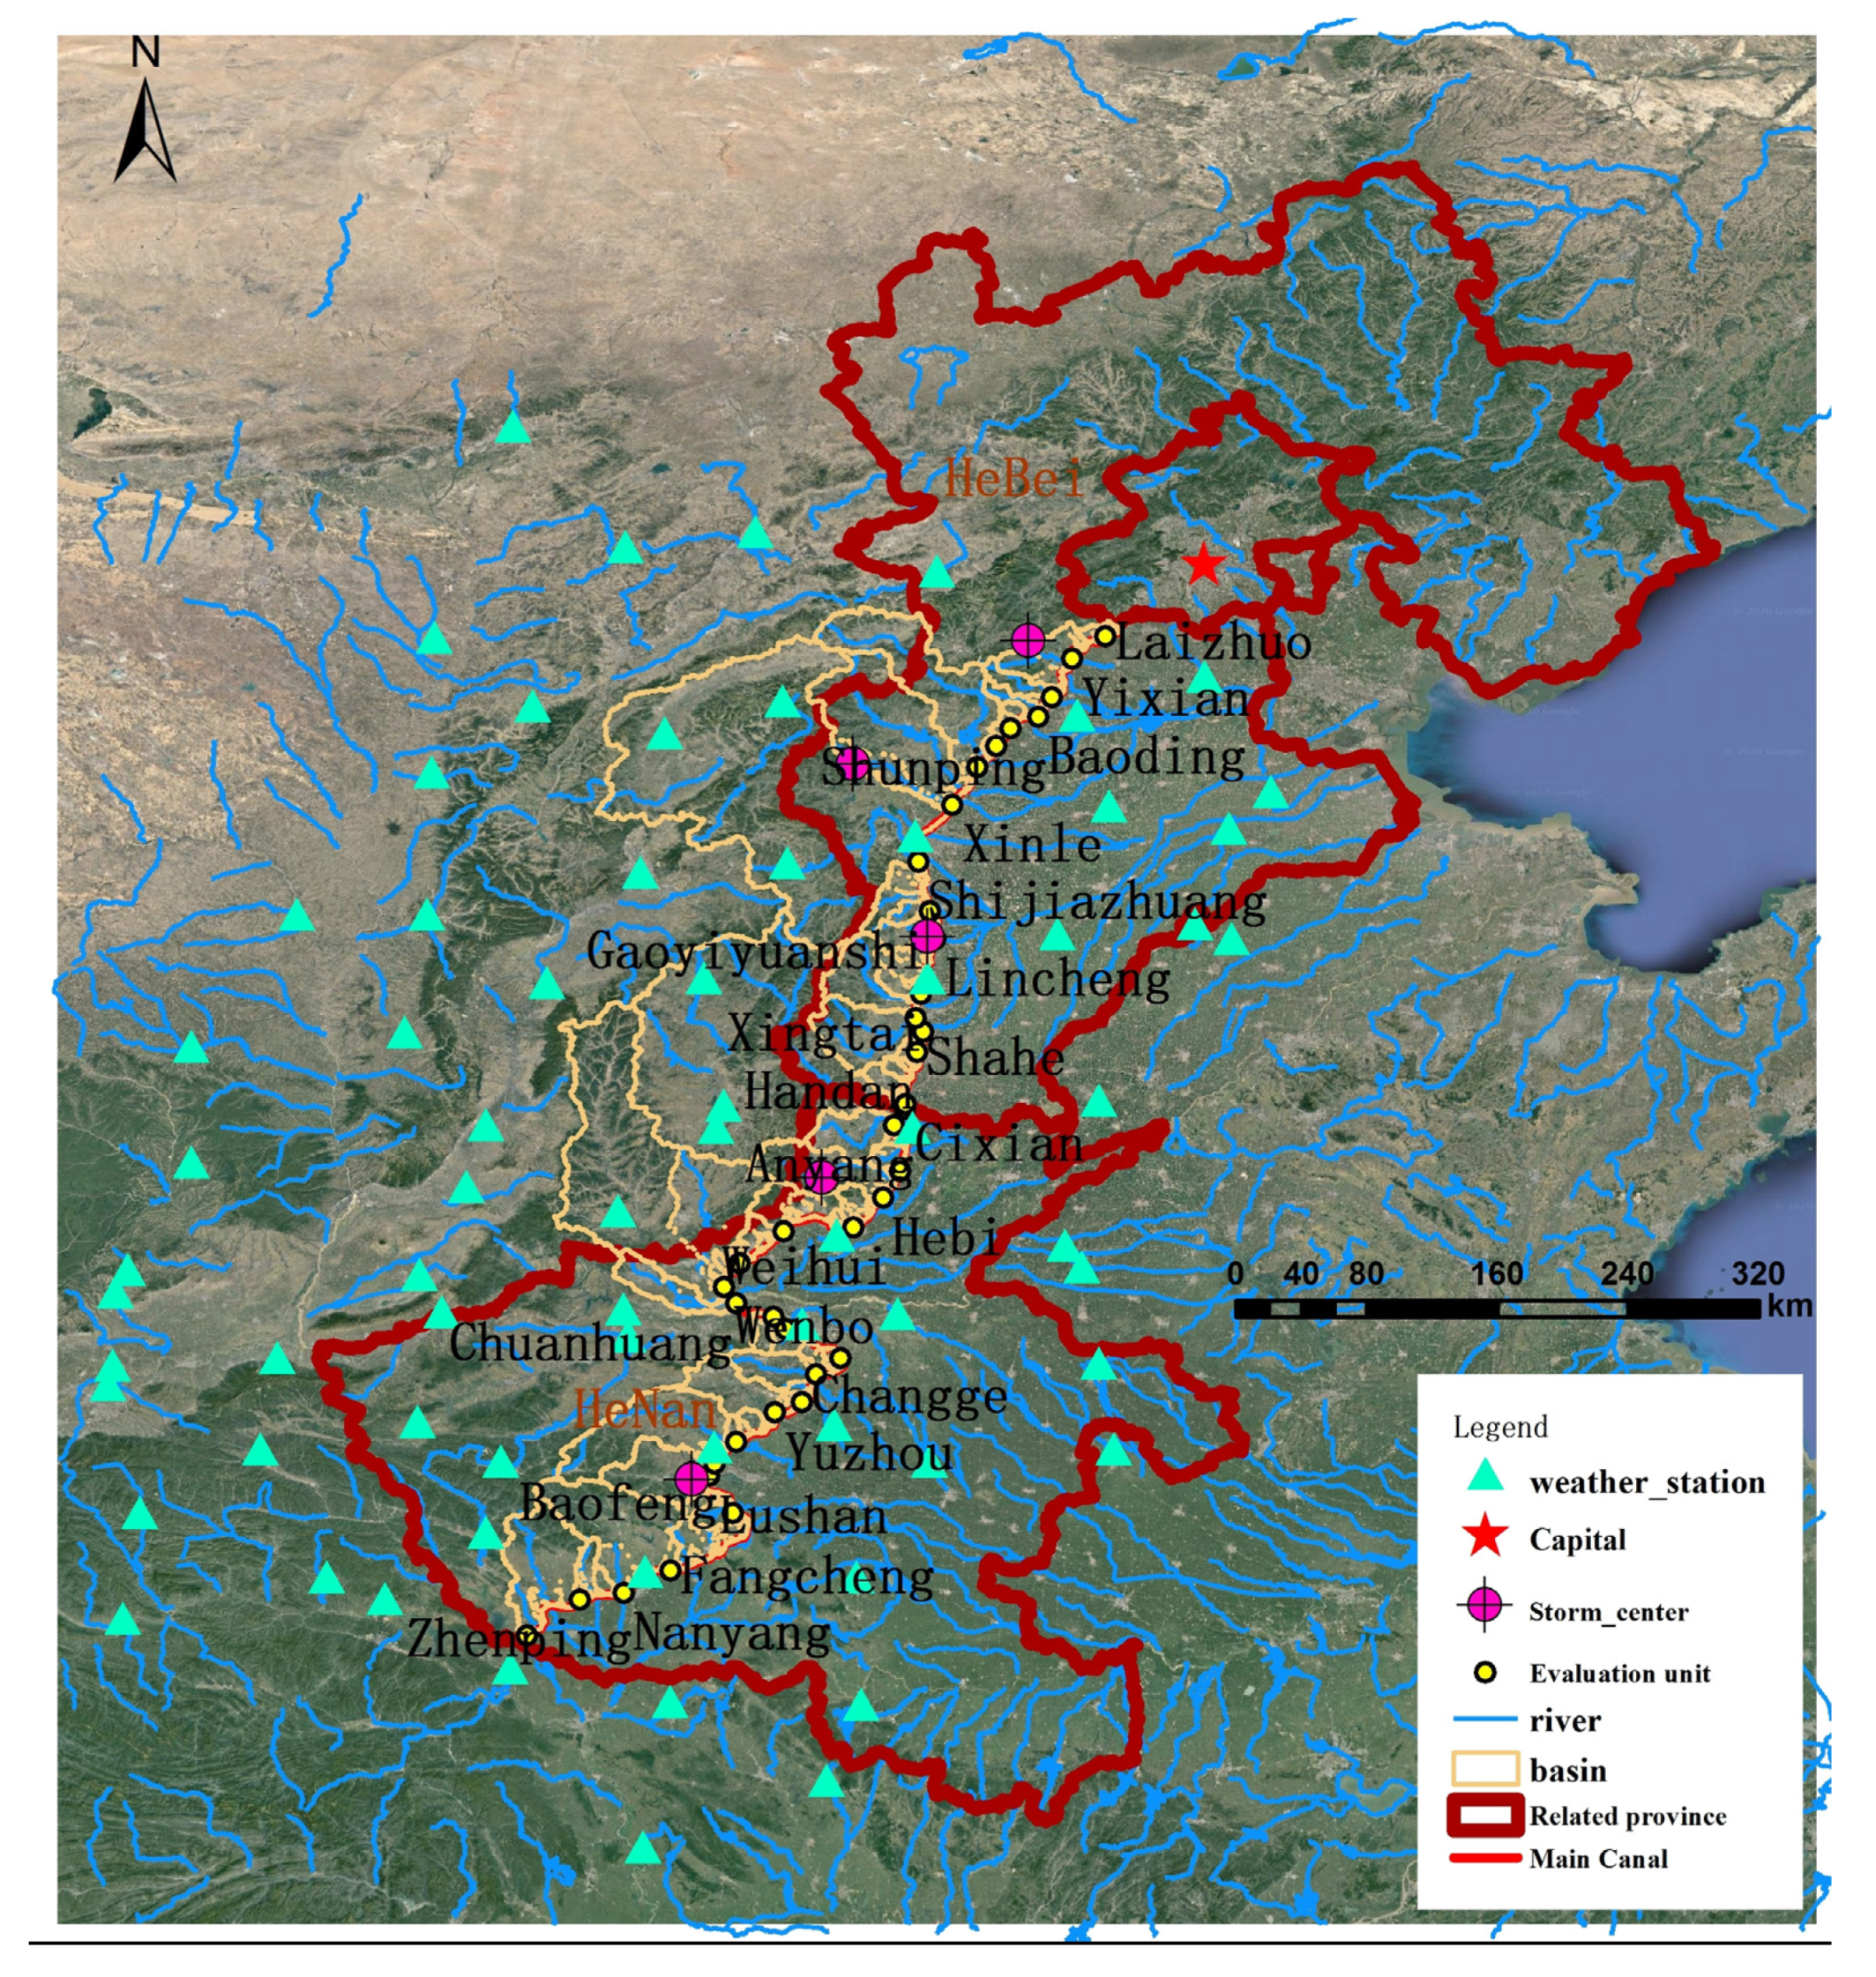
Regarding the risk of rainfall–runoff, Tangyin, Shahe, Anyang, Yongnian, Cixian, Hebi, Handan, and Gaoyi Yuanshi have a higher risk level, which is consistent with the distribution of rainstorm centers in Jizhong in the upper reaches of Shahe River, Hebi in the upper reaches of Qihe River, and ZhangMo in the upper reaches of the Dihe River. Regarding risk of confluence and flow capacity, Zhengzhou, Jiaozuo, Shijiazhuang, Handan, Baoding, Hangkonggang, Yexian, and Anyang have a higher risk level, which is consistent with the situation obtained in the investigation of assessment units (canal section). For example, in the Zhengzhou assessment unit, there are 16 cross-sectional buildings, including seven large-scale river cross-sectional buildings and nine left bank drainage buildings. Among them, four large-scale river cross-sectional buildings have a narrow flood section, and all left bank drainage buildings have poor drainage. In the Jiaozuo assessment unit, five of the eight large-scale river channel cross-sectional buildings have narrow flood section, and all three left bank drainage buildings have poor drainage and easy blockage risk. In the Shijiazhuang assessment unit, there are six large-scale river cross-sectional buildings, of which three have narrow flood section, 9 of 11 left bank drainage buildings have poor drainage, and most of them have the risk of self-blockage or easy blockage. Regarding the engineering geological characteristic risks of the canal section, the risk levels of the canal sections in Dengzhou, Shahe, Handan, and Hebi are higher, consistent with the assessment unit’s (canal section) investigation and statistics. For example, the canal length in the Dengzhou evaluation unit is 5.18 km, the length of the unfavorable geological section (expansive soil, high groundwater level) is 3.46 km, and the length of the deep excavation canal section is 2.28 km. Among the economic and social layout risks, Fangcheng, Anyang, Jiaozuo, Dengzhou, Huixian, and other canal sections have higher risk levels, because the main canal runs through urban sections or concentrated villages in these areas, and the degree of economic and social development along the lines is relatively high.

4.2. Analysis of High-Risk Units

According to the comprehensive assessment results, Yexian assessment unit (0.5983), Shijiazhuang assessment unit (0.6133), Anyang assessment unit (0.6260), Handan assessment unit (0.6414), Zhengzhou assessment unit (0.6610), and Jiaozuo assessment unit (0.6938) are high-risk areas for flood control. The top five risk factors of those assessments with a high degree of risk are listed in Table 6.

4.3. Suggestions on Flood Control Measures

According to the flood control risk level of the main canal (Beijing section) in the first phase of the middle route of the South-to-North Water Transfer Project, different risk countermeasures could be adopted.
No risk means no consideration. For low risk, which is an acceptable risk, the countermeasures are attention, maintaining normal monitoring frequency, and daily inspections. For medium risk, which is a tolerable risk, the countermeasures are monitoring, strengthened monitoring, and daily inspections, as well as measures to control the risk when necessary, which should be sorted according to importance to ensure that the main risk indexes can be dealt with. High risk belongs to unacceptable risks. The countermeasures refer to taking measures to prevent, eliminate, evade, or reduce the occurrence of risk accidents, according to the main risk factors, to reduce the risk level to tolerable or acceptable levels. At the same time, emergency plans should be prepared and, in case of danger, emergency measures (e.g., repair and remedy) should be carried out.
Risk countermeasures are carried out using two aspects: engineering measures and non-engineering measures. The following engineering measures should be considered: dredge drainage channels, strengthen river training, improve downstream river flow capacity, and clean up engineering waste, mound, and soil near the entrance to cross-sectional buildings. In terms of non-engineering measures, such as domestic garbage and firewood floating objects, we should perform a thorough daily inspection and careful maintenance, prepare a highly operable flood emergency plan, and strengthen publicity, persuasion, and education. Detailed risk countermeasures are shown in the Table 7.

5. Conclusions

Based on various risk sources and risk events involved in the whole process of the flood disaster chain—this paper systematically and comprehensively identified the flood control risk indexes of a large-scale water transfer project, and divided it into four risk indexes: rainfall–runoff, confluence and flow capacity, the geological characteristics of the canal section, and economic and social layout, as well as constructed corresponding assessment index systems. Furthermore, the calculation and processing methods of various indexes were provided, and the weights of the indexes were assigned based on the AHP. Finally, the comprehensive flood control risk index was calculated, and its grade was determined to realize the quantitative assessment of the comprehensive flood control risk of different canal sections of the water transfer project. Taking the middle route of the South-to-North Water Transfer Project in China as an example, the paper carried out empirical research, determined the comprehensive flood control risk level of 39 management units (canal section), performed an in-depth analysis of the flood control risk indexes of high-risk units, and presented corresponding management measures and suggestions.
Compared to existing technology, the identification of the flood control risk indexes is more systematic and comprehensive. It is not only limited to hydrological factors, it also takes the structural characteristics of different cross-sectional buildings, the geological characteristics of the canal section, economic and social layout, etc., into account. Each index has a clear meaning, the data are relatively easy to obtain, the mathematical expression of the index is intuitive, the index weight assignment can be realized by main methods, such as AHP, and the assessment method is easy for general engineering managers to understand and master.
Although this study is focused on comprehensive flood control risk assessment and risk management in the operation and management stage of a large-scale inter-basin water transfer project, it is also of value when considering the distribution of water transmission lines from the perspective of flood control in the planning and design stages. From a scientific research perspective, it can provide technical support for the whole life cycle of a river basin water project, evolution mechanisms of systemic risks, regulation theory, a mutual feedback mechanism between a water project and service environment, and evaluation theory. In addition, regarding engineering applications, assessment indexes can also be used for flood control risk assessment of long-distance complex linear engineering systems across natural river systems, such as expressways and railways, after certain adjustments and modifications.

Author Contributions

Conceptualization, X.F. and G.W.; methodology, X.F., G.W. and M.R.; modelling, X.F., X.J. and L.Z.; formal analysis, X.J. and L.Z.; investigation, X.F. and G.W.; resources, X.F. and M.R.; data curation, X.F.; writing—original draft preparation, X.F.; writing—review and editing, X.F., G.W. and N.W.; visualization, X.F., X.J.; supervision, G.W., L.D. and X.H.; funding acquisition, M.R. and G.W. All authors have read and agreed to the published version of the manuscript.

Funding

This research was funded by the National Key Research and Development Plan Project of China (number 2018YFC1508003) and the National Natural Science Foundation of China (number 51809281).

Institutional Review Board Statement

Not applicable.

Informed Consent Statement

Not applicable.

Data Availability Statement

The study did not report any data.

Acknowledgments

We thank Editor Sanja Vučić and two anonymous Reviewers for their constructive comments during the review process, with their help and guidance, this paper has been improved a lot.

Conflicts of Interest

The authors declare no conflict of interest.

Appendix A. Normalization Index

NumberName of Management OfficeThe Maximum 1-Day Rainfall in 50 YearsThe Maximum 3-Day Rainfall in 50 YearsProportion of Construction Land AreaConfluence Path MergingNarrow Flood PassageAbsence of Drainage ChannelsChanges in River TopographySelf-Blockage of BuildingsEasy Blockage of BuildingsProportion of Unfavorable Geological SectionProportion of Deep Excavation canal SectionDistance of Villages from the Main CanalNumber of Villages Close to the Main Canal
1Dengzhou0.55670.49150.41420.41380.25000.26670.12500.46670.53330.68110.76260.76840.6736
2Zhenping0.57540.46900.85040.23080.40000.38890.00000.94440.88891.00000.00000.77020.4514
3Nanyang0.61780.55800.17840.22220.28570.11760.14291.00000.82350.84360.23930.77130.5799
4Fangcheng0.81200.76180.41940.66670.25000.00000.00000.86360.63640.97880.00000.77171.0000
5Yexian0.81200.76180.10510.19051.00000.52941.00000.94120.47060.82630.00000.77980.5174
6Lushan0.73530.66180.12720.48650.00000.08330.25001.00000.87500.12360.00000.78870.5313
7Baofeng0.70290.70550.28440.37500.60000.25000.20000.37500.50000.18640.05230.79050.2500
8Jiaxian0.68460.67360.52060.53330.66670.12500.00000.25000.25000.00000.17070.79140.2188
9Yuzhou0.63120.53900.39060.28570.66670.33330.00000.80950.90480.38420.22550.80080.5521
10Changge0.68080.54700.37830.90910.00000.00000.00000.75000.00000.82950.00000.80200.1597
11Xinzheng0.68080.54700.53360.38460.20000.56250.00000.62500.87500.14840.00000.80500.5486
12Hangkonggang0.67370.55560.81480.80001.00000.77780.00000.44440.33330.11440.00000.81200.2535
13Zhengzhou0.68080.54700.89950.60870.57141.00000.00000.22221.00000.00000.26220.81440.4306
14Xingyang0.64910.45001.00030.83330.50001.00000.00000.00000.00000.10210.48700.81630.2083
15Chuanghuang0.55250.52650.90791.00000.00000.00000.00000.00000.00000.00000.41550.82580.1042
16Wenbo0.50660.46290.19250.53330.00000.25000.00001.00001.00000.00000.00000.82850.2465
17Jiaozuo0.74670.61400.67760.62500.62501.00000.00000.00001.00000.00000.78060.83000.6840
18Huixian0.74670.61400.11710.84440.33330.28570.33330.35710.92860.20730.26760.83210.5347
19Weihui0.80590.67190.14160.76190.50000.33330.25000.00000.66670.66840.13850.83320.3542
20Hebi0.89990.74680.15740.87500.50000.07140.00000.00000.21430.92610.16880.84490.4792
21Tangyin0.95390.80150.81500.28570.00000.12500.00000.00000.00000.86490.20250.84890.3611
22Anyang0.95390.80150.57880.41670.33330.56250.00000.68750.81250.51370.05590.85060.6944
23Chuanzhang0.54030.47820.18561.00000.00000.00000.00000.00000.00000.00000.00000.85250.0208
24Cixian0.81480.73450.71520.30770.00000.33330.00000.11110.27780.78000.10730.86030.3125
25Handan0.81480.73450.54780.42860.50000.66670.00001.00000.66670.92970.16640.86080.1632
26Yongnian0.87630.81890.29170.30770.00000.22220.00000.88890.11110.26140.32270.86180.2500
27Shahe1.00001.00000.04450.33331.00000.28570.66670.28570.57140.77050.53500.86490.1215
28Xingtai0.84320.80770.20330.57140.22220.45450.11110.00000.90910.23770.04710.86530.4826
29Lincheng0.83670.87550.13010.09520.00000.11760.33330.05880.41180.15430.27170.86810.1979
30Gaoyi Yuanshi0.83670.87550.16660.41670.00000.53850.50000.07690.61540.11870.19920.87320.2674
31Shijiazhuang0.61300.54840.18990.64000.50000.81820.16670.72730.81820.01760.38530.87780.4653
32Xinle0.72390.79160.16500.53331.00000.00001.00001.00000.22220.00000.00000.89100.2222
33Dingzhou0.73690.81110.19760.53330.00000.00000.33330.37500.12500.00000.00000.90780.1424
34Tangxian0.62090.66710.72290.21051.00000.50000.00000.50001.00000.00000.71630.90980.1979
35Shunping0.66240.71430.24900.33331.00000.58330.00000.08331.00000.00001.00000.93740.1354
36Baoding0.66240.71430.12320.22220.00000.66670.50000.66670.83330.00000.00000.96940.0868
37Yixian0.62030.73280.13730.69570.20000.76000.00000.56000.00000.00000.00000.99330.3542
38Laizhuo0.58650.62030.39220.11760.75000.08330.75000.00001.00000.00000.00000.99900.1910
39Xiheishan0.59550.52740.19930.57140.00000.60000.00000.00000.40000.00000.37081.00000.0799

References

  1. Loeffler, M.J. AUSTRALIAN-AMERICAN INTERBASIN WATER TRANSFER. Ann. Assoc. Am. Geogr. 1970, 60, 493–516. [Google Scholar] [CrossRef]
  2. Kummu, M.; Guillaume, J.H.A.; De Moel, H.; Eisner, S.; Flörke, M.; Porkka, M.; Siebert, S.; Veldkamp, T.I.E.; Ward, P.J. The world’s road to water scarcity: Shortage and stress in the 20th century and pathways towards sustainability. Sci. Rep. 2016, 6, 38495. [Google Scholar] [CrossRef] [Green Version]
  3. Donoso, M.; Baldassarre, G.D.; Boegh, E.; Browning, A.; Oki, T.; Tindimugaya, C.; Vairavamoorthy, K.; Vrba, J.; Zalewski, M.; Zubari, W.K. International Hydrological Programme (IHP) eighth phase: Water security: Responses to local, regional and global challenges. Strategic plan, IHP-VIII (2014–2021). In Zbornik Nije Izdan; Unesco: Paris, France, 2012. [Google Scholar]
  4. Oki, T.; Kanae, S.; Musiake, K. Global Hydrological Cycle and World Water Resources. Science 2006, 313, 1068–1072. [Google Scholar] [CrossRef] [Green Version]
  5. Erika, M. China’s South-to-North Water Transfer Project. Honor. Undergrad. Res. J. 2015. [Google Scholar]
  6. Long, D.; Yang, W.; Scanlon, B.R.; Zhao, J.; Liu, D.; Burek, P.; Pan, Y.; You, L.; Wada, Y. South-to-North Water Diversion stabilizing Beijing’s groundwater levels. Nat. Commun. 2020, 11, 3665. [Google Scholar] [CrossRef]
  7. Yan, D.H.; Wang, H.; Li, H.H.; Wang, G.; Qin, T.L.; Wang, D.Y.; Wang, L.H. Quantitative analysis on the environmental impact of large-scale water transfer project on water resource area in a changing environment. Hydrol. Earth Syst. Sci. 2012, 16, 2685–2702. [Google Scholar] [CrossRef] [Green Version]
  8. Domicelj, S. The Australian Snowy Mountains scheme: National growth and regional development. Habitat Int. 1980, 5, 601–616. [Google Scholar] [CrossRef]
  9. Andreide, J.P.G.; Zhu, Q. Comparison of Brazil’s cross-basin water transfer practice and inter-national cases. Water Resour. Hydropower Bull. 2011, 32, 1–6. [Google Scholar]
  10. Zhongjue, W.; Shuifen, Z.; Xuting, W. Research on flood risk of series water transfer project system based on theory of life distribution. J. Water Resour. Water Eng. 2014, 25, 78–80. [Google Scholar]
  11. Liu, J.; Li, M.; Wu, M.; Luan, X.; Wang, W.; Yu, Z. Influences of the south–to-north water di-version project and virtual water flows on regional water resources considering both water quantity and quality. J. Clean. Prod. 2020, 244, 118920. [Google Scholar] [CrossRef]
  12. Fang, S.; Liu, M.; Ren, Y. Drought and flood characteristics and risk prediction of the water source and wa-ter-receiving areas of the Middle Route of South-to-North Water Transfer Project. Bull. Soil Water Conserv. 2018, 38, 263–267. [Google Scholar]
  13. Yang, Y.; Lei, X.; Long, Y.; Tian, Y.; Zhang, Y.; Yao, Y.; Hou, X.; Shi, M.; Wang, P.; Zhang, C.; et al. A novel comprehensive risk assessment method for sudden water accidents in the Middle Route of the South–North Water Transfer Project (China). Sci. Total Environ. 2020, 698, 134167. [Google Scholar] [CrossRef]
  14. Huang, X.; Li, W.; Chen, Y.; Fang, G.; Yan, W. Risk assessment of floodwater resources utilization in water transfer projects based on an improved cloud model. Water Supply 2019, 19, 2517–2532. [Google Scholar] [CrossRef]
  15. Tang, H. Thoughts on risk assessment of long-distance water transfer projects. Water Resour. Plan. Des. 2020, 86–91. [Google Scholar]
  16. Tian, Y.; Jiang, B.; Huang, H.; Shen, F. Study on risk factor identification and risk control of transboundary river security. Water Resour. Hydropower Eng. 2018, 49, 9–15. [Google Scholar]
  17. Jin, S.; Liu, H.; Ding, W.; Shang, H.; Wang, G. Sensitivity Analysis for the Inverted Siphon in a Long Distance Water Transfer Project: An Integrated System Modeling Perspective. Water 2018, 10, 292. [Google Scholar] [CrossRef] [Green Version]
  18. Xuan, S.; Heng, L.; Leihua, G.; Beilei, J.; Aihua, L. Risk identification of cross-buildings in the middle route of South-to-North Water Transfer Project. South—North Water Divers. Water Sci. Technol. 2009, 7, 13–15. [Google Scholar]
  19. Yuan, Z.; Hong, S.K.; Ruci, W.; Yanwen, Z. Risk analysis of cross buildings in the middle route of South-to-North Water Transfer Project. Hydrology 1995, 03, 1–7. [Google Scholar]
  20. Heng, L.; Xuan, S.; Leihua, G.; Huaping, Z.; Pengbo, X. Research on flood risk estimation model for cross-sectional buildings in the middle route of the South-to-North Water Transfer Project. Yangtze River 2010, 41, 74–77. [Google Scholar]
  21. Ping, F.; Dapeng, Y.; Liucheng, G.; Weimin, T. Research on flood control risk assessment method of the main canal of the middle route of the South-to-North Water Transfer Project. J. Hydraul. Eng. 2003, 40–45. [Google Scholar]
  22. Code for Design of Highway Subgrade, JTGD30, Ministry of Transport of the People’s Republic of China, 2015.
  23. Chao, X.; Ren, B. Analysis of Time Series Changes and Regional Differences of China’s Economic Growth Quality. Econ. Res. 2011, 46, 26–40. [Google Scholar]
  24. Koczkodaj, W.W.; Magnot, J.P.; Mazurek, J.; Peters, J.F.; Rakhshani, H.; Soltys, M.; Strzałka, D.; Tozzi, A. On normalization of inconsistency indicators in pairwise comparisons. Int. J. Approx. Reason. 2017, 86, 73–79. [Google Scholar] [CrossRef] [Green Version]
  25. Gao, X.; Li, X. Comparative study of linear dimensionless methods in principal component analysis. Stat. Decis. 2020, 36, 35–38. [Google Scholar]
  26. Saaty, T.L. A scaling method for priorities in hierarchical structures. J. Math. Psychol. 1977, 15, 234–281. [Google Scholar] [CrossRef]
  27. Fang, G.; Zhu, X.; Huang, X. Risk analysis of floodwater resources utilization along water diversion project: A case study of the Eastern Route of the South-to-North Water Diversion Project in China. Water Supply 2019, 19, 2464–2475. [Google Scholar] [CrossRef]
  28. Saaty, T.L. Analytic Hierarchy Process. In Encyclopedia of Biostatistics; John Wiley & Sons, Ltd.: Chichester, UK, 2013. [Google Scholar]
  29. Saaty, T.L. How to Make a Decision: The Analytic Hierarchy Process. Interfaces 1994, 24, 19–43. [Google Scholar] [CrossRef] [Green Version]
  30. Zhang, S.; Fan, W.; Yi, Y.; Zhao, Y.; Liu, J. Evaluation method for regional water cycle health based on nature-society water cycle theory. J. Hydrol. 2017, 551, 352–364. [Google Scholar] [CrossRef]
  31. Shao, W.; Zhao, B.; Chen, X.; Liu, G. Comprehensive evaluation on project of water diversion to northern Zhejiang province. J. Hydraul. Eng. 2007. [Google Scholar]
  32. Legates, D.R.; Mccabe, G.J. Evaluating the use of “goodness-of-fit” Measures in hydrologic and hydroclimatic model validation. Water Resour. Res. 1999, 35, 233–241. [Google Scholar] [CrossRef]
  33. Zhao, R.-H.; Qi, Z.; Wang, X.-J.; Zhao, Y.; Zhang, L.-Z. Risk Identification and Assessment of the Acci-dents for Distance Water Transfer Project. DEStech Trans. Environ. Energy Earth Sci. 2018. [Google Scholar] [CrossRef]
  34. Wang, L.; Gao, J.; Zou, C.; Wang, Y.; Lin, N. Water scarcity in Beijing and countermeasures to solve the problem at river basins scale. In Proceedings of the 2017 3rd International Conference on Energy, Environment and Materials Science (EEMS 2017), Singapore, 28–30 July 2017; Volume 94. [Google Scholar]
  35. Sha, Z.; Zhang, M.; Li, Z.; Xiao, T. Analysis of hydrological and climatic characteristics along the main canal of the middle route of the South-to-North Water Transfer Project. People’s Yangtze River 2001, 32, 3–5. [Google Scholar]
  36. Stott, P. How climate change affects extreme weather events. Science 2016, 352, 1517–1518. [Google Scholar] [CrossRef] [PubMed]
  37. IPCC. Managing the Risks of Extreme Events and Disasters to Advance Climate Change Adaptation; Field, C.B., Barros, V., Stocker, T.F., Qin, D., Dokken, D.J., Ebi, K.L., Mastrandrea, M.D., Mach, K.J., Plattner, G.-K., Allen, S.K., et al., Eds.; Cambridge University Press: Cambridge, UK; New York, NY, USA, 2012. [Google Scholar]
Figure 1. Overall technical framework for flood control risk identification and assessment of the large-scale water transfer project.
Water 13 01770 g001
Figure 2. Types of dikes and cross-sectional buildings in main water conveyance canals.
Water 13 01770 g002
Figure 3. Flood control risk identification and index decomposition of large-scale water transfer project.
Water 13 01770 g003
Figure 4. Study area map.
Water 13 01770 g004
Figure 5. Spatial distribution of flood comprehensive risk assessment of the middle route of the South-to-North Water Transfer Project, they should be listed as: (a) rainfall–runoff; (b) confluence and flow capacity; (c) engineering geological characteristics; (d) economic and social layout; (e) comprehensive flood control risk spatial distribution map.
Water 13 01770 g005aWater 13 01770 g005b
Table 1. Flood control risk index assessment system and index calculation of large-scale water transfer project.
NumberIndexRisk IndexAssessment IndexRisk Events Caused or ReflectedBasic Index ExpressionIndex Attribute
Positive IndexNegative Index
1DangerousnessRainfall–runoffThe maximum 1-day rainfall in 50 yearsRainstorm intensity/
2The maximum 3-day rainfall in 50 yearsQuantity and intensity of rainstorm/
3Proportion of construction land areaIncreased runoff, increased flood volume Proportion of construction land
4Confluence and flow capacityConfluence path mergeConcentrated outflow, high water level Ratio of current number of rivers to total number of rivers before project construction
5Narrow flood passageHigh water levelProportion of rivers with flood discharge section narrowing
6Absence of drainage channelsThere is no way out for floodProportion of rivers with no or unsmooth drainage channels
7Changes in river topographyTraceability erosionProportion of rivers with sand pit
8Self-blockage of buildingsPoor flood discharge and high water levelProportion of self-blockage buildings
9Easy blockage of buildingsPoor flood discharge and high water levelProportion of easy-blockage buildings
10ExposednessEngineering Geological Characteristics of the canal sectionProportion of unfavorable geological sectionWaterlogging riskRatio of the length of bad geological section to total length of assessment section
11Proportion of deep excavation canal sectionExternal flood into canalRatio of the length of deep excavation section to total length of assessment section
12VulnerabilityEconomic and Social LayoutDistance between villages (towns) and the main canalEconomic and social impactMin(average distance from upstream/1 km; average distance from downstream/3 km)
13Number of villages (towns) close to the main canalEconomic and social impactSum of number of villages and towns on both sides of the canal section from 1 km upstream to 3 km downstream
Table 2. List of data sources.
NumberType of DateSourcesNote
1Daily rainfall dataNational Meteorological CenterNational Basic Weather Station, 1961–2011
2Land-use dataData Center for Resources and Environmental Sciences, CASIn 2010, 1:100,000
3DEM dataSRTM DATA VERSION 390 m
4Engineering geological characteristics of water conveyance canal sectionEngineering Management Office, engineering design information/
5Crossing building and its nearby upstream and downstream river dataEngineering Management Office,
Google remote sensing image
/
6Economic and social layout informationGoogle remote sensing image1 km upstream, 3 km downstream channel range
Table 3. Flood risk assessment index weights of the middle route of the South-to-North Water Transfer Project.
Risk IndexWeight
Risk IndexAssessment IndexWeight of risk indexWeight of assessment indexComprehensive weight
Rainfall-runoffThe maximum 1-d rainfall in 50 years0.26 0.62 0.16
The maximum 3-d rainfall in 50 years0.24 0.06
Proportion of construction land area0.14 0.04
Confluence and flow capacityConfluence path merge0.56 0.12 0.07
Narrow flood passage0.04 0.02
Absence of drainage channels0.41 0.23
Changes in river topography0.07 0.04
Self-blockage of buildings0.12 0.07
Easy blockage of buildings0.22 0.13
Engineering geological characteristics of the canal sectionProportion of unfavorable geological section0.11 0.50 0.06
Proportion of deep excavation canal section0.50 0.06
Economic and social layoutDistance between villages (towns) and the main canal0.07 0.50 0.04
Number of villages (towns) close to the main canal0.50 0.04
Table 4. Comprehensive risk assessment criteria for flood control of middle route of South-to-North Water Transfer Project.
FR≤0.3590.359 < FR ≤ 0.4760.476 < FR ≤ 0.576>0.576
Risk levelNo riskLow riskMedium riskHigh risk
Table 5. Comprehensive flood risk assessment grades of the middle route of the South-to-North Water Transfer Project.
NumberName of Management OfficeComprehensive Risk ValueRisk DegreeNumberName of Management OfficeComprehensive Risk ValueRisk Degree
1Dengzhou0.4668 Low risk21Tangyin0.3840 Low risk
2Zhenping0.5426 Medium risk22Anyang0.6260 High risk
3Nanyang0.4760 Low risk23Chuanzhang0.2227 No risk
4Fangcheng0.5013 Medium risk24Cixian0.4342 Low risk
5Yexian0.5983 High risk25Handan0.6414 High risk
6Lushan0.4585 Low risk26Yongnian0.4217 Low risk
7Baofeng0.4121 Low risk27Shahe0.5651 Medium risk
8Jiaxian0.3463 No risk28Xingtai0.5248 Medium risk
9Yuzhou0.5127 Medium risk29Lincheng0.3587 No risk
10Changge0.3513 No risk30Gaoyi Yuanshi0.5089 Medium risk
11Xinzheng0.5321 Medium risk31Shijiazhuang0.6133 High risk
12Hangkonggang0.5469 Medium risk32Xinle0.4095 Low risk
13Zhengzhou0.6610 High risk33Dingzhou0.3049 No risk
14Xingyang0.5372 Medium risk34Tangxian0.5604 Medium risk
15Chuanghuang0.2788 No risk35Shunping0.5670 Medium risk
16Wenbo0.4429 Low risk36Baoding0.5322 Medium risk
17Jiaozuo0.6938 High risk37Yixian0.4639 Low risk
18Huixian0.5239 Medium risk38Laizhuo0.3910 Low risk
19Weihui0.4991 Medium risk39Xiheishan0.4223 Low risk
20Hebi0.4211 Low risk
Table 6. Analysis of high-risk index.
Name of Assessment UnitNumberHigh Risk Index
Jiaozuo1All 3 left bank buildings were not well-drained
2All 3 left bank buildings risked easy blockage
3The maximum 1 d rainfall in 50 years was 144 mm
4The length of the deep excavation canal section accounted for 45% of the total canal section
5There were 21 natural rivers, and 15 after merging
Zhengzhou18 out of 9 left bank buildings were not well-drained
2All 9 left bank buildings risked easy blockage
3The maximum 1 d rainfall in 50 years was 131 mm
4There were 23 natural rivers, and 16 left after merging
5The maximum 3 d rainfall in 50 years was 184 mm
Handan16 out of 9 left bank buildings were not well-drained
2The maximum 1 d rainfall in 50 years was 157 mm
36 out of 9 left bank buildings risked easy blockage
4All 9 left bank buildings were self-blockage
5The length of unfavorable geological section (expansive soil, high groundwater level) accounted for 91% of the total canal section
Anyang1The maximum 1 d rainfall in 50 years was 184 mm
29 out of 16 left bank buildings were not well-drained
313 out of 16 left bank buildings risked easy blockage
4The maximum 3d rainfall in 50 years is 270 mm
511 out of 16 left bank buildings were “self-blockage”
Shijiazhuang19 out of 11 left bank buildings were not well-drained
29 out of 11 left bank buildings risked easy blockage
3The maximum 1 d rainfall in 50 years was 118 mm
48 out of 11 left bank buildings were “self-blockage”
5There were 25 natural rivers, and 17 after merging
Yexian1The maximum 1 d rainfall in 50 years is 157 mm
29 out of 17 left bank buildings were not well-drained
316 out of 17 left bank buildings were “self-blockage”
48 out of 17 left bank buildings risked easy blockage
5The maximum 3 d rainfall in 50 years was 257 mm
Table 7. Risk countermeasures.
Type of CountermeasuresRisk IndexSpecific Measures
Engineering measures Lay monitoring and early warning equipment for cross sections along the main canal to strengthen real-time water and rain monitoring.
Flood passage blockageAt the entrance of drainage buildings, clean up the risk sources of debris and soil, which may silt up the pipeline in the vicinity of the project, and build sand bars and sand sinks.
No drainage outlet on the right bankExcavate drainage channel to discharge into the existing river or other nearby water bodies.
Poor drainageDredge the downstream drainage channel, strengthen the river regulation, improve the flow capacity of the downstream river, and avoid the adverse impact of human activities on flood discharge.
Narrow cross-section of the upstream flood from the cross-sectional buildings of the river canalStop illegal construction activities within the protection area, demolish existing illegal buildings, and carry out river improvement.
Non-engineering measures Compile and improve the operability flood dispatching plan and flood prevention emergency rescue plan.
Strengthen the real-time monitoring of water and rain, and carry out the forecast and early warning of rainstorm and flood at the cross-section along the main canal.
Self-blockage of building/Risk of easy blockagePerform routine inspection and maintenance of the building; try to eliminate possible risk factors.
Local areas should plan for flood and drainage in non-river management areas.
Improve the flood control standard of key flood control parts.
The flood discharge section of the river is narrow, and the drainage is not smoothCooperate with local water departments to strengthen river regulation and keep river flood flow unobstructed.
Strengthen the construction of river management laws and regulations, clarify the scope of protection and specific requirements, establish illegal supervision mechanisms, and conduct dynamic monitoring and supervision.
The local government should solicit opinions from the administrative departments of the middle route of the South-to-North Water Transfer Project when implementing the regulation plan in river course regulation.
Economic and social layoutAmong the socioeconomic factors (population and asset distribution) in the flood-affected area, the local land-use planning and management should be strengthened, and the prohibited development zone and allowed development zone should be designated according to the spatial distribution of flood risk, and strictly implemented.
The opinions of the water conservancy department should be solicited for urban planning in the project protection areas and the scope of the underlying surfaces on the left and right banks.
Publisher’s Note: MDPI stays neutral with regard to jurisdictional claims in published maps and institutional affiliations.

