Article

Evaluation of FAO-56 Procedures for Estimating Reference Evapotranspiration Using Missing Climatic Data for a Brazilian Tropical Savanna

1
Programa de Pós-Graduação Tecnologias Ambientais, Universidade Federal de Mato Grosso do Sul, Campo Grande 79070-900, Brazil
2
Biological Sciences Department, California State University, San Marcos, CA 92096, USA
3
Programa de Pós Graduação em Física Ambiental, Instituto de Física, Universidade Federal de Mato Grosso, Cuiabá 78060-900, Brazil
4
Faculdade de Meteorologia, Instituto de Geociências, Universidade Federal do Pará, Belém 66075-110, Brazil
5
Departamento de Solos e Engenharia Rural, Faculdade de Agronomia e Zootecnia, Universidade Federal de Mato Grosso, Cuiabá 78060-900, Brazil
6
Department of Disaster Management, Begum Rokeya University, Rangpur 5400, Bangladesh
7
Laboratório de Ciências Atmosféricas, Universidade Federal de Mato Grosso do Sul, Campo Grande 79070-900, Brazil
*
Author to whom correspondence should be addressed.
Water 2021, 13(13), 1763; https://doi.org/10.3390/w13131763
Submission received: 22 May 2021 / Revised: 14 June 2021 / Accepted: 20 June 2021 / Published: 26 June 2021
(This article belongs to the Section Biodiversity and Functionality of Aquatic Ecosystems)

Abstract

:
The Brazilian savanna (Cerrado) has been heavily impacted by agricultural activities over the last four to five decades, and reliable estimates of reference evapotranspiration (ETo) are needed for water resource management and irrigation agriculture. The Penman–Monteith (PM) is one of the most accepted models for ETo estimation, but it requires many inputs that are not commonly available. Therefore, assessing the FAO guidelines to compute ETo when meteorological data are missing could lead to a better understanding of which variables are critically important for reliable estimates of ETo and how climatic variables are related to water requirements and atmospheric demands. In this study, ETo was computed for a grass-dominated part of the Cerrado from April 2010 to August 2019. We tested 12 different scenarios considering radiation, relative humidity, and/or wind speed as missing climatic data using guidelines given by the FAO. Our results presented that wind speed and actual vapor pressure do not affect ETo estimates as much as the other climatic variables; therefore, in the Cerrado’s conditions, wind speed and relative humidity measurements are less required than temperature and radiation data. When radiation data were missing, the computed ETo was overestimated compared to the benchmark. FAO procedures to estimate the net radiation presented good results during the wet season; however, during the dry season, their results were overestimated because the method could not estimate negative Rn. Our results indicate that radiation data have the highest impact on ETo for our study area and presumably for regions with similar climatic conditions. In addition, those FAO procedures for estimating radiation are not suitable when radiation data are missing.

1. Introduction

Over the last few decades, the hydrological cycle and climate of the Brazilian savanna (locally known as Cerrado) have been heavily affected by human activities, especially by the expansion of irrigation and the replacement of native vegetation by crops [1,2,3,4,5,6]. Due to this irrigated agricultural expansion, it is important to have good management of available water resources. To handle issues involving water requirements and atmospheric demand, the United Nations Food and Agriculture Organization (FAO) recommended calculating crop evapotranspiration (ETc) from reference evapotranspiration (ETo) [7]. Water demands and ETc are important considerations to improve water use efficiency in agriculture [8,9,10,11,12,13].
ETo is the evapotranspiration of a defined hypothetical reference well-watered crop with a crop height of 0.12 m, a canopy resistance of 70 s.m−1, and an albedo of 0.23 [14]. A “real” ETo value can only be obtained using lysimeters or other precision-measuring devices, which require time and are expensive [10,15,16], however, ETo can be computed from weather data, and climatic parameters are the only factors that affect ETo estimates [17,18]. The ETo estimation models available in the literature may be broadly classified as (1) fully physically based combination models that account for mass and energy conservation principles; (2) semi-physically based models that deal with either mass or energy conservation; and (3) black-box models based on artificial neural networks, empirical relationships, and fuzzy and genetic algorithms [19,20]. Several authors [21,22,23,24] have reported different methods to compute ETo, which have been tested in distinct regions and climates [6,25,26,27,28,29]; however, the Penman–Monteith (PM) method is recommended by the FAO to calculate ETo of any region when the requisite meteorological data are available [17]. The FAO-PM method can be used globally without any regional correction and is well documented and tested, but it has a relatively high data demand [10,30,31].
For daily calculation, FAO-PM method meteorological inputs are the maximum and minimum temperatures, relative air humidity, solar radiation, and wind speed. Allen et al. [17] suggested using the Hargreaves–Samani (HS) method [22] as an alternative when only air temperature data are available. However, the HS method should be verified and compared with the FAO-PM method since it tends to overestimate ETo under high relative humidity conditions and underestimate it under conditions of high wind speed [17,32,33,34]. FAO also recommends the pan evaporation (Epan) method, which is related to ETo using an empirically derived pan coefficient (Kp) [17].
For many locations around the globe, there is a lack of meteorological data. In Brazil, it is possible to collect climatic data from automatic stations of the National Institute of Meteorology (INMET). Although these data are public and the stations cover a significant part of the Cerrado region, there is neither a measure of net radiation nor estimates of regional solar radiation. Several studies have evaluated the use of FAO-PM method procedures to estimate ETo when solar radiation, wind speed, and relative humidity data are missing [35,36,37,38,39,40,41]; however, results vary according to the climatic conditions. Recent studies have used machine learning models to estimate ETo [6,42,43,44,45,46] and Epan [47,48,49] with limited weather data and satellite remote sensing to estimate global and regional real evapotranspiration [20,32], but few studies have reported the effects of meteorological data variability on ETo in the Cerrado, and no studies have addressed the impacts of missing climatic data for estimating ETo in a Brazilian tropical savanna. This research intends to close this gap in the literature.
It is important to evaluate the performance of the procedures and recommendations when ETo is obtained using missing climatic data. Knowing which meteorological data have the highest impact on ETo estimates could guide better investments in measurement instruments and provide a better understanding of the seasonal behavior of weather variables for the Cerrado region. Thus, the prime objective of this study was to assess the guidelines provided by the FAO to estimate ETo when meteorological data are limited for a grass-mixed Cerrado region and discuss the impact of each climatic variable on the ETo estimates. The outcome of this work will help inform water resource managers, irrigation engineers, and other professionals of the possible errors associated with ETo estimates and, thereby, improve water resource management in this vital region.

2. Materials and Methods

2.1. Study Area

This study was conducted at the Fazenda Miranda (15°17′ S, 56°06′ W), located in the Cuiaba municipality (Figure 1), Brazil. The vegetation is grass-dominated with sparse trees and shrubs, known as a campo sujo or “dirty field” Cerrado [50]. According to the Köppen climate classification, the climate in this area is characterized as Aw, tropical semi-humid, with dry winters and wet summers [51]. The average rainfall is 1420 mm and the mean annual air temperature is 26.5 °C, with a dry season that extends from May to October [4,52]. The study area is on flat terrain at an altitude of 157 m above sea level.

2.2. Micrometeorological Measurements

The measurements were conducted from April 2009 to August 2019. The measurement instruments were installed on a 20 m tall micrometeorological tower. The data collected were net radiation (Rn), solar radiation (Rs), soil heat flux (G), air temperature (Ta), relative humidity (RH), wind speed (u), soil temperature (Tsoil), soil moisture (SM), and precipitation (P). Rn and Rs were measured 5 m above the ground level using a net radiometer (NR-LITE-L25, Kipp & Zonen, Delft, The Netherlands) and a pyranometer (LI200X, LI-COR Biosciences, Inc., Lincoln, NE, USA), respectively. G was measured using a heat flux plate (HFP01-L20, Hukseflux Thermal Sensors BV, Delft, The Netherlands) installed 1.0 cm below the soil surface. SM was measured by a time-domain reflectometry probe (CS616-L50, Campbell Scientific, Inc., Logan, UT, USA) installed 20 cm below the soil surface. Tsoil was measured by a temperature probe (108 Temperature Probe, Campbell Scientific, Inc., Logan, UT, USA) installed 1 cm below the ground level. Ta and RH were measured by a thermohygrometer (HMP45AC, Vaisala Inc., Woburn, MA, USA) installed 2 m above the ground level. u was measured 10 m above the ground level using an anemometer (03101 R.M. Young Company, Traverse City, MI, USA). Precipitation was measured using a tipping bucket rainfall gauge (TR-525M, Texas Electronics, Inc., Dallas, TX, USA) installed 5 m above the ground level. We considered only data from days without gaps and measurement errors to avoid inconsistent information.

2.3. Penman–Monteith Method and FAO Procedures When Climatic Data Are Missing

The Penman–Monteith (FAO-PM) method (Equation (1)) is recommended by the Food and Agriculture Organization (FAO) as the standard method for determining reference evapotranspiration (ETo) [17]. We considered ETo computed with the full data set as the reference (benchmark) data for comparisons.
E T o = 0.408 ( R n G ) + γ 900 ( T a + 273 ) u 2 ( e s e a ) + γ ( 1 + 0.34 u 2 )
where ETo is the reference evapotranspiration (mm.day−1), Rn is net radiation (MJ.m−2.day−1), G is the soil heat flux (MJ.m−2.day−1), Ta is the mean daily air temperature (°C), u2 is the wind speed at 2 m height (m.s−1), es is the saturation water vapor pressure (kPa), ea is the actual water vapor pressure (kPa), γ is the psychrometric constant (kPA.°C−1), and Δ is the slope of the water vapor pressure curve (kPa.°C−1). We used Equation (2) (Allen et al., 1998) to convert u to u2.
u 2 = u z 4.87 ln ( 67.8 z 5.42 )
where uz is the measured wind speed at z m above ground surface (m.s−1), and z is the height of measurement above ground surface (m), which is 10 m in our study.
To test the impact of radiation, relative humidity, and wind speed data, ETo was also calculated by the FAO-PM using estimated meteorological variables, Rs, u2, and ea, obtained by procedures given by Allen et al. [17] and compared with data collected through measurements.
The FAO recommends two different approaches to estimate Rs when climatic data are missing, i.e., using temperature data or linear regression. In this study, we computed solar radiation by linear regression. Rs was estimated using Equation (3).
R s = ( a s + b s n N ) R a
where Rs is the solar radiation (MJ.m−2.day−1), n is the actual duration of sunshine (h), N is the maximum possible duration of daylight hours (h), Ra is the extraterrestrial radiation (MJ.m−2.day−1), and as and bs are local regression constants. To estimate Ra, we used Equation (4).
R a = 24 ( 60 ) π G s c d r [ ω s sin ( φ ) sin ( δ ) + cos ( φ ) cos ( δ ) sin ( ω s ) ]
where Ra is the extraterrestrial radiation (MJ.m−2.day−1), Gsc is the solar constant of 0.0820 MJ.m−2.min−1, dr is the inverse relative Earth–Sun distance, ωs is the sunset hour angle (rad), φ is the latitude of the meteorological station (rad), and δ is the solar decimation (rad). The values of dr and δ were computed using Equations (5) and (6).
d r = 1 + 0.033 cos ( 2 π 365 J )
δ = 0.409 sin ( 2 π 365 J 1.39 )
where J is the number of the day in the year between 1 (1 January) and 365 or 366 (31 December). ωs was estimated using Equation (7).
ω s = cos 1 [ tan ( φ ) tan ( δ ) ]
N was estimated using Equation (8).
N = 24 π ω s
where N is the maximum possible duration of daylight hours (h), and ωs is the sunset hour angle (rad) computed by Equation (7).
An estimate of clear-sky solar radiation (Rso) (Equation (9)), net shortwave radiation (Rns) (Equation (10)), and net longwave radiation (Rnl) is needed to estimate Rn from Rs (Equation (11)).
R s o = ( a s + b s ) R a
where Rso is the clear-sky radiation (MJ.m−2.day−1), as and bs are the parameters from Equation (3), and Ra is the extraterrestrial radiation (MJ.m−2.day−1).
R n s = ( 1 α ) R s
where Rns is the net shortwave radiation (MJ.m−2.day−1), α is the albedo, which is 0.23 for the hypothetical grass reference crop, and Rs is the solar radiation (MJ.m−2.day−1)
R n l = σ ( T m a x , K 4 + T m i n , K 4 2 ) ( 0.34 0.14 e a ) ( 1.35 R s R s o 0.35 )
where Rnl is the net longwave radiation (MJ.m−2.day−1), σ is the Stefan–Boltzmann constant of 4.903 × 10⁻⁹ MJ.K−4.m−2.day−1, Tmax,K is the maximum absolute temperature during the 24 h period (K), Tmin,K is the minimum absolute temperature during the 24 h period (K), ea is the actual vapor pressure (kPa), Rs is the solar radiation (MJ.m−2.day−1), and Rso is the clear-sky radiation (MJ.m−2.day−1).
Rn was estimated using Equation (12).
R n = R n s R n l
where Rn is the net radiation (MJ.m−2.day−1), Rns is the net shortwave radiation (MJ.m−2.day−1), and Rnl is the net longwave radiation (MJ.m−2.day−1).
For locations for which there were no solar radiation data available or no calibration for improved estimates of as and bs, Allen et al. [17] recommend as = 0.25 and bs = 0.50. We calibrated as and bs values using observed Rs values from April 2009 to March 2010. Using linear regression, the values of as and bs were, respectively, 0.192 and 0.506 (R2 = 0.833; n = 358 observations). Estimations of Rs were calculated using both the calibrated and recommended regression constants. Allen et al. [17] suggest considering daily G ≈ 0.
ea was estimated using Equation (13), considering the absence of relative air humidity data.
e a = 0.6108 e ( 17.27 T m i n T m i n + 237.3 )
where ea is the actual water vapor pressure (kPa), and Tmin is the minimum temperature (°C). Allen et al. [17] recommend the use of the dewpoint temperature; however, when humidity data are lacking, it can be assumed that the dewpoint temperature is near the daily minimum temperature.
For estimates of wind speed at 2 m height, Allen et al. [17] suggest the use of the average of wind speed from a nearby weather station over a several-day period. Therefore, u2 was considered a constant value estimated using the daily mean value of wind speed during the period of measurements (April 2009 to August 2019).

2.4. Hargreaves–Samani Method

The Hargreaves–Samani method [22] is recommended by the FAO to compute ETo, in mm.day−1, when only temperature data are available.
E T o = 0.0023 ( T m e a n + 17.8 ) T m a x T m i n 0.408 R a
where Tmean is the mean daily temperature (°C), Tmax is the maximum daily temperature (°C), Tmin is the minimum daily temperature (°C), and Ra is the extraterrestrial radiation (MJ.m−2.day−1). The constant value of 0.408 is a conversion factor for MJ.m−2.day−1 to mm.day−1.

2.5. ETo with Missing Climatic Data

Table 1 summarizes the calculation of ETo from April 2010 to August 2019 using limited climatic data. We computed ETo with the following scenarios of estimated data: (a) solar radiation with calibrated parameters (Rs-a); (b) solar radiation with recommended parameters (Rs-b); (c) relative air humidity (RH); (d) wind speed (WS); (e) Rs-a and RH; (f) Rs-b and RH; (g) Rs-a and WS; (h) Rs-b and WS; (i) RH and WS; (j) Rs-a, RH, and WS; (k) Rs-b, RH, and WS, and (l) using the Hargreaves–Samani method (HS).

2.6. Performance Evaluation

We compared each ETo estimate with missing data against the FAO-PM benchmark ETo that was calculated without missing data. The comparisons were made by simple linear regression. The performance of each scenario was assessed using Willmott’s index of agreement (d) [53] (Equation (15)), correlation coefficient (r) (Equation (16)), root mean square error (RMSE) in mm.day−1 (Equation (17)), and mean bias error (MBE) in mm.day−1 (Equation (18)).
d = 1 [ i = 1 n ( P i O i ) 2 i = 1 n ( | P i O ¯ | + | O i O ¯ | ) 2 ]
r = i = 1 n [ ( P i P ¯ ) ( O i O ¯ ) ] [ i = 1 n ( P i P ¯ ) 2 ] [ i = 1 n ( O i O ¯ ) 2 ]
RMSE = i = 1 n ( O i   P i ) 2 n
MBE = i = 1 n ( P i     O i ) n
where Pi is the estimate value of the i-th day (mm.day−1), Oi is the observed value of the i-th day (mm.day−1), P is the mean of estimated values (mm.day−1), O is the mean of observed values (mm.day−1), and n is the number of observed values. Willmott’s index of agreement (d) was used to quantify the degree of correspondence between Pi and Oi, where d = 1 indicates complete correspondence and d = 0 indicates no correspondence between measured and modeled values [53]. The root mean square error (RMSE) was used to quantify the amount of error between the observed and estimated values [53].

3. Results and Discussion

3.1. Seasonal Variation in Micrometeorological Condition

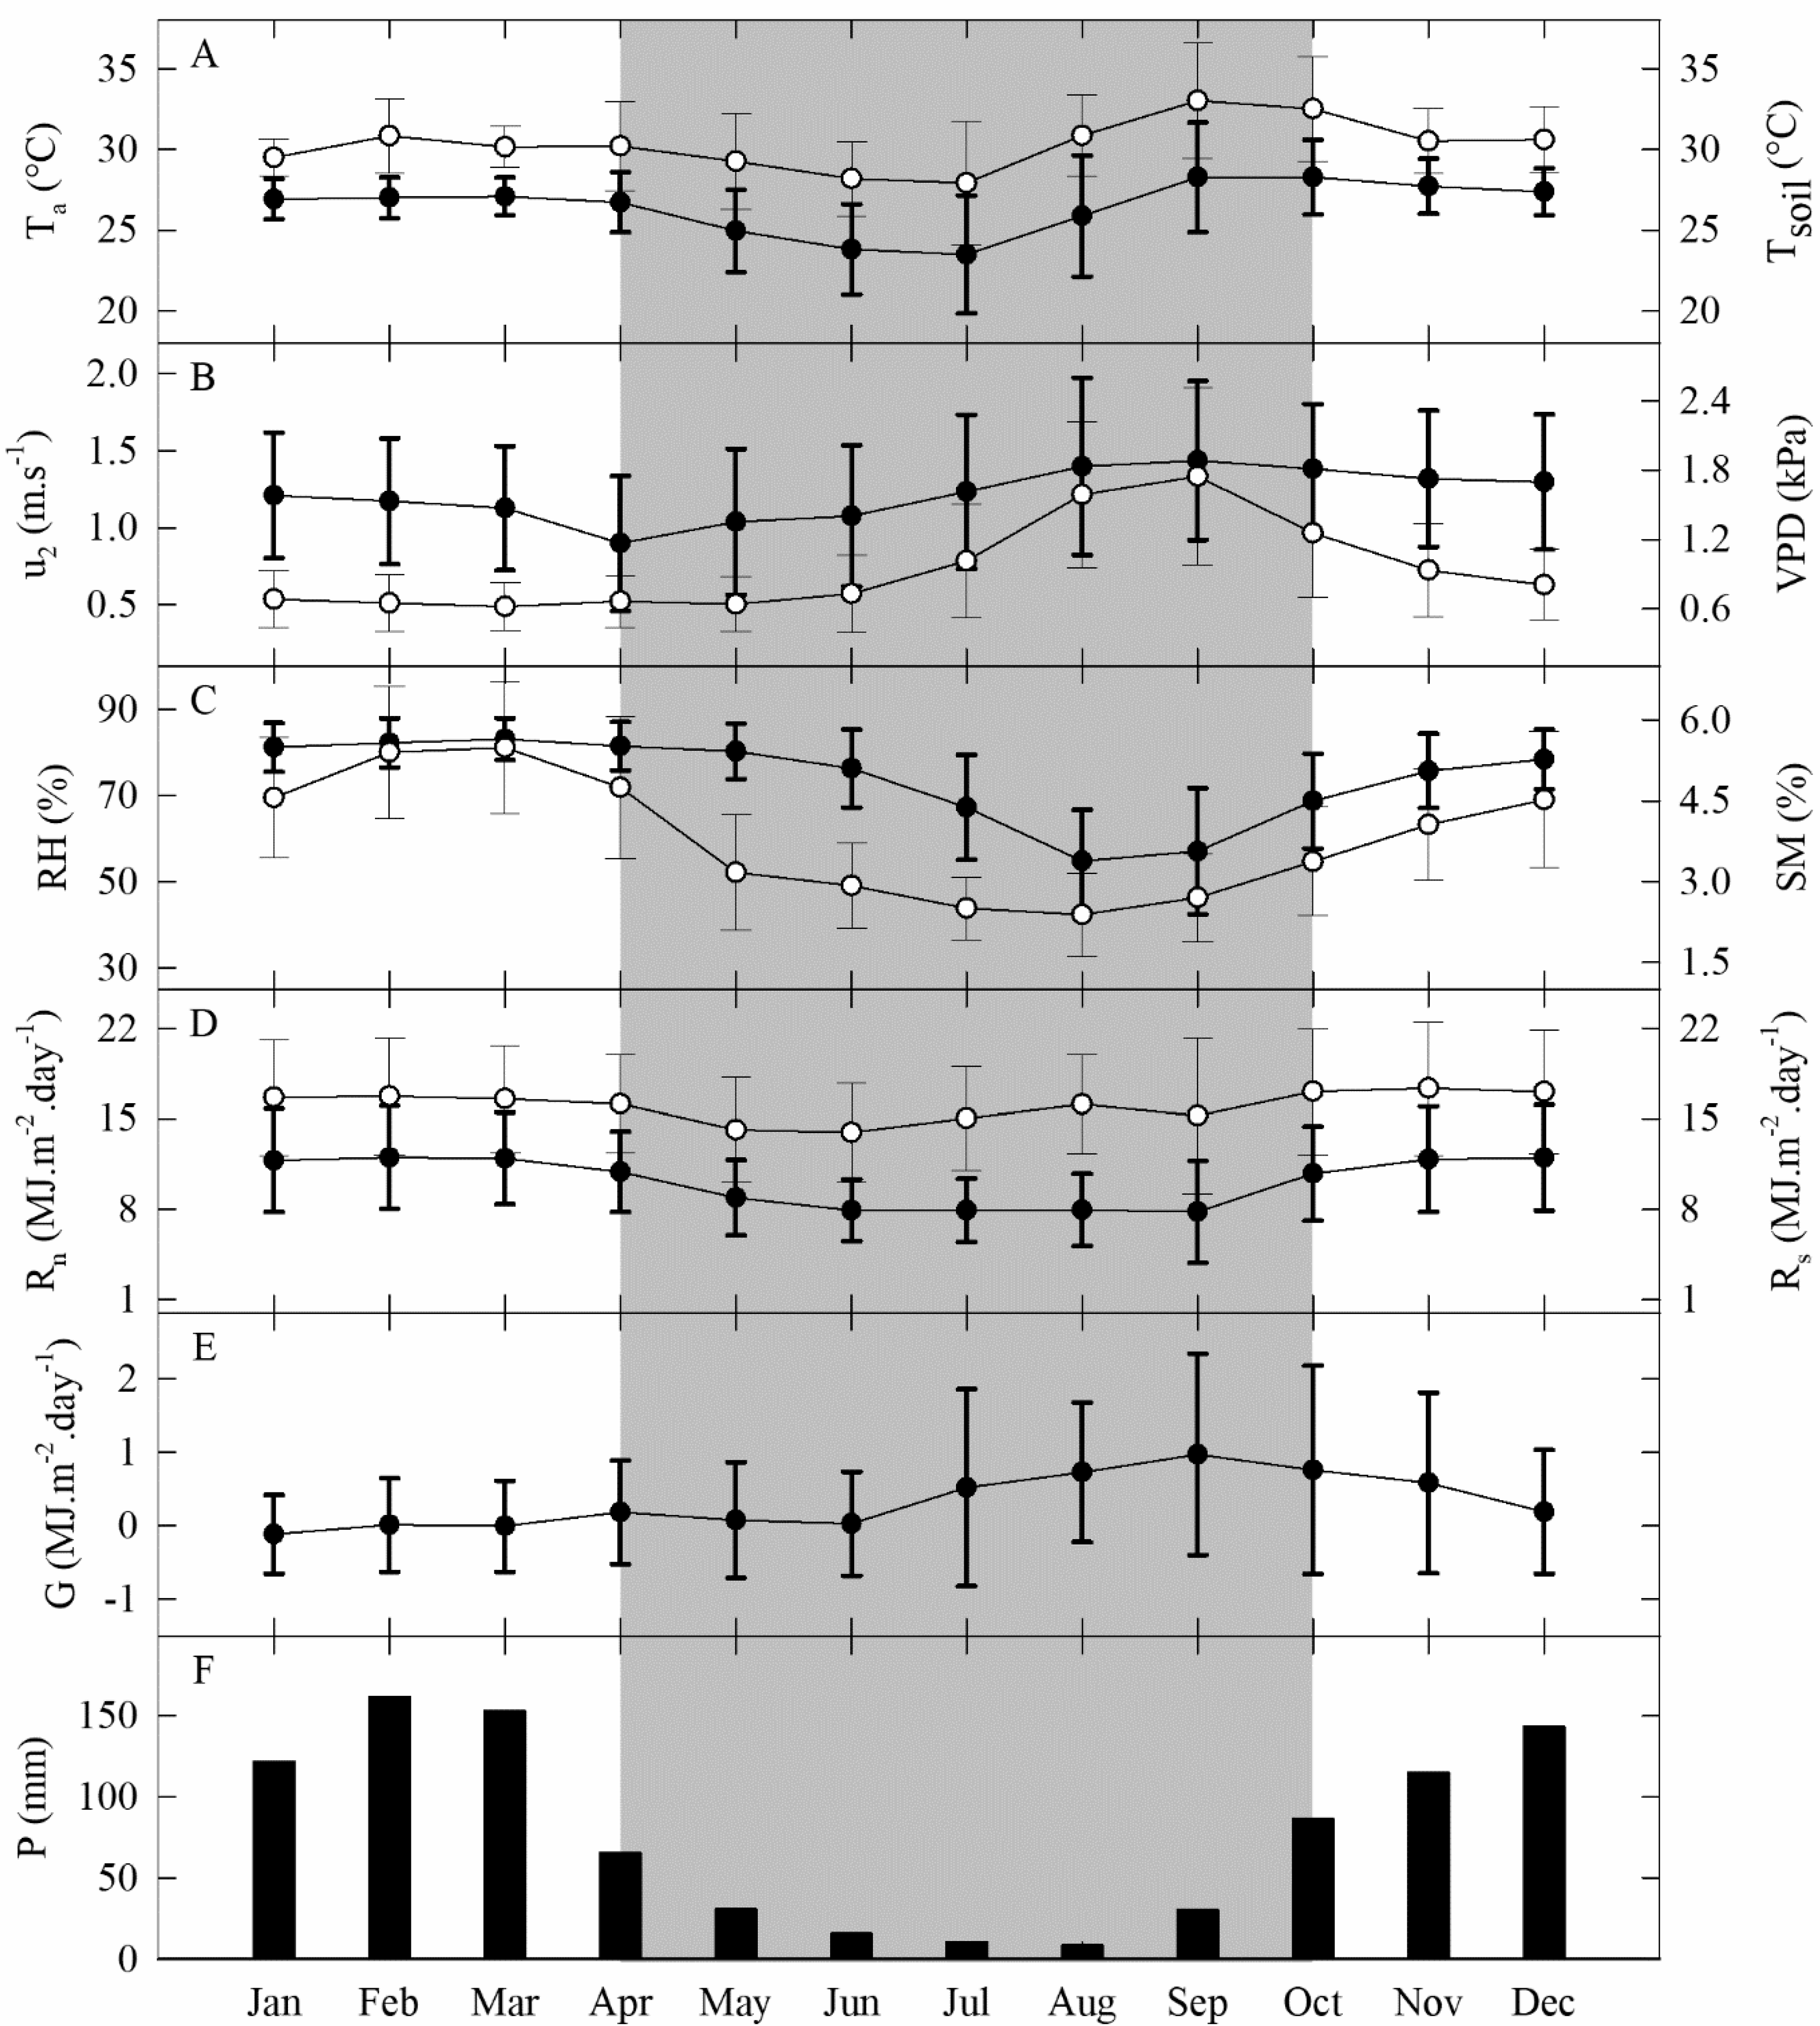
The climate in the study area showed a distinct seasonal variation (Figure 2). The dry season, which was defined as the period with a rainfall depth lower than 100 mm/month [4,54,55], occurred from April to October, and approximately 25% of the rainfall was recorded during this period (Figure 2F). Mean yearly accumulated rainfall (±sd) was 941 ± 297 mm during the study period, which is 34% lower than the expected rainfall for this region.
Variations in air and soil temperatures (Figure 2A) were higher during the dry season compared to the wet season, due to frequent cold fronts from the south [56]. The mean (±sd) temperature during the study period was 26.4 ± 2.9 °C. The month with the highest average air temperature was September (28.3 ± 3.4 °C), while the month with the lowest air temperature was July (23.5 ± 3.7 °C). The maximum air temperature was 42.0 °C, and the minimum was 6.3 °C. Relative humidity (Figure 2C) also varied seasonally, with the highest average values observed during the wet season and the lowest observed during the dry season. Average monthly gravimetric soil moisture (mass water/mass dry soil) (Figure 2C) ranged between 4% and 5.5% during the wet season, while soil water content reached 2.4% during the dry season when rainfall was scarce.
Wind speed at 2 m height (Figure 2B) showed a small seasonal variation during the study period, with an average value (±sd) of 1.2 ± 0.5 m.s−1. We found relatively large daily variation, due to the sporadic nature of the wind in the study area [50]. Allen et al. [17] classified mean wind speed below 1 m.s−1 as light wind and wind speed between 1 and 3 m.s−1 as light to moderate wind.
Net radiation (Figure 2D) was higher during the wet than the dry season; however, we found a larger standard deviation of Rn in the wet season because of frequent cloud cover [57]. The dry-season decline in net radiation may be due to changes in vegetation and a decline of greenness during this season when soil moisture values were lower [57,58]. On the other hand, Rs did not show a notable seasonal pattern like Rn (Figure 2D).
Seasonal variations of soil heat flux are represented as G (Figure 2E). Mean monthly values (±sd) varied from −0.11 ± 0.54 MJ.m−2.day−1, in January, to 0.97 ± 1.37 MJ.m−2.day−1, in September. From July to November, mean monthly and standard deviation values for G were higher than 0.5 and 0.9 MJ.m−2.day−1, respectively. During the dry season, vegetation leaf area declined due to the low soil water availability [58], causing an increase in uncovered area, and consequently, higher values of G. According to Rodrigues et al. [4], during September, G accounts for about 30% of the energy balance of the campo sujo Cerrado. The contribution of G in other tropical ecosystems, such as transition and tropical forests, accounts for about 1–2% of the available energy due to the more closed canopy and greenness during the dry season [1], which is in contrast with our study area since its vegetation is sparse [50].
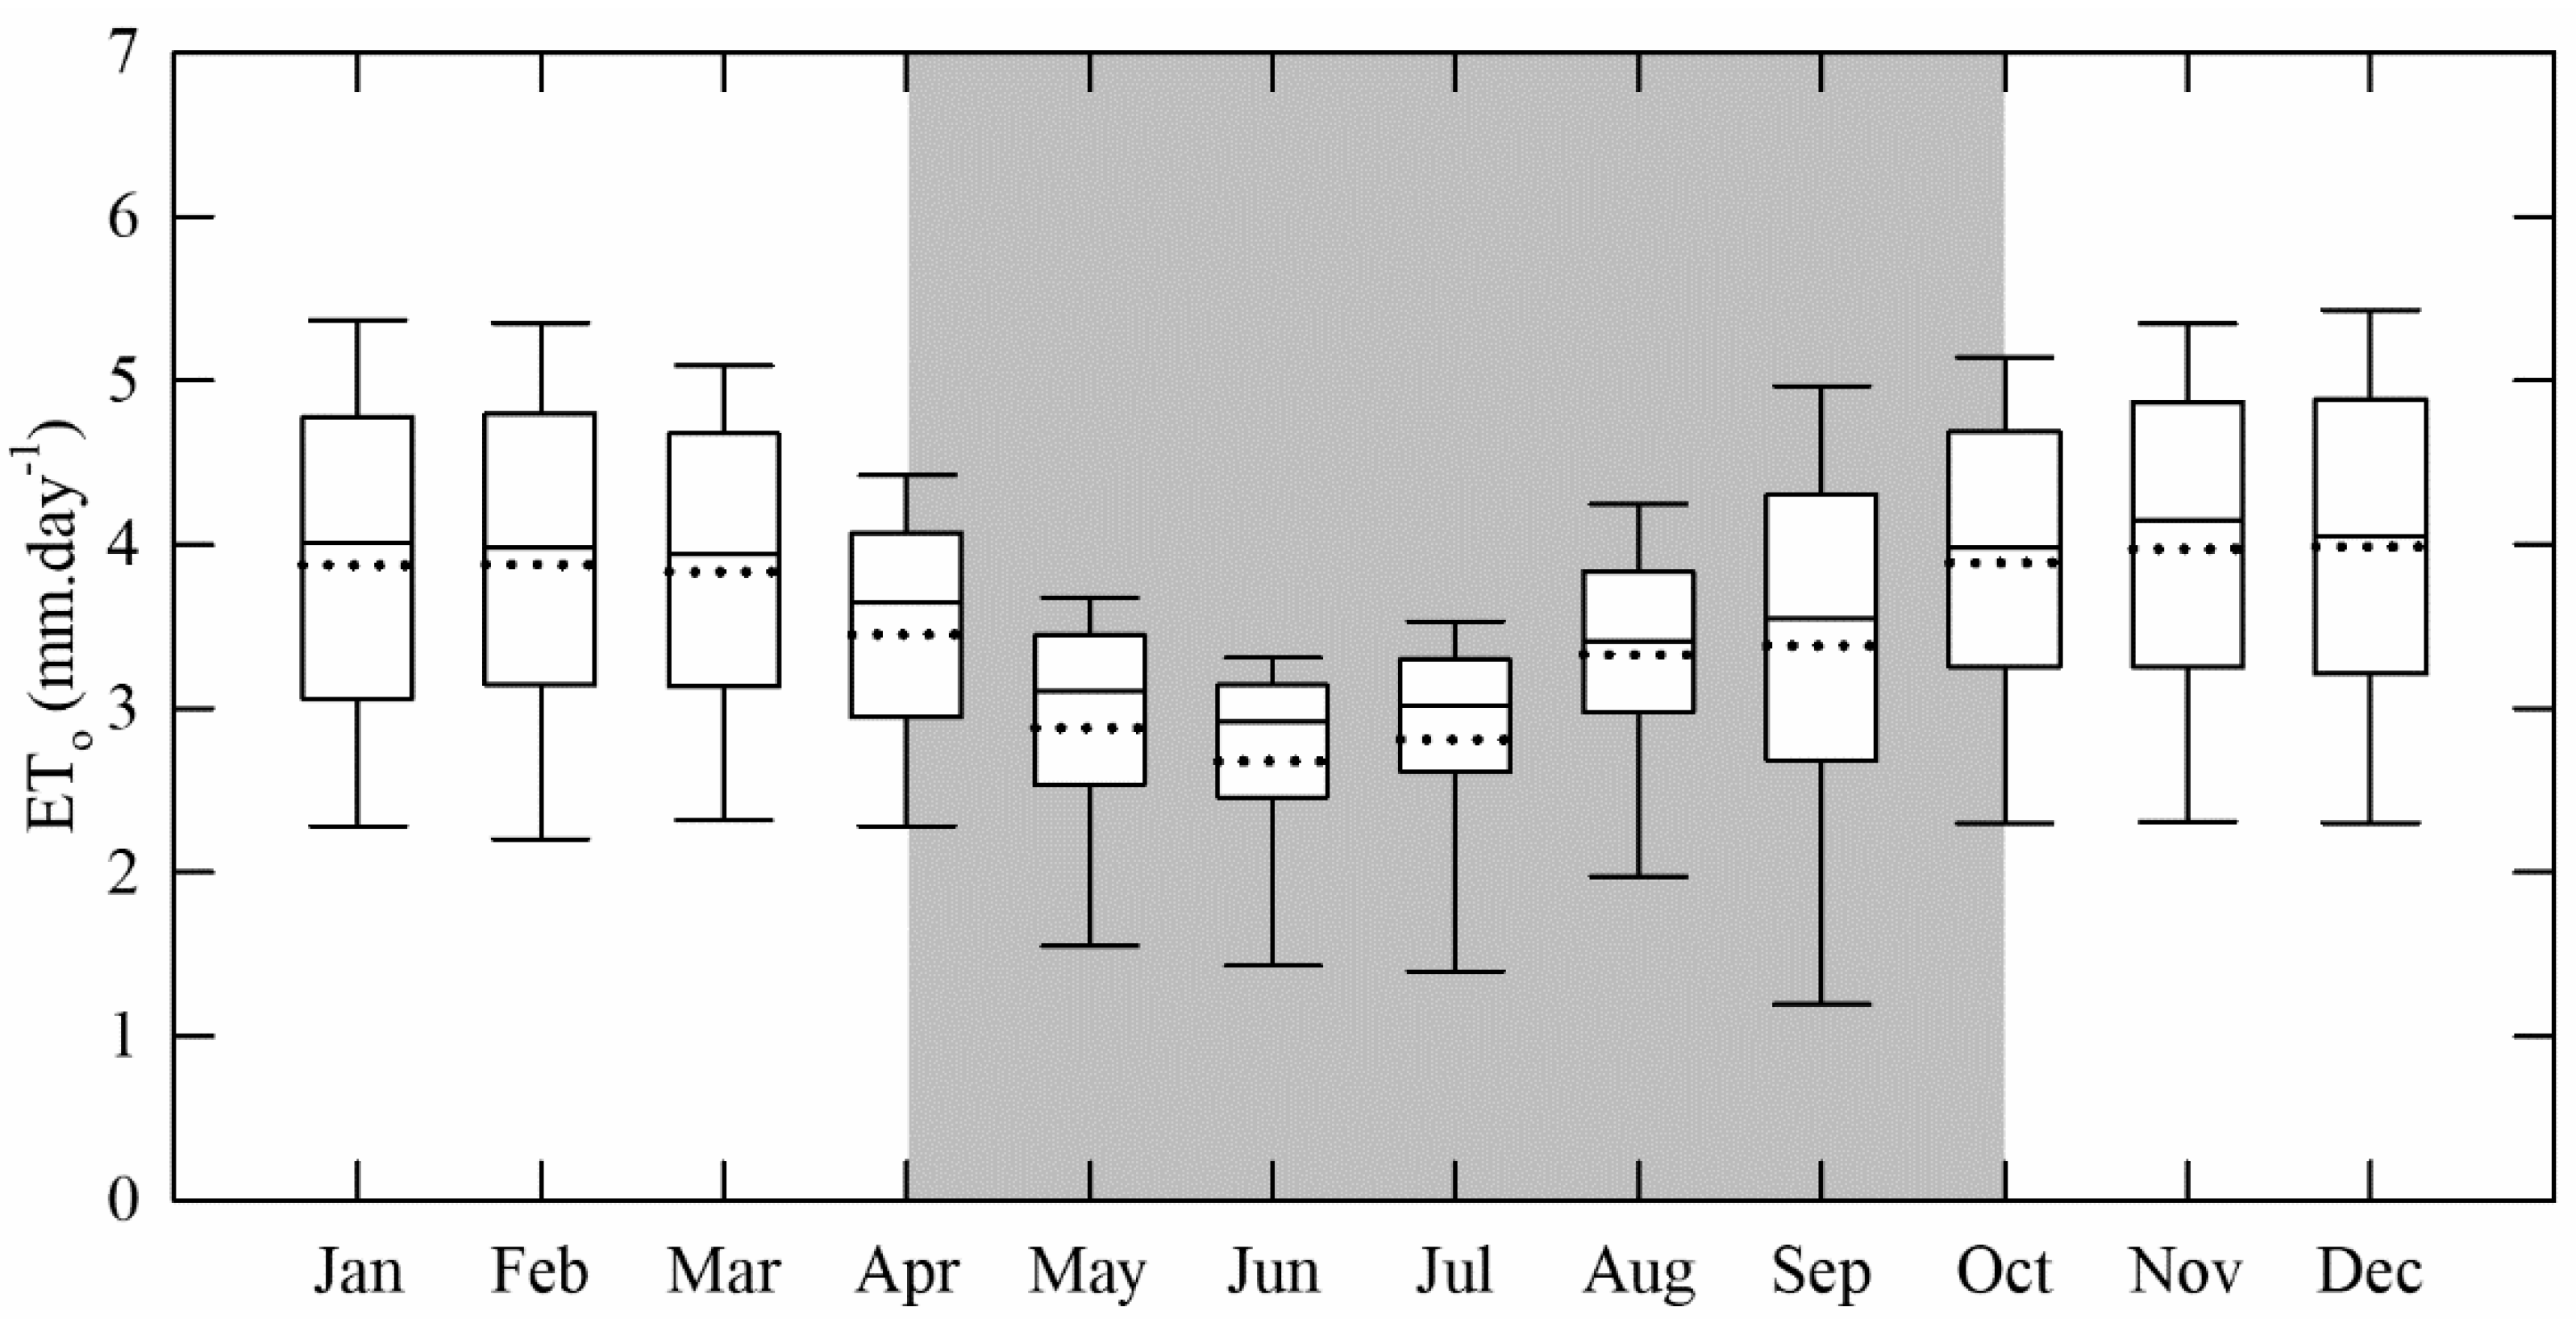
Figure 3 shows monthly mean ETo calculated using the Penman–Monteith method with observed meteorological data. The average ETo (±sd) was 3.49 ± 1.13 mm.day−1. Higher ETo values were observed during the wet season (November to March). When compared to the meteorological variables in Figure 2, ETo estimates behaved similarly to Rn. Valle Júnior et al. [6] pointed out that ETo models based on Rn perform better than different methods based on other variables for the campo sujo Cerrado conditions.

3.2. ETo Estimates with Limited Climatic Data

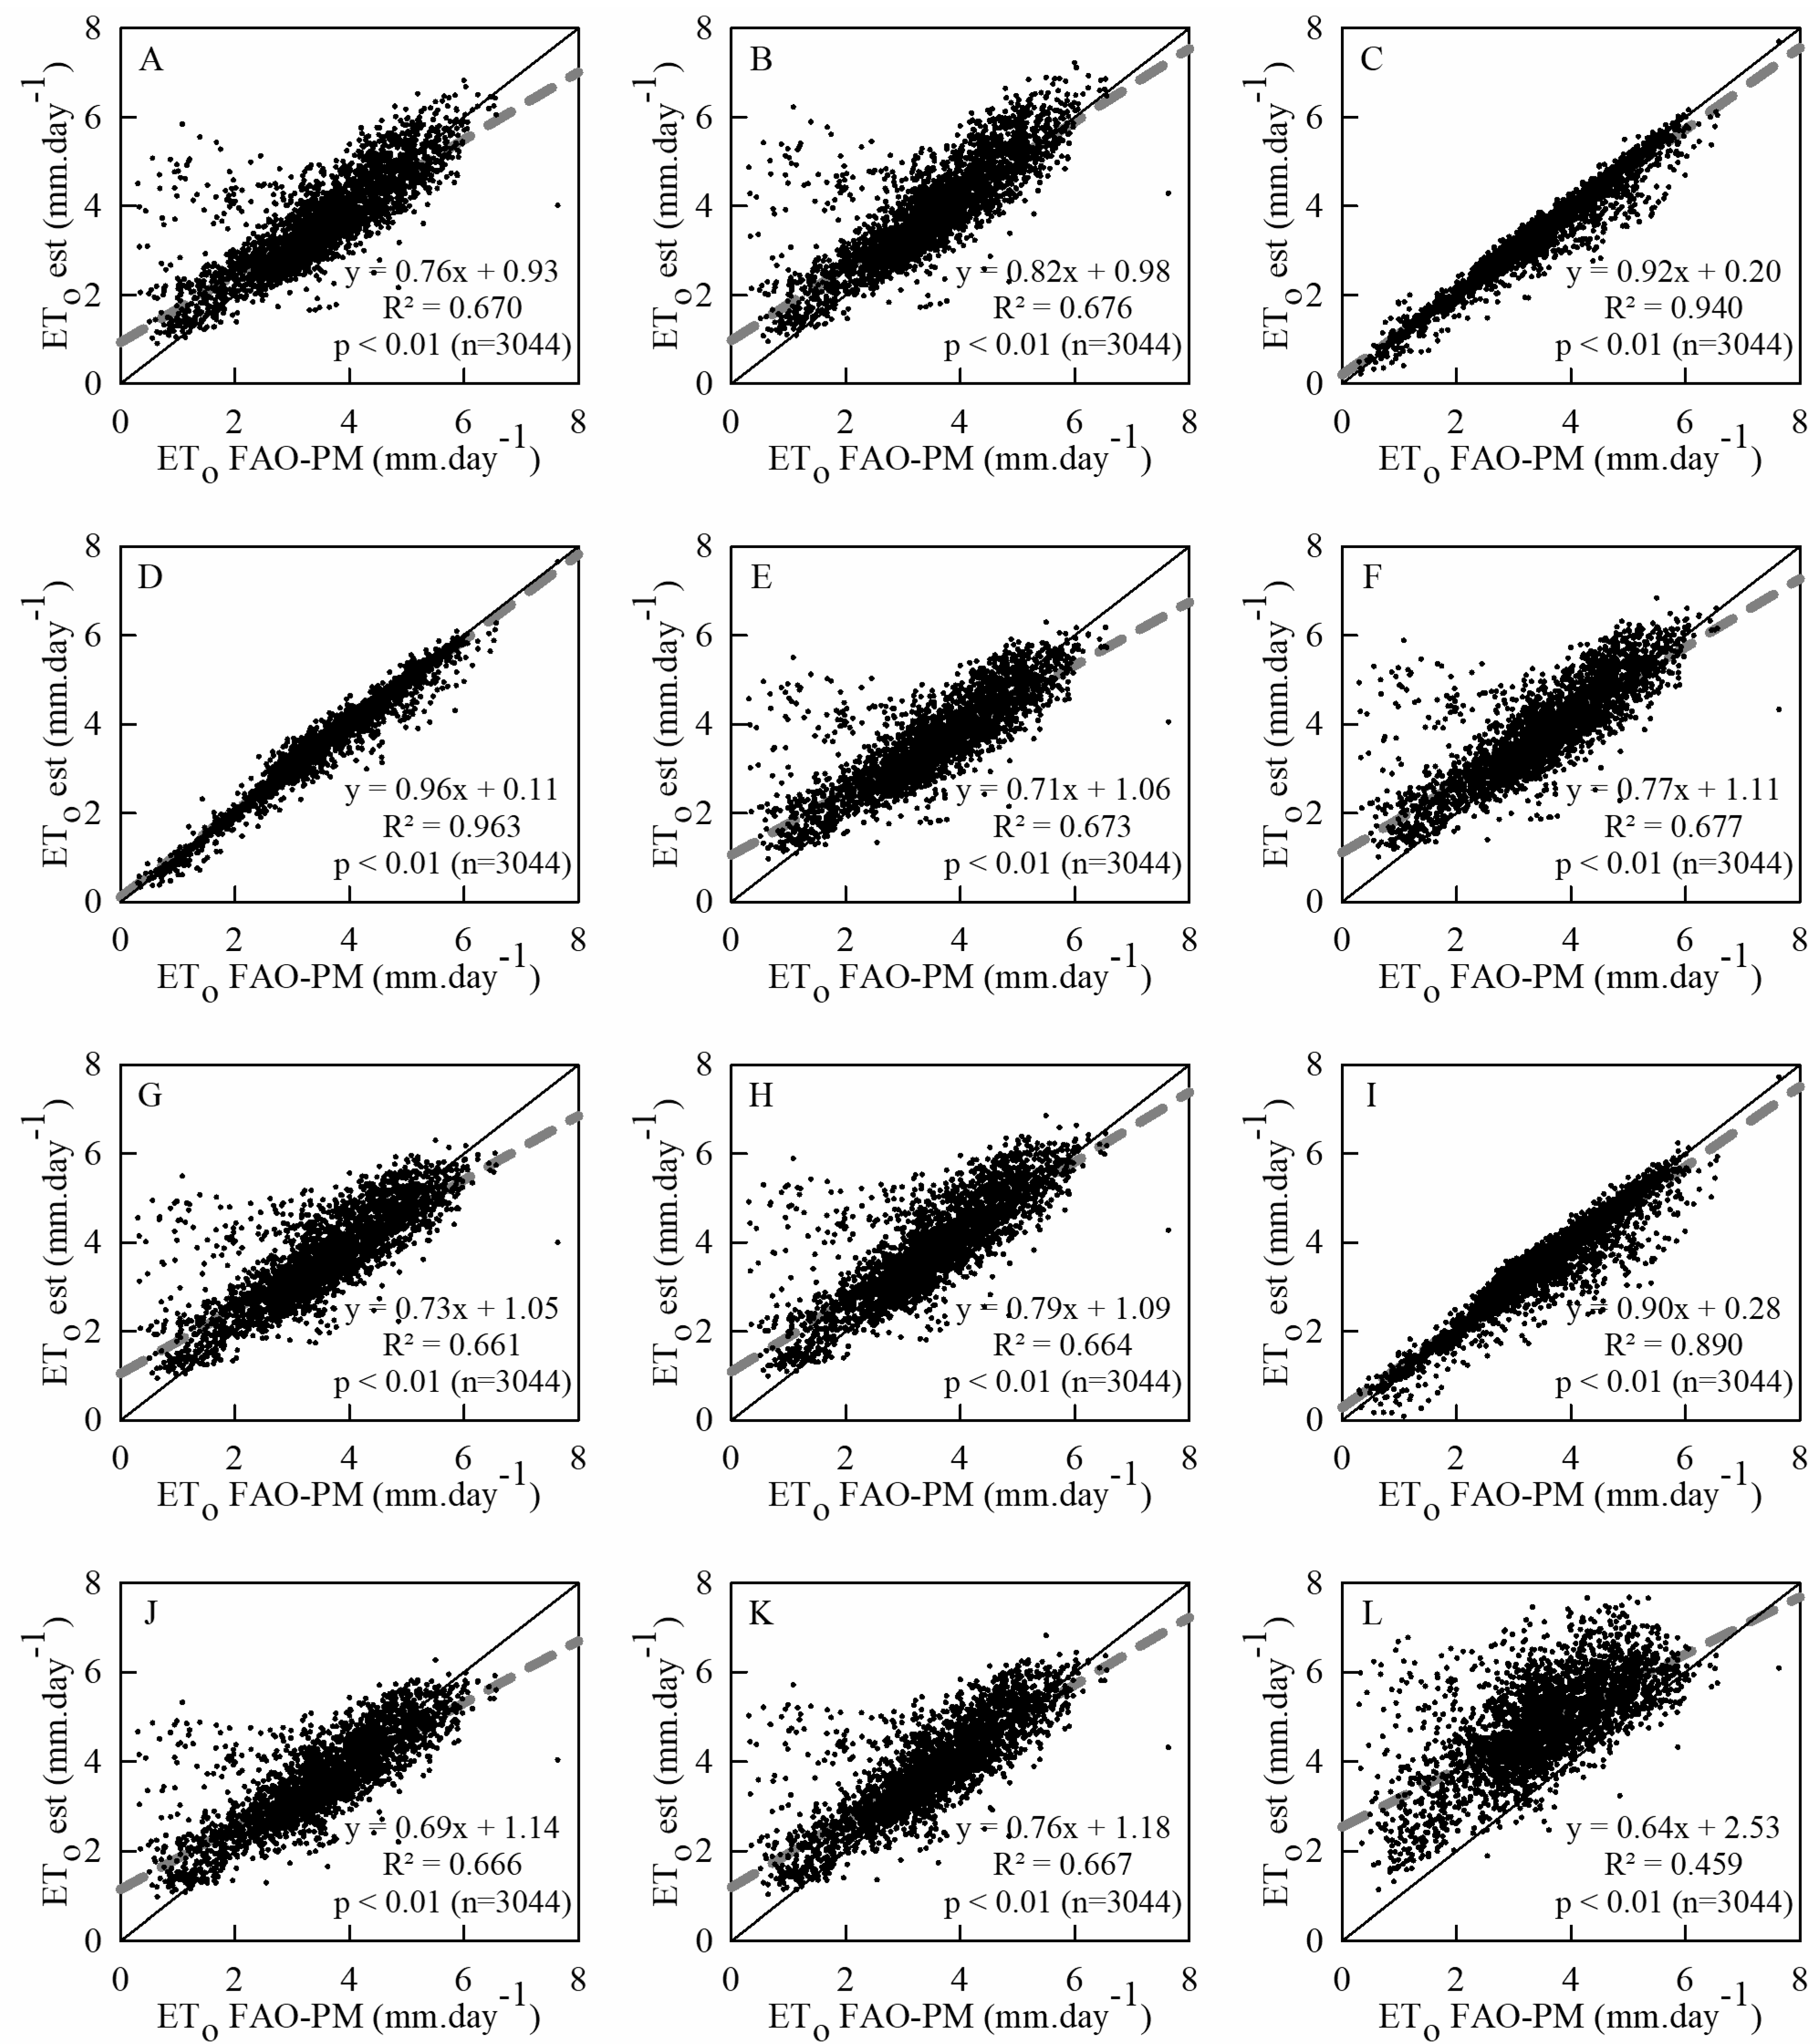
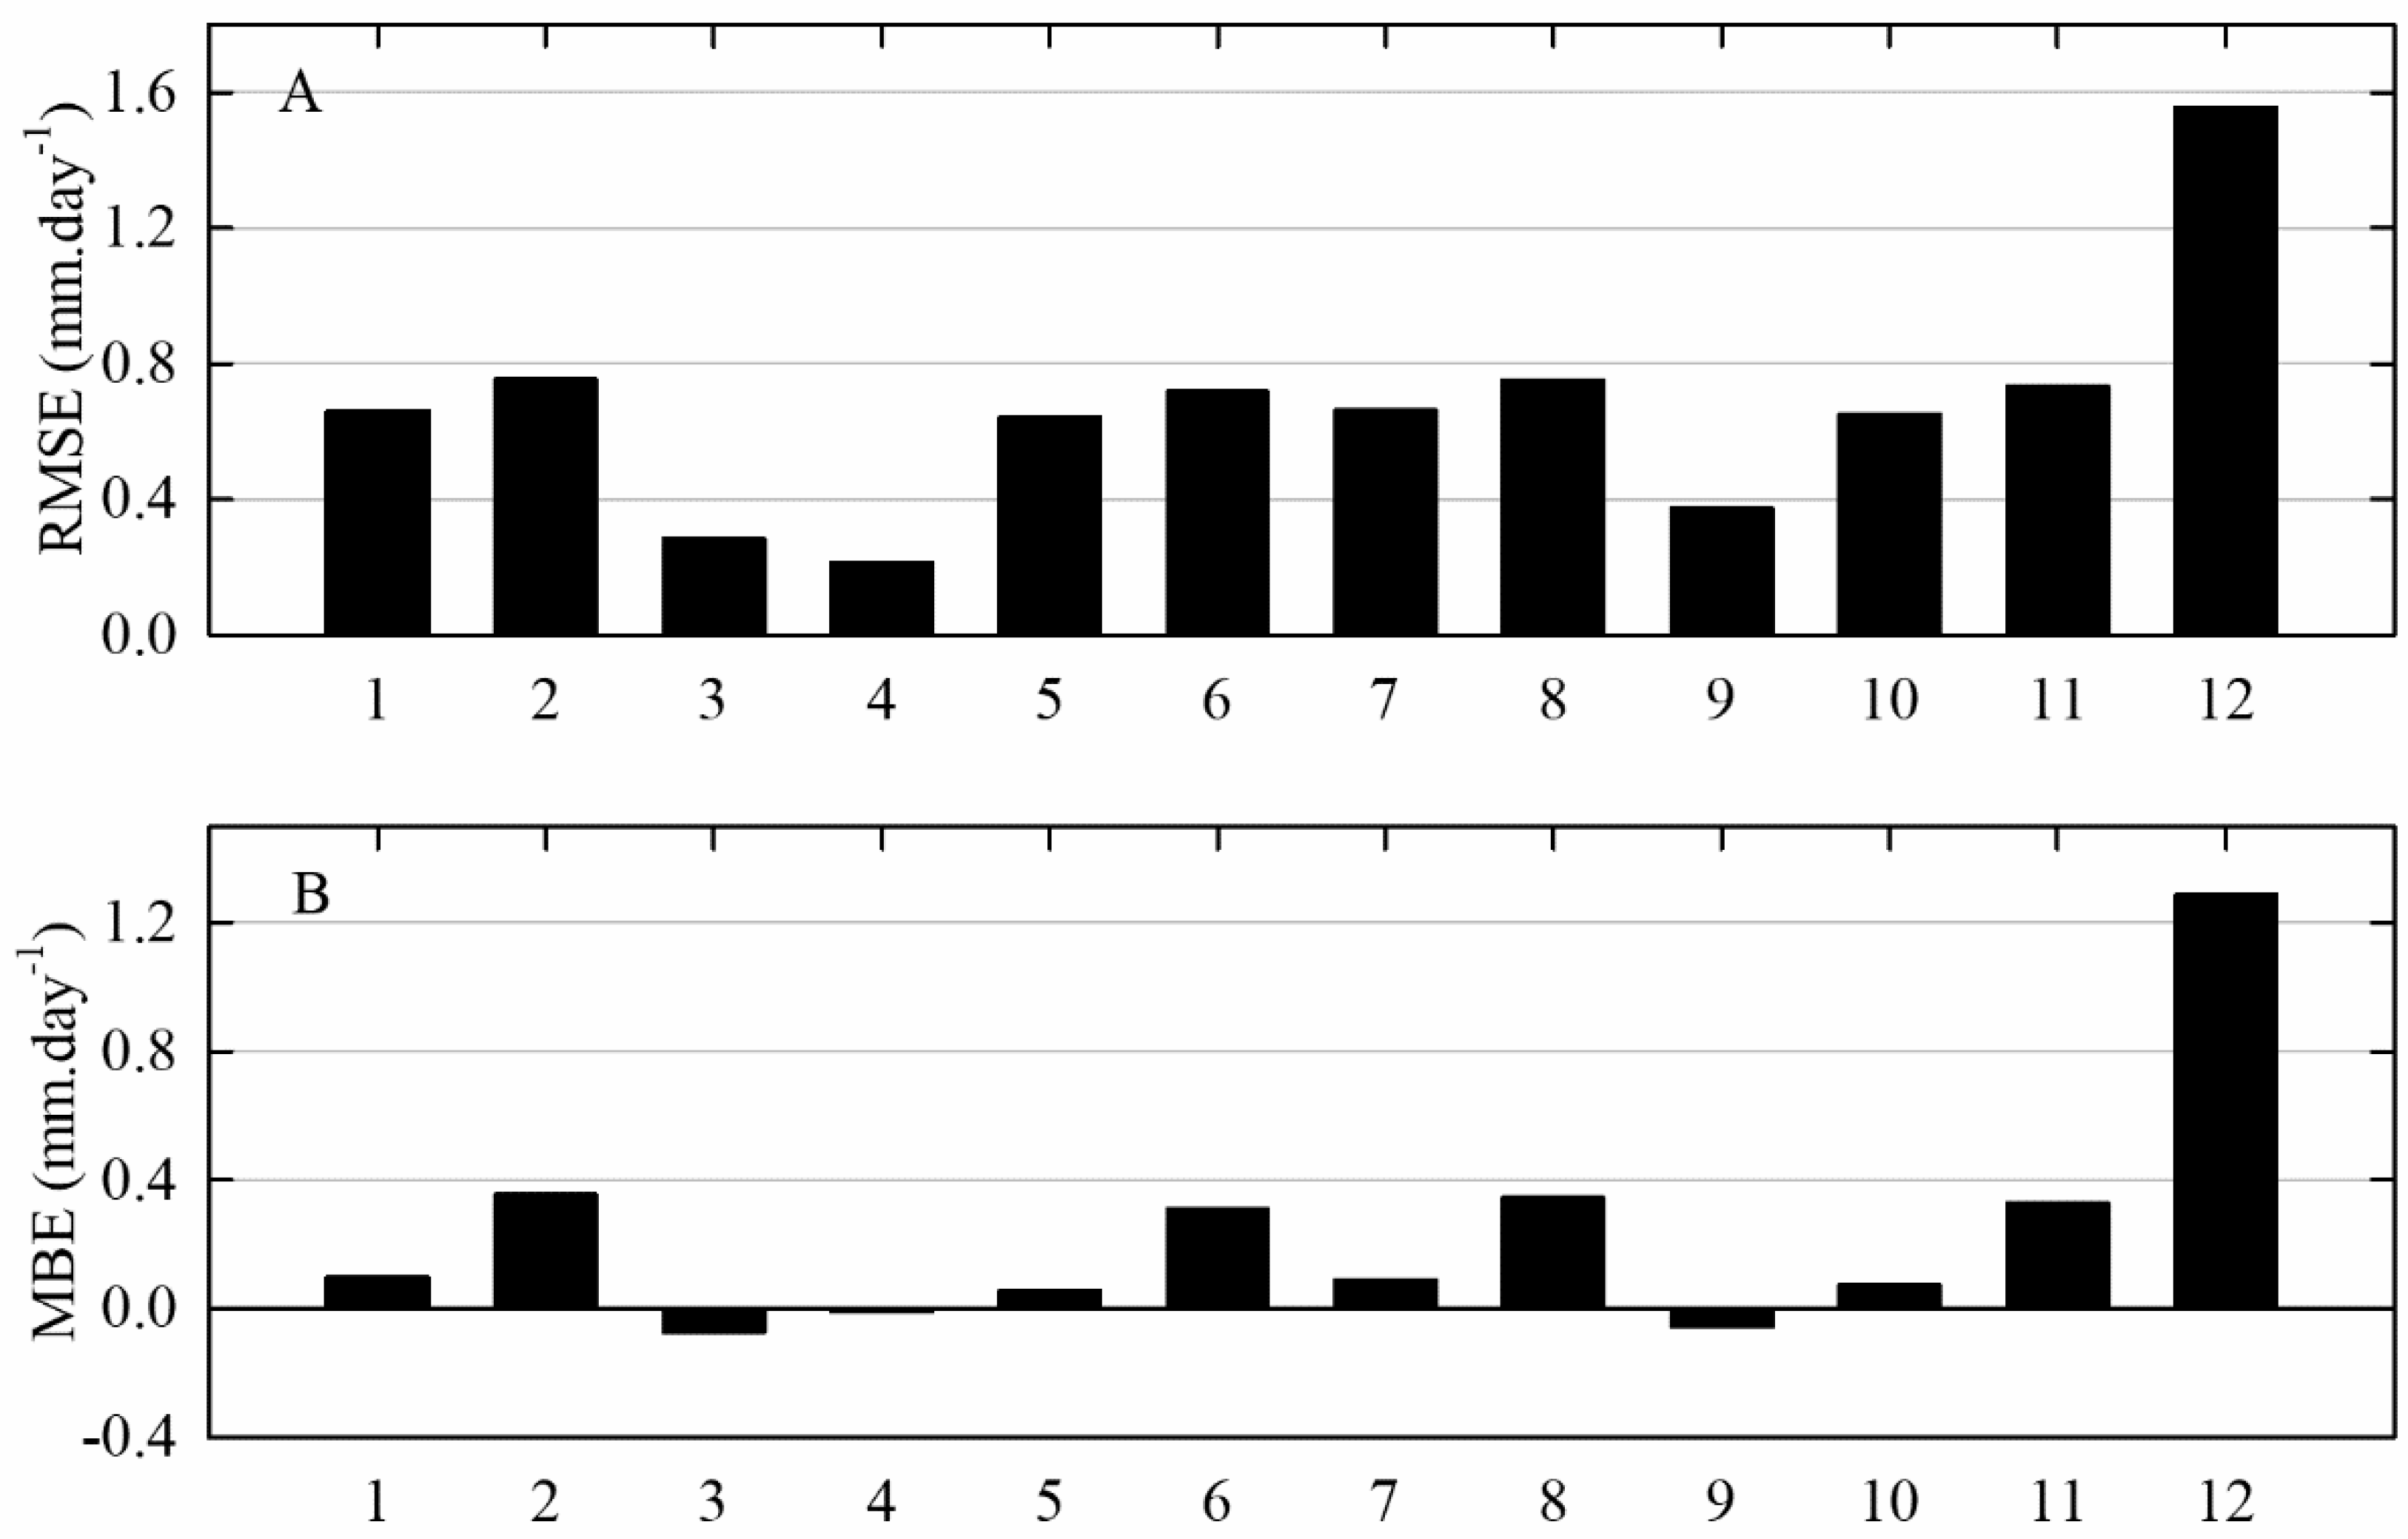
For ETo values computed using limited meteorological data (Figure 4), the value for Willmott’s d ranged between 0.64 and 0.99, r between 0.68 and 0.98, RMSE between 0.21 and 1.56, and absolute MBE values ranged from 0.01 to 1.29 mm.day−1, respectively (Table 2, Figure 5).
The methods with relative humidity and/or wind speed as missing data (Figure 4C,D,I) showed better performance than the other methods, with high r and Willmott’s d values that were close to 1.0 (Table 2), which indicate a perfect positive linear correlation and model performance. When using only average annual wind speed as estimated data, we obtained the lowest RMSE and the closest to zero MBE, with values of 0.21 and −0.01 mm.day−1, respectively. When relative humidity was the only missing climatic data, we obtained RMSE and MBE values of 0.28 and −0.07 mm.day−1, respectively. ETo estimates calculated when both relative humidity and wind speed data were missing had low RMSE and MBE values of 0.37 and −0.06 mm.day−1, which indicate that the estimations of ETo using observed Rs, ea computed from Tmin, and u2 from average values performed very well.
These findings were expected for missing humidity data since under humid conditions there is a high probability of Tdew = Tmin [17]. Several locations presented similar results with ea estimated from minimum temperature [37,38,59]. Sentelhas et al. [60] reported R2 values from 0.76 to 0.96 when comparing ETo computed with actual vapor pressure to that computed from Tmin. This method may not be suitable to estimate ETo in humid climates since there are overestimations in VPD values [17,61].
Allen et al. [17] also suggest using a wind speed value of 2 m.s−1 when wind speed data are not available; however, 93% of data from measurements showed wind speed values below 2 m.s−1. Since wind speed for the Cerrado’s conditions does not vary greatly throughout the year, it is possible to use a constant value of wind speed for estimating ETo. Sun et al. [62] found similar results regarding the impact of wind speed on ETo in a mountainous region in China. Similar results were found by Popova et al. [38] and Córdova et al. [61], with the RMSE and MBE values near 0 when u2 = 2 m.s−1. Djaman et al. [59] presented unsuitable FAO-PM performances in dry conditions when wind speed was considered as 2 m.s−1; however, using daily average wind speed in the same conditions, the results presented MBE values between −0.05 to 0.04.
Our results indicate that wind speed and relative humidity and their variations throughout the year have a small effect on ETo estimates in the Cerrado region studied here. Investments in accurate air temperature sensors instead of investments in relative humidity probes would be a good option to estimate RH when the budget is limited. Moreover, use a constant value of u2 is also viable to estimate ETo.
The methods without observed radiation data (Figure 4A,B,E–H,J,K) showed the lowest values of r, i.e., the model results do not indicate a good linear correlation with reference data, when comparing ETo using FAO-PM method. However, when the benchmark values are close to the average ETo value, those results with estimated radiation were similar to ETo with full data. In addition, ETo computed with estimates of Rs showed higher RMSE and MBE values than ETo computed when only wind speed and/or relative humidity were the missing variables. ETo calculated using radiation data computed with calibrated parameters were closer to the benchmark values than ETo calculated with Rs estimates using regression constants recommended by Allen et al. [17].
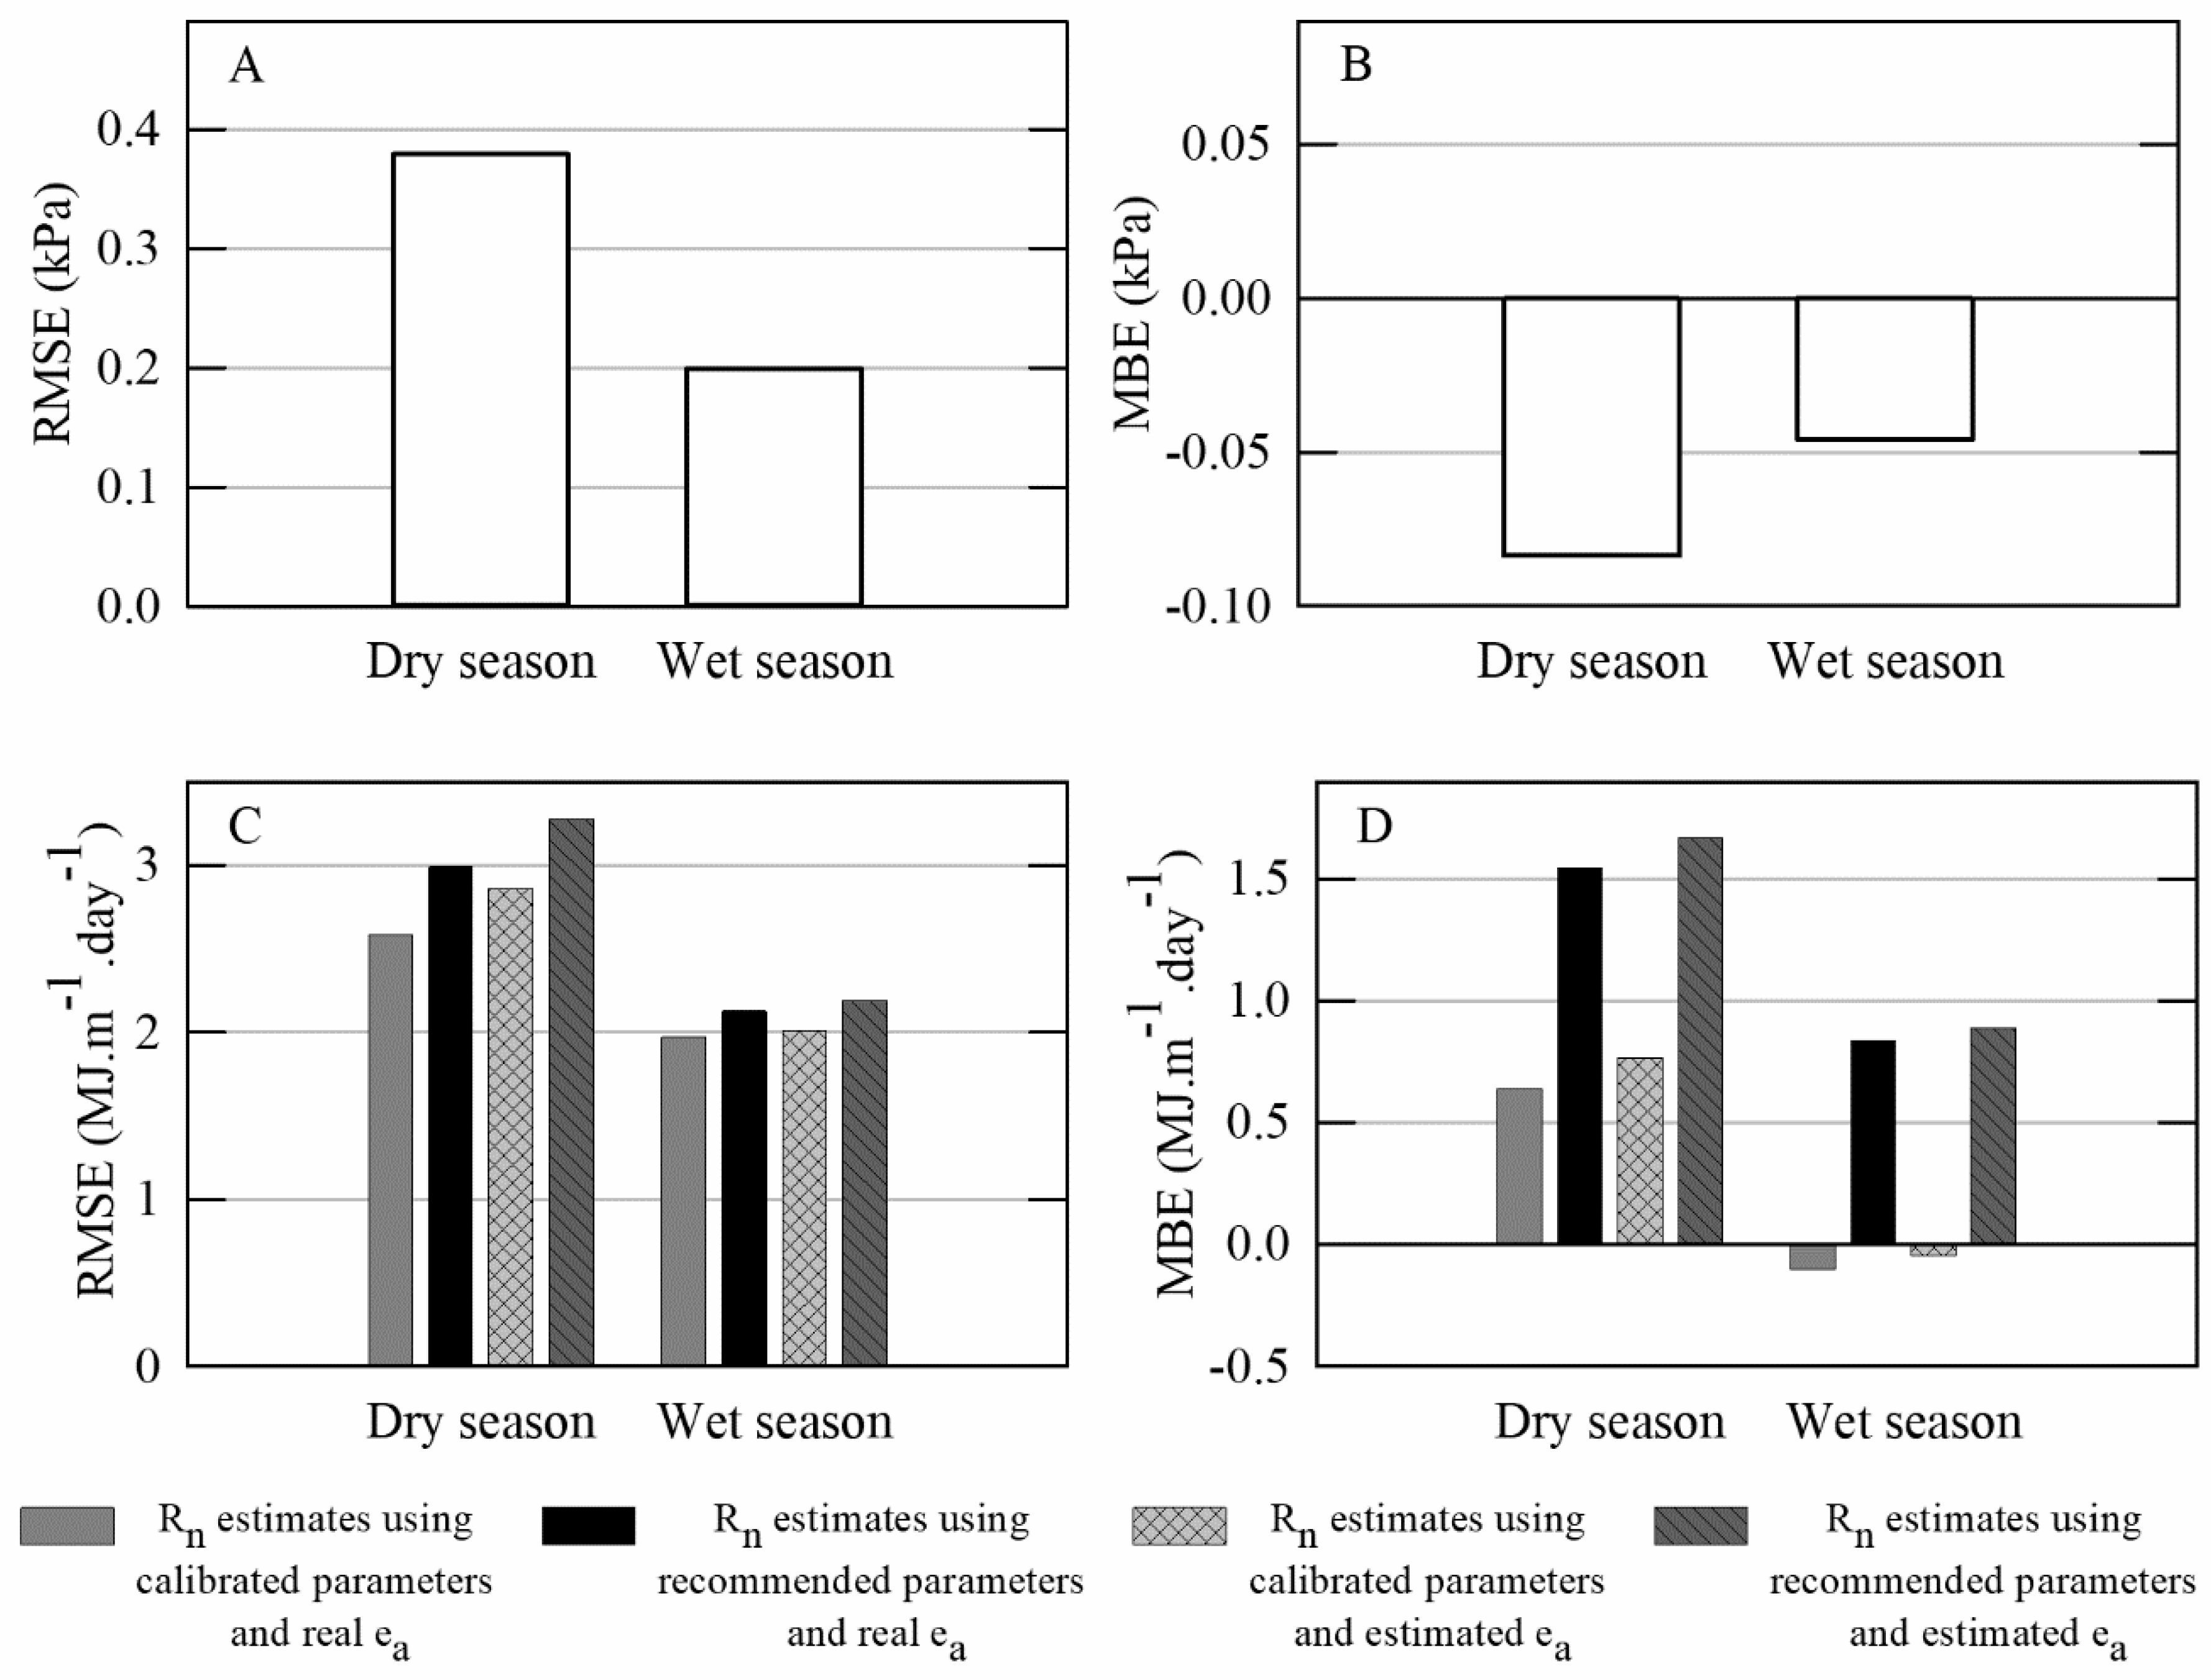
When radiation values were missing, the resulting estimates of ETo consistently overestimated ETo when the benchmark values were low. Since the Penman–Monteith model (Equation (1)) uses RnG as the radiation data input and Allen et al. [17] suggests G ≈ 0 on a daily basis when there are no G measurements, we compared Rn estimates from Equation (12) with observed RnG values. Similarly, we compared estimates of ea calculated when humidity data were lacking (Equation (3)) to measure ea. Figure 6 presents the linear regression results, while Figure 7 shows RMSE and MBE values for the linear regressions of Figure 6 classified by seasons.
Rn estimates were always >0 and overestimated net radiation values during the dry season when negative RnG was observed (Figure 6A–D). Rn using the calibrated parameters presented lower absolute RMSE and MBE values, especially during the wet season (Figure 7A,B) when RH had smaller daily variation (Figure 2C) and errors in estimating ea were the lowest. ETo computed when radiation data was missing did not consider G, which was high in this Cerrado grassland; therefore, the suggestion by Allen et al. [17] to consider daily G ≈ 0 is not suitable for our study area.
Our estimates of ETo when Rs was missing were less accurate than those calculated with estimated wind speed and/or relative humidity, especially during the dry season when Rn values are above the average. Different studies [63,64,65] observed good results for Rs estimates using Equation (3); however, there is a lack of studies about solar radiation estimates in the Brazilian Cerrado. Other authors reported better performance of ETo calculated with estimated Rs [36,37,38,61,66,67,68] than observed here, and ETo highly correlated with solar radiation in several different locations [25,27,69,70]. More research is needed to find a better model for estimating Rs and Rn.
The daily ETo values computed from the Hargreaves–Samani model (Figure 4L) showed the worst correlation with the reference values. The RMSE and MBE values were 1.56 and 1.29 mm.day−1. Thus, while the Hargreaves–Samani equation was found to provide adequate estimates of ETo in a variety of climates, especially arid ones [39,40,41,71], it does not appear to be adequate for estimating ETo in the Cerrado. There are many different models to estimate ETo; however, the FAO does not recommend any equation other than the Penman–Monteith and Hargreaves–Samani models.
However, the quality control of the dataset utilized for ETo computation with the FAO-PM or the HS equation is vital for the precision of estimates. Therefore, quality control of site and weather datasets is certainly needed, as it is essential to the appraisal of the quality of satellite-based and reanalysis datasets when applied to compute FAO-PM. Future studies along this line are needed. The data-driven model in this vital agricultural region can also be used for estimating ETo in future studies. The outcome obtained from our study can be seasonal-climate sensitive. This also deserves further examination. The main implication of this study is that the availability of precise models and datasets for quantifying ETo is significant for agricultural managers and irrigation engineers in a region with a similar climatic condition. In addition, it is important to explore different solar and net radiation models, since the guidelines provided by the FAO are not suitable for similar climatic conditions as our study area. Although investigating those alternatives is out of scope in the present study, they deserve further examination.

4. Conclusions

The overarching goal of our study was to evaluate the Penman–Monteith method’s performance in a grass-dominated part of the Cerrado when climatic data are limited. We used ETo computed with a full data set of micrometeorological measurements as the reference data and tested the Penman–Monteith method when data for radiation, wind speed, and relative air humidity were missing.
We found better results for ETo calculated with estimated relative humidity and wind speed. Using average annual wind speed showed excellent results, with an almost perfect linear correlation and the lowest errors. The use of Tdew = Tmin proved to be a great alternative to estimate ETo when RH data are missing, especially during the wet season.
ETo computed with solar radiation estimates performed worse than estimates when the other variables are missing. Rn estimates could not compute negative values and G ≈ 0 may not be appropriate for the campo sujo Cerrado conditions. ETo estimates were not suitable when solar radiation data were missing. The Hargreaves–Samani method consistently overestimated ETo and did not perform well compared to the other methods.
The results presented here can help us better understand which meteorological data have the largest impact on ETo estimates of regions with similar climate and vegetation characteristics. Since the Cerrado is the main agricultural region in Brazil, our results could lead to new studies regarding algorithms and alternatives to estimate solar and net radiation in similar weather conditions. Improvements and investments in solar radiation measurements would provide more adequate ETo estimates and a better understanding of crop water demands.

Author Contributions

L.C.G.d.V.J. and T.R.R. analyzed the data and wrote the paper. L.F.A.C., R.d.S.P., J.d.S.N., and F.d.A.L. provided the data and interpreted the results. G.L.V. and A.R.M.T.I. reviewed the paper. All co-authors contributed significantly to this paper. All authors have read and agreed to the published version of the manuscript.

Funding

This research was supported by the Conselho Nacional de Desenvolvimento Científico e Tecnológico (CNPq) through the Bolsa de Produtividade em Pesquisa-PQ (grant number 308844/2018-1) and by the Coordenação de Aperfeiçoamento de Pessoal de Nível Superior (CAPES) with Ph.D. scholarships.

Institutional Review Board Statement

Not applicable.

Informed Consent Statement

Not applicable.

Data Availability Statement

Data will be available upon request from the corresponding author.

Acknowledgments

This research was supported by the Universidade Federal de Mato Grosso do Sul (UFMS), the Programa de Pós-Graduação em Tecnologias Ambientais (PPGTA), the Conselho Nacional de Desenvolvimento Científico e Tecnológico (CNPq) through the Bolsa de Produtividade em Pesquisa-PQ (Grant Number 308844/2018-1), and the Coordenação de Aperfeiçoamento de Pessoal de Nível Superior (CAPES) with Ph.D. scholarships. We thank Instituto Nacional de Meteorologia (INMET) for providing data and maintaining the Padre Ricardo Remetter meteorological station. We also acknowledge Programa Pós-Graduação de Física Ambiental (PPGFA) and the Universidade Federal de Mato Grosso (UFMT) for providing data, and their professors for data collection. The authors are grateful to Clovis Miranda and his family for allowing this study to be developed at the Fazenda Miranda.

Conflicts of Interest

The authors declare that they have no known competing financial interests or personal relationships that could have appeared to influence the work reported in this paper.

References

  1. Giambelluca, T.W.; Scholz, F.G.; Bucci, S.J.; Meinzer, F.C.; Goldstein, G.; Hoffmann, W.A.; Franco, A.C.; Buchert, M.P. Evapotranspiration and energy balance of Brazilian savannas with contrasting tree density. Agric. For. Meteorol. 2009, 149, 1365–1376. [Google Scholar] [CrossRef]
  2. Nóbrega, R.L.B.; Guzha, A.C.; Lamparter, G.; Amorim, R.S.S.; Couto, E.G.; Hughes, H.J.; Jungkunst, H.F.; Gerold, G. Impacts of land-use and land-cover change on stream hydrochemistry in the Cerrado and Amazon biomes. Sci. Total Environ. 2018, 635, 259–274. [Google Scholar] [CrossRef] [PubMed]
  3. Oliveira, P.T.S.; Nearing, M.A.; Moran, M.S.; Goodrich, D.C.; Wendland, E.; Gupta, H.V. Trends in water balance components across the Brazilian Cerrado. Water Resour. Res. 2014, 50, 7100–7114. [Google Scholar] [CrossRef] [Green Version]
  4. Rodrigues, T.R.; Vourlitis, G.L.; Lobo, F.D.A.; de Oliveira, R.G.; Nogueira, J.D.S. Seasonal variation in energy balance and canopy conductance for a tropical savanna ecosystem of south central Mato Grosso, Brazil. J. Geophys. Res. Biogeosci. 2014, 119, 1–13. [Google Scholar] [CrossRef]
  5. Silva, J.B.; Gaio, D.C.; Curado, L.F.A.; Nogueira, J.D.S.; Valle Júnior, L.C.G.; Rodrigues, T.R. Evaluation of methods for estimating atmospheric emissivity in Mato-Grossense Cerrado. Ambient. Agua Interdiscip. J. Appl. Sci. 2019, 14, 1. [Google Scholar] [CrossRef]
  6. Valle Júnior, L.C.G.; Ventura, T.M.; Gomes, R.S.R.; de Nogueira, J.S.; de Lobo, F.A.; Vourlitis, G.L.; Rodrigues, T.R. Comparative assessment of modelled and empirical reference evapotranspiration methods for a brazilian savanna. Agric. Water Manag. 2020, 232, 106040. [Google Scholar] [CrossRef]
  7. Doorenbos, J.; Pruitt, W.O. Guidelines for Predicting Crop Water Requirements; FAO Irrigation and Drainage Paper no.24; FAO: Rome, Italy, 1977; ISBN 92-5-100279-7. [Google Scholar]
  8. Allen, R.G. Assessing Integrity of Weather Data for Reference Evapotranspiration Estimation. J. Irrig. Drain. Eng. 1996, 122, 97–106. [Google Scholar] [CrossRef]
  9. Dong, Q.; Wang, W.; Shao, Q.; Xing, W.; Ding, Y.; Fu, J. The response of reference evapotranspiration to climate change in Xinjiang, China: Historical changes, driving forces, and future projections. Int. J. Climatol. 2020, 40, 235–254. [Google Scholar] [CrossRef]
  10. Droogers, P.; Allen, R.G. Estimating reference evapotranspiration under inaccurate data conditions. Irrig. Drain. Syst. 2002, 16, 33–45. [Google Scholar] [CrossRef]
  11. Hargreaves, G.H. Defining and Using Reference Evapotranspiration. J. Irrig. Drain. Eng. 1994, 120, 1132–1139. [Google Scholar] [CrossRef]
  12. She, D.; Xia, J.; Zhang, Y. Changes in reference evapotranspiration and its driving factors in the middle reaches of Yellow River Basin, China. Sci. Total Environ. 2017, 607–608, 1151–1162. [Google Scholar] [CrossRef]
  13. Tyagi, N.; Sharma, D.; Luthra, S. Determination of evapotranspiration and crop coefficients of rice and sunflower with lysimeter. Agric. Water Manag. 2000, 45, 41–54. [Google Scholar] [CrossRef]
  14. Allen, R.G.; Smith, M.; Pereira, L.S.; Perrier, A. An Update for the Calculation of Reference Evapotranspiration. ICID Bull. 1994, 43, 35–92. [Google Scholar]
  15. Martins, D.S.; Paredes, P.; Raziei, T.; Pires, C.; Cadima, J.; Pereira, L.S. Assessing reference evapotranspiration estimation from reanalysis weather products. An application to the Iberian Peninsula. Int. J. Climatol. 2017, 37, 2378–2397. [Google Scholar] [CrossRef]
  16. Sharifi, A.; Dinpashoh, Y. Sensitivity Analysis of the Penman-Monteith reference Crop Evapotranspiration to Climatic Variables in Iran. Water Resour. Manag. 2014, 28, 5465–5476. [Google Scholar] [CrossRef]
  17. Allen, R.G.; Pereira, L.S.; Raes, D.; Smith, M. Crop Evapotranspiration: Guidelines for Computing Crop Water Requirements; FAO Irrigation and Drainage Paper no. 56; FAO: Rome, Italy, 1998; ISBN 92-5-104219-5. [Google Scholar]
  18. Xu, C.; Gong, L.; Jiang, T.; Chen, D.; Singh, V.P. Analysis of spatial distribution and temporal trend of reference evapotranspiration and pan evaporation in Changjiang (Yangtze River) catchment. J. Hydrol. 2006, 327, 81–93. [Google Scholar] [CrossRef]
  19. Almorox, J.; Grieser, J. Calibration of the Hargreaves-Samani method for the calculation of reference evapotranspiration in different Köppen climate classes. Hydrol. Res. 2016, 47, 521–531. [Google Scholar] [CrossRef] [Green Version]
  20. Srivastava, A.; Sahoo, B.; Raghuwanshi, N.S.; Singh, R. Evaluation of Variable-Infiltration Capacity Model and MODIS-Terra Satellite-Derived Grid-Scale Evapotranspiration Estimates in a River Basin with Tropical Monsoon-Type Climatology. J. Irrig. Drain. Eng. 2017, 143, 04017028. [Google Scholar] [CrossRef] [Green Version]
  21. Blaney, H.F.; Criddle, W.D. Determining Water Requirements in Irrigated Areas from Climatological and Irrigation Data; United States Department of Agriculture: Washington, DC, USA, 1950. [Google Scholar]
  22. Hargreaves, G.H.; Samani, Z.A. Reference Crop Evapotranspiration from Temperature. Appl. Eng. Agric. 1985, 1, 96–99. [Google Scholar] [CrossRef]
  23. Jensen, M.E.; Haise, H.R. Estimating evapotranspiration from solar radiation. J. Irrig. Drain. 1963, 4, 15–41. [Google Scholar] [CrossRef]
  24. Priestley, C.H.B.; Taylor, R.J. On the Assessment of Surface Heat Flux and Evaporation Using Large-Scale Parameters. Mon. Weather Rev. 1972, 100, 81–92. [Google Scholar] [CrossRef]
  25. Bourletsikas, A.; Argyrokastritis, I.; Proutsos, N. Comparative evaluation of 24 reference evapotranspiration equations applied on an evergreen-broadleaved forest. Hydrol. Res. 2017, nh2017232. [Google Scholar] [CrossRef]
  26. Shafieiyoun, E.; Gheysari, M.; Khiadani, M.; Koupai, J.A.; Shojaei, P.; Moomkesh, M. Assessment of reference evapotranspiration across an arid urban environment having poor data monitoring system. Hydrol. Process. 2020, 34, 4000–4016. [Google Scholar] [CrossRef]
  27. Shiri, J. Modeling reference evapotranspiration in island environments: Assessing the practical implications. J. Hydrol. 2019, 570, 265–280. [Google Scholar] [CrossRef]
  28. Tabari, H.; Grismer, M.E.; Trajkovic, S. Comparative analysis of 31 reference evapotranspiration methods under humid conditions. Irrig. Sci. 2013, 31, 107–117. [Google Scholar] [CrossRef]
  29. Zhang, Q.; Cui, N.; Feng, Y.; Gong, D.; Hu, X. Improvement of Makkink model for reference evapotranspiration estimation using temperature data in Northwest China. J. Hydrol. 2018, 566, 264–273. [Google Scholar] [CrossRef]
  30. Dinpashoh, Y.; Jhajharia, D.; Fakheri-Fard, A.; Singh, V.P.; Kahya, E. Trends in reference crop evapotranspiration over Iran. J. Hydrol. 2011, 399, 422–433. [Google Scholar] [CrossRef]
  31. Gong, L.; Xu, C.; Chen, D.; Halldin, S.; Chen, Y.D. Sensitivity of the Penman–Monteith reference evapotranspiration to key climatic variables in the Changjiang (Yangtze River) basin. J. Hydrol. 2006, 329, 620–629. [Google Scholar] [CrossRef]
  32. Srivastava, A.; Sahoo, B.; Raghuwanshi, N.S.; Chatterjee, C. Modelling the dynamics of evapotranspiration using Variable Infiltration Capacity model and regionally calibrated Hargreaves approach. Irrig. Sci. 2018, 36, 289–300. [Google Scholar] [CrossRef]
  33. Kumari, N.; Srivastava, A. An Approach for Estimation of Evapotranspiration by Standardizing Parsimonious Method. Agric. Res. 2020, 9, 301–309. [Google Scholar] [CrossRef]
  34. Oudin, L.; Hervieu, F.; Michel, C.; Perrin, C.; Andréassian, V.; Anctil, F.; Loumagne, C. Which potential evapotranspiration input for a lumped rainfall-runoff model? Part 2—Towards a simple and efficient potential evapotranspiration model for rainfall-runoff modelling. J. Hydrol. 2005, 303, 290–306. [Google Scholar] [CrossRef]
  35. Čadro, S.; Uzunović, M.; Žurovec, J.; Žurovec, O. Validation and calibration of various reference evapotranspiration alternative methods under the climate conditions of Bosnia and Herzegovina. Int. Soil Water Conserv. Res. 2017, 5, 309–324. [Google Scholar] [CrossRef]
  36. Djaman, K.; Irmak, S.; Asce, M.; Futakuchi, K. Daily Reference Evapotranspiration Estimation under Limited Data in Eastern Africa. J. Irrig. Drain. Eng. 2016, 1–13. [Google Scholar] [CrossRef]
  37. Jabloun, M.; Sahli, A. Evaluation of FAO-56 methodology for estimating reference evapotranspiration using limited climatic data. Application to Tunisia. Agric. Water Manag. 2008, 95, 707–715. [Google Scholar] [CrossRef]
  38. Popova, Z.; Kercheva, M.; Pereira, L.S. Validation of the FAO methodology for computing ETo with limited data. Application to south Bulgaria. Irrig. Drain. 2006, 55, 201–215. [Google Scholar] [CrossRef]
  39. Raziei, T.; Pereira, L.S. Spatial variability analysis of reference evapotranspiration in Iran utilizing fine resolution gridded datasets. Agric. Water Manag. 2013, 126, 104–118. [Google Scholar] [CrossRef] [Green Version]
  40. Raziei, T.; Pereira, L.S. Estimation of ETo with Hargreaves–Samani and FAO-PM temperature methods for a wide range of climates in Iran. Agric. Water Manag. 2013, 121, 1–18. [Google Scholar] [CrossRef]
  41. Todorovic, M.; Karic, B.; Pereira, L.S. Reference evapotranspiration estimate with limited weather data across a range of Mediterranean climates. J. Hydrol. 2013, 481, 166–176. [Google Scholar] [CrossRef] [Green Version]
  42. Ferreira, L.B.; da Cunha, F.F.; de Oliveira, R.A.; Fernandes Filho, E.I. Estimation of reference evapotranspiration in Brazil with limited meteorological data using ANN and SVM—A new approach. J. Hydrol. 2019, 572, 556–570. [Google Scholar] [CrossRef]
  43. Karimi, S.; Kisi, O.; Kim, S.; Nazemi, A.H.; Shiri, J. Modelling daily reference evapotranspiration in humid locations of South Korea using local and cross-station data management scenarios. Int. J. Climatol. 2017, 37, 3238–3246. [Google Scholar] [CrossRef]
  44. Mattar, M.A. Using gene expression programming in monthly reference evapotranspiration modeling: A case study in Egypt. Agric. Water Manag. 2018, 198, 28–38. [Google Scholar] [CrossRef]
  45. Mehdizadeh, S.; Behmanesh, J.; Khalili, K. Using MARS, SVM, GEP and empirical equations for estimation of monthly mean reference evapotranspiration. Comput. Electron. Agric. 2017, 139, 103–114. [Google Scholar] [CrossRef]
  46. Salam, R.; Islam, A.R.M.T. Potential of RT, bagging and RS ensemble learning algorithms for reference evapotranspiration prediction using climatic data-limited humid region in Bangladesh. J. Hydrol. 2020, 590, 125241. [Google Scholar] [CrossRef]
  47. Kisi, O. Pan evaporation modeling using least square support vector machine, multivariate adaptive regression splines and M5 model tree. J. Hydrol. 2015, 528, 312–320. [Google Scholar] [CrossRef]
  48. Wang, L.; Kisi, O.; Hu, B.; Bilal, M.; Zounemat-Kermani, M.; Li, H. Evaporation modelling using different machine learning techniques. Int. J. Climatol. 2017, 37, 1076–1092. [Google Scholar] [CrossRef]
  49. Wang, L.; Kisi, O.; Zounemat-Kermani, M.; Li, H. Pan evaporation modeling using six different heuristic computing methods in different climates of China. J. Hydrol. 2017, 544, 407–427. [Google Scholar] [CrossRef]
  50. Rodrigues, T.R.; Vourlitis, G.L.; de Lobo, F.A.; Santanna, F.B.; de Arruda, P.H.Z.; de Nogueira, J.S. Modeling canopy conductance under contrasting seasonal conditions for a tropical savanna ecosystem of south central Mato Grosso, Brazil. Agric. For. Meteorol. 2016, 218, 218–219–229. [Google Scholar] [CrossRef] [Green Version]
  51. Alvares, C.A.; Stape, J.L.; Sentelhas, P.C.; de Moraes Gonçalves, J.L.; Sparovek, G. Köppen’s climate classification map for Brazil. Meteorol. Z. 2013, 22, 711–728. [Google Scholar] [CrossRef]
  52. Vourlitis, G.L.; da Rocha, H.R. Flux Dynamics in the Cerrado and Cerrado—Forest Transition of Brazil. In Ecosystem Function in Global Savannas: Measurement and Modeling at Landscape to Global Scales; Hill, M.J., Hanan, N.P., Eds.; CRC, Inc.: Boca Raton, FL, USA, 2011; pp. 97–116. [Google Scholar]
  53. Willmott, C.J. Some Comments on the Evaluation of Model Performance. Bull. Am. Meteorol. Soc. 1982, 63, 1309–1313. [Google Scholar] [CrossRef] [Green Version]
  54. Hutyra, L.R.; Munger, J.W.; Nobre, C.A.; Saleska, S.R.; Vieira, S.A.; Wofsy, S.C. Climatic variability and vegetation vulnerability in Amazônia. Geophys. Res. Lett. 2005, 32, L24712. [Google Scholar] [CrossRef] [Green Version]
  55. Rodrigues, T.R.; Curado, L.F.A.; Pereira, V.M.R.; Sanches, L.; Nogueira, J.S. Hourly interaction between wind speed and energy fluxes in Brazilian wetlands—Mato Grosso—Brazil. An. Acad. Bras. Cienc. 2016, 88, 2195–2209. [Google Scholar] [CrossRef] [PubMed] [Green Version]
  56. Grace, J.; Malhi, Y.; Lloyd, J.; McIntyre, J.; Miranda, A.C.; Meir, P.; Miranda, H.S. The use of eddy covariance to infer the net carbon dioxide uptake of Brazilian rain forest. Glob. Chang. Biol. 1996, 2, 209–217. [Google Scholar] [CrossRef]
  57. Machado, L.A.T.; Laurent, H.; Dessay, N.; Miranda, I. Seasonal and diurnal variability of convection over the Amazonia: A comparison of different vegetation types and large scale forcing. Theor. Appl. Climatol. 2004, 78, 61–77. [Google Scholar] [CrossRef]
  58. Rodrigues, T.R.; de Paulo, S.R.; Novais, J.W.Z.; Curado, L.F.; Nogueira, J.S.; de Oliveira, R.G.; Lobo, F.D.; Vourlitis, G.L. Temporal Patterns of Energy Balance for a Brazilian Tropical Savanna under Contrasting Seasonal Conditions. Int. J. Atmos. Sci. 2013, 2013, 1–9. [Google Scholar] [CrossRef] [Green Version]
  59. Djaman, K.; Irmak, S.; Kabenge, I.; Futakuchi, K. Evaluation of FAO-56 Penman-Monteith Model with Limited Data and the Valiantzas Models for Estimating Grass-Reference Evapotranspiration in Sahelian Conditions. J. Irrig. Drain. Eng. 2016, 142, 04016044. [Google Scholar] [CrossRef]
  60. Sentelhas, P.C.; Gillespie, T.J.; Santos, E.A. Evaluation of FAO Penman–Monteith and alternative methods for estimating reference evapotranspiration with missing data in Southern Ontario, Canada. Agric. Water Manag. 2010, 97, 635–644. [Google Scholar] [CrossRef]
  61. Córdova, M.; Carrillo-Rojas, G.; Crespo, P.; Wilcox, B.; Célleri, R. Evaluation of the Penman-Monteith (FAO 56 PM) Method for Calculating Reference Evapotranspiration Using Limited Data. Mt. Res. Dev. 2015, 35, 230–239. [Google Scholar] [CrossRef] [Green Version]
  62. Sun, J.; Wang, G.; Sun, X.; Lin, S.; Hu, Z.; Huang, K. Elevation-dependent changes in reference evapotranspiration due to climate change. Hydrol. Process. 2020, 34, 5580–5594. [Google Scholar] [CrossRef]
  63. Aladenola, O.O.; Madramootoo, C.A. Evaluation of solar radiation estimation methods for reference evapotranspiration estimation in Canada. Theor. Appl. Climatol. 2014, 118, 377–385. [Google Scholar] [CrossRef]
  64. Jahani, B.; Dinpashoh, Y.; Raisi Nafchi, A. Evaluation and development of empirical models for estimating daily solar radiation. Renew. Sustain. Energy Rev. 2017, 73, 878–891. [Google Scholar] [CrossRef]
  65. Trnka, M.; Žalud, Z.; Eitzinger, J.; Dubrovský, M. Global solar radiation in Central European lowlands estimated by various empirical formulae. Agric. For. Meteorol. 2005, 131, 54–76. [Google Scholar] [CrossRef]
  66. Cai, J.; Liu, Y.; Lei, T.; Pereira, L.S. Estimating reference evapotranspiration with the FAO Penman–Monteith equation using daily weather forecast messages. Agric. For. Meteorol. 2007, 145, 22–35. [Google Scholar] [CrossRef]
  67. Paredes, P.; Martins, D.S.; Pereira, L.S.; Cadima, J.; Pires, C. Accuracy of daily estimation of grass reference evapotranspiration using ERA-Interim reanalysis products with assessment of alternative bias correction schemes. Agric. Water Manag. 2018, 210, 340–353. [Google Scholar] [CrossRef]
  68. Salam, R.; Islam, A.R.M.T.; Pham, Q.B.; Dehghani, M.; Al-Ansari, N.; Linh, N.T.T. The optimal alternative for quantifying reference evapotranspiration in climatic sub-regions of Bangladesh. Sci. Rep. 2020, 10, 20171. [Google Scholar] [CrossRef]
  69. de Oliveira, R.G.; Valle Júnior, L.C.G.; da Silva, J.B.; Espíndola, D.A.L.F.; Lopes, R.D.; Nogueira, J.S.; Curado, L.F.A.; Rodrigues, T.R. Temporal trend changes in reference evapotranspiration contrasting different land uses in southern Amazon basin. Agric. Water Manag. 2021, 250, 106815. [Google Scholar] [CrossRef]
  70. Jhajharia, D.; Dinpashoh, Y.; Kahya, E.; Singh, V.P.; Fakheri-Fard, A. Trends in reference evapotranspiration in the humid region of northeast India. Hydrol. Process. 2012, 26, 421–435. [Google Scholar] [CrossRef]
  71. Almorox, J.; Senatore, A.; Quej, V.H.; Mendicino, G. Worldwide assessment of the Penman–Monteith temperature approach for the estimation of monthly reference evapotranspiration. Theor. Appl. Climatol. 2018, 131, 693–703. [Google Scholar] [CrossRef]
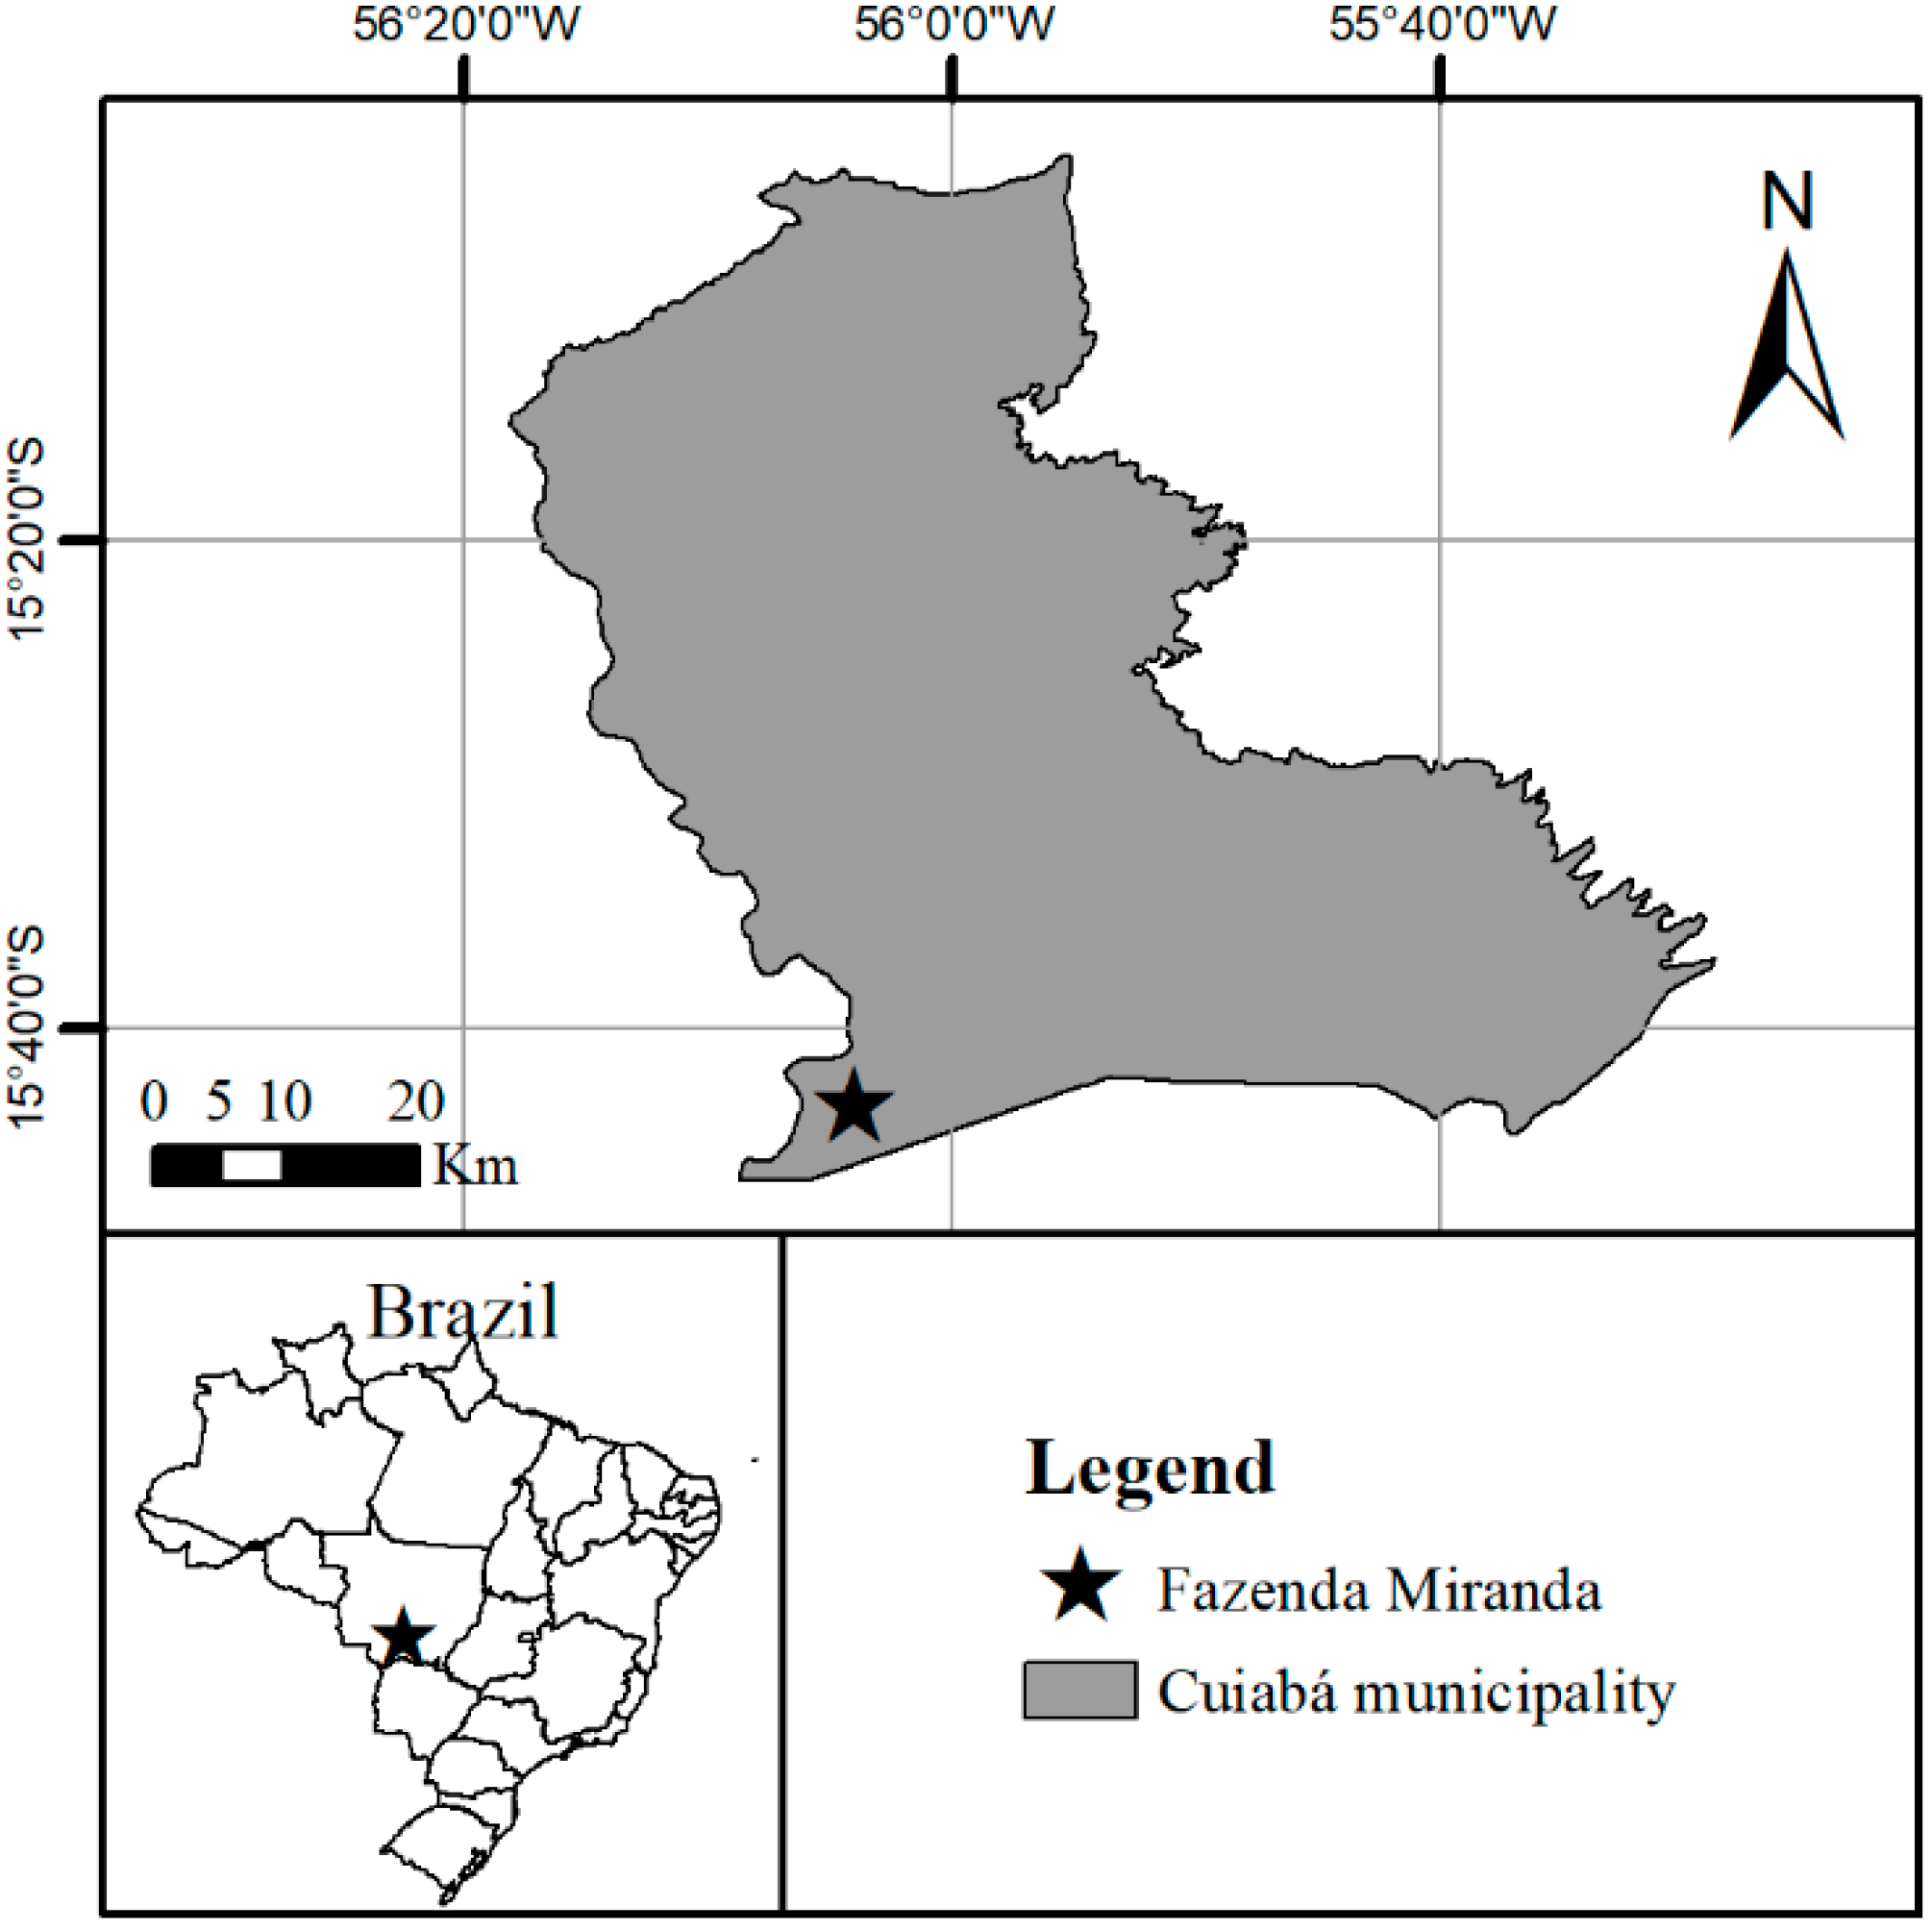
Figure 1. Location of the study site (star) near Cuiabá, Mato Grosso, Brazil.
Water 13 01763 g001
Figure 2. Mean monthly micrometeorological measurements of (A) air temperature (black circles, left-hand axis) and surface soil temperature (white circles, right-hand axis); (B) wind speed at 2 m height (black circles, left-hand axis) and vapor-pressure deficit (white circles, right-hand axis); (C) relative air humidity (black circles, left-hand axis) and surface soil moisture (white circles, right-hand axis); and (D) net radiation (black circles, left-hand axis) and solar radiation (white circles, right-hand axis); (E) soil heat flux; and (F) total monthly precipitation. The whiskers indicate the range within the standard deviation. The shadowed area indicates the dry season.
Water 13 01763 g002
Figure 3. Boxplots showing daily ETo calculations for the Fazenda Miranda site. Each box lies between the second and third quartile, the central line is the median, and the dotted line is the monthly mean. The whiskers indicate the range of data within the minimum and maximum values. The shadowed area indicates the dry season.
Water 13 01763 g003
Figure 4. ETo values estimated using estimates of (A) Rs-a; (B) Rs-b; (C) RH; (D) WS; (E) Rs-a and RH; (F) Rs-b and RH; (G) Rs-a and WS; (H) Rs-b and WS; (I) RH and WS; J) Rs-a, RH, and WS; (K) Rs-b, RH, and WS; and (L) HS, in comparison with ETo estimated with full data set (ETo FAO-PM). The central line represents a 1:1 correlation, and the dashed line represents the linear regression through the origin.
Water 13 01763 g004
Figure 5. (A) Root mean square error (RMSE) and (B) mean bias error (MBE) of computed ETo using estimates of (1) Rs-a; (2) Rs-b; (3) RH; (4) WS; (5) Rs-a and RH; (6) Rs-b and RH; (7) Rs-a and WS; (8) Rs-b and WS; (9) RH and WS; (10) Rs-a, RH, and WS; (11) Rs-b, RH, and WS; and (12) HS.
Water 13 01763 g005
Figure 6. Linear regressions of (A) Rn estimates using calibrated parameters and real ea; (B) Rn estimates using recommended parameters and real ea; (C) Rn estimates using calibrated parameters and estimated ea; and (D) Rn estimates using recommended parameters and estimated ea, in comparison with real values of Rn − G; and (E) a linear regression of estimated ea versus observed values. The central line represents a 1:1 correlation and the dashed line represents the linear regression through the origin.
Water 13 01763 g006
Figure 7. (A) Root mean square error (RMSE) and (B) mean bias error (MBE) of estimated ea versus real ea; and (C) root mean square error (RMSE) and (D) mean bias error (MBE) of estimated Rn in comparison with measured RnG. The legend of colors and patterns is the same for both graphs (C,D).
Water 13 01763 g007
Table 1. Summary of ETo calculations with missing climatic data.
MethodSymbolCalculation of ETo
FAO-PM, no radiation data (using calibrated parameters to estimate Rs)Rs-aETo (Equation (1)); Rn (Equation (12)); as and bs calibrated
FAO-PM, no radiation data (using recommended parameters to estimate Rs)Rs-bETo (Equation (1)); Rn (Equation (12)), as and bs recommended
FAO-PM, no relative air humidity dataRHETo (Equation (1)); ea (Equation (13))
FAO-PM. no wind speed dataWSETo (Equation (1)); u2 calculated by daily mean wind speed
Hargreaves–SamaniHSETo (Equation (14))
Table 2. Comparison between ETo computed from full data set and estimates of ETo with missing climatic data.
MethoddrRMSE (mm.day−1)MBE (mm.day−1)
Rs-a0.900.820.660.10
Rs-b0.880.820.750.35
RH0.980.970.28−0.07
WS0.990.980.21−0.01
RS-a and RH0.900.820.640.05
RS-b and RH0.890.820.720.31
RS-a and WS0.900.810.660.09
RS-b and WS0.880.820.750.34
RH and WS0.970.940.37−0.06
RS-a, RH, and WS0.900.820.650.07
RS-b, RH, and WS0.880.820.730.33
HS0.640.681.561.29
Publisher’s Note: MDPI stays neutral with regard to jurisdictional claims in published maps and institutional affiliations.