Article

Real-Time Control of the Middle Route of South-to-North Water Diversion Project

1
Changjiang Institute of Survey Planning Design and Research, Wuhan 430010, China
2
Construction and Administration Bureau of South-to-North Water Diversion Middle Route Project, Beijing 100038, China
*
Author to whom correspondence should be addressed.
Water 2021, 13(1), 97; https://doi.org/10.3390/w13010097
Submission received: 10 December 2020 / Revised: 29 December 2020 / Accepted: 29 December 2020 / Published: 4 January 2021
(This article belongs to the Special Issue Failure Risk Assessment in Water Supply System)

Abstract

:
Scientific and effective operation control of the Middle Route of South-to-North Water Diversion Project (MRP) is crucial to ensure water conveyance safety. As the longest water transfer project in China, its operation is confronted with unprecedented difficulties since it is controlled by a large number of check gates and diversion gates, subject to multiple constraints, and has no online regulation reservoirs. No automatic control models have been successfully put into use yet. This paper firstly introduced an expanded downstream depth operation method, and then scheduled the delivery using the volume balance principle and chartography according to the possible combination of flow change of the check gate, water volume change of the pool and flow change of diversions. Next, an improved real-time control model was established on the basis of PI controller, and the models were integrated into an automatic system for daily operation. Finally, a case study was carried out. Results showed that water level variations could be controlled within the target interval (0.25 m), and users’ demands could be met five times more rapidly. In addition, the total times of check gate operation could be reduced almost two times. The findings could promote the intelligent operation of the MRP.

1. Introduction

Large water diversion projects are used worldwide to deliver water from water-rich areas to water-deficient areas. Reliable automatic operation of the diversion projects is important to ensure safety and improve efficiency of water conveyance [1].
Operation method of the canal system should be identified before automatic control is investigated. The traditional operation methods include constant downstream depth, constant upstream depth, constant volume, and controlled volume method [2], based on the location in the canal pool at which the water depth remains constant (pivot point). For the first three methods, the pivot point is located at the downstream end of the canal pool, the upstream end of the canal pool and near the midpoint of the canal pool, respectively. As for the controlled volume method, the pivot point is not required. The constant downstream depth method is mostly used in long distance canal systems because it could greatly reduce investment and is simple for operators’ use. The constant volume method is used in the Central Arizona Project in U.S.A. to avoid mismatch of flows at the two ends of aqueducts [3,4], but is seldom used for long distance water diversion projects in China for its complexity and requirements for simultaneous operation of all pumps and check gates.
In real-time canal operations, the combination of feedforward and feedback control is recommended for it can reduce water level error propagation [5]. The scheduling of gate adjustments to meet anticipated water demand changes is described as feedforward control, which is open-loop. The gate stroking method was proposed nearly five decades ago for canal routing [6] but has not been put into use since it is difficult to get a reasonable solution and sometimes there is no solution at all. The impracticality promotes the volume-compensation method, which schedules each demand change individually under the assumption of a series of steady states and superimposes the individual results for multiple-pool canal systems [7]. In this method, the check gate at the upstream end of the pool should firstly give a larger inflow change to increase or decrease the pool volume, and then change back to match the outflow. The key to this method is the response time of a canal pool, which has been extensively studied [8,9,10]. The volume compensation method performs satisfactorily under ideal flow control conditions but is less effective and does not show much superiority when subjected to realistic constraints on the gate movements and incorrect canal hydraulic roughness information. Several improved approaches have been put forward. For instance, the sequential quadratic problem (SQP) method is adopted to solve the nonlinear optimization problem with constraints considered [11]. Additional adjustments to all check structures are attempted to shorten the stabilization time and accelerate flow routing [12].
The correction of the pre-determined process with actual monitoring data during operation is referred as feedback control, which is closed loop. Quite a few algorithms have been brought forward and tested on the American Society of Civil Engineers (ASCE) test canals, such as the EL-FLO algorithm [13], the Proportion Integration (PI) or Proportion Integration Differentiation (PID) algorithm [14,15,16,17,18,19], model predictive control (MPC), and linear quadratic regulator (LQR) [20,21,22,23,24]. Whereas most of these algorithms can effectively deal with single-pool canals, they are less qualified for long distance multi-pool canals due to the strong and complicated interactions between different pools, unknown disturbances [25], or too long computation time for the whole system [22,23,24].
This paper deals with the real-time control of the Middle Route of South-to-North Water Diversion Project (MRP), the largest water conveyance project in China. It provides living and industrial water as well as agricultural water for 19 large and medium-sized cities including Beijing, Tianjin and over 100 counties and county-level cities in the North China plain, playing an important role in relieving the severe water shortage in North China. In addition, the MRP promotes the sustainable economic and social development of water-receiving areas and protects the local environment [26,27]. The MRP is 1432 kilometers in length, diverting water from the headwork Taocha in Danjiangkou reservoir northward to Beijing and Tianjin along the newly excavated canals, as sketched in Figure 1. The MRP has an average water transfer volume of 9.5 billion cubic meters for the past many years, and the design flow of head gate Taocha is 350 m3/s.
Compared with other large diversion projects in different regions, the operation of the MRP is confronted with unprecedented difficulties: (1) The MRP is consisted of a large number of open channels as well as low-pressurized inverted siphons and is controlled by 63 check gates; thus, the interaction among pools caused by gate regulations would be even more complicated [28]. (2) Since the canal is too long, the delivery delay time for downstream users is much more than users’ expectation. Practices showed that it would take at least 2–3 days for translatory waves initiated by the flow change at the head gate travelling to the reaches after Yellow River. Further, the delay time differs greatly among canal pools since the size and design flow of each pool differ greatly [29]. For instance, the carrying capacity of the end canal pool is less than 15% of that of the first pool. (3) There are 97 diversion gates and 54 recession gates along the canal, so the possible combination of flow changes at the canalside turnouts would be considerable. (4) It has no online regulation reservoirs and should obey many strict constraints, making it extremely difficult to accommodate some desired flow schedules by users. For example, the drawdown rate for normal operation should be limited to 0.15m per hour and 0.30–0.50 m per day to prevent damage to the canal lining.
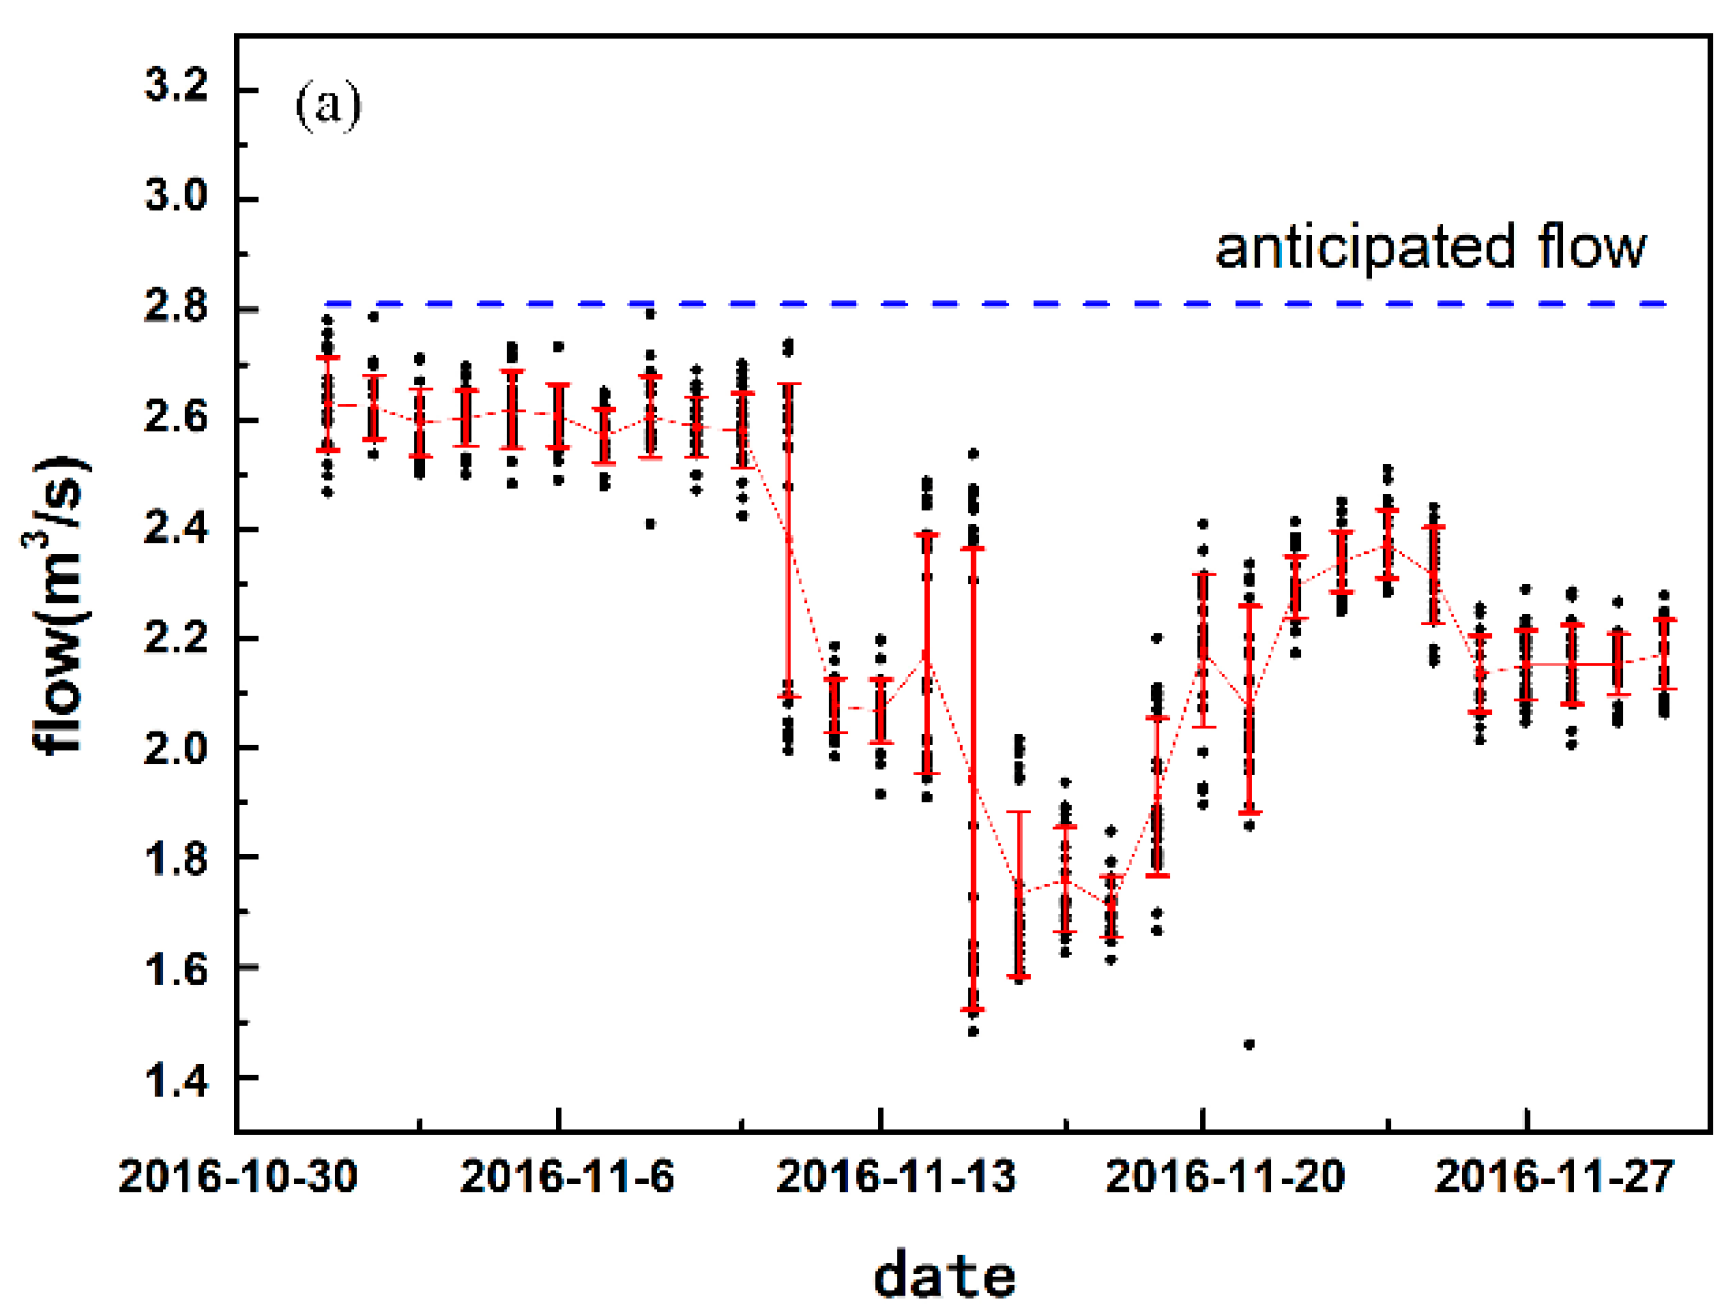
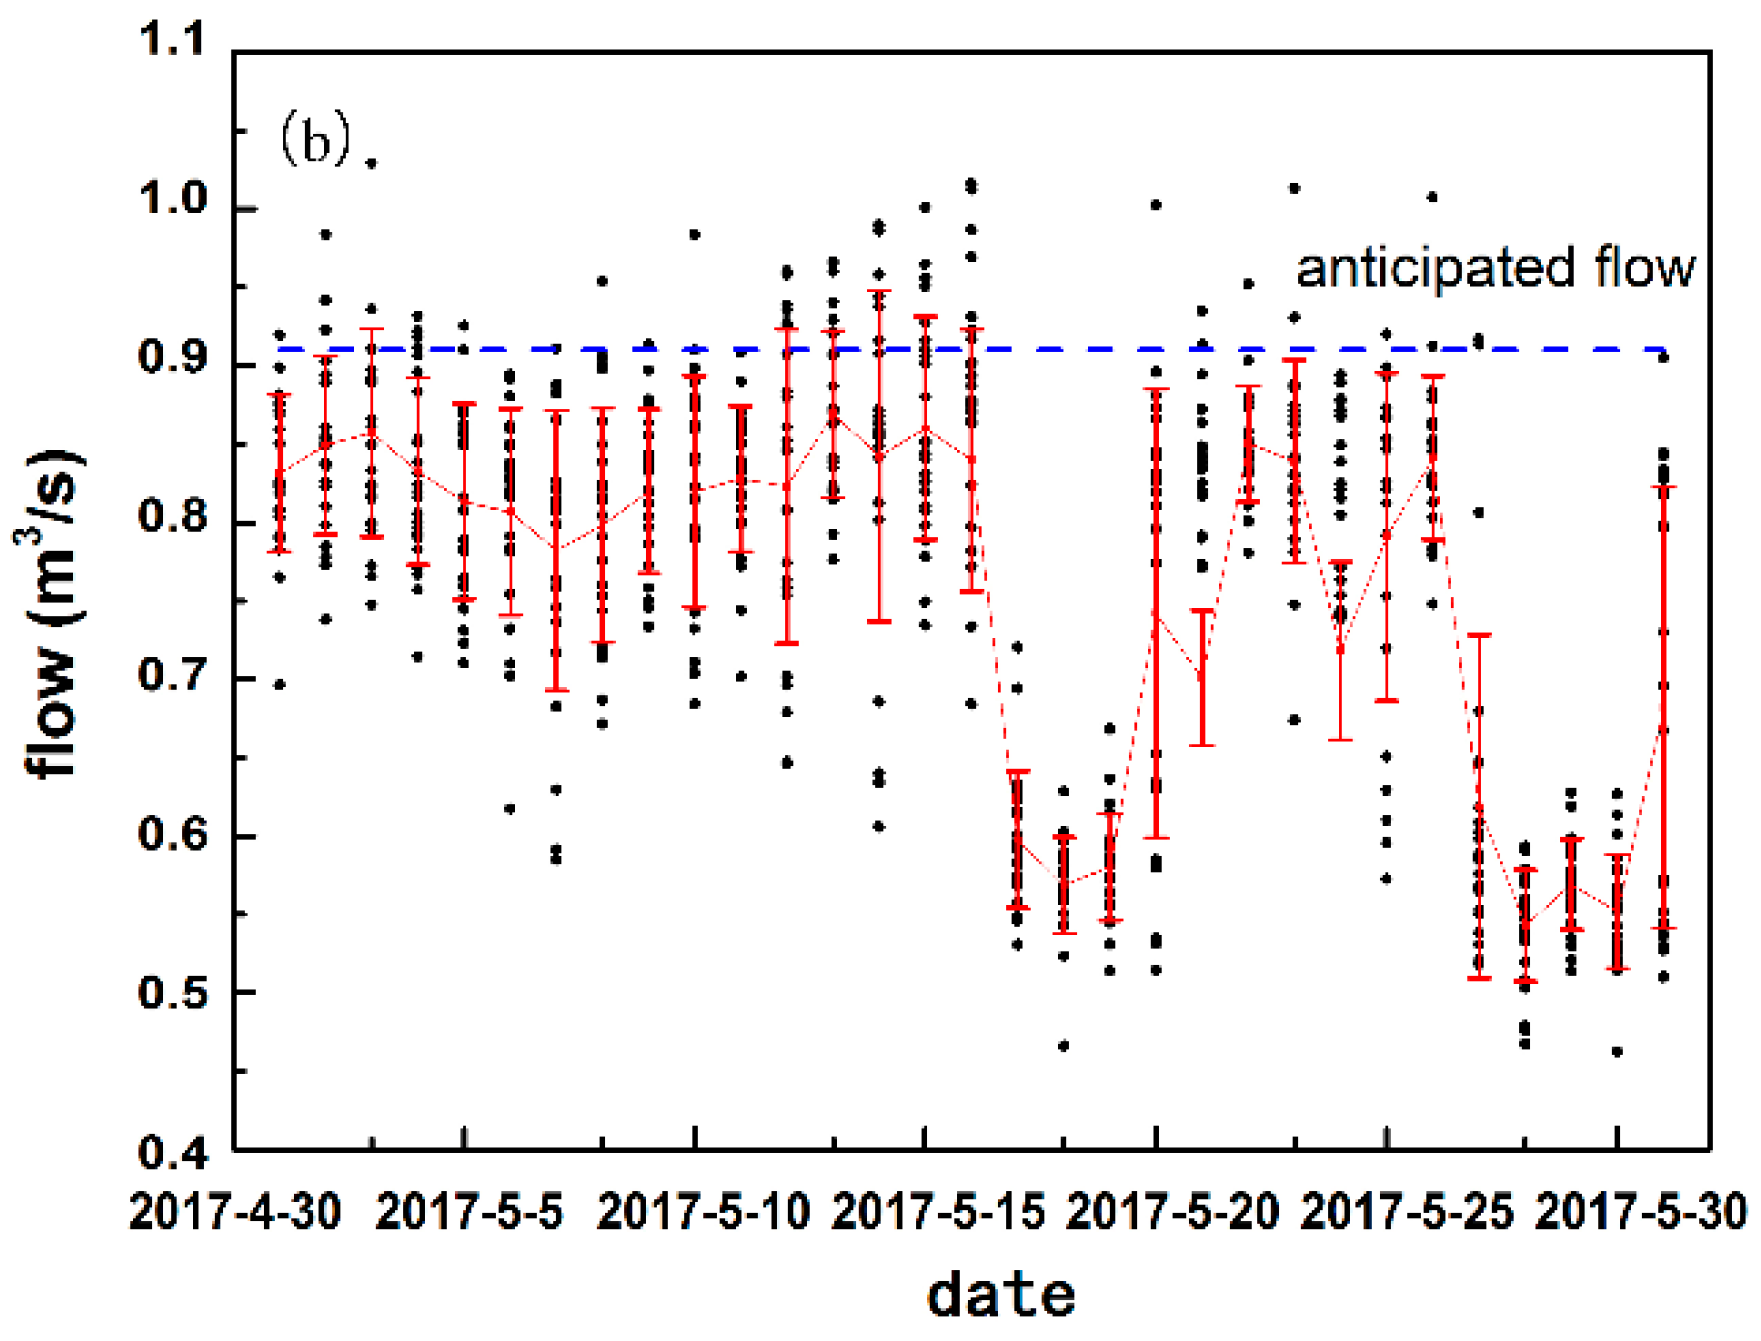
The constant downstream depth method turns out to be unsuitable for the MRP in practice. Check gates should be adjusted typically 3–4 days before the delivery starts [30], so that the inflow change at the upstream end of the pool could overcompensate for the outflow change. However, the MRP tends to become flexible in response to users’ demands. It is also known that changes in demand should be predicted so that the inflow change can be made in advance [31], but some changes in water demand are often unforeseen or known less than one day ahead. In addition, fluctuations of diversion flows are common in the MRP, as shown in Figure 2, in which the dots represent real-time diversion flows (monitored every hour), the fold line represents the average daily diversion flow, and the dashed line represents the anticipated flow made late last month. The periodical flow fluctuations put the canal system always under imbalances between inflow and outflow, so keeping the downstream depth constant may cause frequent or even unnecessary check gate regulation. The constant volume method and controlled volume method allow a reduction of the time delay [4], but they are neither straightforward for operators nor economical for automatic control design, thus they are not appropriate for the MRP. Therefore, it is urgent to develop a simple, efficient, and reliable operation method for the MRP.
As for the control method, the traditional volume-compensation principle for routing is not suitable for the feedforward control of MRP, because the assumption of steady states is almost impossible in realistic operation, and multiple constrained conditions hamper its application. In addition, the response time is quite different for each pool since it depends largely on the flow condition and canal size [8], which differ greatly among pools. The response time needs modification individually, which would cause tremendous work. Moreover, the required two-step adjustment of check gates is against the favorable unidirectional regulation way of the MRP. With respect to feedback control, although many improvements have been made to enhance the model performance under violent and unforeseen flow fluctuations at the turnout points, there have been no reports of successful application of feedback controllers in the MRP so far. Therefore, it is necessary to improve the real-time control strategy and model for the MRP.
In this paper, an improved operation method for the MRP is put forward. Then scheduling of check structures based on different flow and water level changes is presented, and the real-time control strategy and control model are developed for daily automatic operation of the MRP. Finally, a case study is applied to verify the efficiency and reliability of the operation method and model proposed.

2. Methods

2.1. The Expanded Downstream Depth Operation Method

Typically, the main canal of a long distance water diversion project is divided into a series of pools by check gates, which is sketched in Figure 3.
The MRP promotes timely delivery service to users after operation, no matter it is scheduled or temporary. However, it has no online regulation reservoirs and is also subject to strict constraints in terms of water level. To respond to water users’ demands more rapidly and maintain operational stability of the main canal, the expanded downstream depth operation method is proposed herein. The basic foundations of the method are:
  • The water level upstream of the check gate is controlled within an interval instead of a fixed point. The interval is obtained from expanding the target water level upward and downward for certain extent, which is determined by trial calculation to meet the operational requirements of each canal.
  • The target water level is variable according to the demands such as diversion flow changes and routine maintenances, so that the own storage of the main canal can be fully utilized to meet different requests.
  • Check gates are regulated after considering the overall water volume upstream and downstream the pool, instead of simply relying on the volume or water level of local pool mostly used before [28,32,33].
In this way, the adverse influence of daily flow fluctuations and temporal flow adjustments on the canal system stability can be largely reduced. As long as the diversion flow variations are not durative or substantial, the head gate can remain unmoved. For the traditional operation method, check gates are supposed to be regulated frequently to deal with mismatches caused by such diversion flow changes, which may even lead to oscillations.
When the water level upstream of the check gate exceeds the target interval, the gate should be regulated to coordinate the whole water volume upstream and downstream the canal pool, rather than only to maintain the balance of the local pool. For example, if the water level upstream of a certain check gate is high while the water level upstream of the upper check gates is low, the reduction of upper gate openings should be made rather than the increase of the opening of the gate at the downstream end of the local pool.
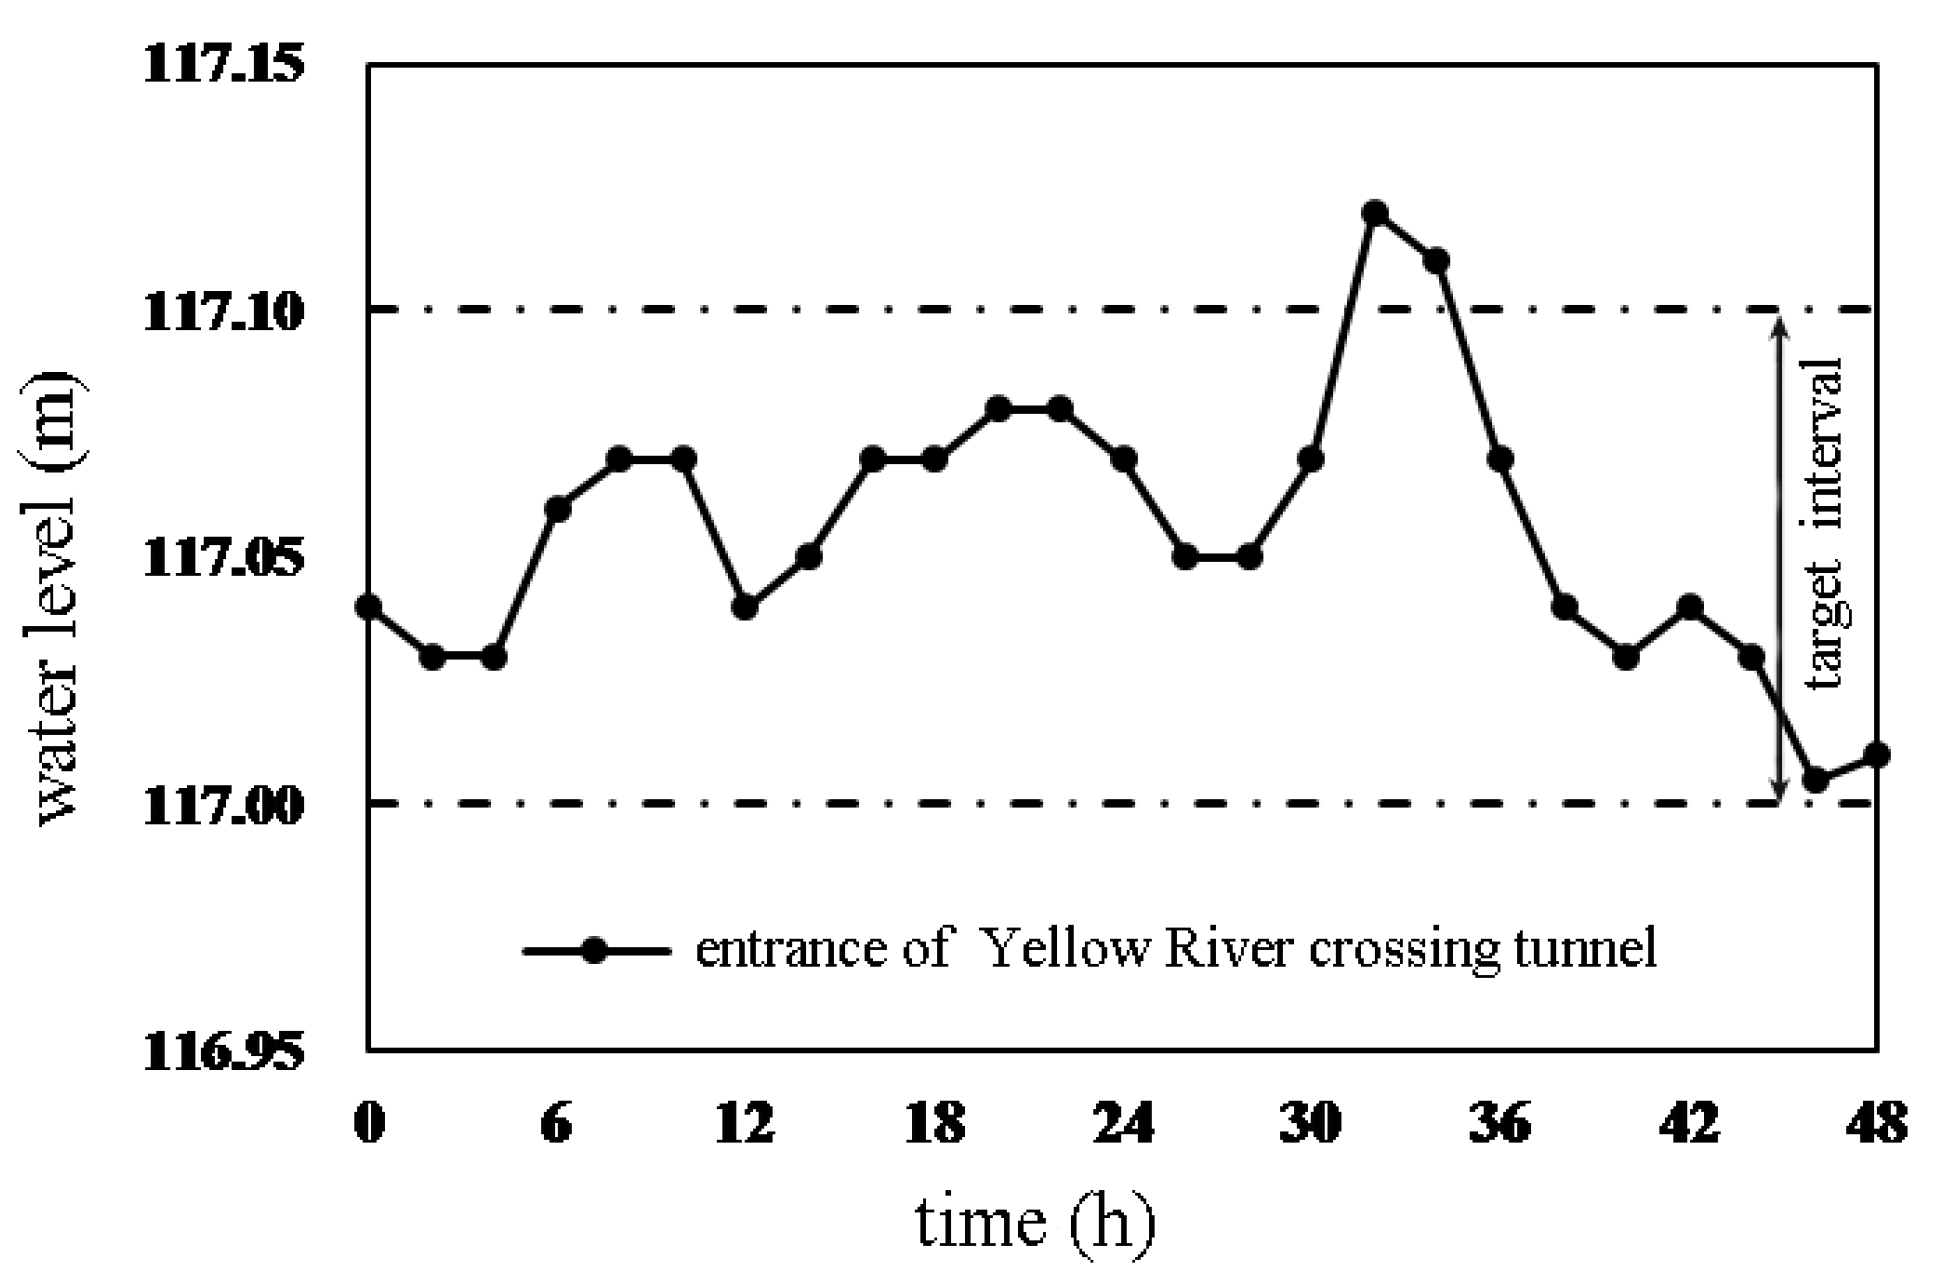
By carrying out analysis of the daily and monthly diversion flow pattern and the unsteady flow simulation, combined with practical experiences, the target water level interval of the main canal of the MRP is determined as follows: (1) The upper limit of the target interval is 0.15 m above the target water level and below the highest allowable limit to prevent overflow. (2) The lower limit of the target interval is 0.10 m below the target water level and beyond the lowest allowable limit, which is set to guarantee the stable turnout delivery, the submergence of the entrance of inverted siphons as well as the stability of canals with high underground water level. (3) The water level in some special canal pools should be controlled more strictly. For example, the water level variation at the entrance of Yellow River crossing water conveyance tunnel should be controlled within 0.10 m for safety, and the water level variation upstream of the end check gate should be controlled within 0.20 m to ensure the stable operation of further pump station Huinanzhuang. It means that the target interval and regulable storage are not the same for individual canal pool.

2.2. Scheduling of Water Delivery

Next, the scheduling of water delivery is discussed, namely the feedforward control. In practice, the initial state of the canal system is known. The target diversion flow is collected by operators from users and the target state of the canal system can be easily calculated by using the one-dimensional hydrodynamic model. As the deduction is made from the upstream to downstream successively, and the flow process of the head gate is given, the key to obtain the scheduling of delivery lies in determining the start and the end time of adjustment of the diversion gate and the check gate at the downstream end of each pool. The relative relationship between the start time of regulation of check gates and that of diversion gates is determined by the delivery method of the project. For the supply-oriented delivery, check gates are firstly regulated to fill or release canal pools, and diversion gates are then regulated at the given time based on the schedule. For the demand-oriented delivery, diversion gates are firstly regulated to meet users’ demands, and check gates are then regulated at an appropriate time to match the flow.
It is recognized that the total water volume demanded by users can only be satisfied to a limited scope if the head gate Taocha does not make changes. So, the available storage of the canal system should be calculated to determine whether the need could be met immediately. The available storage is calculated from the water level limit and the current water level. If the available storage is larger than the total demanded volume, adjacent pools adjust their openings or target water level so that the demanded volume could be supplied with their available storage. We try to give a uniform volume redistribution as far as possible, so that there would not be a wide range of pools reaching the water level limit after the delivery. In this case, the most recent upstream check gate whose opening is constant could be regarded as a new head gate. Otherwise, the start time of adjustment and the target flow of head gate Taocha should be calculated from the water volume gap.
After the chronological regulation order of various control structures is determined, the scheduling of delivery can be dealt with. The transition process of each canal pool from the initial state to target state can be divided into four scenarios according to the possible combination of flow change of the check gate at the downstream end of the pool and volume change of the pool. The four scenarios are called “gate opening with water filling”, “gate opening with water releasing”, “gate closing with water filling”, and “gate closing with water releasing” for simplicity. “Gate opening with water filling” means that target flow of check gate at the downstream end of the pool increases and the target water volume of the pool also increases, and the other three scenarios can be analogized. Each scenario can be subdivided into two cases according to the change of diversion flow, which are “increase of diversion flow” and “decrease of diversion flow”. The first case corporates the situation that the diversion flow is constant. Thus there are eight possible operational cases for each canal pool. The flow of each check gate is assumed to change in a piecewise linear way, and the rate is determined from trial calculation. The scheduling is made using chartography successively. The start and end time of the regulation of check gates and diversion gates under each case can be calculated on the principle of water volume balance without the traditional hypothesis that the canal system starts from a balance state of inflow and outflow.
The scheduling procedure is illustrated herein by taking “gate opening with water filling” as an example. Scheduling of the rest three scenarios can be derived in a similar way.
It is obvious that
T i , e = T i , 0 + ( Q i , e Q i , 0 ) / k i
T F i , e = T F i , 0 + ( Q F i , e Q F i , 0 ) / k f , i
where the check gate at the downstream end of the ith canal pool is numbered as i, as shown in Figure 3; subscripts 0 and e are used to denote the initial state and target state, respectively; the diversion flow and water volume of the pool are QFi and Vi, respectively; the flow of check gate i is Qi; the start and end time of adjustment of check gate i are Ti,0 and Ti,e, respectively; the start and end time of adjustment of the diversion gate are TFi,0 and TFi,e, respectively; the flow rates of check gate i and diversion gate are Ki and KFi, respectively. Here we assume Ki = KFi.
If the diversion flow increases, the inflow of the canal pool must increase. For demand-oriented delivery taken by the MRP, the diversion flow is supposed to increase simultaneously with the inflow to meet water users’ demand as soon as possible. Thus,
TFi,0 = Ti−1,0
The check gate at the downstream end of the pool starts to increase its opening after the diversion gate accomplishes its adjustment. The flow increase of check gate i-1 consists of the flow increase of check gate i and the flow increase of diversion. As the pool is to be filled, the check gate at the downstream end of the pool must be the last one to finish adjustment, as illustrated in Figure 4a. The water volume balance relation of the pool is described by Equation (4). With Equations (1)–(4), the start and end time of adjustment of check gate i and the diversion gate can be uniquely determined.
[ 1 2 × ( Q i 1 , 0 + Q i 1 , e ) × Q i 1 , e Q i 1 , 0 k i 1 + Q i 1 , e × ( T i , e T i 1 , e ) ] [ 1 2 × ( Q i , 0 + Q i , e ) × Q i , e Q i , 0 k i + Q i , 0 × ( T i , 0 T F i , 0 ) ] [ 1 2 × ( Q F i , e + Q F i , 0 ) × Q F i , e Q F i , 0 k i + Q F i , e × ( T i , e T F i , e ) ] = V i , e V i , 0
If the diversion flow decreases, the inflow of the canal pool could either decrease or increase. The diversion flow also increases simultaneously with the inflow; thus, Equation (3) still holds. When the inflow increases, the flow increase of check gate i-1 consists of the flow increase of check gate i and the flow decrease of diversion. As the diversion gate starts regulation simultaneously with check gate i-1, the check gate at the downstream end of the pool must be the last one to accomplish adjustment, otherwise, the pool would be in a releasing state. The scheduling is illustrated in Figure 4b, and the water volume balance relation of the pool is described by Equation (5). When the inflow decreases, the decrease of diversion flow consists of the flow increase of check gate i and the flow decrease of check gate i-1; thus, TFi,e must be larger than Ti-1,e, and the check gate at the downstream end of the pool is still the last one to accomplish adjustment; otherwise, during the time from Ti,e to TFi,e, the outflow would be larger than the inflow, and the pool will be in a releasing state, as illustrated in Figure 4c. Obviously, Equation (5) still serves in this case.
[ 1 2 × ( Q i 1 , 0 + Q i 1 , e ) × Q i 1 , e Q i 1 , 0 k i 1 + Q i 1 , e × ( T i , e T i 1 , e ) ] [ 1 2 × ( Q i , 0 + Q i , e ) × Q i , e Q i , 0 k i + Q i , 0 × T i , 0 ] [ 1 2 × ( Q F i , e + Q F i , 0 ) × Q F i , 0 Q F i , e k i + Q F i , e × ( T i , e T F i , e ) ] = V i , e V i , 0

2.3. The Real-Time Automatic Control Model

The canal system is faced with strong disturbances during routine operation, so the anticipated delivery needs to be modified according to the real-time monitoring data (feedback control). The traditional PID controller or three-point controller are unfavorable for the MRP for their poor performances such as frequent gate regulation, overshoot, and oscillation. This paper builds an improved automatic control model on the basis of Proportion Integration (PI) controller in following aspects: (1) The constraint that the ultimate target is in a steady flow state is abandoned, since it is impossible for the canal pool to realize complete balance between inflow and outflow in practice. (2) The overall water volume of the canal system is taken as the primary control factor. The water level of the local pool is taken as the secondary control factor, and the flow is taken as the third control factor to avoid unnecessary gate adjustments due to periodical unbalances between inflow and outflow.
The downstream control and upstream control are both available for real-time modification of gate operations. The choice depends on the trend of whole water volume upstream and downstream the pool, but the downstream control is preferred when both modifications are reasonable. For example, when the water level upstream of the check gate is beyond the upper limit of the target interval, the downstream gate should increase its opening if the water volume upstream the pool and downstream the pool are both stable. While if the whole water volume upstream the pool is below or near the lower target limit or continues to decline, the upstream gates should be closed to different extents, determined by the volume deviation from the target, the expected recovery time, and the allowable drawdown rate. The faster the water level rises, the greater amount of reduction of upstream check gates is.
In addition, the check gate is preferred to be adjusted in one direction to maintain the system stability. The scheduling is modified when the water level upstream of the check gate exceeds the target water level by 70% of the interval and changes unidirectionally towards the limit for two consecutive times (about four hours), which is obtained from immense numerical simulation to avoid overshoot or under regulation.
Although flow is used as the feedback control variable, orders of check gates should be given as opening for execution. Researches show that the use of gate openings as control variable directly is better than discharge, but only for short canal pools where the interactions are strong and canal pools are completely affected by backwater [34]. For the MRP where a disturbance from downstream might not always reach the upstream end of the canal pool, this method is not expected to show advantages. The ultimate gate opening is calculated with the revised target flow and the real-time water level by the sluice discharge equation. The traditional semi-theoretical equations show low accuracy in the MRP operation, which are supposed to be affected by the structural layout, types of check gates, underflow conditions and so on. The empirical discharge coefficients and submergence coefficients for different flow patterns need to be calibrated individually with measured data [35,36,37], which is extremely complicated and work-consuming. This paper adopts the real-time correction technique to identify the coefficients from 48 groups of measured data (flow, water level and gate opening) in the last 24 h. The mean value of the calculated coefficients of 48 groups is taken as the coefficient for the current time.
The models are integrated into an automatic system for the daily operation of the MRP, which can collect monitoring data of each control structure, as well as generate and send gate orders.

3. Case Study

Here an application example is used to show the performance of the models. The real-time flow and water level data are collected and used as feedback control information. The batch of operation orders of check gates is generated automatically every two hours and then sent for execution. The test time lasts 48 h.

3.1. Study Area

The study area is the whole main canal of the MRP. The canal system is divided into 60 pools by 61 check gates. In each pool, there is at least one diversion or recession gate. Locations of the main control structures are shown in Figure 5. The Yellow River crossing tunnel, located nearly in the middle of the main canal, is a landmark structure of the MRP. The water level at the entrance of the tunnel is required to be controlled between 117.00m and 117.10m during normal operation for safety. The Zhanghe-crossing inverted siphon, nearly at three quarters of the distance, is another landmark structure of the MRP for administrative division reasons. The end check gate Beijuma does not participate in operation and the water level in the last pool is controlled by the upstream check gates.
Typically, the canal pools at the upstream reaches have larger sizes and adjustable storages than that at the downstream reaches, for the design flow is much greater at upstream. Therefore, flow changes at downstream reaches are much more challenging for operation.

3.2. Test Condition

To validate the efficiency and stability of model, the chosen test has two features. Firstly, the diversions with flow changes are all located at the lower reaches of the main canal. Secondly, the inflow mismatches the outflow. The test condition is described as follows:
  • The flow of head gate Taocha is reduced by 20 m3/s for two times. It is reduced by 10 m3/s for the first time and reduced by 10 m3/s again after 12 h.
  • The flows of Fuyanghe, Hutuohe, Shahe (north), and Beiyishui diversions are reduced by 3 m3/s, 5 m3/s, 10 m3/s, and 3 m3/s, respectively. The flows of Tanghe and Baohe diversions are increased by 3 m3/s and 7 m3/s, respectively, as shown in Table 1. The total diversion flow is reduced by 3 m3/s at the initial time and reduced by 8 m3/s 12 h later for the second time. The reduction of the total inflow is greater than that of the total diversion flow, thus the canal system is in a releasing state.
  • In the initial state, water level of most canal pools is within the target interval, except several pools from Anyanghe River to Guyunhe River, as shown in Table 2, in which those out of the target interval are underlined. The water level at Yellow River crossing tunnel inlet is 117.05 m.
  • The target water level is taken as the design value.
The steady target state could be calculated by the one-dimensional steady flow equations and the water level-volume relationship.

3.3. Test Results and Discussion

By adopting the operation method in this paper, canal storages are firstly fully utilized to store the reduced water volume by users temporarily, and after the negative translatory wave travels downstream, the pool volume decreases. The results based on the proposed method as well as the discussion are illustrated below.

3.3.1. Variations of Check Gate Openings

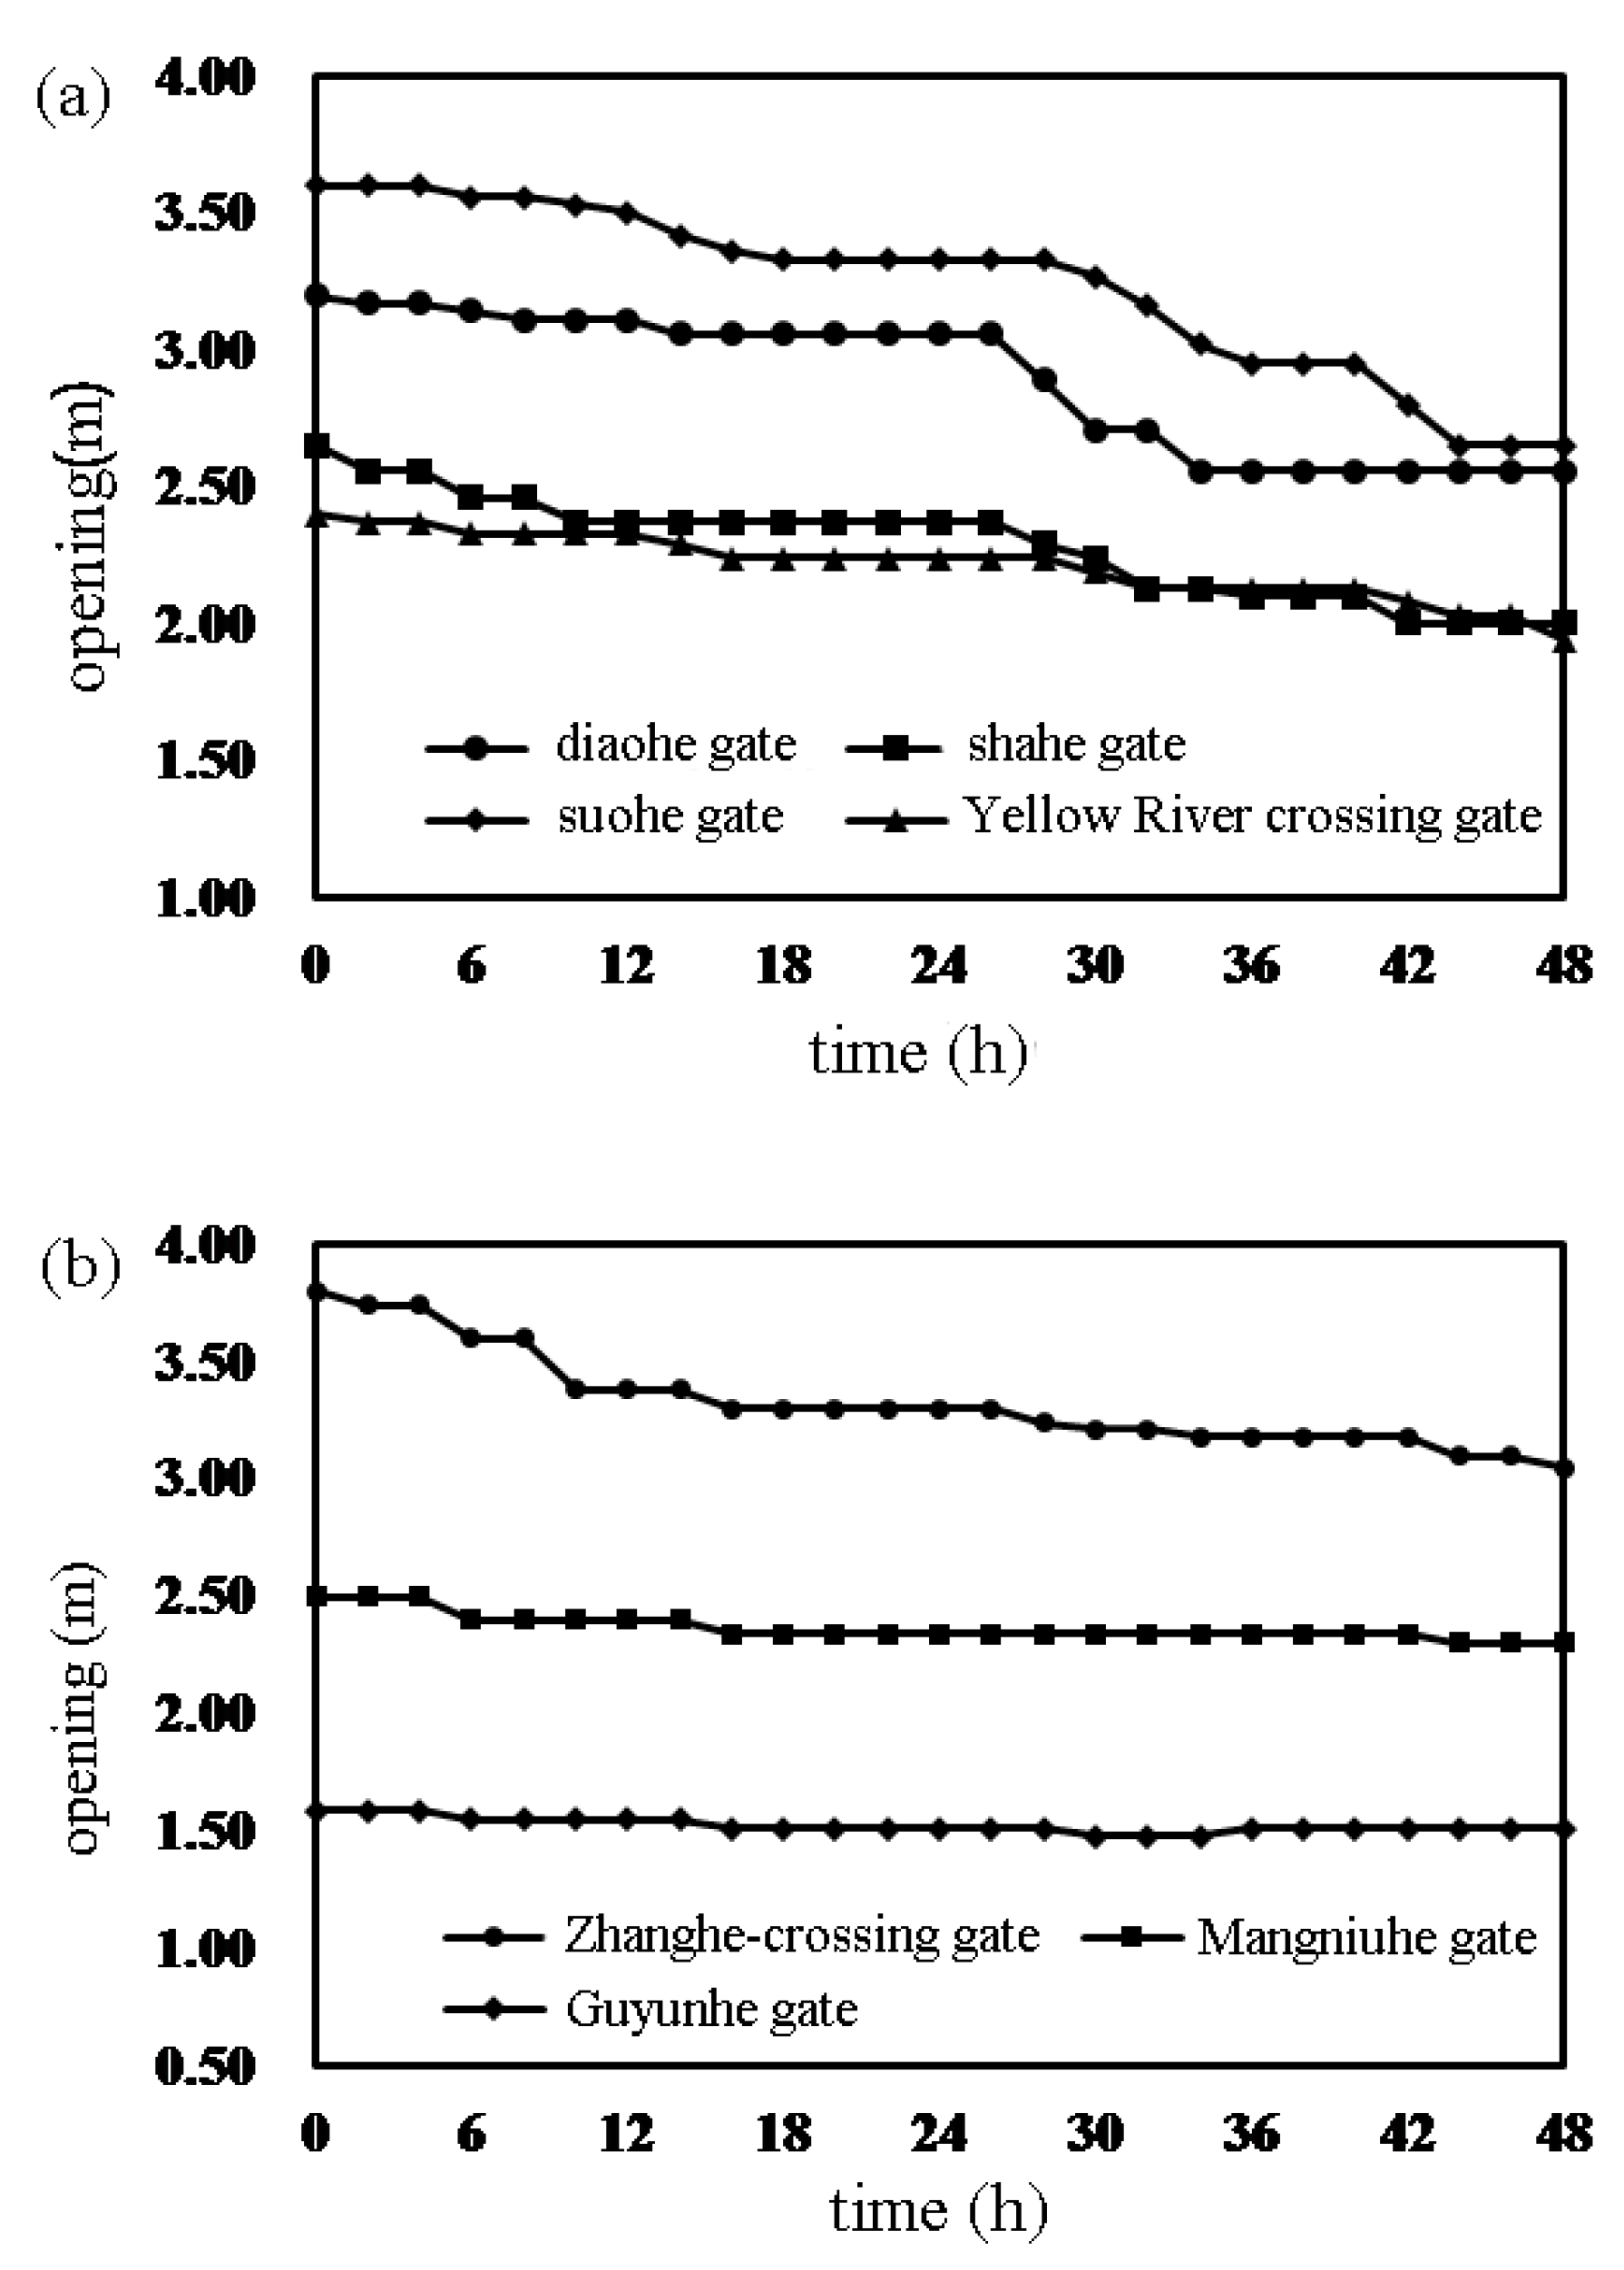
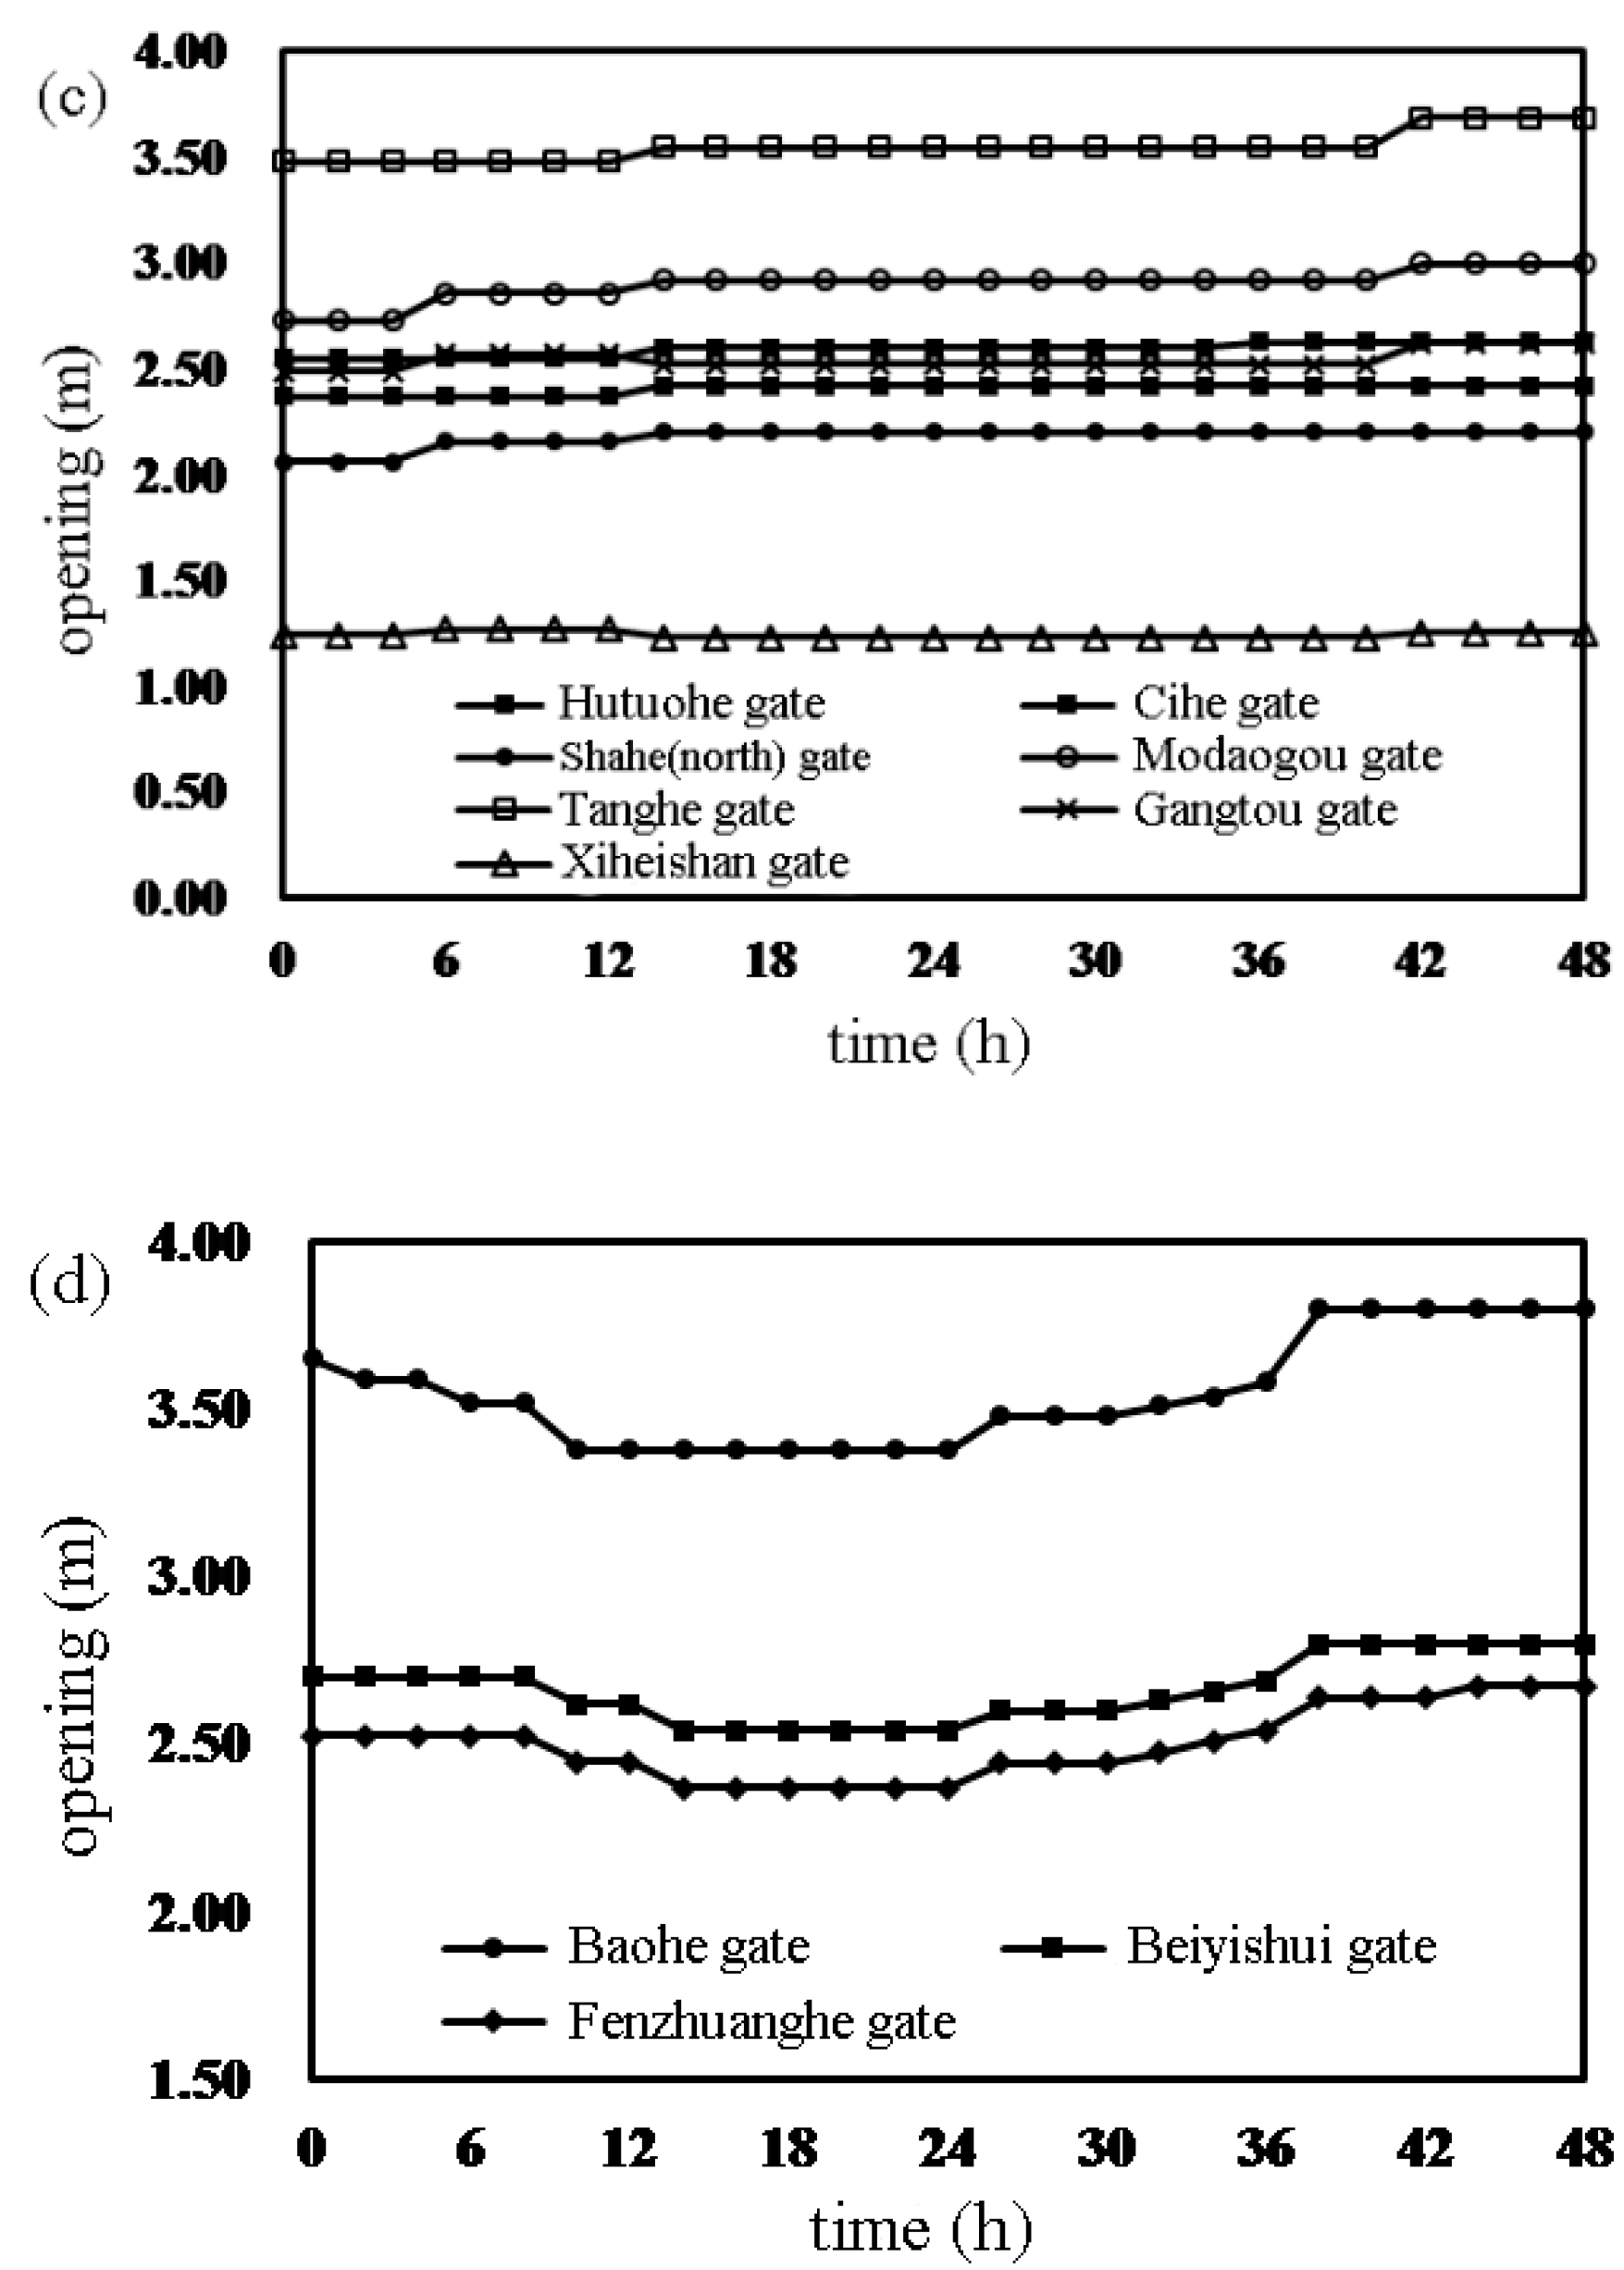
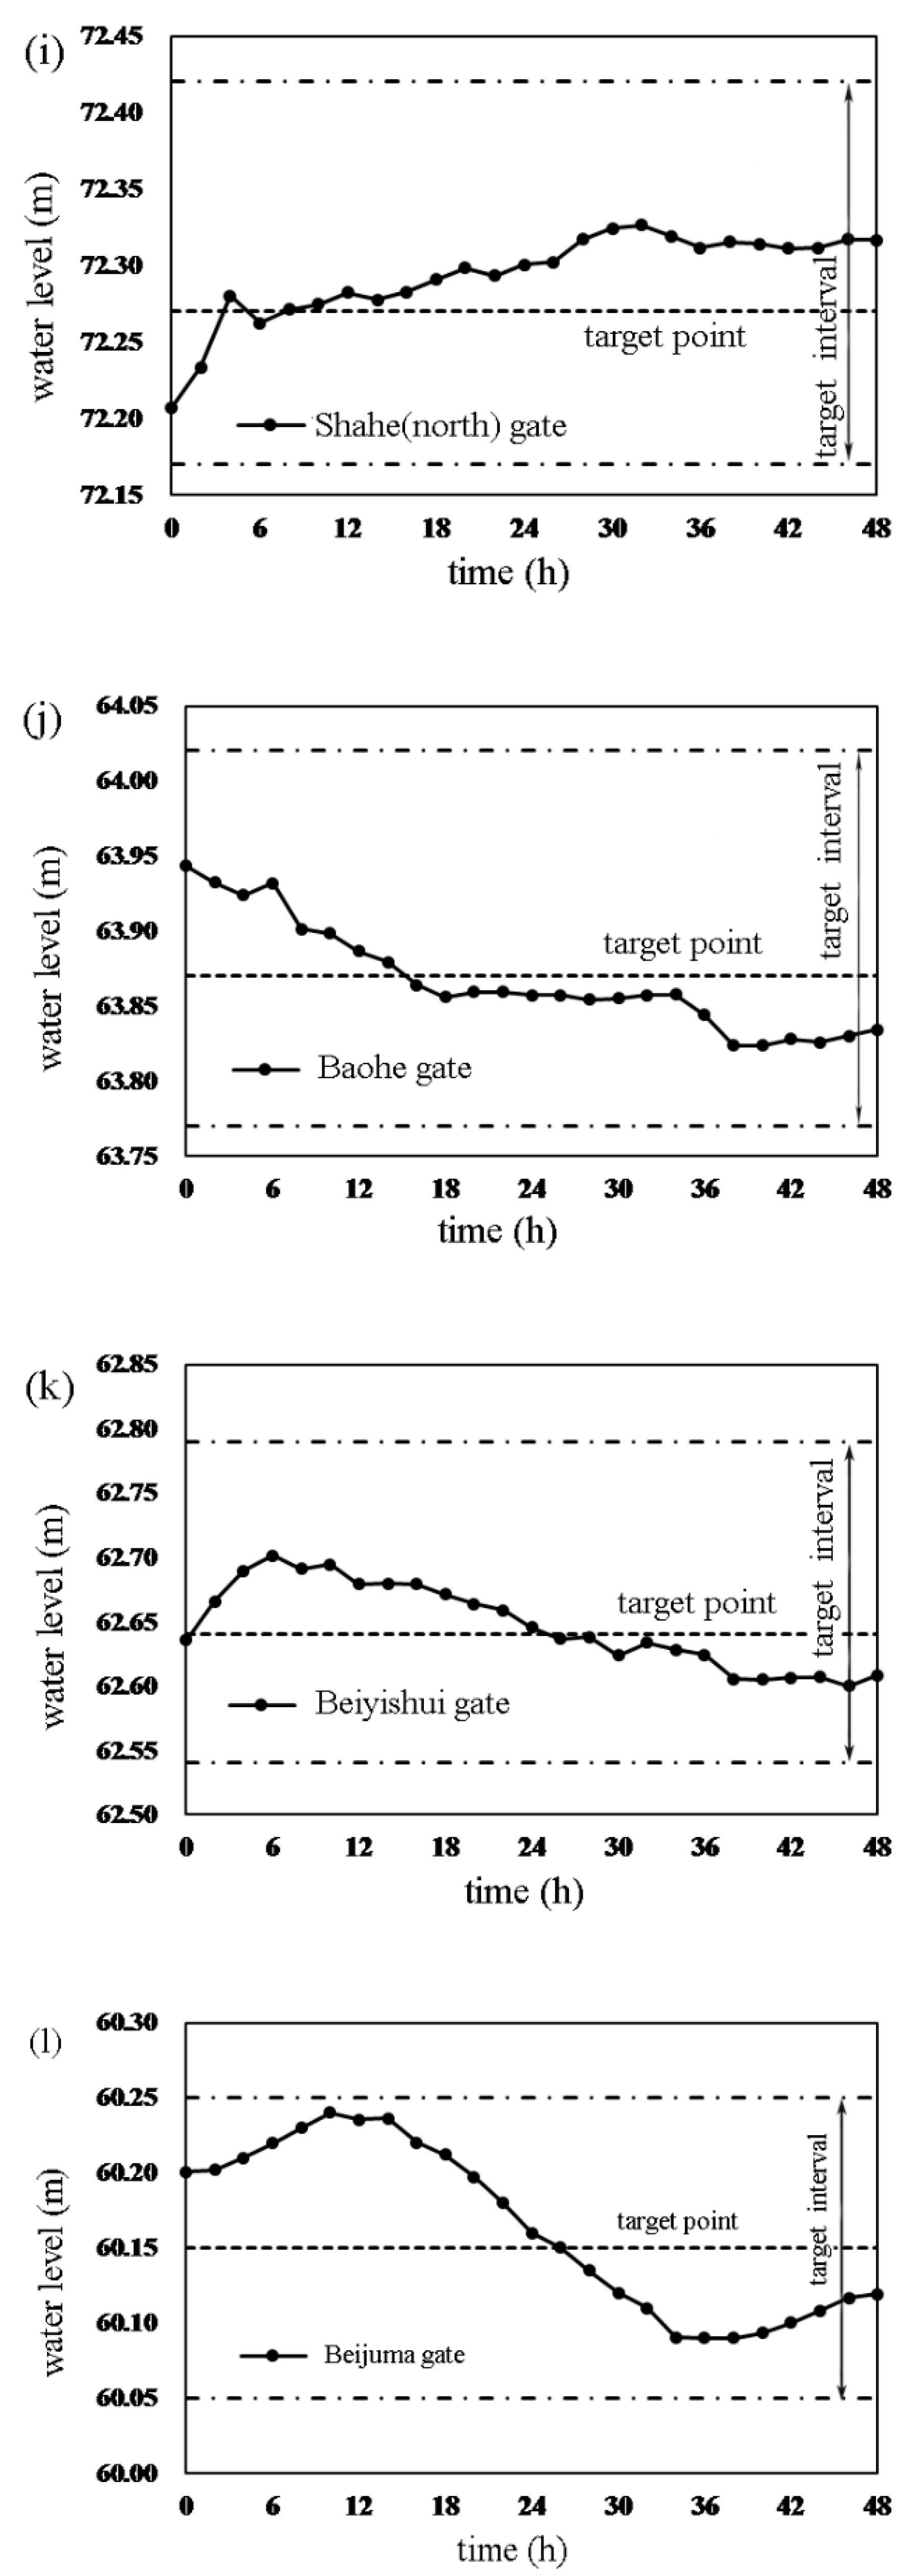
Variations of the opening of check gates located near the diversions with flow changes and at the key cross sections are shown in Figure 6. It is shown that each check gate adjusts its opening in one direction before reaching the target flow and remains almost unmoved after reaching the target flow. The exception is that check gates from Baohe to Fenzhuanghe increase their openings from 24th to 38th hours mainly due to the unforeseen decrease of water level upstream of end check gate Beijuma (Figure 8). As check gate Beijuma does not participate in operation, the water level deviation can only be resumed by the operation of its upstream gates.
The total times of gate adjustments has been added up, as shown in Table 3. In addition, the total times of gate adjustments made by the traditional PID controller are used as comparison, which is done by numerical simulation. It can be seen that the control model in this paper could reduce gate adjustments by nearly two times.

3.3.2. Variations of Water Level Upstream of Check Gates

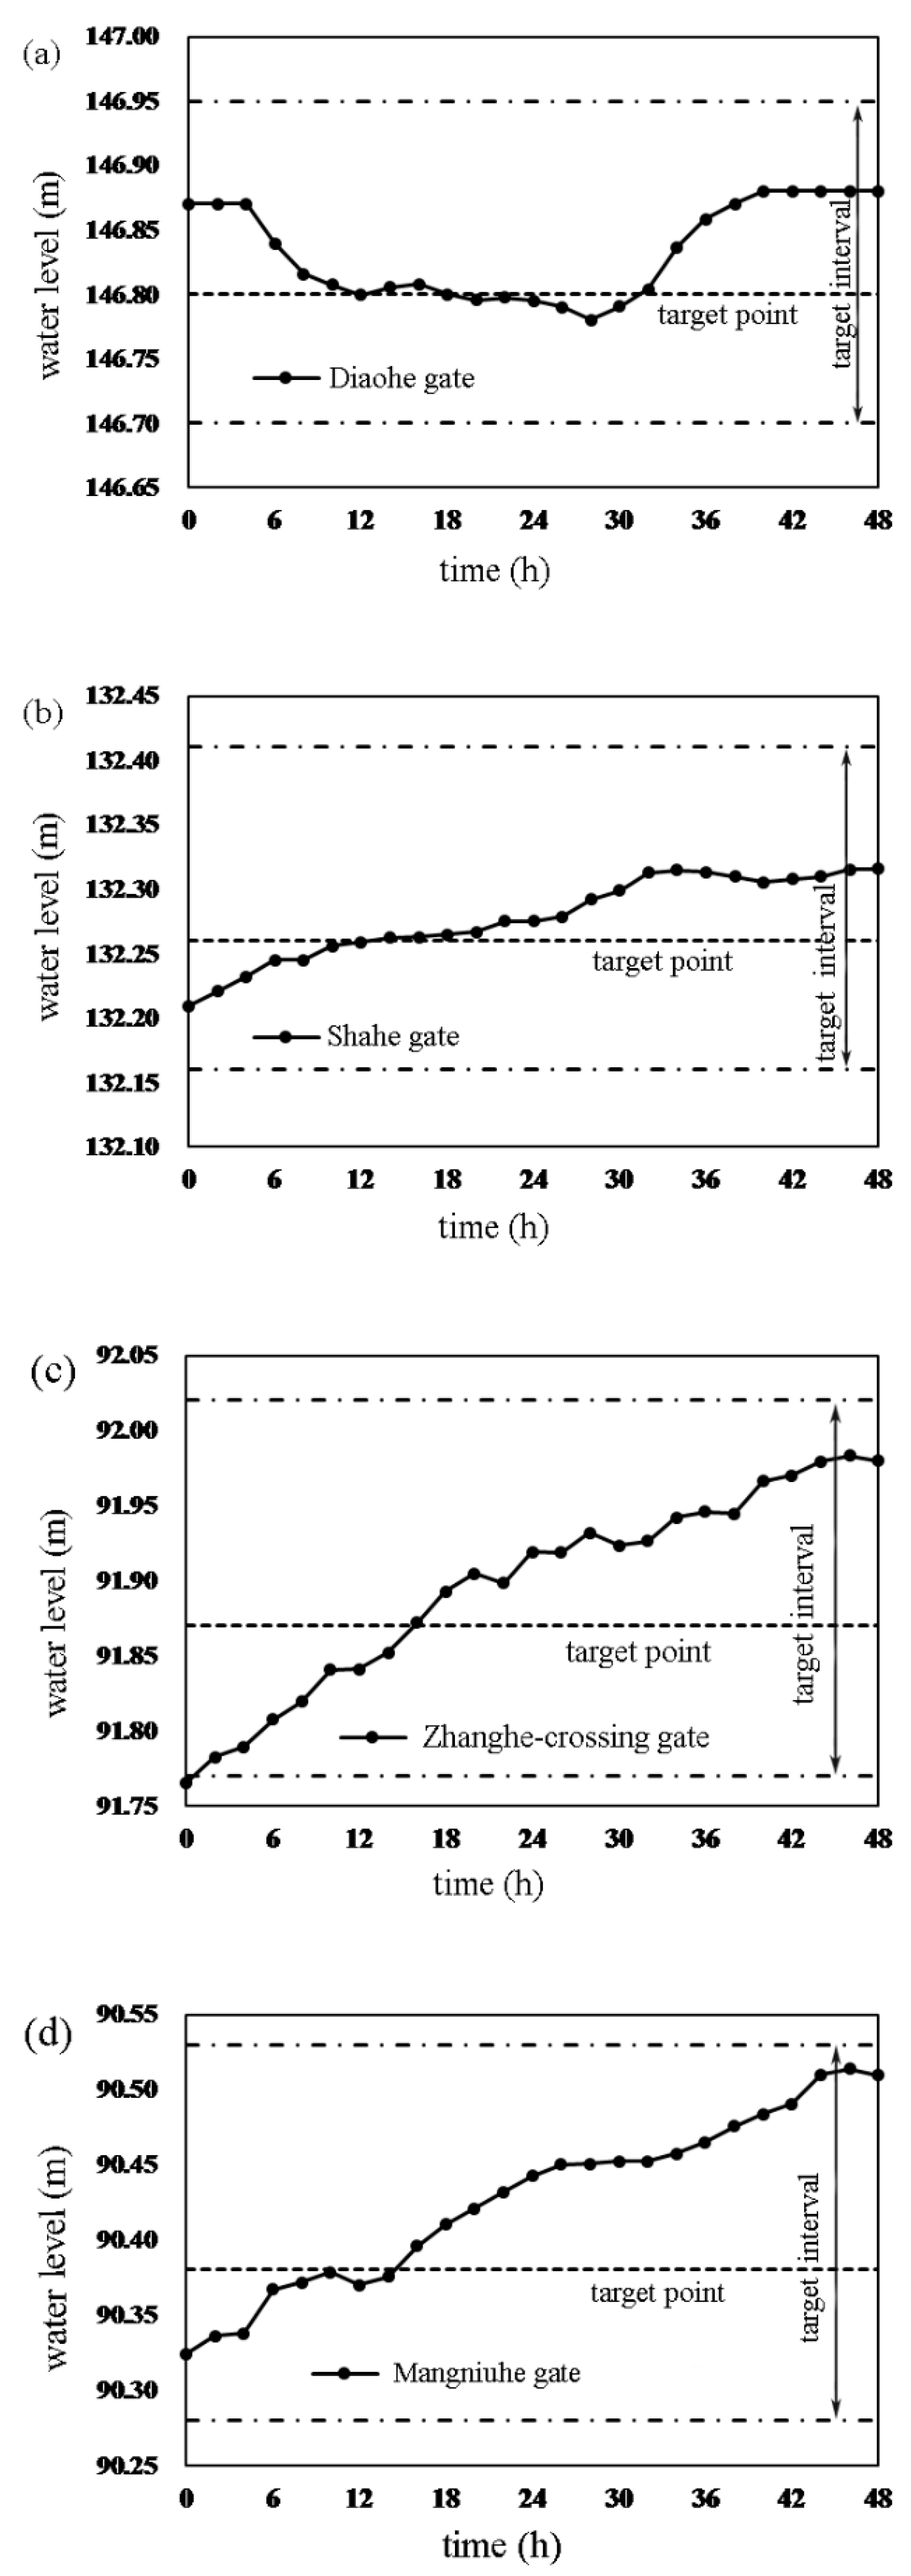
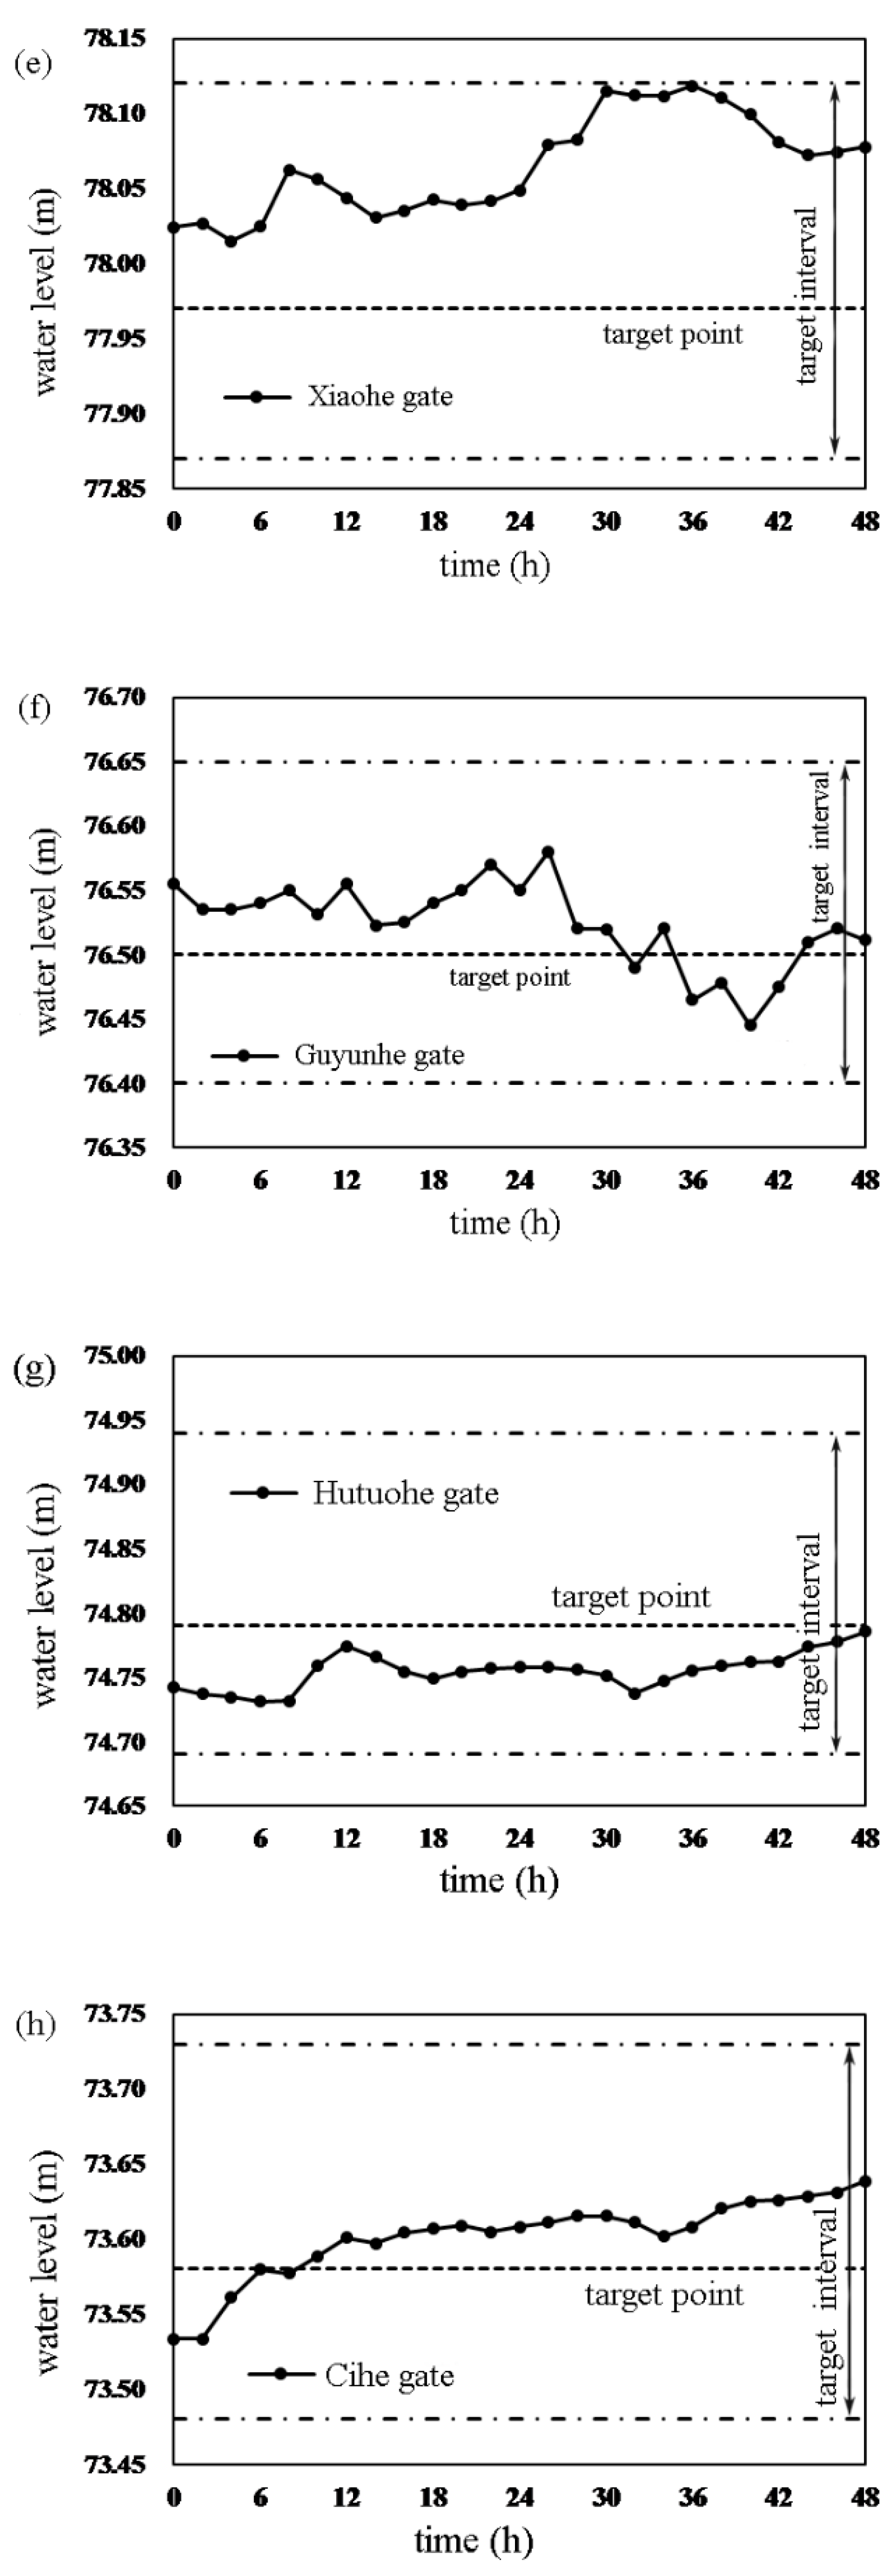
Variations of water level upstream of the check gates located at canal pools with diversion flow changes and other special water level control requirements are shown in Figure 7 and Figure 8, respectively. It is shown that the water level upstream of the check gates mostly changes within the target interval. The water level in canal pools from Zhanghe-Crossing inverted siphon to Guyunhe River culvert almost lies at the upper limit of the target interval, since the pools store the reduced water volume of users.
The water level at the entrance of Yellow River crossing tunnel exceeds the upper limit of the target interval in the 32nd hour, maybe due to diversion fluctuations or other disturbances. The upstream check gate Suohe speeds up the reduction of its opening, as shown in Figure 6, and the water level returns to normal after about 4 h. This illustrates that the feedback control is robust.

4. Conclusions

Real-time control of the MRP is important for delivery efficiency and safety. So far, no real-time controllers have been successfully put into use in daily operation of the MRP mainly due to the poor performance under violent and unforeseen flow fluctuations at the turnout points. In this paper, an expanded downstream depth operation method was introduced to respond to users’ demand more flexibly and maintain the whole canal system stable. Then the scheduling of delivery was presented, and an improved control model was built on the basis of PI controller. The models were integrated into an automatic system for daily operation of the MRP. Finally, an application is illustrated for validation. The conclusions are summarized as follows:
(1) The expanded downstream depth operation method was proposed. The water level is controlled within a target interval instead of a fixed point, and the target interval is changeable, so that flow mismatches can be tolerated, and users’ requests can be accommodated more flexibly. The interval is about 0.25 m for the MRP. Results show that the canal system could respond to users’ demands five times more rapidly, compared to the constant downstream depth method.
(2) The scheduling of delivery could be obtained by chartography from upstream to downstream successively. The operation is divided into four scenarios according to the possible combination of flow change of the check gate at the downstream end of the pool and volume change of the pool, and each scenario can be subdivided into two cases according to the change of diversion flow. In each case, the flow chart can be drawn based on the delivery method and the target. The start and end time of regulation of the check gate at the downstream end of the pool and diversions can be determined on the basis of volume balance principle. An improved real-time automatic control model is built for feedback control, in which the overall water volume upstream and downstream the pool is taken as the primary control factor, the water level of the local pool is taken as the secondary control factor, and the flow is taken as the third control factor. Results show that the developed model is robust and efficient. It can keep water level within the target interval during operation and reduce gate regulations by more than two times, compared to the traditional PID controller.
The expanded downstream depth operation method proposed could be popularized in long-distance water diversion projects with both supply-oriented delivery and demand-oriented delivery, which is under our investigation currently. Additionally, this paper assumes that the anticipated flow rate of different check gates is the same. Further researches would be done to obtain the rate for individual gate based on theoretical derivation.

Author Contributions

Y.W., Z.L., and H.H. contributed to the development of the operation method and control model. Y.W., L.L., and X.C. carried out the case study and analysis. Y.W. finalized the paper draft. All authors have read and agreed to the published version of the manuscript.

Funding

Supported by Joint Open Research Fund Program of State Key Laboratory of Hydroscience and Engineering and Tsinghua-Ningxia Yinchuan Joint Institute of Internet of Waters on Digital Water Governance (sklhse-2019-low02).

Institutional Review Board Statement

Not applicable.

Informed Consent Statement

Not applicable.

Data Availability Statement

The data presented in this study are available on request from the corresponding author. The data are not publicly available due to data confidentiality agreement with the administrative bureau of the MRP.

Acknowledgments

The authors wish to thank Handong Wang for his contribution in system integration, and thank Yusheng Cao and Shuang Liu for their coordination of the implementation of the case study.

Conflicts of Interest

The authors declare no conflict of interest.

References

  1. Shahdany, S.M.H.; Majd, E.A.; Firoozfar, A.; Maestre, J.M. Improving Operation of a Main Irrigation Canal Suffering from Inflow Fluctuation within a Centralized Model Predictive Control System: Case Study of Roodasht Canal, Iran. J. Irrig. Drain. Eng. 2016, 142, 05016007. [Google Scholar] [CrossRef]
  2. Clemmens, A.J.; Replogle, J.A. Control of Irrigation Canal Networks. J. Irrig. Drain. Eng. 1989, 115, 96–110. [Google Scholar] [CrossRef]
  3. William, W.G.; Becker, L.; Toy, D.; Graves, A.L. Central Arizona Project: Operations Model. J. Water. Res. Plan. Man. Div. 1980, 106, 521–540. [Google Scholar]
  4. Corriga, G.; Fanni, A.; Sanna, S.; Usai, G. A Constant-Volume Control Method for Open Channel Operation. Int. J. Model. Simul. 1982, 2, 108–112. [Google Scholar] [CrossRef]
  5. Cantoni, M.; Weyer, E.; Li, Y.; Ooi, S.K.; Mareels, I.; Ryan, M. Control of Large-Scale Irrigation Networks. Proc. IEEE 2007, 95, 75–91. [Google Scholar] [CrossRef]
  6. Wylie, E.B. Control of transient free-surface flow. J. Hydraul. Div. 1969, 95, 347–362. [Google Scholar]
  7. Bautista, E.; Clemmens, A.J. Volume Compensation Method for Routing Irrigation Canal Demand Changes. J. Irrig. Drain. Eng. 2005, 131, 494–503. [Google Scholar] [CrossRef] [Green Version]
  8. Belaud, G.; Litrico, X.; Clemmens, A.J. Response Time of a Canal Pool for Scheduled Water Delivery. J. Irrig. Drain. Eng. 2013, 139, 300–308. [Google Scholar] [CrossRef] [Green Version]
  9. Cui, W.; Chen, W.; Mu, X.; Guo, X. Anticipation time estimation for feedforward control of canal. J. Hydraul. Eng. 2009, 40, 1345–1350. [Google Scholar]
  10. Liao, W.; Guan, G.; Tian, X. Exploring Explicit Delay Time for Volume Compensation in Feedforward Control of Canal Systems. Water 2019, 11, 1080. [Google Scholar] [CrossRef] [Green Version]
  11. Soler, J.; Gómez, M.; Rodellar, J. GoRoSo: Feedforward Control Algorithm for Irrigation Canals Based on Sequential Quadratic Programming. J. Irrig. Drain. Eng. 2013, 139, 41–54. [Google Scholar] [CrossRef]
  12. Burt, C.M.; Feist, K.; Piao, X. Accelerated Irrigation Canal Flow Change Routing. J. Irrig. Drain. Eng. 2018, 144, 04018006. [Google Scholar] [CrossRef]
  13. Clemmens, A.J.; Strand, R.J. Application of Software for Automatic Canal Management (SacMan) to the WM Lateral Canal. J. Irrig. Drain. Eng. 2010, 136, 451–459. [Google Scholar] [CrossRef] [Green Version]
  14. Burt, C.M.; Mills, R.S.; Khalsa, R.D.; C., V.R. Improved Proportional-Integral (PI) Logic for Canal Automation. J. Irrig. Drain. Eng. 1998, 124, 53–57. [Google Scholar] [CrossRef] [Green Version]
  15. Litrico, X.; Malaterre, P.-O.; Baume, J.-P.; Vion, P.-Y.; Ribot-Bruno, J. Automatic Tuning of PI Controllers for an Irrigation Canal Pool. J. Irrig. Drain. Eng. 2007, 133, 27–37. [Google Scholar] [CrossRef] [Green Version]
  16. Battle, V.F.; Perez, R.R.; Rodriguez, L.S.; Torija, M.A.R. Robust Fractional-Order PI Controller Implemented on a Laboratory Hydraulic Canal. J. Hydraul. Eng. 2009, 135, 271–282. [Google Scholar] [CrossRef]
  17. Montazar, A.; Isapoor, S. Centralized Downstream PI Controllers for the West Canal of Aghili Irrigation District. J. Agric. Sci. Technol. 2012, 14, 375–388. [Google Scholar]
  18. Cui, W.; Chen, W.; Mu, X.; Bai, Y. Canal controller for the largest water transfer project in china. Irrig. Drain. 2013, 63, 501–511. [Google Scholar] [CrossRef]
  19. Huang, K.; Guan, G.; Liu, D.; Mo, Z. Simulation for PID Controller of Modified Integral and Differential on Tandem Canal System. J. Irrig. Drain. 2017, 2, 1–11. (In Chinese) [Google Scholar]
  20. Camacho, E.F.; Bordons, C. Model Predictive Control, 2nd ed.; Springer: New York, NY, USA, 2004; Volume 22, p. 405. [Google Scholar]
  21. Zheng, Z.; Wang, Z.; Zhao, J.; Zheng, H. Constrained Model Predictive Control Algorithm for Cascaded Irrigation Canals. J. Irrig. Drain. Eng. 2019, 145, 04019009. [Google Scholar] [CrossRef]
  22. Kong, L.; Lei, X.; Wang, H.; Long, Y.; Lu, L.; Yang, Q. A Model Predictive Water-Level Difference Control Method for Automatic Control of Irrigation Canals. Water 2019, 11, 762. [Google Scholar] [CrossRef] [Green Version]
  23. Álvarez, A.; Ridao, M.A.; Ramirez, D.R.; E Sanchez, L. Constrained Predictive Control of an Irrigation Canal. J. Irrig. Drain. Eng. 2013, 139, 841–854. [Google Scholar] [CrossRef]
  24. Kong, L.; Quan, J.; Yang, Q.; Song, P.; Zhu, J. Automatic Control of the Middle Route Project for South-to-North Water Transfer Based on Linear Model Predictive Control Algorithm. Water 2019, 11, 1873. [Google Scholar] [CrossRef] [Green Version]
  25. Astrom, K.J. Limitations on control system performance. Eur. J. Control 2000, 6, 2–20. [Google Scholar] [CrossRef]
  26. Zhu, J.; Lei, X.; Quan, J.; Yue, X. Algae Growth Distribution and Key Prevention and Control Positions for the Middle Route of the South-to-North Water Diversion Project. Water 2019, 11, 1851. [Google Scholar] [CrossRef] [Green Version]
  27. Kattel, G.; Shang, W.; Wang, Z.; Langford, J. China’s South-to-North Water Diversion Project Empowers Sustainable Water Resources System in the North. Sustain. 2019, 11, 3735. [Google Scholar] [CrossRef] [Green Version]
  28. Shang, Y.-Z.; Shang, L. Algorithm for Canal Gate Operation to Maintain Steady Water Levels Under Abrupt Water Withdrawal. Irrig. Drain. 2016, 65, 741–749. [Google Scholar] [CrossRef]
  29. Guan, G.; Clemmens, A.J.; Kacerek, T.F.; Wahlin, B. Applying Water-Level Difference Control to Central Arizona Project. J. Irrig. Drain. Eng. 2011, 137, 747–753. [Google Scholar] [CrossRef]
  30. Cao, Y.; Chang, J.; Huang, Q.; Chen, X.; Huang, H. Real-time control strategy for water conveyance of Middle Route Project of South-to-North Water Diversion in China. Adv. Water Sci. 2017, 28, 133–139. (In Chinese) [Google Scholar]
  31. Liu, F.; Feyen, J.; Berlamont, J. Downstream Control of Multireach Canal Systems. J. Irrig. Drain. Eng. 1995, 121, 179–190. [Google Scholar] [CrossRef]
  32. Clemmens, A.J. Water-Level Difference Controller for Main Canals. J. Irrig. Drain. Eng. 2012, 138, 1–8. [Google Scholar] [CrossRef]
  33. Liu, G.; Guan, G.; Wang, C. Transition mode of long distance water delivery project before freezing in winter. J. Hydroinformatics 2012, 15, 306–320. [Google Scholar] [CrossRef]
  34. Horváth, K.; Galvis, E.; Valentín, M.G.; Benedé, J.R. Is It Better to Use Gate Opening as Control Variable than Discharge to Control Irrigation Canals? J. Irrig. Drain. Eng. 2015, 141, 04014054. [Google Scholar] [CrossRef] [Green Version]
  35. Lozano, D.; Mateos, L.; Merkley, G.P.; Clemmens, A.J. Field Calibration of Submerged Sluice Gates in Irrigation Canals. J. Irrig. Drain. Eng. 2009, 135, 763–772. [Google Scholar] [CrossRef]
  36. Salah, F.; Abdelhaleem, F. Discharge estimation for submerged parallel radial gates. Flow. Meas. Instrum. 2016, 52, 240–245. [Google Scholar]
  37. Lauria, A.; Calomino, F.; Alfonsi, G.; D’Ippolito, A. Discharge Coefficients for Sluice Gates Set in Weirs at Different Upstream Wall Inclinations. Water 2020, 12, 245. [Google Scholar] [CrossRef] [Green Version]
Figure 1. Route map of the Middle Route of South-to-North Water Diversion Project (MRP).
Water 13 00097 g001
Figure 2. Regular fluctuations of diversion flows. (a) monitoring data in 2016, (b) monitoring data in 2017.
Water 13 00097 g002aWater 13 00097 g002b
Figure 3. Sketches of a typical canal system.
Water 13 00097 g003
Figure 4. Scheduling of the “gate opening with water filling” case. (a) diversion flow increases; (b) diversion flow decreases, inflow increases; (c) diversion flow decreases, inflow decreases.
Water 13 00097 g004
Figure 5. Locations of the main control structures.
Water 13 00097 g005
Figure 6. Variations of the check gate openings. (a) check gates from head to Yellow River; (b) check gates from Zhanghe to Guyunhe; (c) check gates from Hutuohe to Xiheishan; (d) check gates from Baohe to Fenzhuanghe.
Water 13 00097 g006aWater 13 00097 g006b
Figure 7. Variations of water level upstream of the check gates (partially listed due to space limitation). (a) Diaohe gate; (b) Shahe gate; (c) Zhanghe-crossing gate; (d) Mangniuhe gate; (e) Xiaohe gate; (f) Guyunhe gate; (g) Hutuohe gate; (h) Cihe gate; (i) Shahe(north) gate; (j) Baohe gate; (k) Beiyishui gate; (l) Beijuma gate.
Water 13 00097 g007aWater 13 00097 g007bWater 13 00097 g007c
Figure 8. Variation of water level at the entrance of Yellow River crossing tunnel.
Water 13 00097 g008
Table 1. The initial and target diversion flows.
Name of DiversionInitial Flow (m3/s)Target Flow (m3/s)Flow Change (m3/s)Requirement
Fuyanghe diversion63−312 h later
Hutuohe diversion105−512 h later
Shahe (north) diversion100−10the initial time
Tanghe diversion033the initial time
Baohe diversion3107the initial time
Beiyishui diversion52−3the initial time
Table 2. The initial state and target water level of canal pools.
Gate NumberName of Check GateWater Level Upstream of Check Gate (m)Openings (m)Flow
(m3/s)
Target Water Level (m)Initial Water Level Deviation
(m)
1Diaohe146.870.320/0.320242.46146.800.07
2Tuanhe145.760.335/0.335/0.335232.77145.650.11
3Yanlinghe144.810.280/0.280144.74144.740.07
4Qihe (Nanyang)143.250.269/0.269/0.269/0.269233.57143.170.08
5Shi’erlihe141.930.249/0.249235.80141.930.00
6Baihe140.200.480/0.480/0.480/0.480236.56140.200.00
7Dongzhao139.440.266/0.260/0.260/0.266235.07139.45−0.01
8Huangjinhe137.970.330/0.330/0.330/0.330229.74137.970.00
9Caodunhe136.700.206/0.206234.83136.700.00
10Lihe134.540.390/0.390229.93134.60−0.06
11Penghe133.150.330/0.330224.76133.060.09
12Shahe132.210.265/0.265/0.265/0.265225.31132.26−0.05
13Yudaihe129.780.220/0.220/0.220/0.220223.02129.710.07
14Beiruhe128.110.358/0.358/0.358/0.358226.99128.16−0.05
15Lanhe127.170.400/0.400229.47127.27−0.10
16Yinghe125.920.288/0.288/0.288/0.288223.76125.910.01
17Xiaohonghe124.750.278/0.278/0.278/0.278219.11124.76−0.01
18Shuangjihe123.530.420/0.420/0.420/0.420220.56123.520.01
19Meihe122.580.285/0.285/0.285/0.285225.04122.520.06
20Zhangbagou121.710.420/0.420/0.420/0.420224.39121.76−0.05
21Chaohe120.980.345/0.345/0.345/0.345217.43121.01−0.03
22Jinshuihe120.020.310/0.310/0.310/0.310201.46119.990.03
23Xushuihe119.360.500/0.500/0.500/0.500199.39119.37−0.01
24Suohe118.680.360/0.360202.04118.72−0.04
25Yellow River crossing113.800.240/0.240202.69--
26Jihe107.540.224/0.224/0.224/0.224209.17107.60−0.06
27Yanhe105.280.219/0.219/0.219/0.219209.25105.150.13
28Kuichengzhai103.590.290/0.285/0.285/0.290204.22103.540.05
29Yuhe102.890.207/0.207/0.207202.00102.820.07
30Huangshuihezhi100.300.380/0.380/0.380/0.380204.31100.240.06
31Mengfenhe99.180.237/0.237/0.237/0.237197.7699.140.04
32Xiangquanhe97.800.440/0.212/0.212196.6997.730.07
33Qihe95.830.276/0.276/0.276201.0295.790.04
34Tanghe94.660.263/0.263191.3394.600.06
35Anyanghe92.650.365/0.365/0.365190.7792.77−0.12
36Zhanghe-crossing91.770.380/0.380/0.380185.6191.87−0.10
37Mangniuhe90.320.250/0.250/0.250177.6990.38−0.06
38Qinhe88.890.330/0.330/0.330168.5388.93−0.04
39Minghe87.800.227/0.227/0.227171.8687.91−0.11
40Nanshahe86.030.241/0.241/0.241175.8885.910.12
41Qilihe84.790.310/0.310/0.310171.9684.92−0.13
42Baimahe83.880.267/0.267/0.267168.7683.95−0.07
43Liyanghe82.540.278/0.278/0.278164.4882.66−0.12
44Wuhe80.960.200/0.200/0.200158.8981.03−0.07
45Huaihe79.370.260/0.260/0.260163.3779.51−0.14
46Xiaohe78.020.224/0.23/0.224157.8377.970.05
47Guyunhe76.560.161/0.155/0.161147.5276.400.16
48Hutuohe74.740.255/0.255/0.255129.1974.79−0.05
49Cihe73.530.237/0.237/0.237114.6173.58−0.05
50Shahe (north)72.210.206/0.206/0.206107.8572.27−0.06
51Modaogou70.940.273/0.273/0.273104.5971.02−0.08
52Tanghe70.150.346/0.349/0.349103.3470.19−0.04
53Fangshuihe68.940.200/0.200/0.200109.7568.900.04
54Puyanghe68.050.363/0.363/0.363105.4868.000.05
55Gangtou65.760.249/0.249103.2965.690.07
56Xiheishan65.090.123/0.127/0.12356.5465.080.01
57Baohe63.940.365/0.36552.9663.870.07
58Beiyishui62.640.270/0.27050.8762.640.00
59Fenzhuanghe61.770.250/0.25550.4161.80−0.03
60Beijuma60.200.405/0.40547.0360.150.05
Table 3. Comparison of the total times of gate adjustments.
Name of
Check Gates
Number of the Times
of Gate Adjustments
Name of
Check Gates
Number of the Times
of Gate Adjustment
Proposed
Model
Traditional PID ModelProposed
Model
Traditional PID Model
Diaohe712Shahe (north) 24
Shahe 812Muodaogou 36
Suohe 1015Tanghe 27
Yellow River Crossing 718Gangtou36
Zhanghe-Crossing 415Xiheisha27
Mangniuhe 315Baohe815
Guyunhe 48Beiyishui816
Hutuohe 14Fenzhuanghe916
Cihe 14
Publisher’s Note: MDPI stays neutral with regard to jurisdictional claims in published maps and institutional affiliations.