Cd(II) and Pb(II) Adsorption Using a Composite Obtained from Moringa oleifera Lam. Cellulose Nanofibrils Impregnated with Iron Nanoparticles


 ,
,  and
and 
Abstract
1. Introduction
2. Materials and Methods
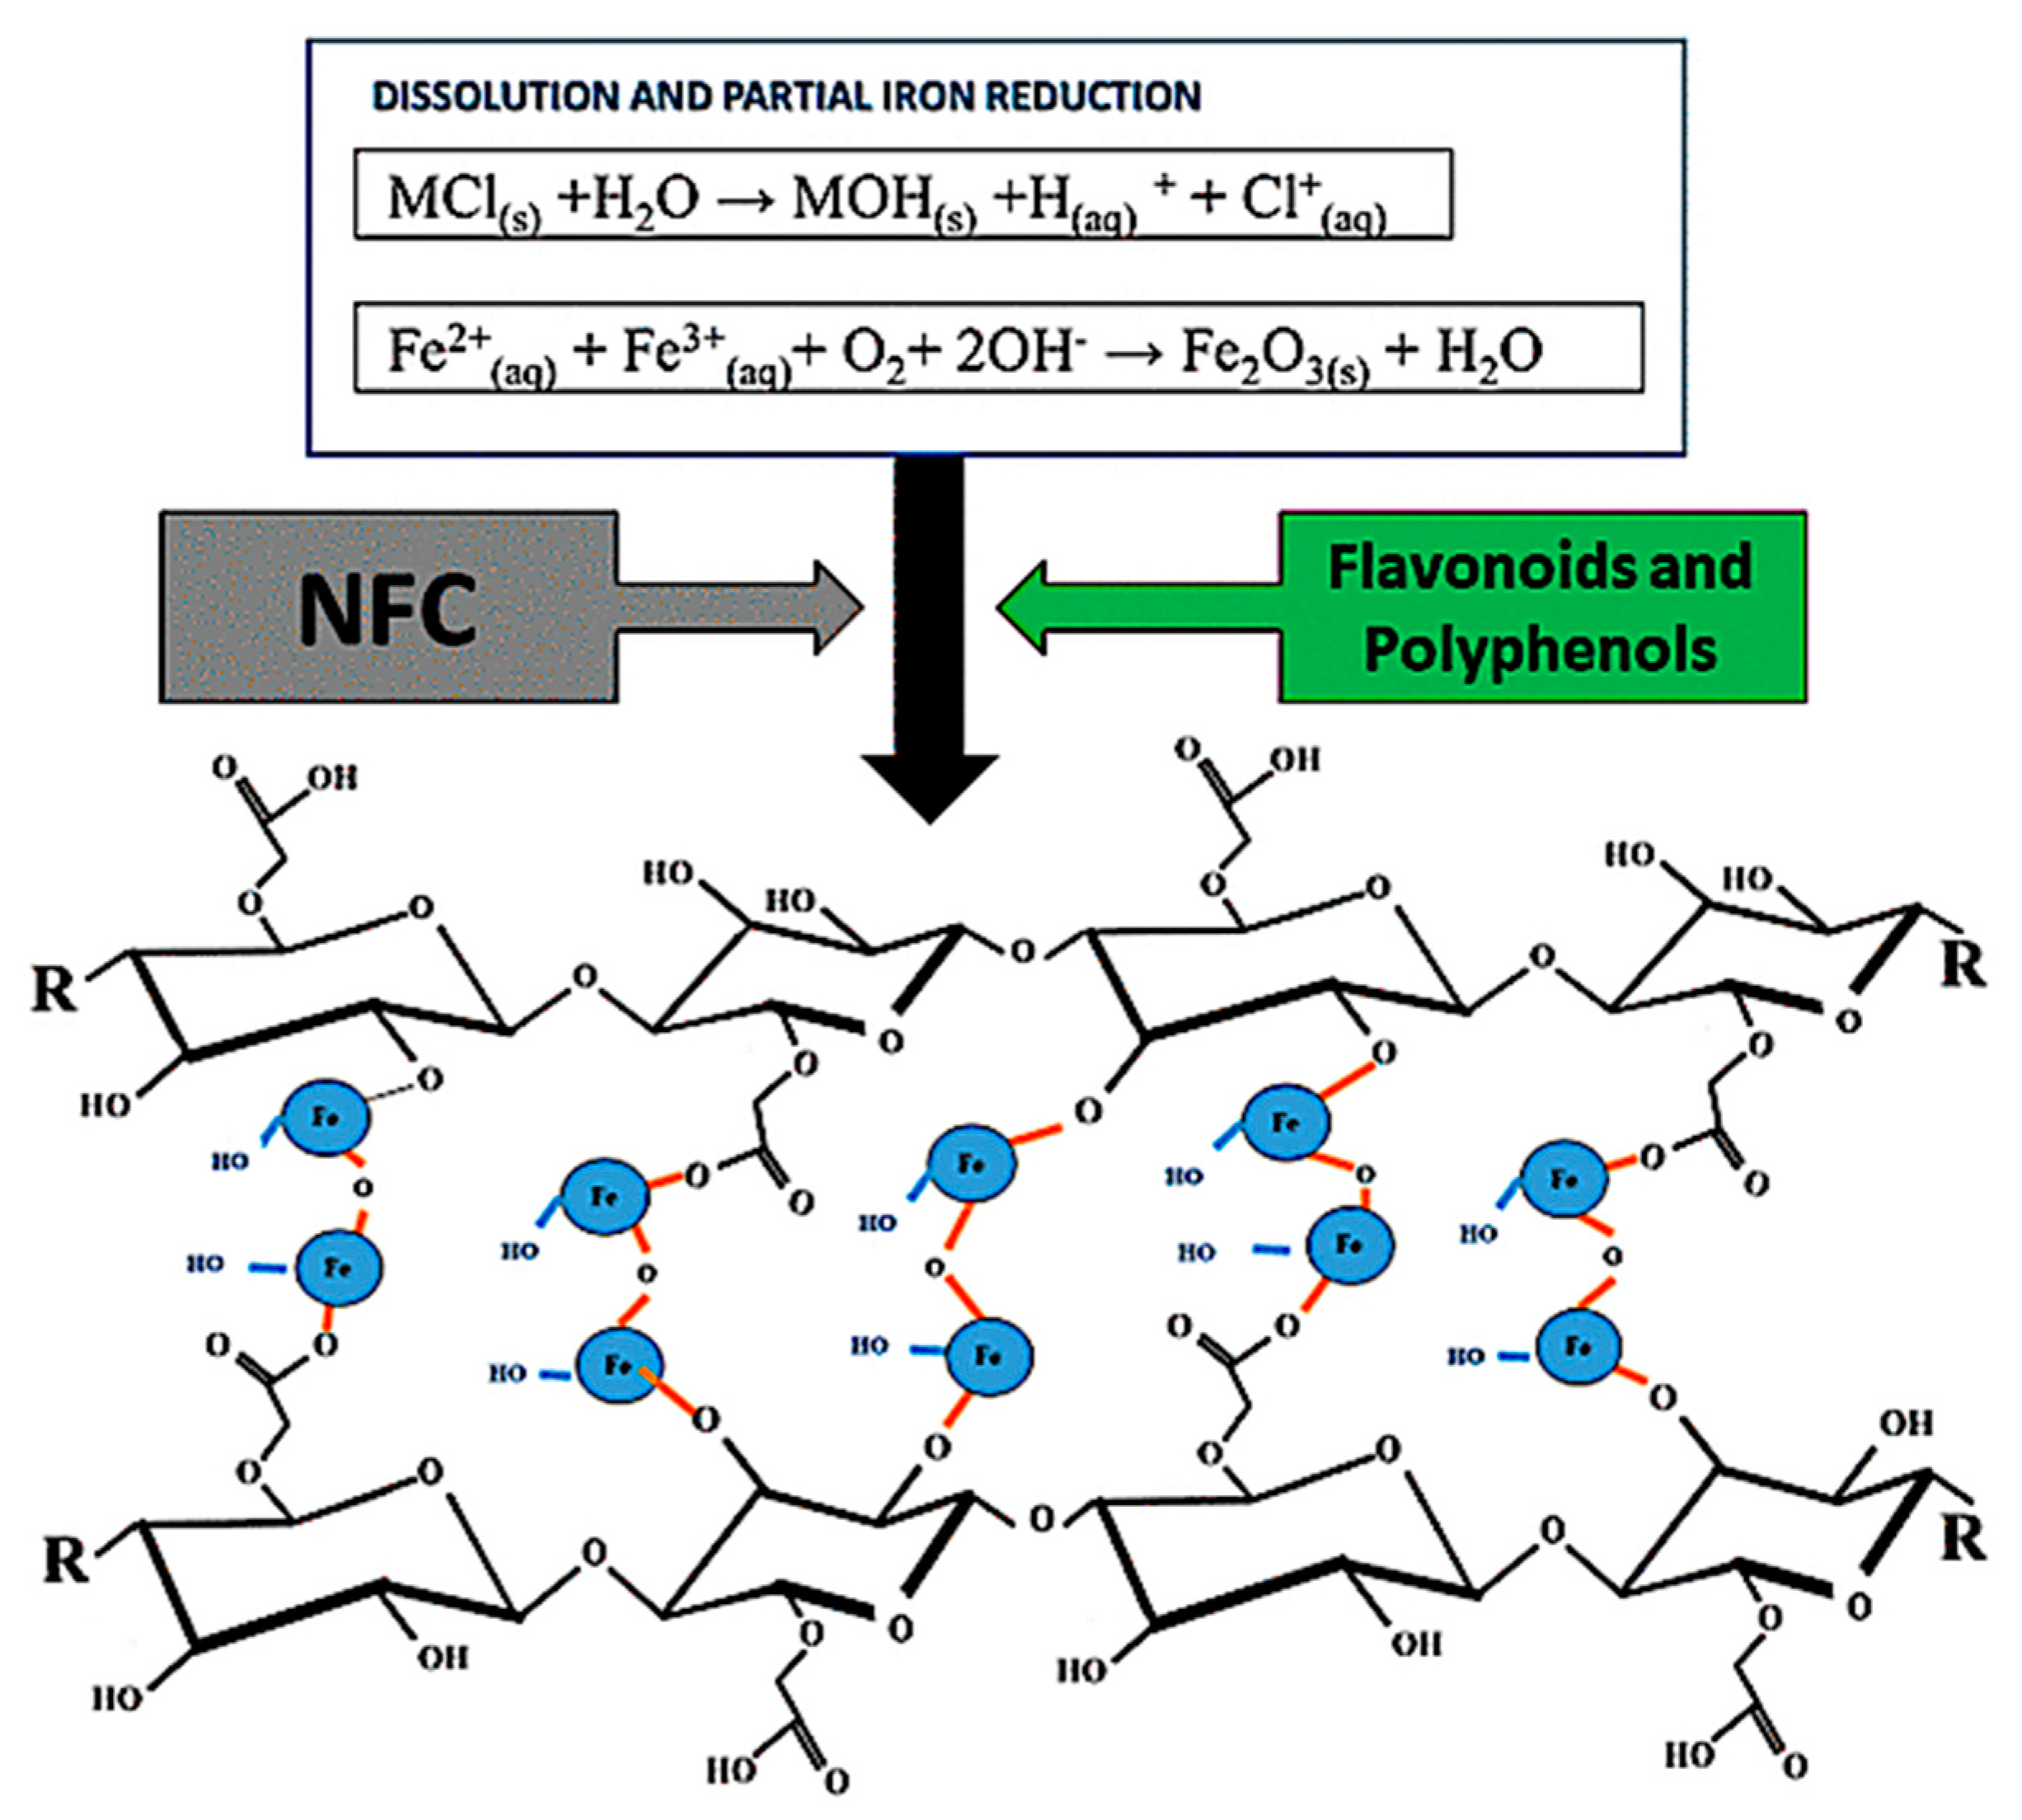
2.1. Preparation of FeNP/NFC Composite
2.2. Characterization of FeNP/NFC Composite
2.3. Adsorption Experiments
2.3.1. Kinetics
2.3.2. Isotherms
2.4. Thermodynamic Studies
3. Results and Discussion
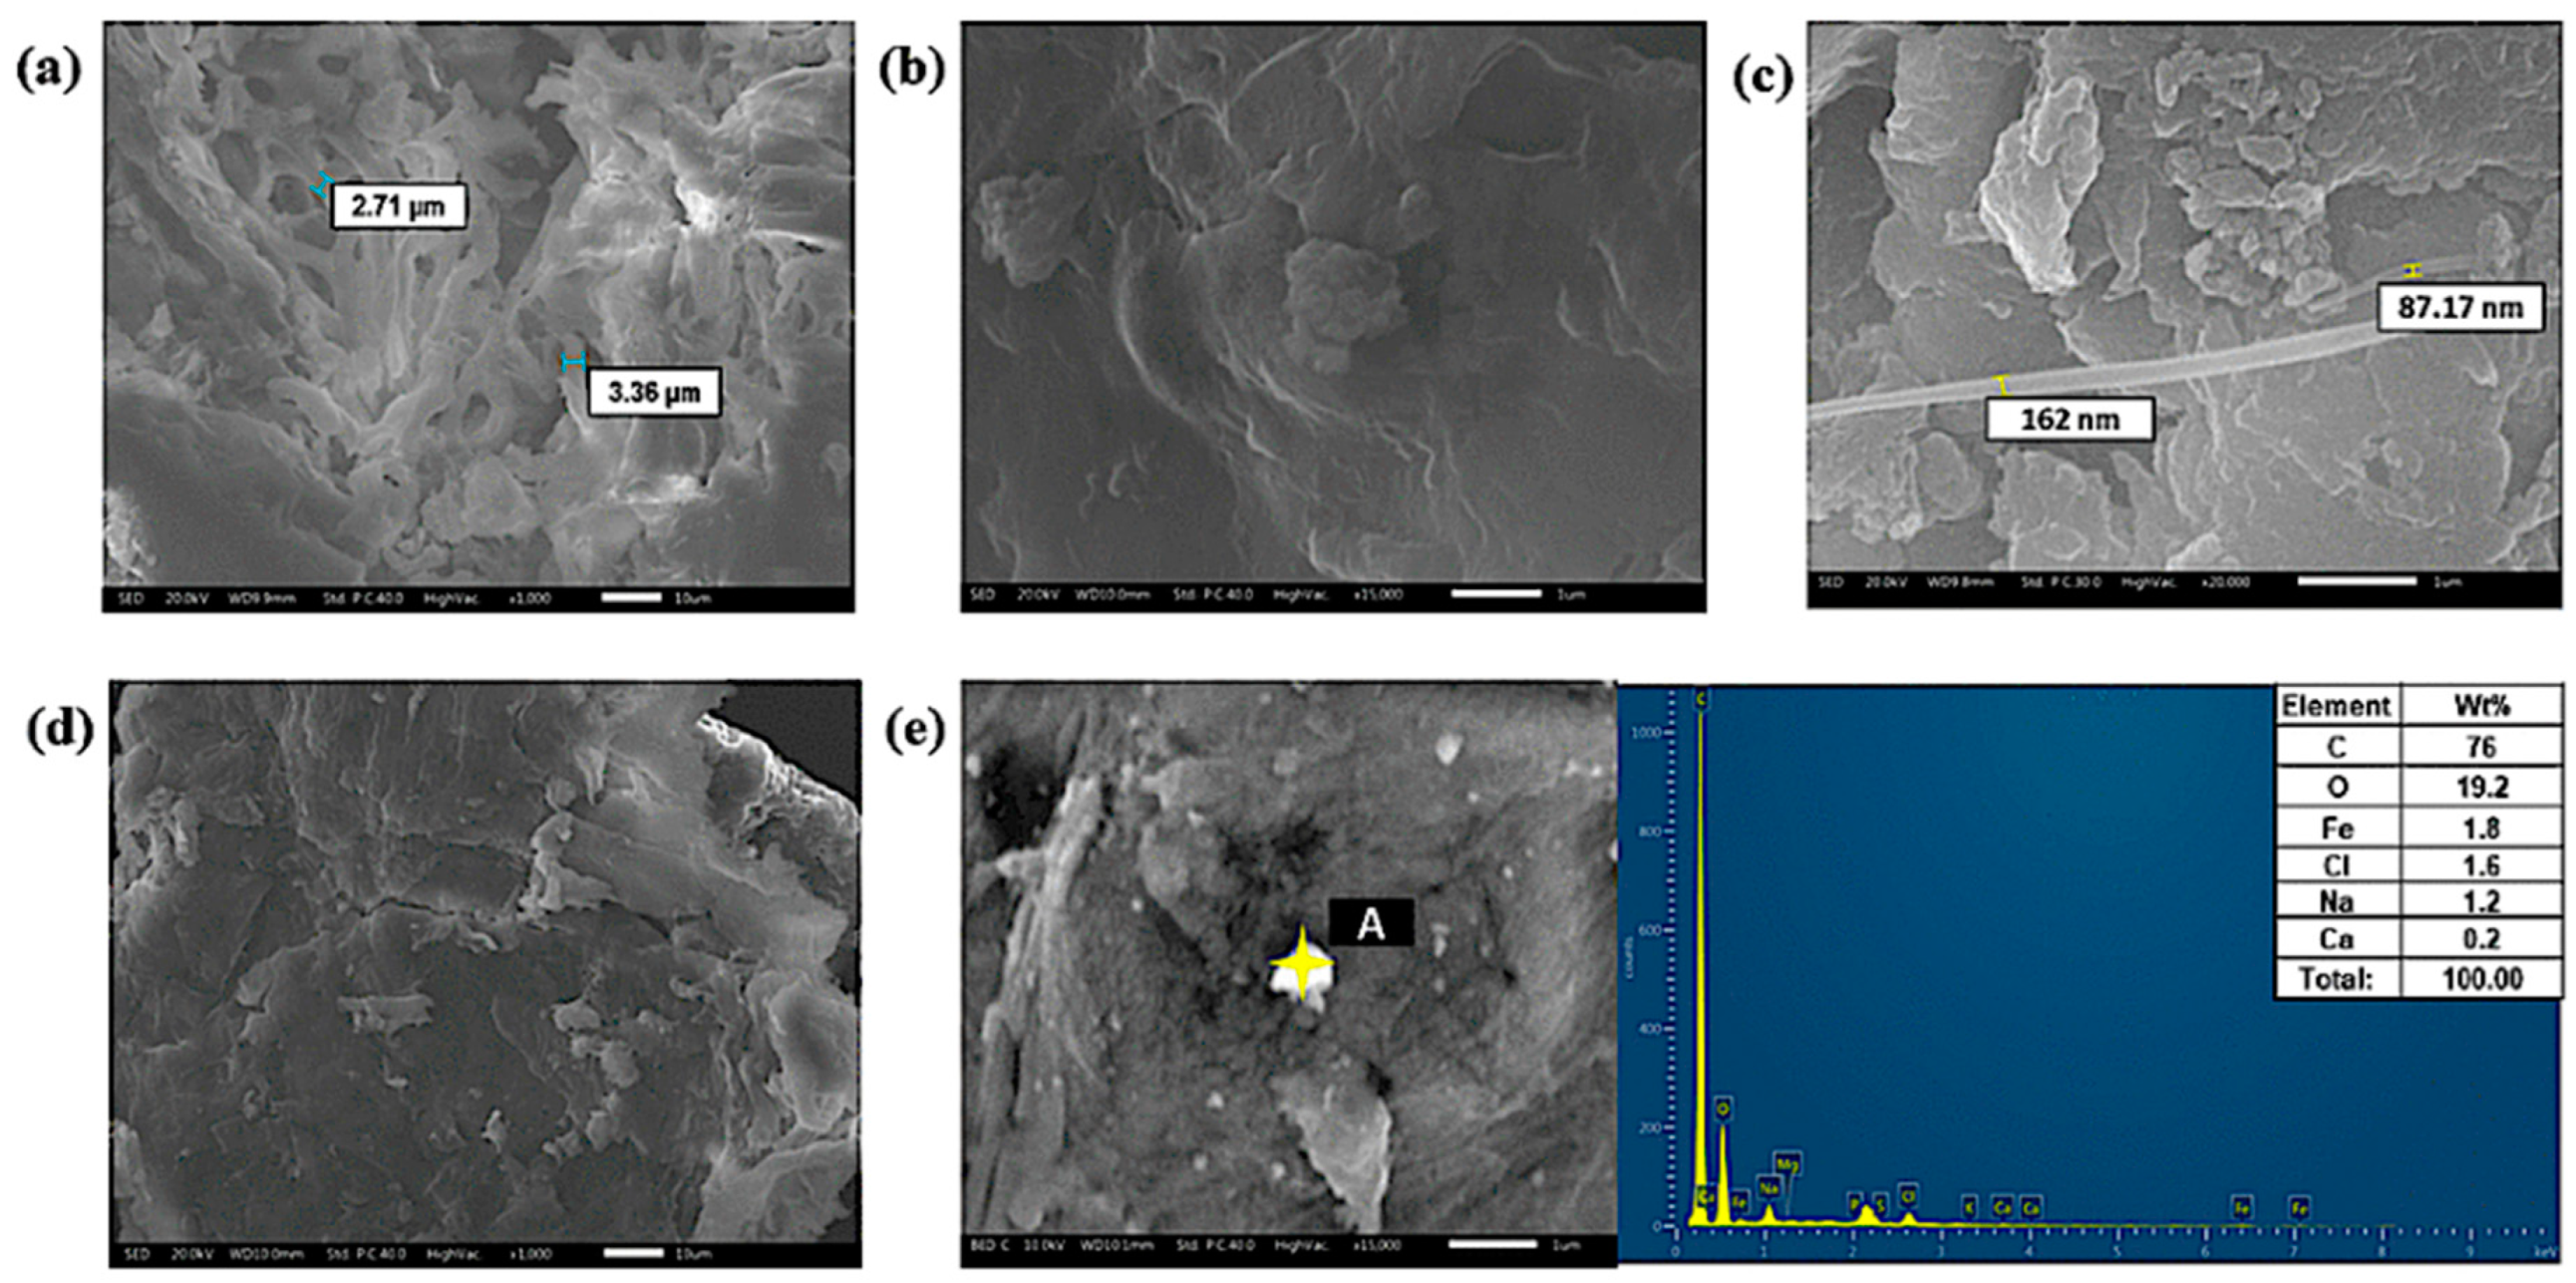
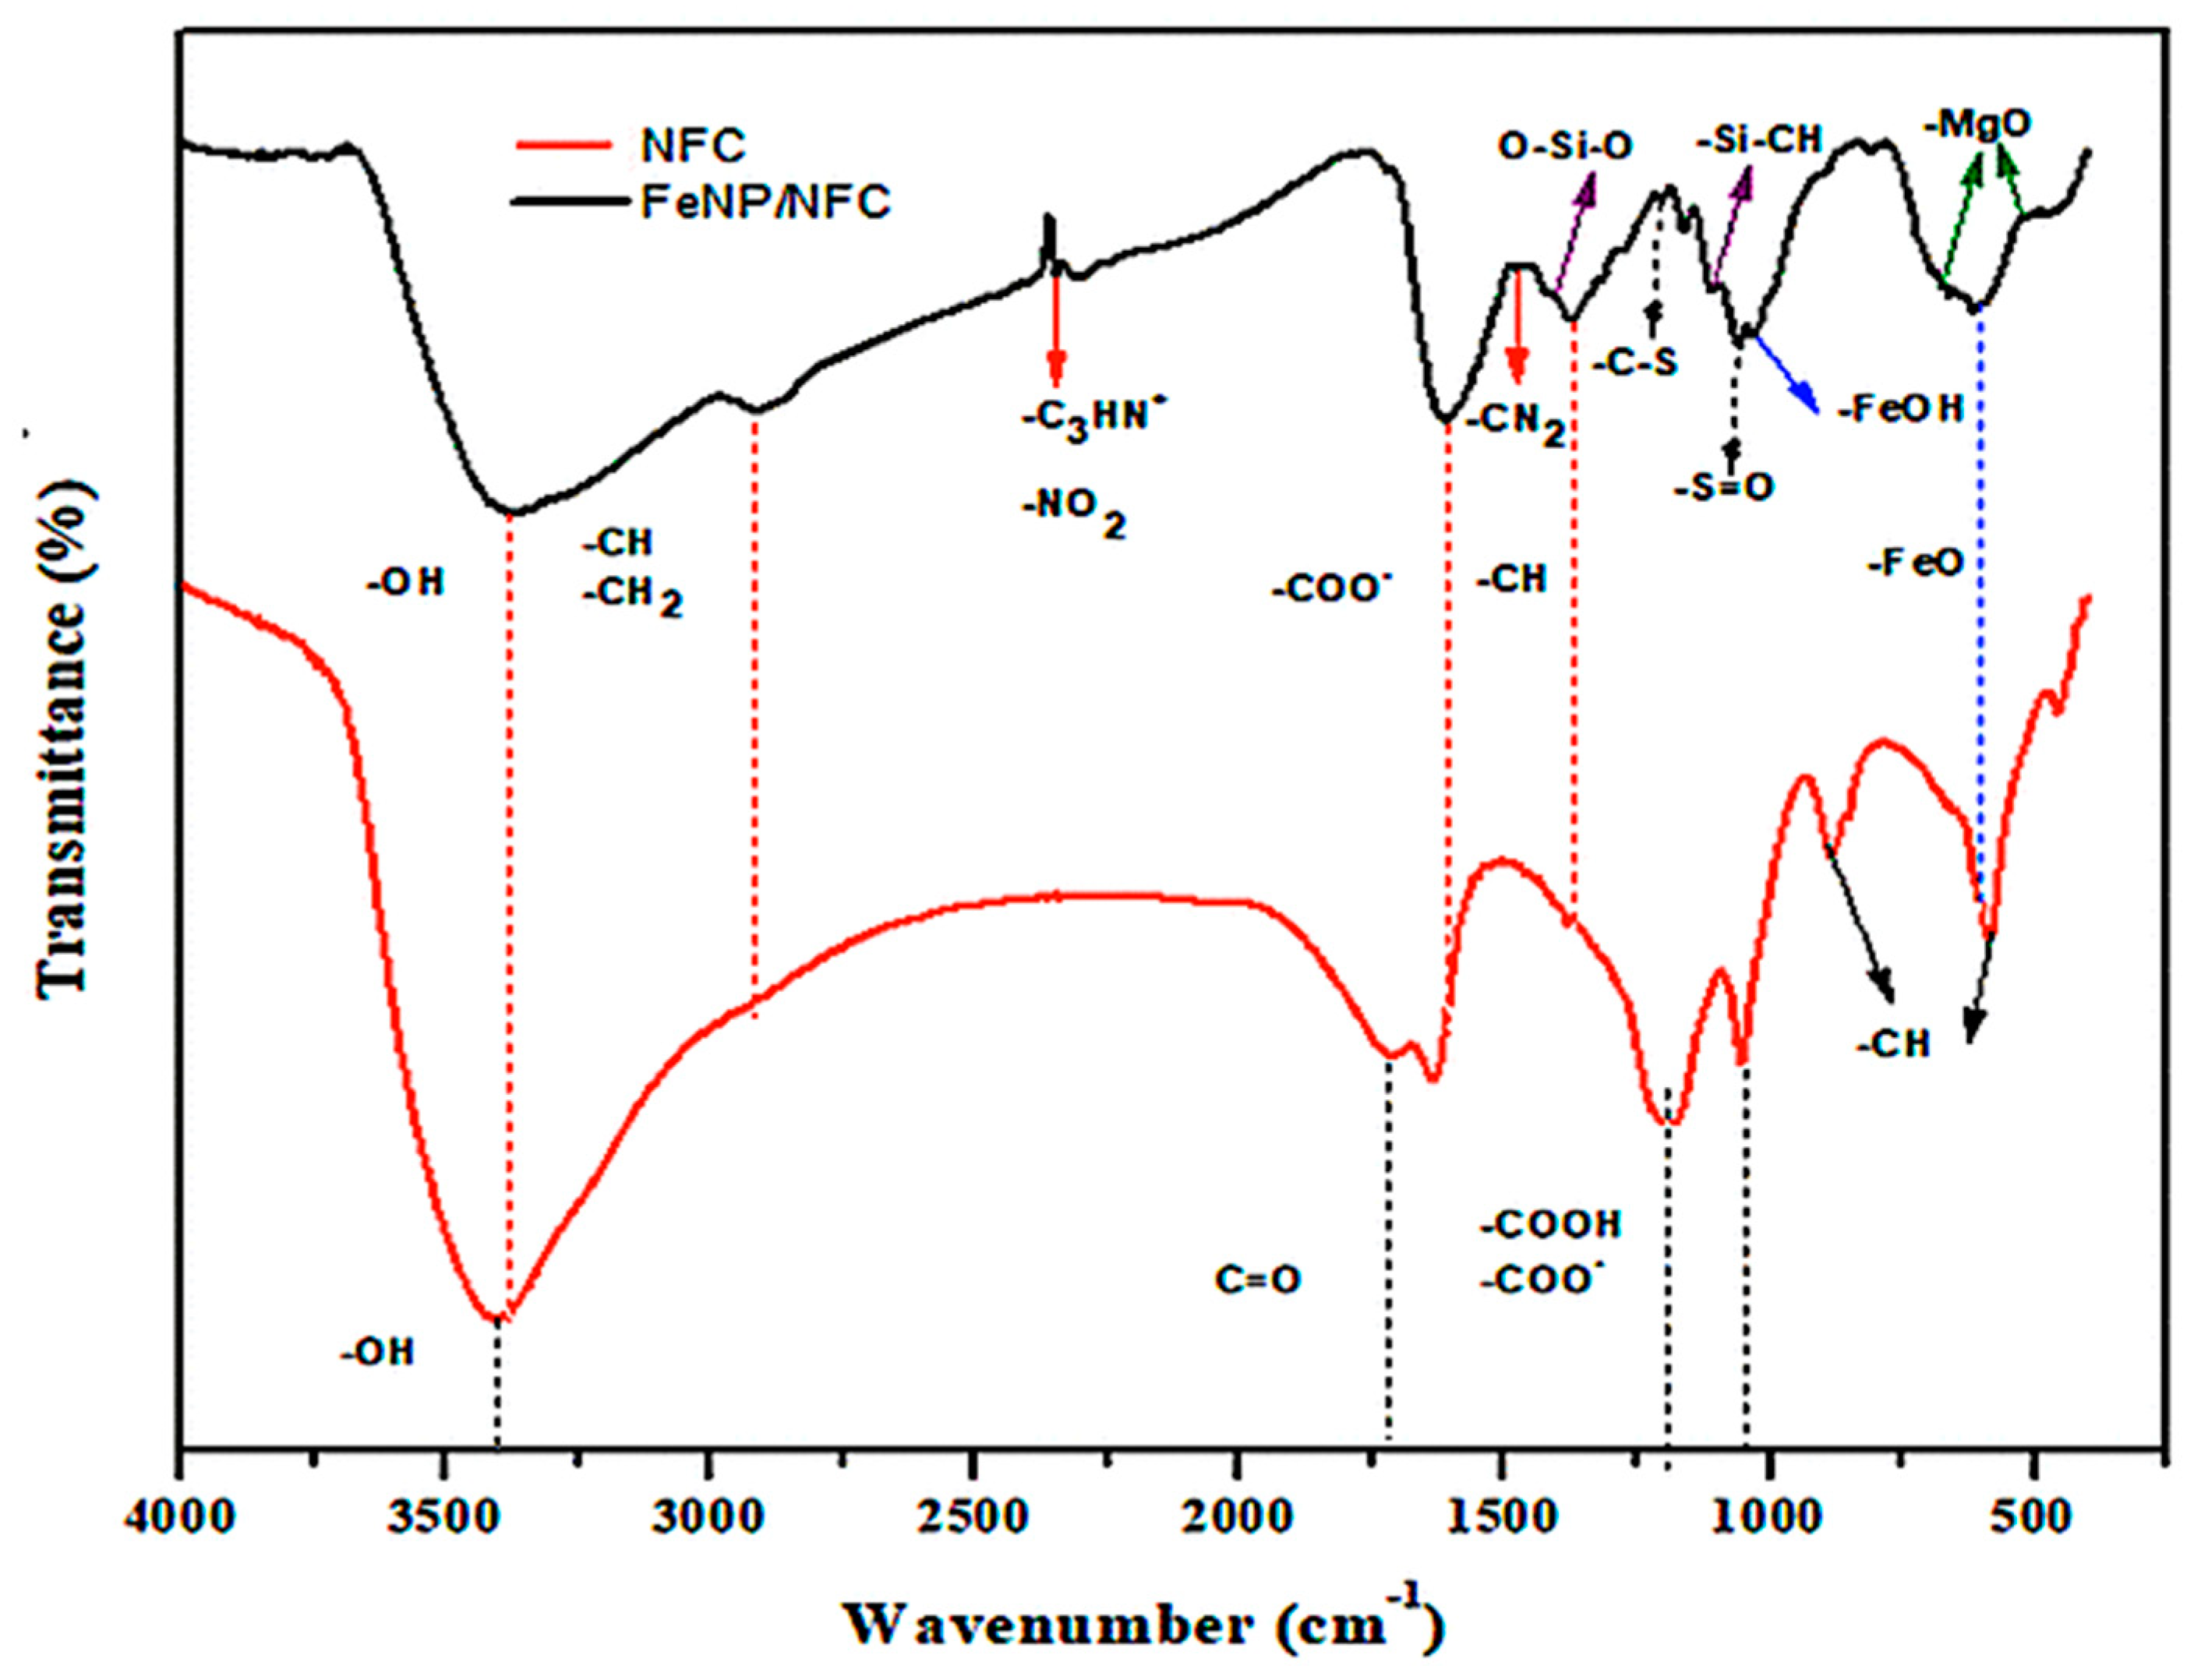
3.1. Characterization of FeNP/NFC Composite
3.2. Adsorption Experiments
3.2.1. Kinetics
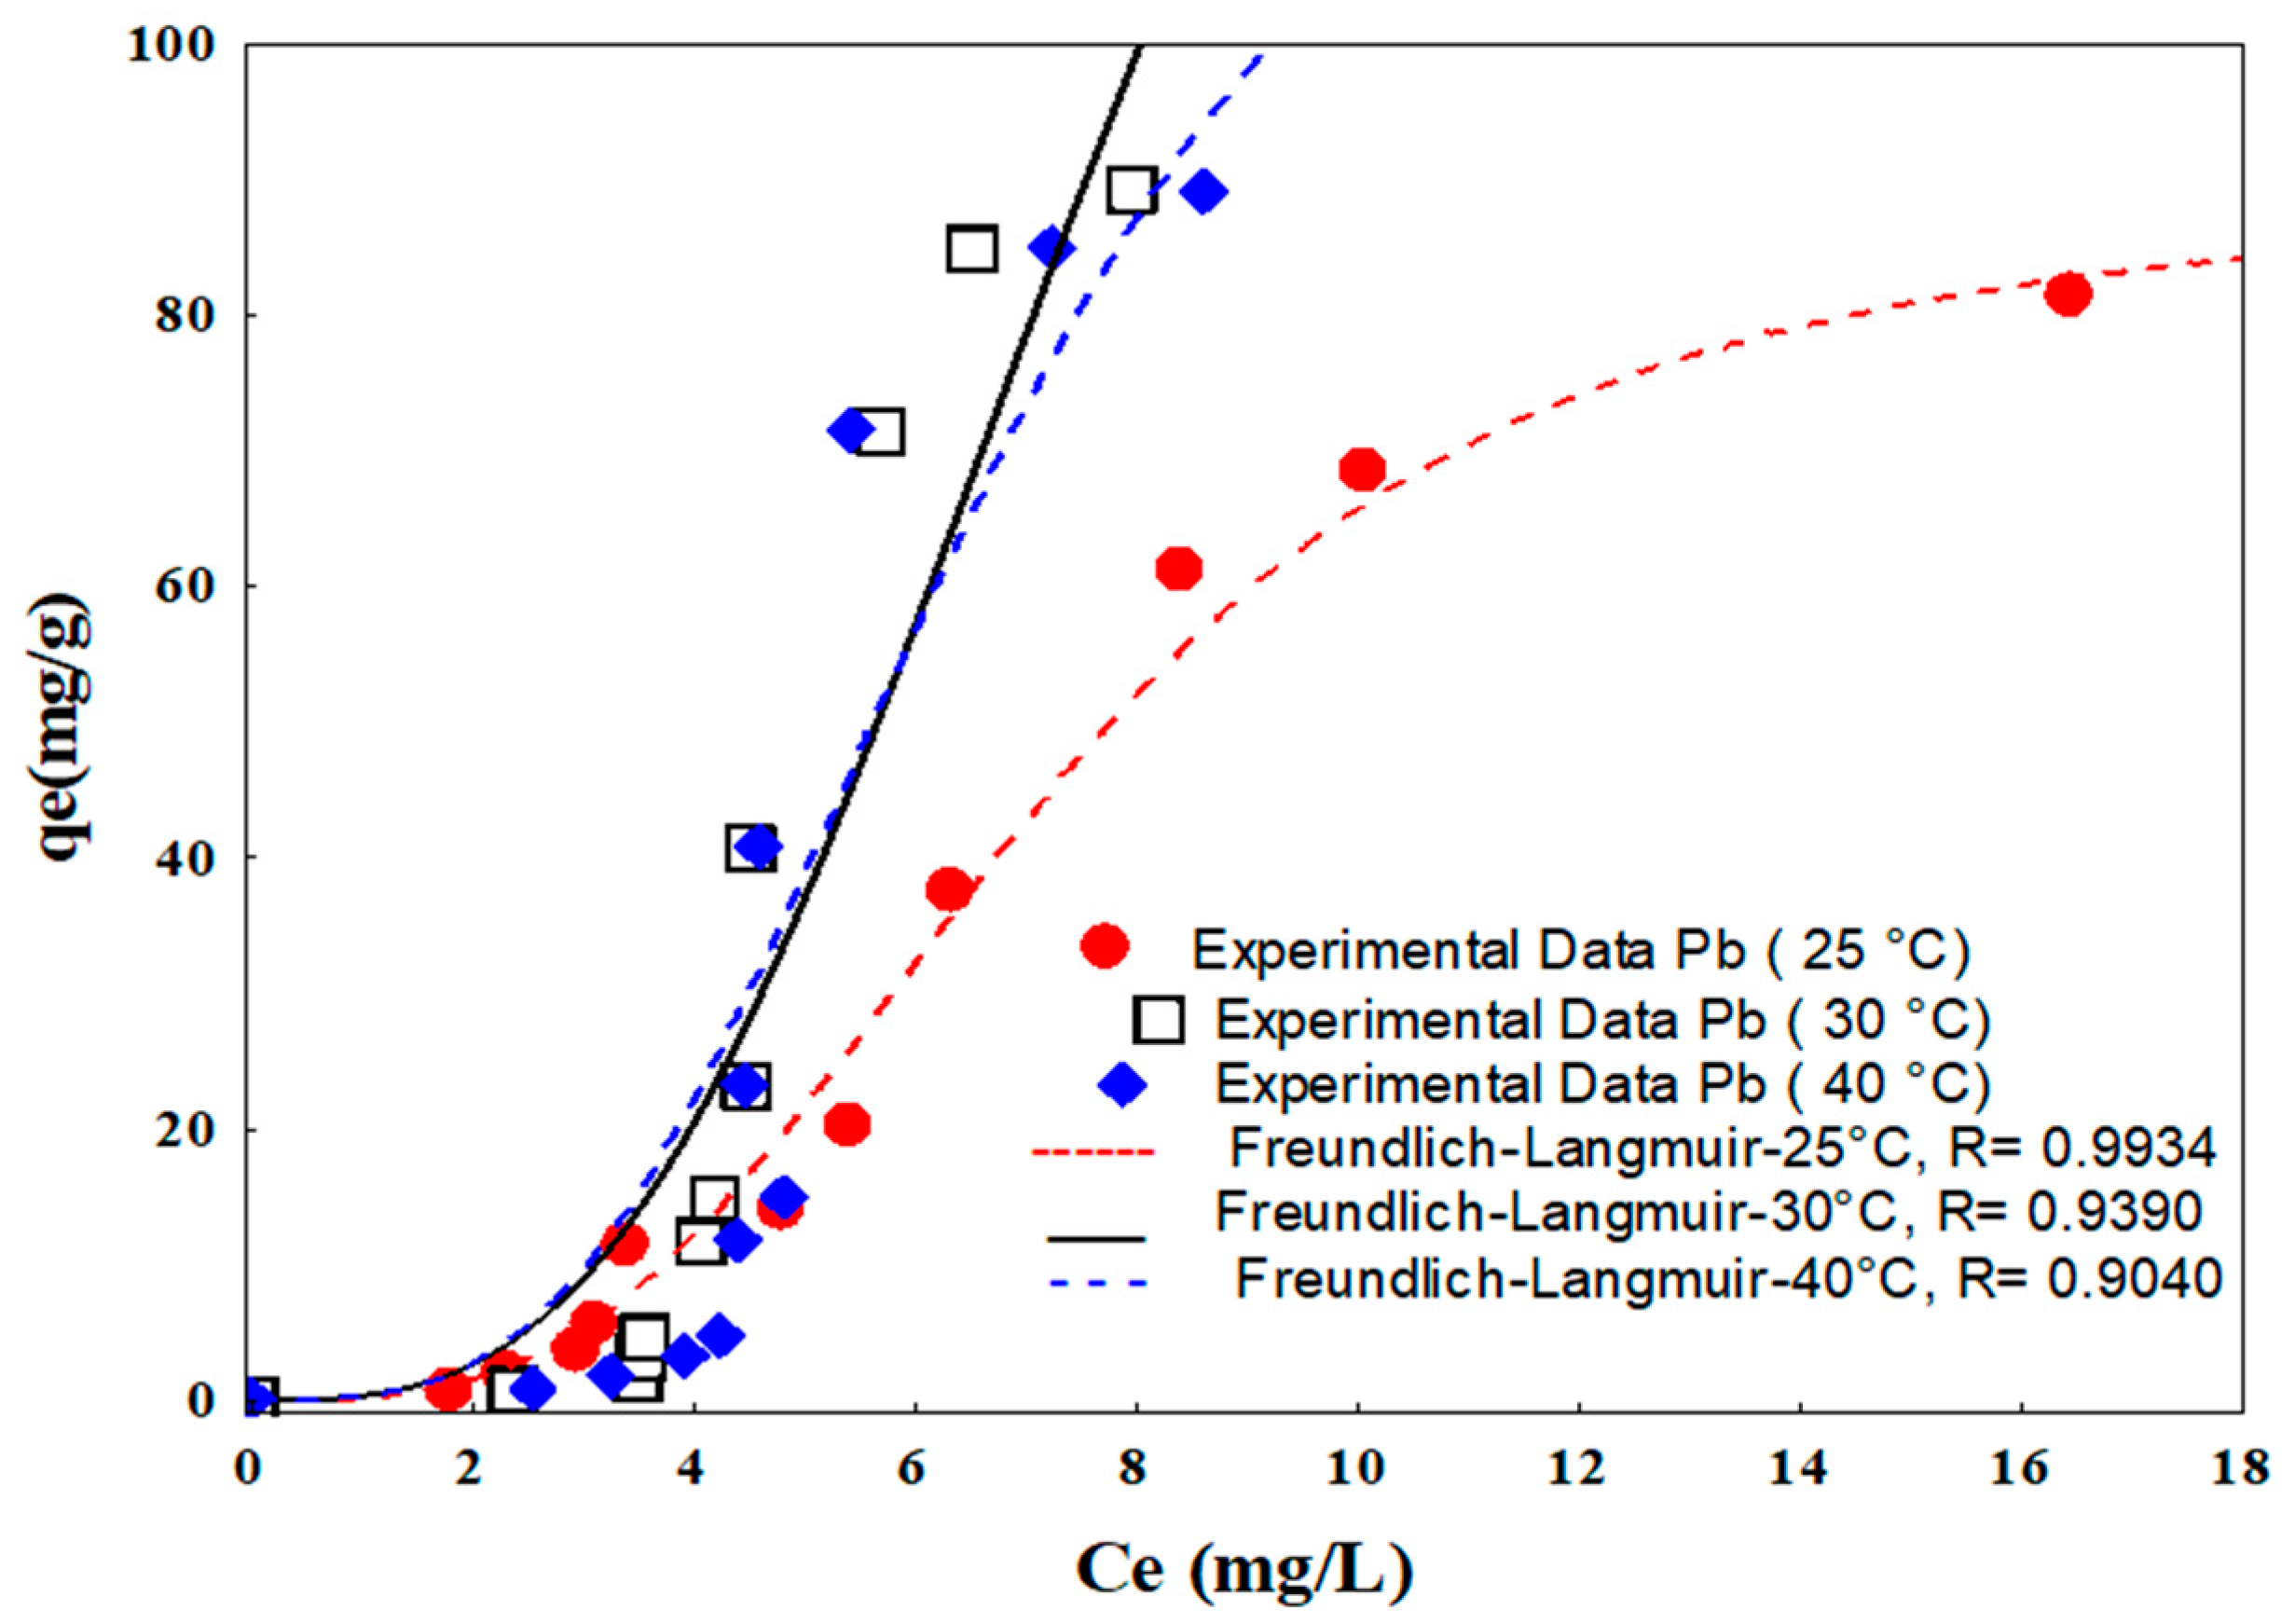
3.2.2. Isotherms

| Adsorbent | qe exp. (mg/g) | Temperature (°C) | pH | Adsorbent Mass (g) | Solution Volume (mL) | Reference | |
|---|---|---|---|---|---|---|---|
| Cd | Pb | ||||||
| FeNP/NFC | 12.538 | 81.406 | 25 | 5 | 0.05 | 10 | This study |
| 13.737 | 89.221 | 30 | 5 | 0.05 | 10 | ||
| 14.489 | 89.088 | 40 | 5 | 0.05 | 10 | ||
| Magnetic Bauhinia | 0.83 | 14.14 | 25 | 5 | 2 | 50 | [4] |
| purpurea (Kaniar) | 0.86 | 1.02 | 30 | ||||
| powders | 2.20 | 1.35 | 40 | ||||
| Biochar (waste agro-industry) FeSO4·7H2O | 38.3 to 75.3 | 179-311 | 25 | 5 | 0.04 | 20 | [95] |
| Banana peels | 5.71 | 2.18 | 25 | 3 | 1.5 | 50 | [96] |
| Polymer-modified magnetic nanoparticles | 29.6 | 3.103 | 25 | 1 to 8 | 0.05 | 50 | [97] |
| Chitosan/iron oxide nanocomposite | 4.106 | 3.795 | 25 | 3 | 0.05 | 20,000 | [98] |
| Sugar beet pulp | 0.98 | 1.00 | 25 | 5 | 0.4 | 20 | [99] |
| Sawdust (Fe3O4/SC) | 63 | -- | 27 | 6.5 | 0.4 | 50 | [100] |
| 22 | -- | 1.2 | |||||
| 25 | -- | 2 | |||||
| Fe3O4 nanoparticles onto cellulose acetate nanofibers | -- | 44 | 27 | 6 | 0.1 | 50 | [101] |
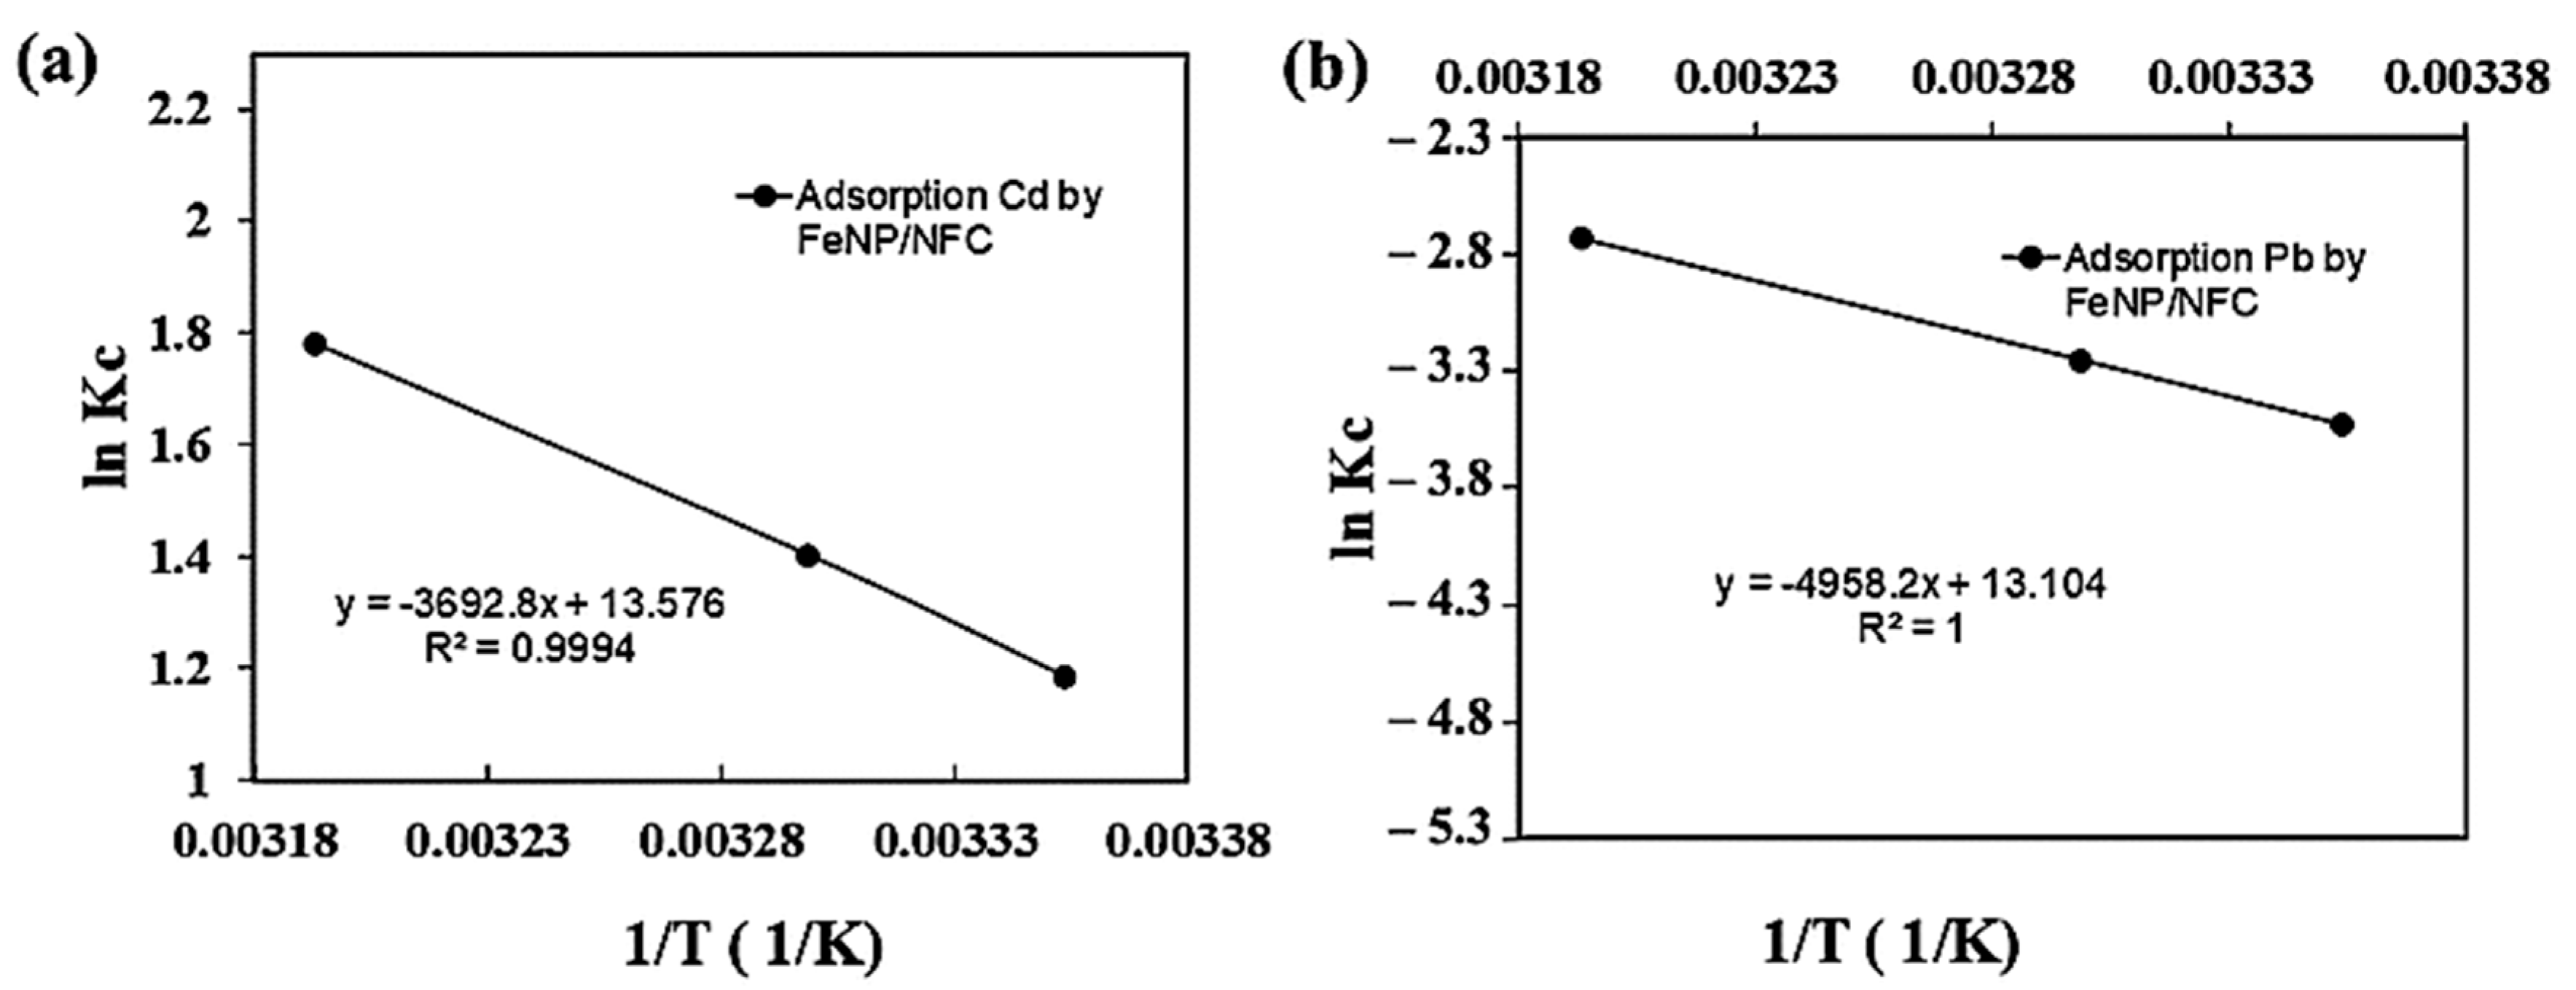
3.3. Thermodynamic Parameters
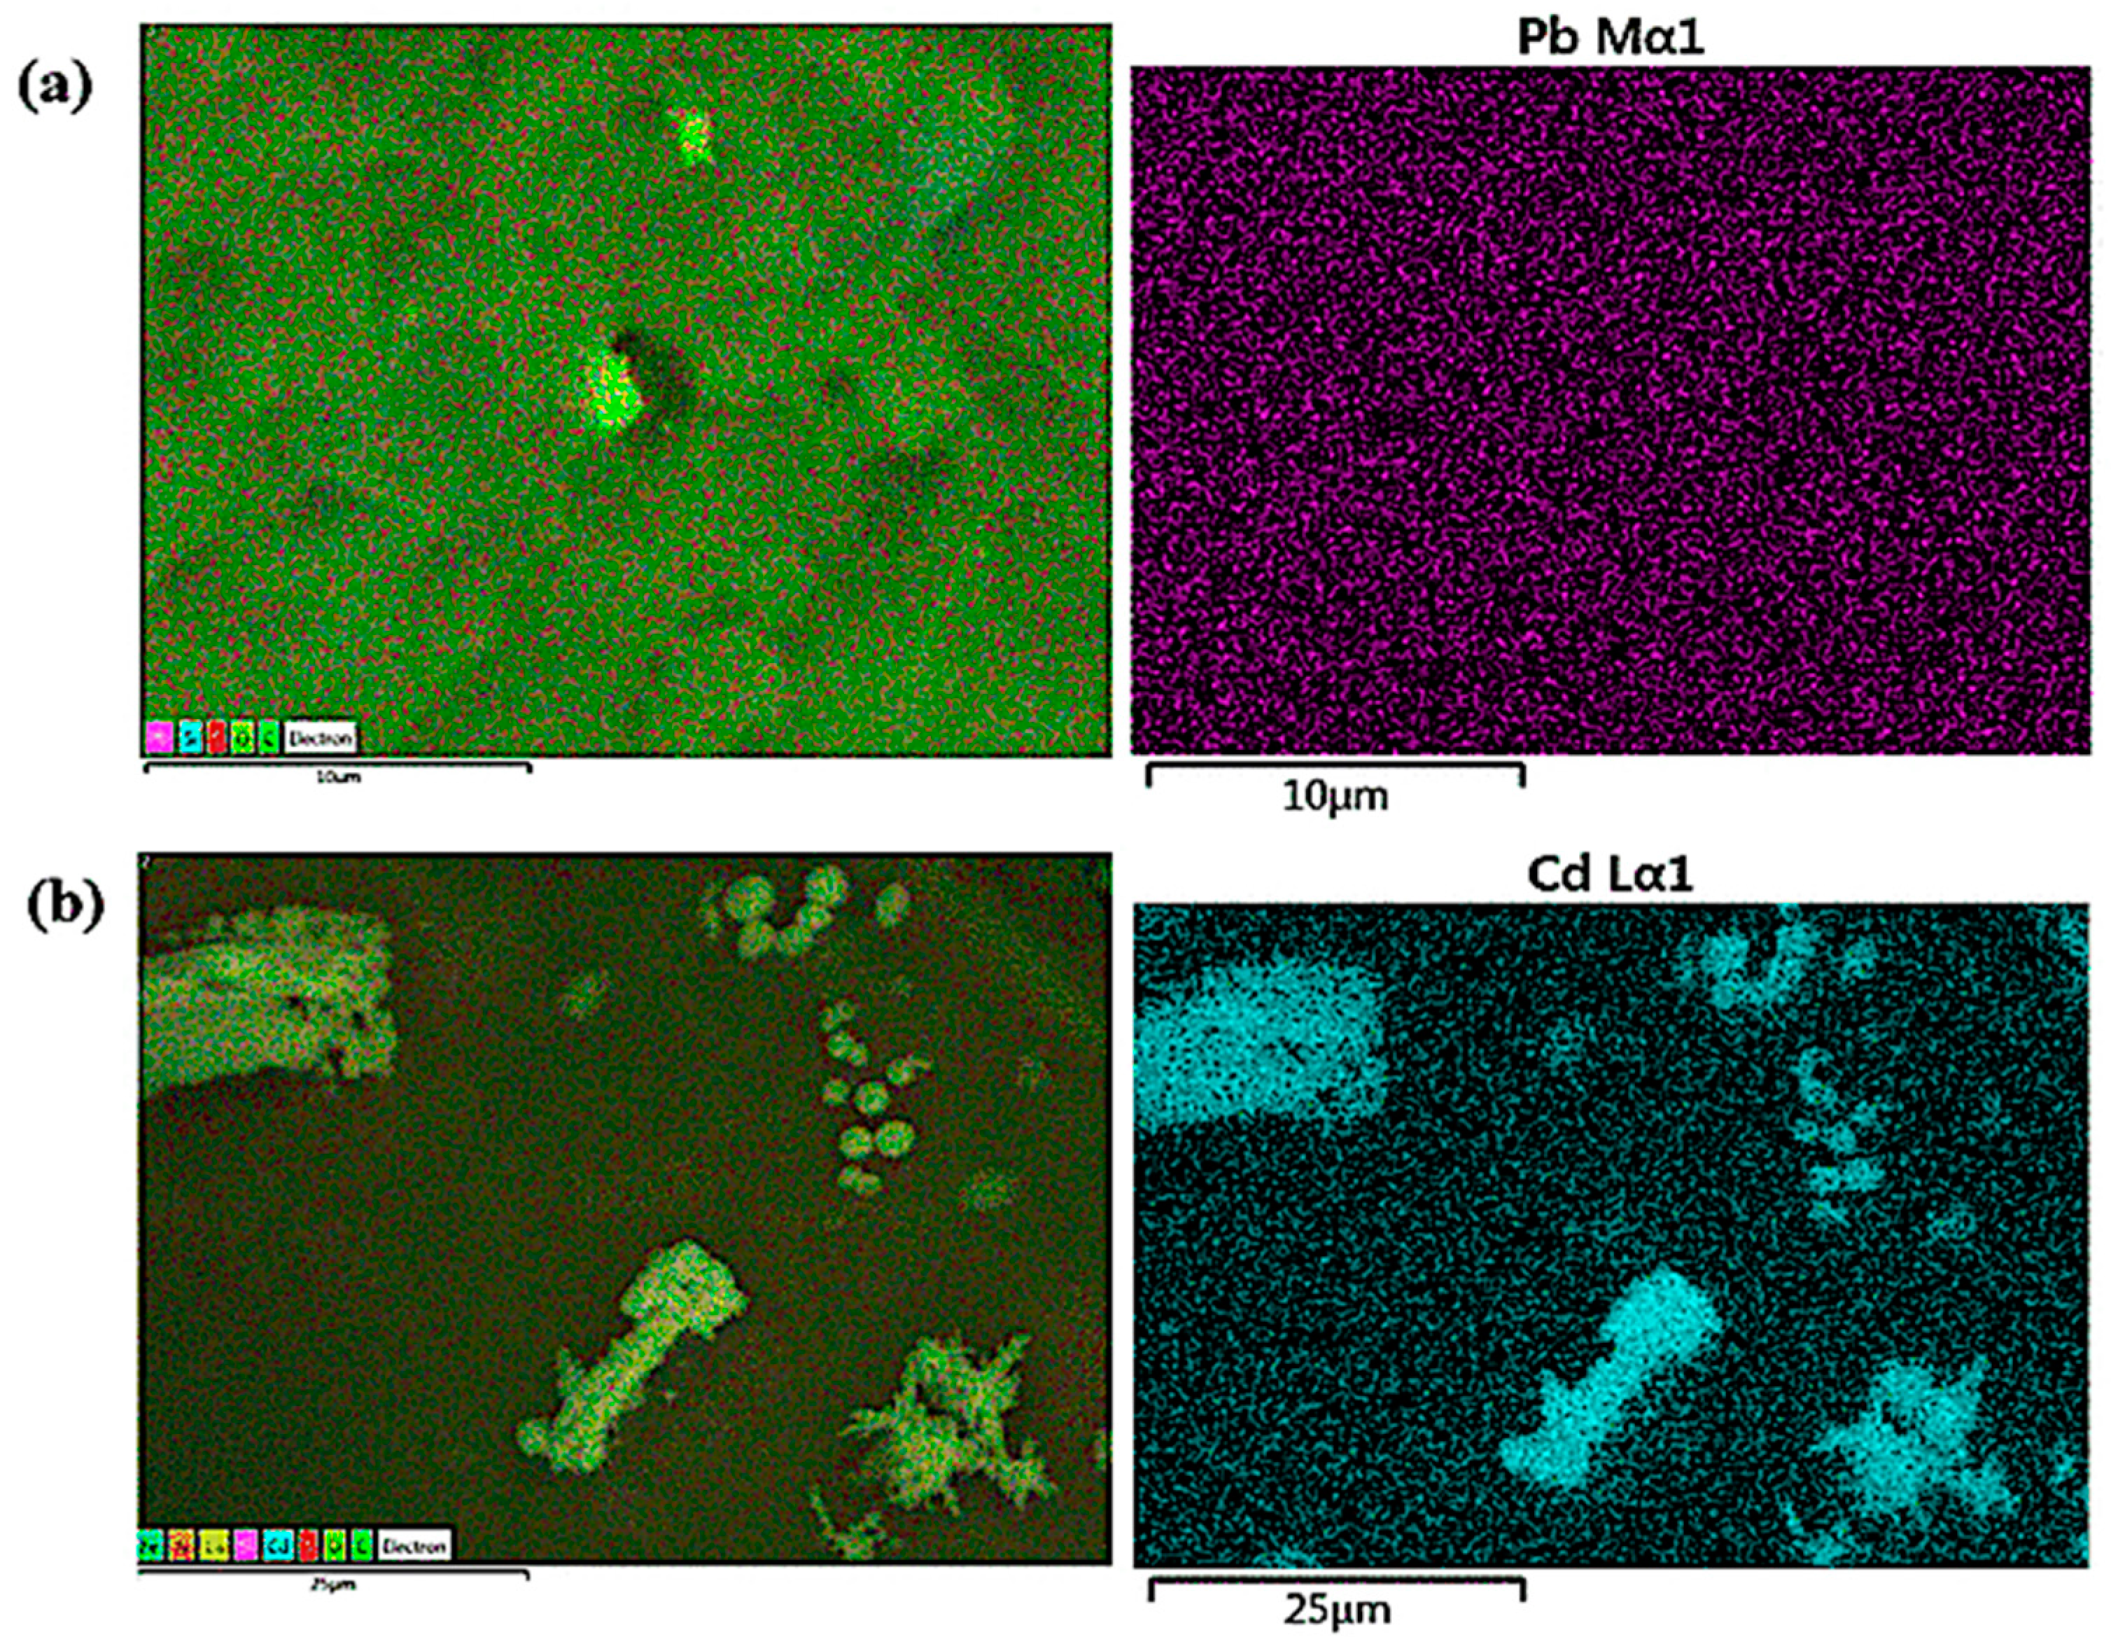
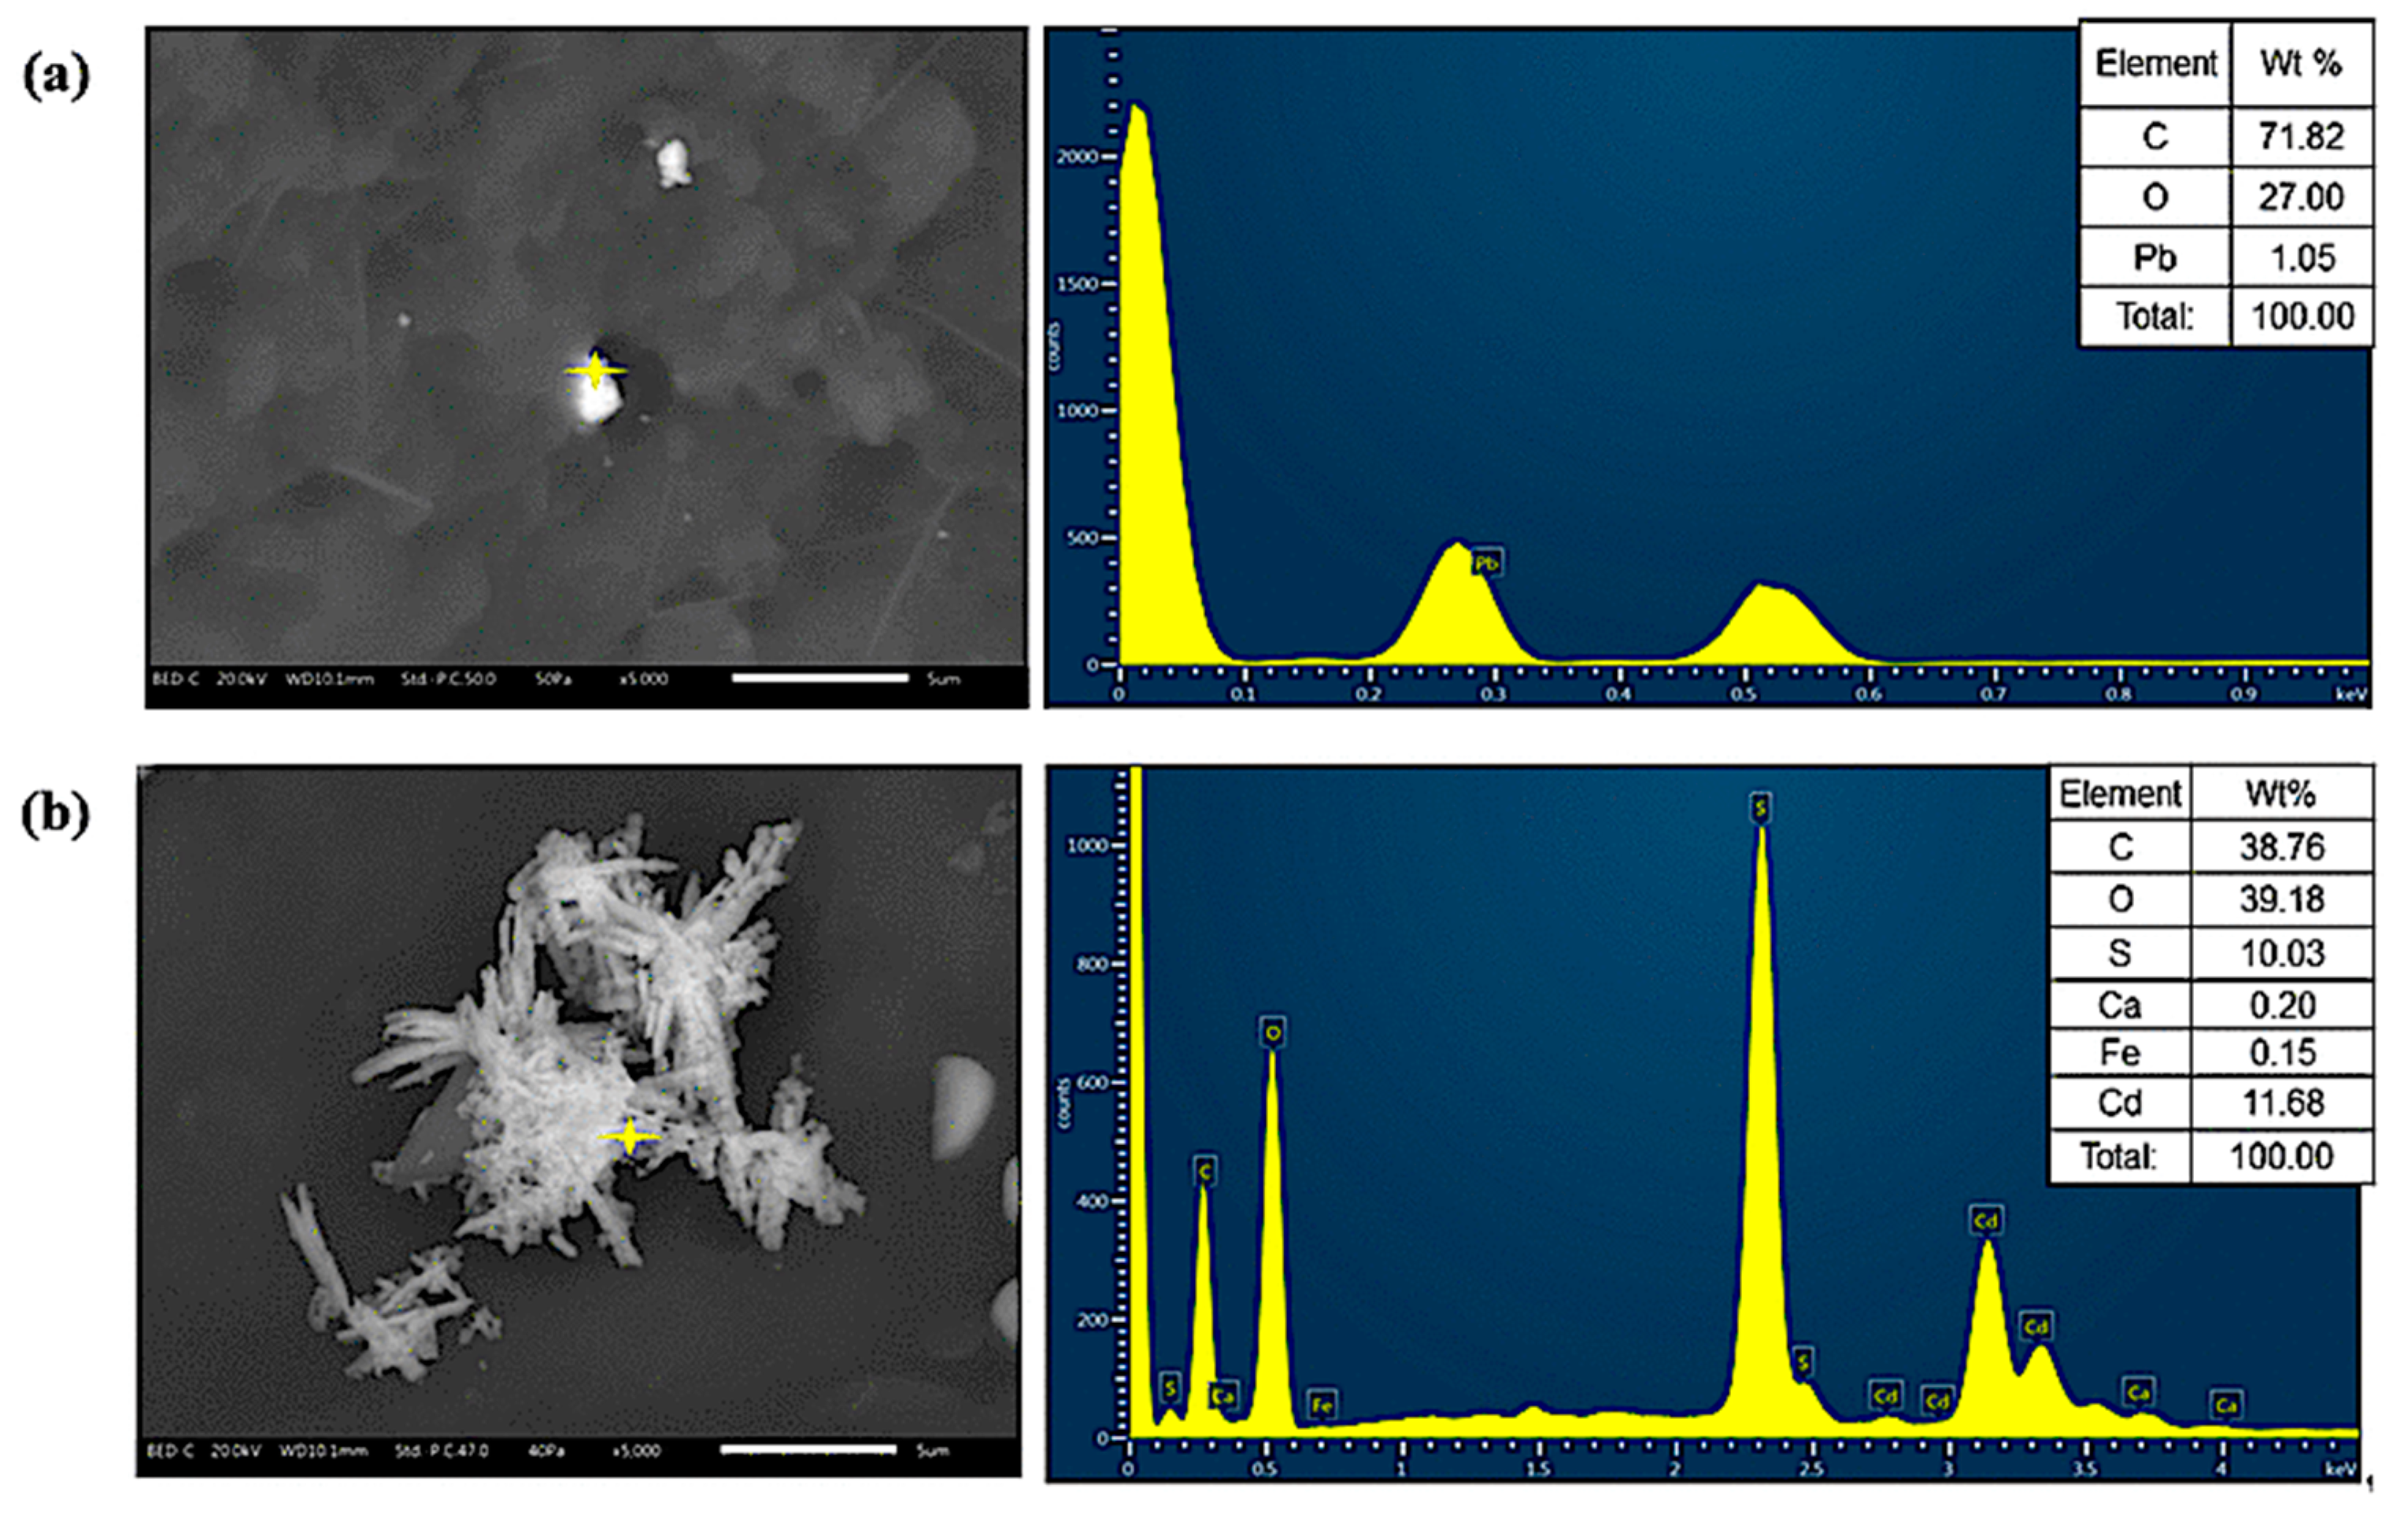
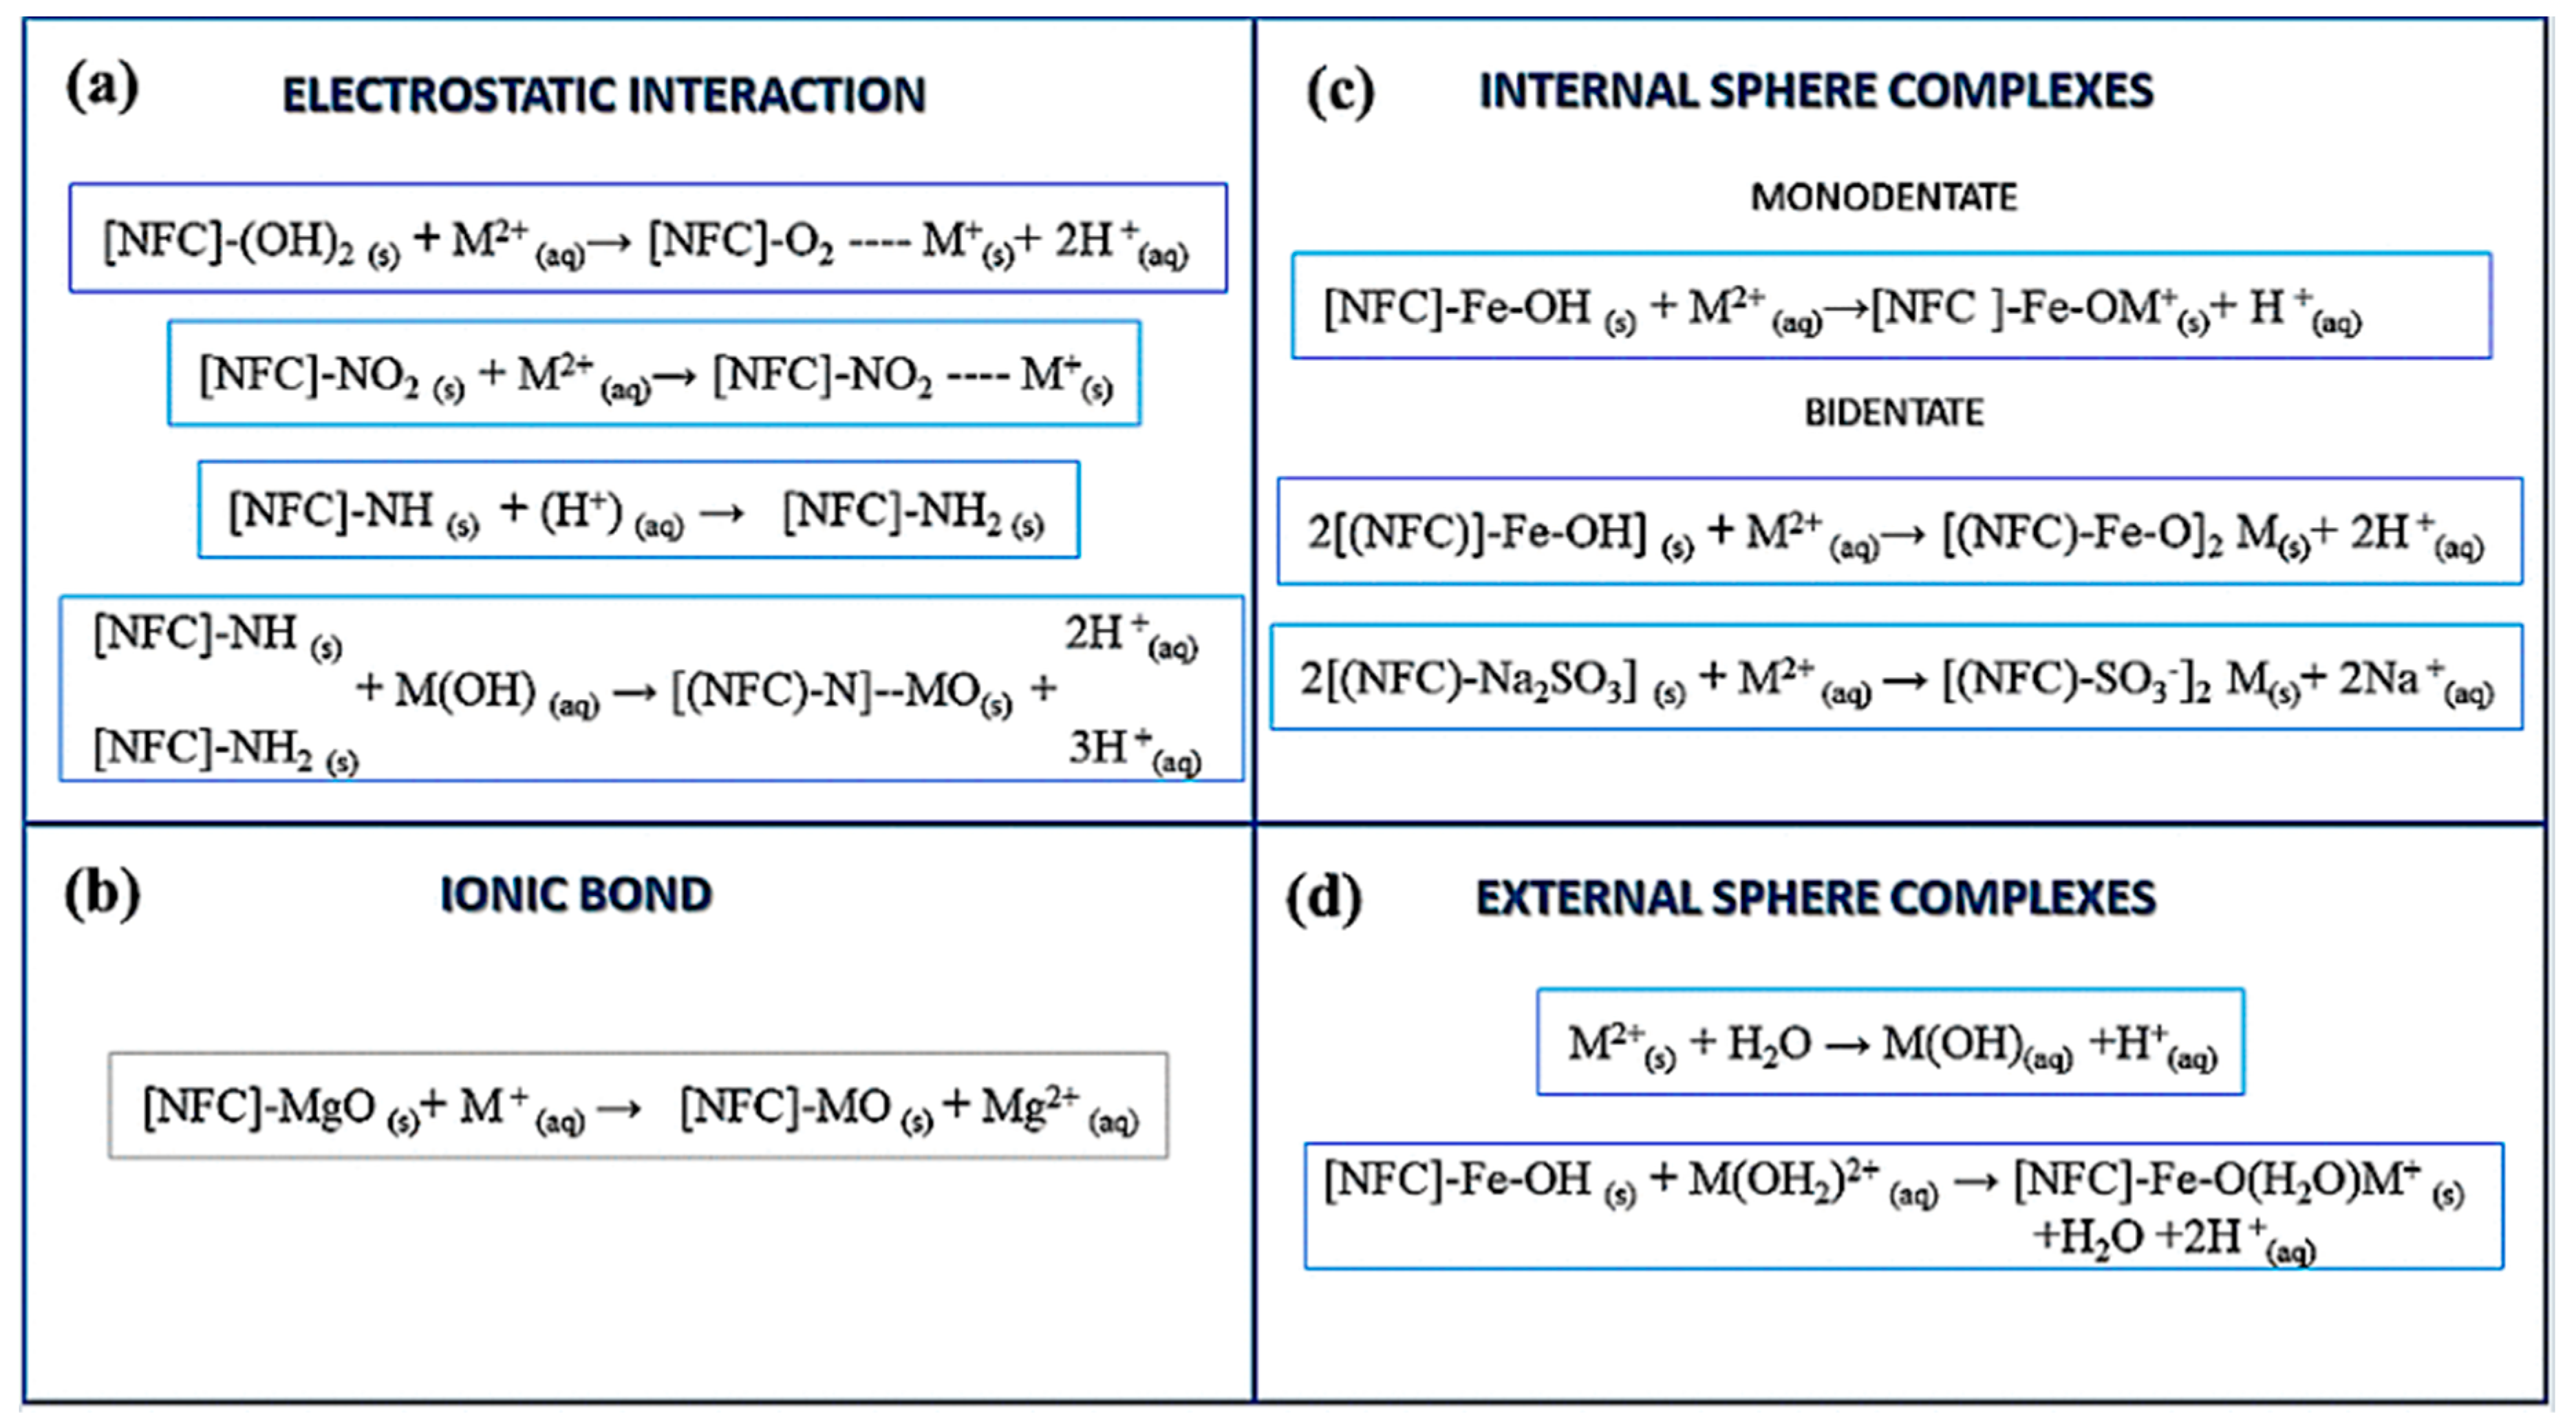
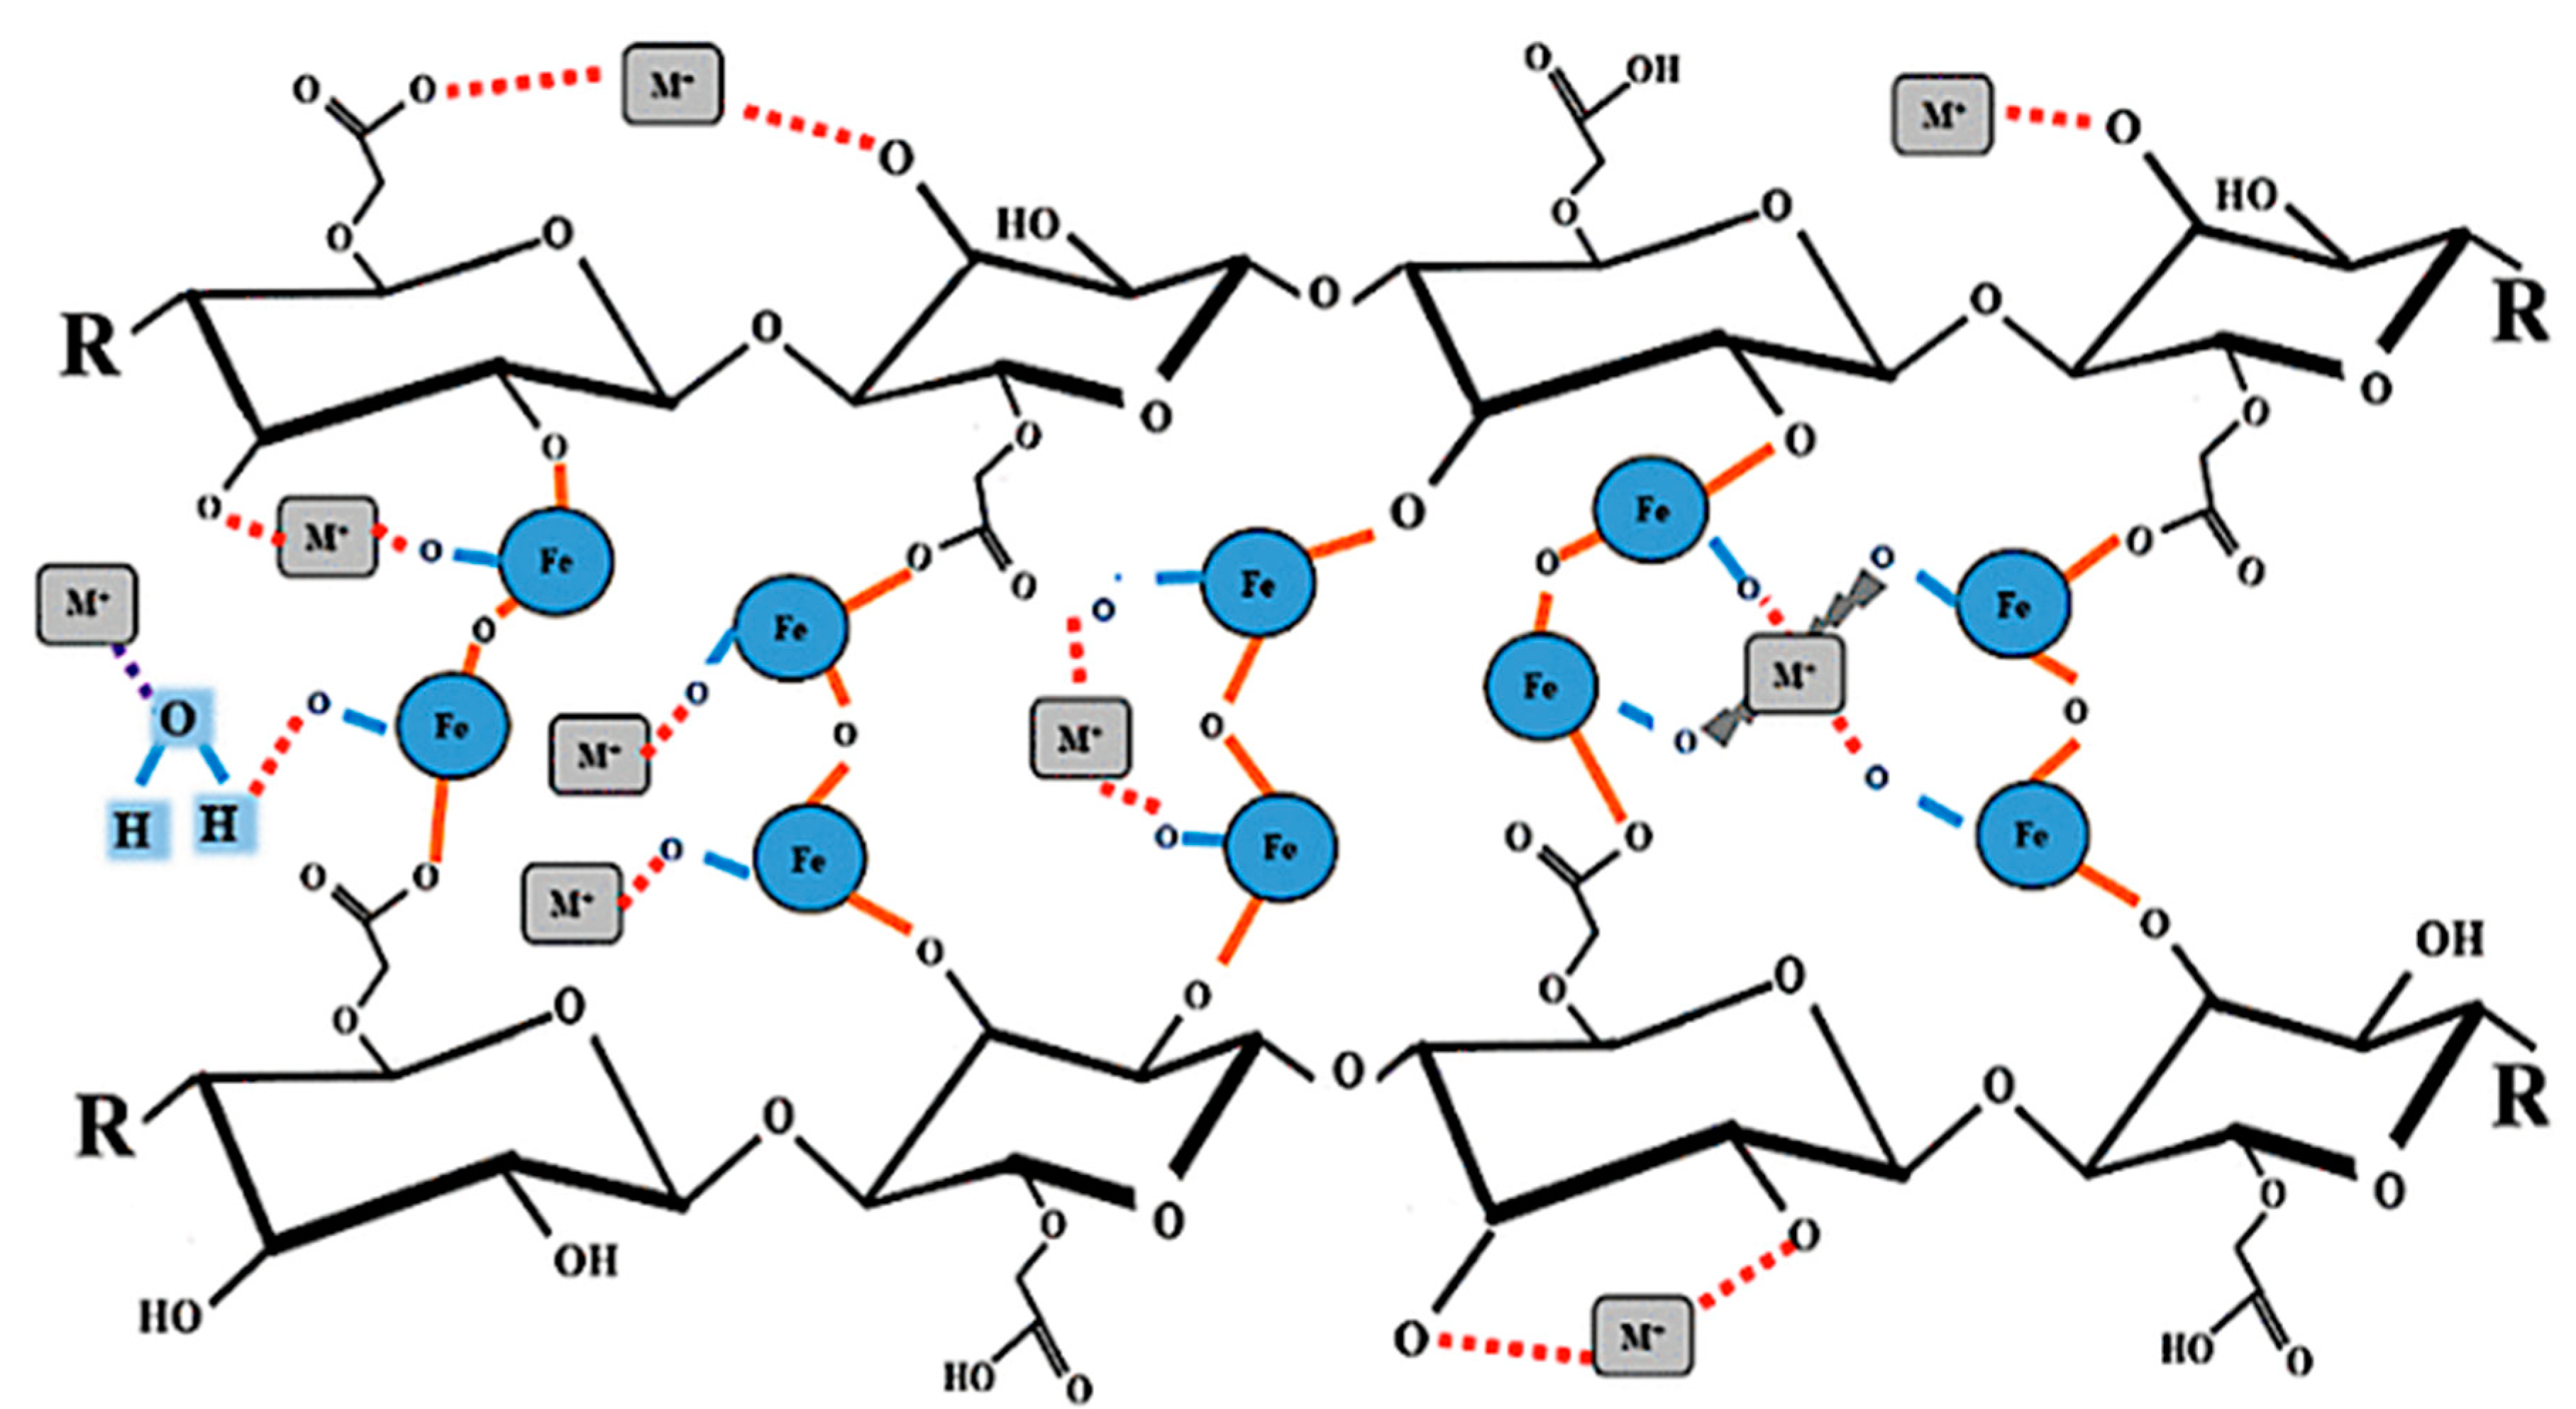
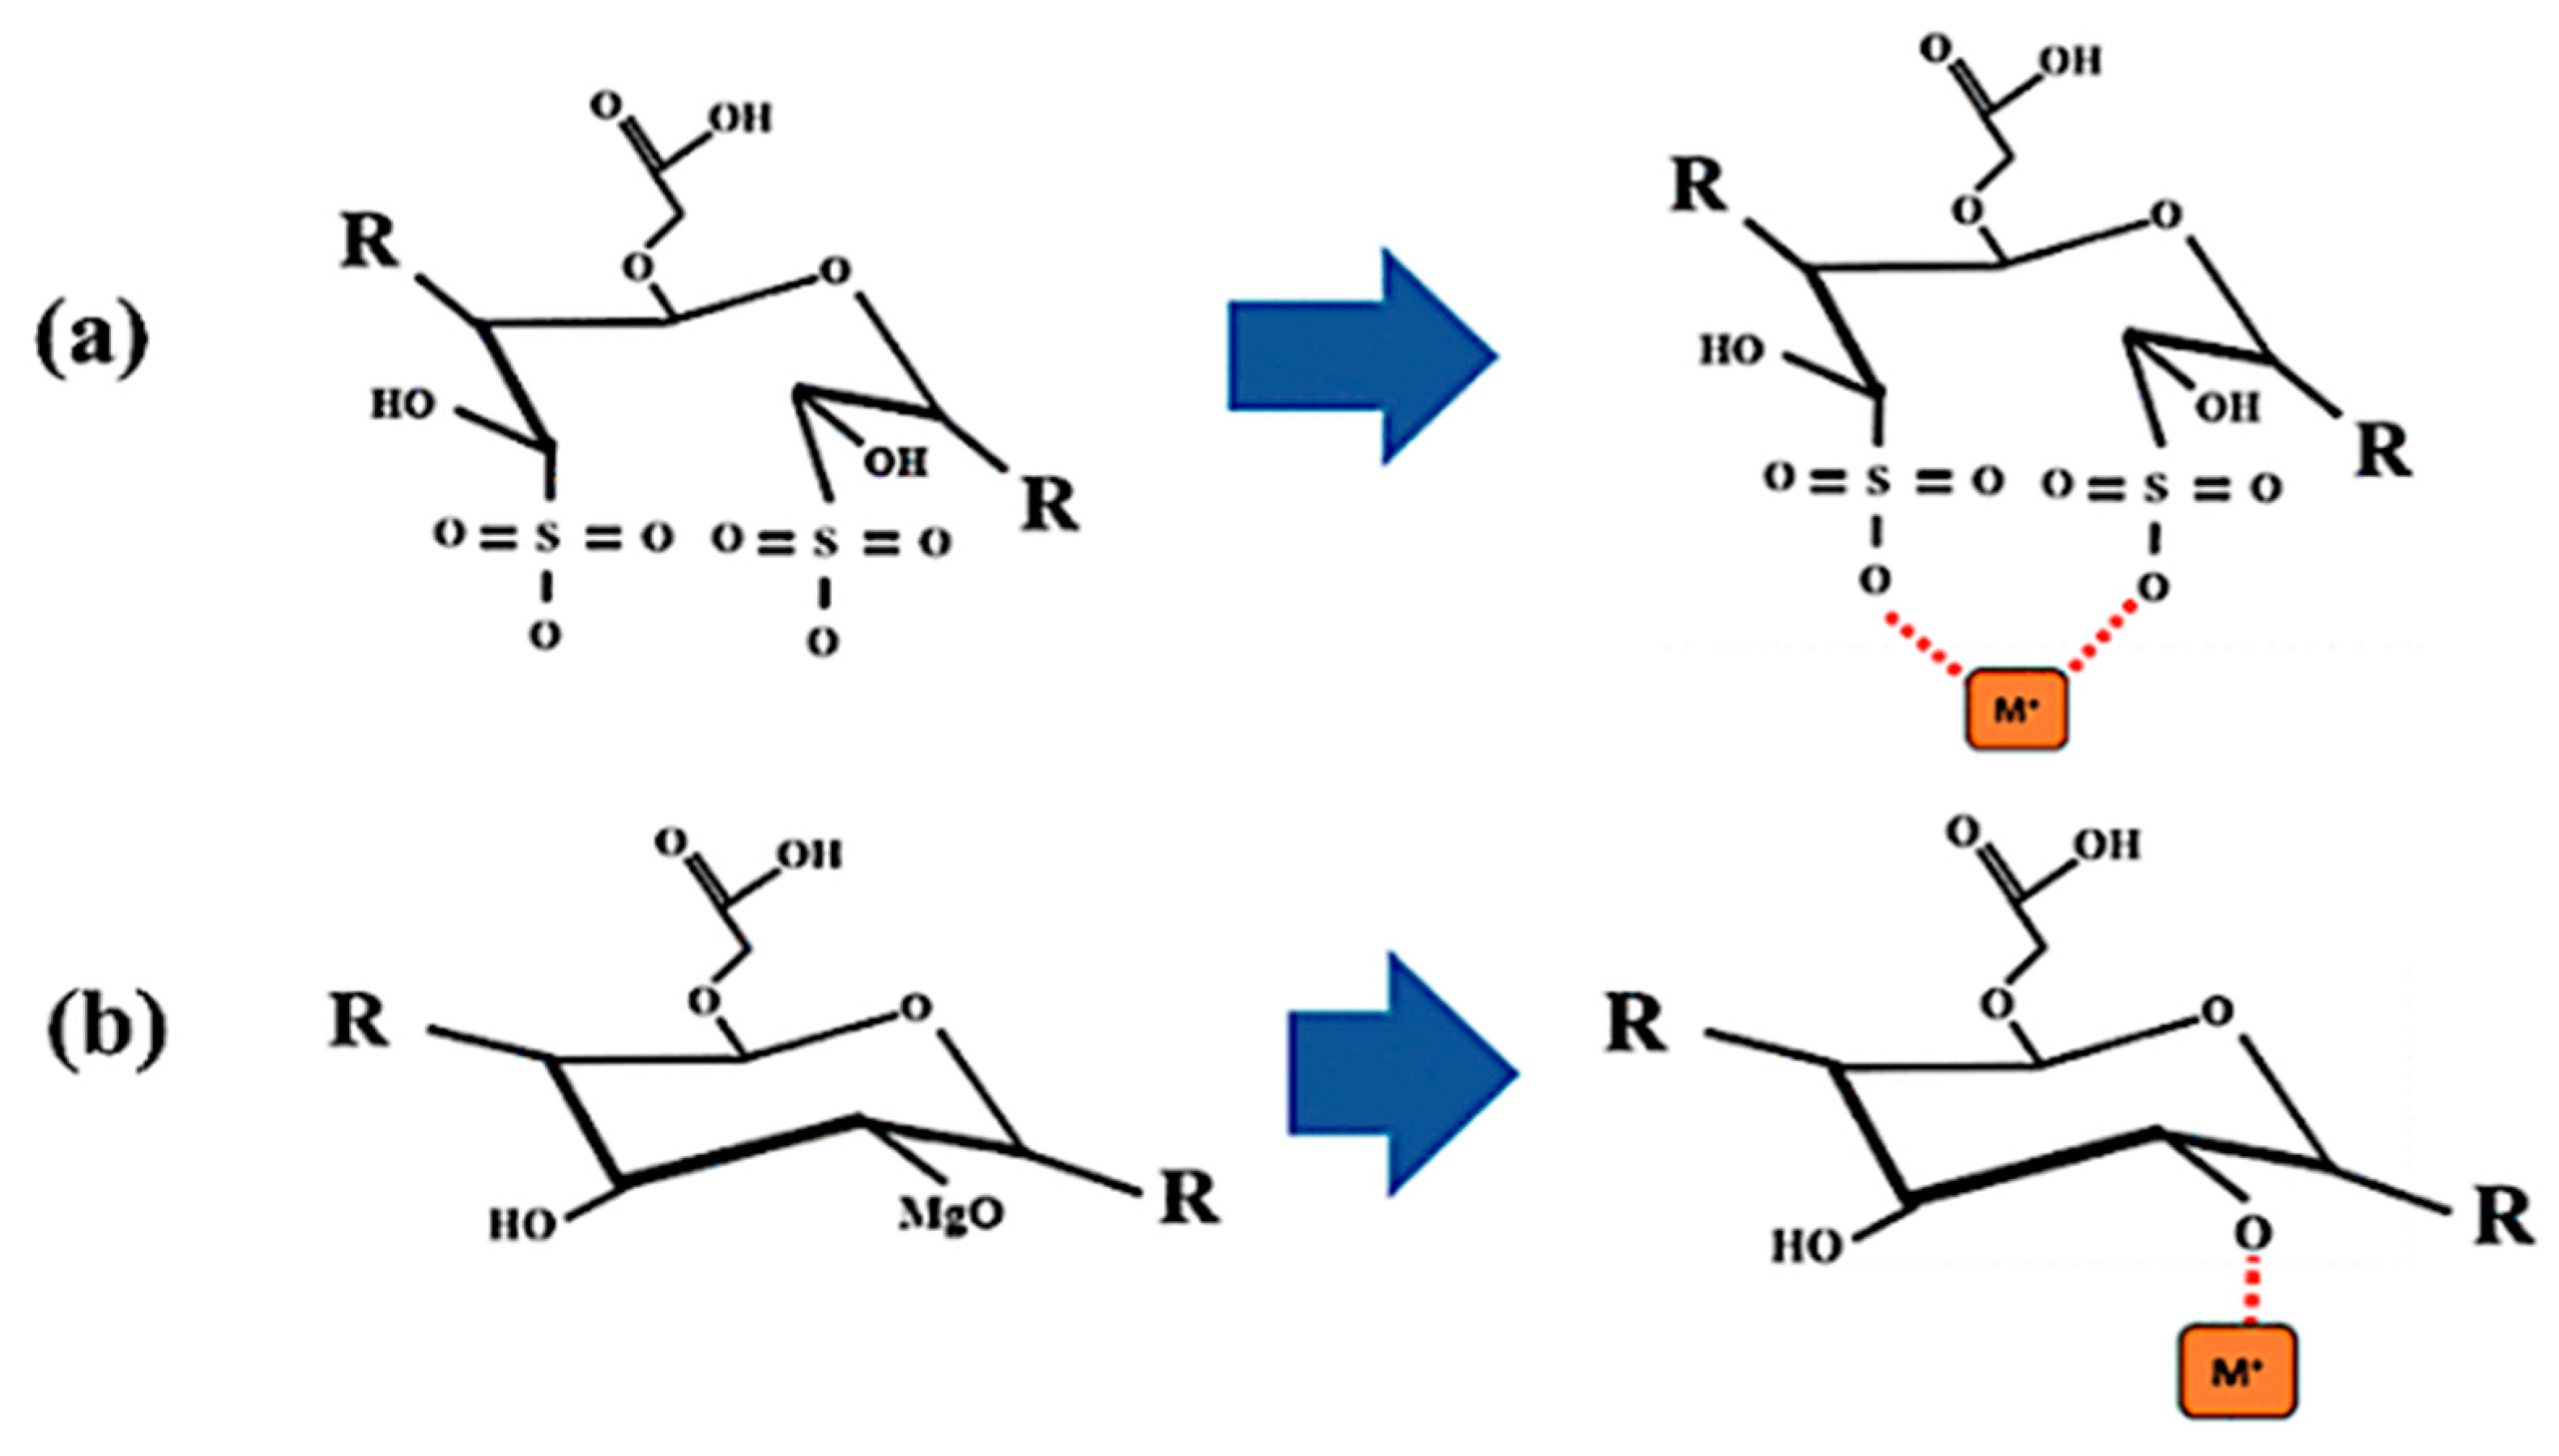
3.4. Adsorption Mechanism
4. Conclusions
Author Contributions
Funding
Institutional Review Board Statement
Informed Consent Statement
Acknowledgments
Conflicts of Interest
References
- Riani, E.; Cordova, M.R.; Arifin, Z. Heavy Metal Pollution and Its Relation to the Malformation of Green Mussels Cultured in Muara Kamal Waters, Jakarta Bay, Indonesia. Mar. Pollut. Bull. 2018, 133, 664–670. [Google Scholar] [CrossRef] [PubMed]
- Fijałkowska, G.; Szewczuk-Karpisz, K.; Wiśniewska, M. Chromium(VI) and Lead(II) Accumulation at the Montmorillonite/Aqueous Solution Interface in the Presence of Polyacrylamide Containing Quaternary Amine Groups. J. Mol. Liq. 2019, 293, 111514. [Google Scholar] [CrossRef]
- Kumari, M.; Pittman, C.U.; Mohan, D. Heavy Metals [Chromium (VI) and Lead (II)] Removal from Water Using Mesoporous Magnetite (Fe3O4) Nanospheres. J. Colloid Interface Sci. 2015, 442, 120–132. [Google Scholar] [CrossRef] [PubMed]
- Sharma, R.; Sarswat, A.; Pittman, C.U.; Mohan, D. Cadmium and Lead Remediation Using Magnetic and Non-Magnetic Sustainable Biosorbents Derived from Bauhinia Purpurea Pods. RSC Adv. 2017, 7, 8606–8624. [Google Scholar] [CrossRef]
- Koju, N.K.; Song, X.; Wang, Q.; Hu, Z.; Colombo, C. Cadmium Removal from Simulated Groundwater Using Alumina Nanoparticles: Behaviors and Mechanisms. Environ. Pollut. 2018, 240, 255–266. [Google Scholar] [CrossRef]
- Chen, Z.; Zhang, J.; Huang, L.; Yuan, Z.; Li, Z.; Liu, M. Removal of Cd and Pb with Biochar Made from Dairy Manure at Low Temperature. J. Integr. Agric. 2019, 18, 201–210. [Google Scholar] [CrossRef]
- Jaishankar, M.; Tseten, T.; Anbalagan, N.; Mathew, B.B.; Beeregowda, K.N. Toxicity, Mechanism and Health Effects of Some Heavy Metals. Interdiscip. Toxicol. 2014, 7, 60–72. [Google Scholar] [CrossRef]
- Mohan, D.; Pittman, C.U.; Bricka, M.; Smith, F.; Yancey, B.; Mohammad, J.; Steele, P.H.; Alexandre-Franco, M.F.; Gómez-Serrano, V.; Gong, H. Sorption of Arsenic, Cadmium, and Lead by Chars Produced from Fast Pyrolysis of Wood and Bark during Bio-Oil Production. J. Colloid Interface Sci. 2007, 310, 57–73. [Google Scholar] [CrossRef]
- Mager, E.M.; Brix, K.V.; Gerdes, R.M.; Ryan, A.C.; Grosell, M. Effects of Water Chemistry on the Chronic Toxicity of Lead to the Cladoceran, Ceriodaphnia Dubia. Ecotoxicol. Environ. Saf. 2011, 74, 238–243. [Google Scholar] [CrossRef]
- Akinyeye, O.J.; Ibigbami, T.B.; Odeja, O.O.; Sosanolu, O.M. Evaluation of Kinetics and Equilibrium Studies of Biosorption Potentials of Bamboo Stem Biomass for Removal of Lead (II) and Cadmium (II) Ions from Aqueous Solution. Afr. J. Pure Appl. Chem. 2020, 14, 24–41. [Google Scholar] [CrossRef]
- Isawi, H. Using Zeolite/Polyvinyl Alcohol/Sodium Alginate Nanocomposite Beads for Removal of Some Heavy Metals from Wastewater. Arab. J. Chem. 2020, 13, 5691–5716. [Google Scholar] [CrossRef]
- Ahmad, R.; Mirza, A. Facile One Pot Green Synthesis of Chitosan-Iron Oxide (CS-Fe2O3) Nanocomposite: Removal of Pb(II) and Cd(II) from Synthetic and Industrial Wastewater. J. Clean. Prod. 2018, 186, 342–352. [Google Scholar] [CrossRef]
- O’Connell, D.W.; Birkinshaw, C.; O’Dwyer, T.F. Heavy Metal Adsorbents Prepared from the Modification of Cellulose: A Review. Bioresour. Technol. 2008, 99, 6709–6724. [Google Scholar] [CrossRef] [PubMed]
- Valdés Rodríguez, O.A.; Palacios Wassenaar, O.M.; Ruíz Hernández, R.; Pérez Vásquez, A. Moringa and Ricinus Association Potential in the Sub-Tropics of Veracruz. Rev. Mex. Cienc. Agríc. 2014, 5, 1673–1686. [Google Scholar]
- Olson, M.E.; Fahey, J.W. Moringa oleifera: Un árbol multiusos para las zonas tropicales secas. Rev. Mex. Biodivers. 2011, 82, 1071–1082. [Google Scholar] [CrossRef]
- Kargarzadeh, H.; Ahmad, I.; Abdullah, I.; Dufresne, A.; Zainudin, S.Y.; Sheltami, R.M. Effects of Hydrolysis Conditions on the Morphology, Crystallinity, and Thermal Stability of Cellulose Nanocrystals Extracted from Kenaf Bast Fibers. Cellulose 2012, 19, 855–866. [Google Scholar] [CrossRef]
- Ramos-Vargas, S.; Huirache-Acuña, R.; Guadalupe Rutiaga-Quiñones, J.; Cortés-Martínez, R. Effective Lead Removal from Aqueous Solutions Using Cellulose Nanofibers Obtained from Water Hyacinth. Water Supply 2020, 20, 2715–2736. [Google Scholar] [CrossRef]
- Mahfoudhi, N.; Boufi, S. Nanocellulose as a Novel Nanostructured Adsorbent for Environmental Remediation: A Review. Cellulose 2017, 24, 1171–1197. [Google Scholar] [CrossRef]
- Rahmani, A.; Mousavi, H.Z.; Fazli, M. Effect of Nanostructure Alumina on Adsorption of Heavy Metals. Desalination 2010, 253, 94–100. [Google Scholar] [CrossRef]
- Mondal, P.; Purkait, M.K. Green Synthesized Iron Nanoparticles Supported on PH Responsive Polymeric Membrane for Nitrobenzene Reduction and Fluoride Rejection Study: Optimization Approach. J. Clean. Prod. 2018, 170, 1111–1123. [Google Scholar] [CrossRef]
- Bolade, O.P.; Williams, A.B.; Benson, N.U. Green Synthesis of Iron-Based Nanomaterials for Environmental Remediation: A Review. Environ. Nanotechnol. Monit. Manag. 2020, 13, 100279. [Google Scholar] [CrossRef]
- Abujaber, F.; Zougagh, M.; Jodeh, S.; Ríos, Á.; Guzmán Bernardo, F.J.; Rodríguez Martín-Doimeadios, R.C. Magnetic Cellulose Nanoparticles Coated with Ionic Liquid as a New Material for the Simple and Fast Monitoring of Emerging Pollutants in Waters by Magnetic Solid Phase Extraction. Microchem. J. 2018, 137, 490–495. [Google Scholar] [CrossRef]
- Krishna, R.; Dias, C.; Ventura, J.; Titus, E. Green and Facile Decoration of Fe3O4 Nanoparticles on Reduced Graphene Oxide. Mater. Today Proc. 2016, 3, 2807–2813. [Google Scholar] [CrossRef]
- Ostovan, A.; Ghaedi, M.; Arabi, M. Fabrication of Water-Compatible Superparamagnetic Molecularly Imprinted Biopolymer for Clean Separation of Baclofen from Bio-Fluid Samples: A Mild and Green Approach. Talanta 2018, 179, 760–768. [Google Scholar] [CrossRef]
- Soliemanzadeh, A.; Fekri, M. The Application of Green Tea Extract to Prepare Bentonite-Supported Nanoscale Zero-Valent Iron and Its Performance on Removal of Cr(VI): Effect of Relative Parameters and Soil Experiments. Microporous Mesoporous Mater. 2017, 239, 60–69. [Google Scholar] [CrossRef]
- Wang, X.; Le, L.; Alvarez, P.J.J.; Li, F.; Liu, K. Synthesis and Characterization of Green Agents Coated Pd/Fe Bimetallic Nanoparticles. J. Taiwan Inst. Chem. Eng. 2015, 50, 297–305. [Google Scholar] [CrossRef]
- Zhang, Y.; Chen, Y.; Westerhoff, P.; Hristovski, K.; Crittenden, J.C. Stability of Commercial Metal Oxide Nanoparticles in Water. Water Res. 2008, 42, 2204–2212. [Google Scholar] [CrossRef]
- Liu, L.; Fan, S. Removal of Cadmium in Aqueous Solution Using Wheat Straw Biochar: Effect of Minerals and Mechanism. Environ. Sci. Pollut. Res. 2018, 25, 8688–8700. [Google Scholar] [CrossRef]
- Bibi, I.; Nazar, N.; Ata, S.; Sultan, M.; Ali, A.; Abbas, A.; Jilani, K.; Kamal, S.; Sarim, F.M.; Khan, M.I.; et al. Green Synthesis of Iron Oxide Nanoparticles Using Pomegranate Seeds Extract and Photocatalytic Activity Evaluation for the Degradation of Textile Dye. J. Mater. Res. Technol. 2019, 8, 6115–6124. [Google Scholar] [CrossRef]
- Bolade, O.P.; Akinsiku, A.A.; Adeyemi, A.O.; Williams, A.B.; Benson, N.U. Dataset on Phytochemical Screening, FTIR and GC–MS Characterisation of Azadirachta Indica and Cymbopogon Citratus as Reducing and Stabilising Agents for Nanoparticles Synthesis. Data Brief 2018, 20, 917–926. [Google Scholar] [CrossRef]
- Akhtar, M.S.; Panwar, J.; Yun, Y.-S. Biogenic Synthesis of Metallic Nanoparticles by Plant Extracts. ACS Sustain. Chem. Eng. 2013, 1, 591–602. [Google Scholar] [CrossRef]
- Kharissova, O.V.; Dias, H.V.R.; Kharisov, B.I.; Pérez, B.O.; Pérez, V.M.J. The Greener Synthesis of Nanoparticles. Trends Biotechnol. 2013, 31, 240–248. [Google Scholar] [CrossRef] [PubMed]
- Nasrollahzadeh, M.; Mohammad Sajadi, S.; Rostami-Vartooni, A.; Khalaj, M. Green Synthesis of Pd/Fe3O4 Nanoparticles Using Euphorbia Condylocarpa M. Bieb Root Extract and Their Catalytic Applications as Magnetically Recoverable and Stable Recyclable Catalysts for the Phosphine-Free Sonogashira and Suzuki Coupling Reactions. J. Mol. Catal. Chem. 2015, 396, 31–39. [Google Scholar] [CrossRef]
- Harshiny, M.; Iswarya, C.N.; Matheswaran, M. Biogenic Synthesis of Iron Nanoparticles Using Amaranthus Dubius Leaf Extract as a Reducing Agent. Powder Technol. 2015, 286, 744–749. [Google Scholar] [CrossRef]
- Cai, Y.; Shen, Y.; Xie, A.; Li, S.; Wang, X. Green Synthesis of Soya Bean Sprouts-Mediated Superparamagnetic Fe3O4 Nanoparticles. J. Magn. Magn. Mater. 2010, 322, 2938–2943. [Google Scholar] [CrossRef]
- Makarov, V.V.; Makarova, S.S.; Love, A.J.; Sinitsyna, O.V.; Dudnik, A.O.; Yaminsky, I.V.; Taliansky, M.E.; Kalinina, N.O. Biosynthesis of Stable Iron Oxide Nanoparticles in Aqueous Extracts of Hordeum Vulgare and Rumex Acetosa Plants. Langmuir 2014, 30, 5982–5988. [Google Scholar] [CrossRef]
- Balamurugan, M.; Saravanan, S.; Soga, T. Synthesis of Iron Oxide Nanoparticles by Using Eucalyptus Globulus Plant Extract. E-J. Surf. Sci. Nanotechnol. 2014, 12, 363–367. [Google Scholar] [CrossRef]
- Harshiny, M.; Matheswaran, M.; Arthanareeswaran, G.; Kumaran, S.; Rajasree, S. Enhancement of Antibacterial Properties of Silver Nanoparticles–Ceftriaxone Conjugate through Mukia Maderaspatana Leaf Extract Mediated Synthesis. Ecotoxicol. Environ. Saf. 2015, 121, 135–141. [Google Scholar] [CrossRef]
- Ahmmad, B.; Leonard, K.; Shariful Islam, M.; Kurawaki, J.; Muruganandham, M.; Ohkubo, T.; Kuroda, Y. Green Synthesis of Mesoporous Hematite (α-Fe2O3) Nanoparticles and Their Photocatalytic Activity. Adv. Powder Technol. 2013, 24, 160–167. [Google Scholar] [CrossRef]
- Wang, Z.; Fang, C.; Megharaj, M. Characterization of Iron–Polyphenol Nanoparticles Synthesized by Three Plant Extracts and Their Fenton Oxidation of Azo Dye. ACS Sustain. Chem. Eng. 2014, 2, 1022–1025. [Google Scholar] [CrossRef]
- Li, J.; Hu, J.; Xiao, L.; Wang, Y.; Wang, X. Interaction Mechanisms between α-Fe2O3, γ-Fe2O3 and Fe3O4 Nanoparticles and Citrus Maxima Seedlings. Sci. Total Environ. 2018, 625, 677–685. [Google Scholar] [CrossRef] [PubMed]
- Devatha, C.P.; K, J.; Patil, M. Effect of Green Synthesized Iron Nanoparticles by Azardirachta Indica in Different Proportions on Antibacterial Activity. Environ. Nanotechnol. Monit. Manag. 2018, 9, 85–94. [Google Scholar] [CrossRef]
- Zhu, F.; Ma, S.; Liu, T.; Deng, X. Green Synthesis of Nano Zero-Valent Iron/Cu by Green Tea to Remove Hexavalent Chromium from Groundwater. J. Clean. Prod. 2018, 174, 184–190. [Google Scholar] [CrossRef]
- Weng, X.; Guo, M.; Luo, F.; Chen, Z. One-Step Green Synthesis of Bimetallic Fe/Ni Nanoparticles by Eucalyptus Leaf Extract: Biomolecules Identification, Characterization and Catalytic Activity. Chem. Eng. J. 2017, 308, 904–911. [Google Scholar] [CrossRef]
- Abdelghany, T.M.; Al-Rajhi, A.M.H.; Al Abboud, M.A.; Alawlaqi, M.M.; Ganash Magdah, A.; Helmy, E.A.M.; Mabrouk, A.S. Recent Advances in Green Synthesis of Silver Nanoparticles and Their Applications: About Future Directions. A Review. BioNanoScience 2018, 8, 5–16. [Google Scholar] [CrossRef]
- Ahmed, S.; Ahmad, M.; Swami, B.L.; Ikram, S. A Review on Plants Extract Mediated Synthesis of Silver Nanoparticles for Antimicrobial Applications: A Green Expertise. J. Adv. Res. 2016, 7, 17–28. [Google Scholar] [CrossRef] [PubMed]
- Iqbal, A.; Iqbal, K.; Li, B.; Gong, D.; Qin, W. Recent Advances in Iron Nanoparticles: Preparation, Properties, Biological and Environmental Application. J. Nanosci. Nanotechnol. 2017, 17, 4386–4409. [Google Scholar] [CrossRef]
- Saif, S.; Tahir, A.; Chen, Y. Green Synthesis of Iron Nanoparticles and Their Environmental Applications and Implications. Nanomaterials 2016, 6, 209. [Google Scholar] [CrossRef]
- Rauwel, P.; Küünal, S.; Ferdov, S.; Rauwel, E. A Review on the Green Synthesis of Silver Nanoparticles and Their Morphologies Studied via TEM. Available online: https://www.hindawi.com/journals/amse/2015/682749/ (accessed on 4 October 2020).
- Sharma, J.K.; Srivastava, P.; Akhtar, M.S.; Singh, G.; Ameen, S. α-Fe2O3 Hexagonal Cones Synthesized from the Leaf Extract of Azadirachta Indica and Its Thermal Catalytic Activity. New J. Chem. 2015, 39, 7105–7111. [Google Scholar] [CrossRef]
- Falowo, A.B.; Mukumbo, F.E.; Idamokoro, E.M.; Lorenzo, J.M.; Afolayan, A.J.; Muchenje, V. Multi-Functional Application of Moringa Oleifera Lam. in Nutrition and Animal Food Products: A Review. Food Res. Int. 2018, 106, 317–334. [Google Scholar] [CrossRef]
- Waterman, C.; Cheng, D.M.; Rojas-Silva, P.; Poulev, A.; Dreifus, J.; Lila, M.A.; Raskin, I. Stable, Water Extractable Isothiocyanates from Moringa Oleifera Leaves Attenuate Inflammation in Vitro. Phytochemistry 2014, 103, 114–122. [Google Scholar] [CrossRef] [PubMed]
- Lagergren, S. Zur theorie der sogenannten adsorption geloster stoffe. Kungliga Svenska Vetenskapsakademiens. Handlingar 1898, 24, 1–39. [Google Scholar]
- Ho, Y.S.; McKay, G.; Wase, D.A.J.; Forster, C.F. Study of the Sorption of Divalent Metal Ions on to Peat. Adsorpt. Sci. Technol. 2000, 18, 639–650. [Google Scholar] [CrossRef]
- Low, M.J.D. Kinetics of Chemisorption of Gases on Solids. Available online: https://pubs.acs.org/doi/pdf/10.1021/cr60205a003 (accessed on 3 October 2020).
- Chen, K.; He, J.; Li, Y.; Cai, X.; Zhang, K.; Liu, T.; Hu, Y.; Lin, D.; Kong, L.; Liu, J. Removal of Cadmium and Lead Ions from Water by Sulfonated Magnetic Nanoparticle Adsorbents. J. Colloid Interface Sci. 2017, 494, 307–316. [Google Scholar] [CrossRef] [PubMed]
- Langmuir, I. The Adsorption of Gases on Plane Surfaces of Glass, Mica and Platinum. J. Am. Chem. Soc. 1918, 40, 1361–1403. [Google Scholar] [CrossRef]
- Papageorgiou, S.K.; Kouvelos, E.P.; Katsaros, F.K. Calcium Alginate Beads from Laminaria Digitata for the Removal of Cu+2 and Cd+2 from Dilute Aqueous Metal Solutions. Desalination 2008, 224, 293–306. [Google Scholar] [CrossRef]
- Acemioğlu, B. Removal of Fe(II) Ions from Aqueous Solution by Calabrian Pine Bark Wastes. Bioresour. Technol. 2004, 93, 99–102. [Google Scholar] [CrossRef]
- Sivarathnakumar, S.; Baskar, G.; Kumar, R.P.; Bharathiraja, B. Bioethanol Production by the Utilisation of Moringa Oleifera Stem with Sono-Assisted Acid/Alkali Hydrolysis Approach. Int. J. Environ. Sustain. Dev. 2016, 15, 392–403. [Google Scholar] [CrossRef]
- Zhao, H.; Kwak, J.H.; Conrad Zhang, Z.; Brown, H.M.; Arey, B.W.; Holladay, J.E. Studying Cellulose Fiber Structure by SEM, XRD, NMR and Acid Hydrolysis. Carbohydr. Polym. 2007, 68, 235–241. [Google Scholar] [CrossRef]
- Lavoine, N.; Desloges, I.; Dufresne, A.; Bras, J. Microfibrillated Cellulose—Its Barrier Properties and Applications in Cellulosic Materials: A Review. Carbohydr. Polym. 2012, 90, 735–764. [Google Scholar] [CrossRef]
- Kumar, A.; Negi, Y.S.; Choudhary, V.; Bhardwaj, N.K. Characterization of Cellulose Nanocrystals Produced by Acid-Hydrolysis from Sugarcane Bagasse as Agro-Waste. J. Mater. Phys. Chem. 2014, 2, 1–8. [Google Scholar] [CrossRef]
- Zhao, Y.; Xu, C.; Xing, C.; Shi, X.; Matuana, L.M.; Zhou, H.; Ma, X. Fabrication and Characteristics of Cellulose Nanofibril Films from Coconut Palm Petiole Prepared by Different Mechanical Processing. Ind. Crops Prod. 2015, 65, 96–101. [Google Scholar] [CrossRef]
- Abdul Khalil, H.P.S.; Davoudpour, Y.; Islam, M.N.; Mustapha, A.; Sudesh, K.; Dungani, R.; Jawaid, M. Production and Modification of Nanofibrillated Cellulose Using Various Mechanical Processes: A Review. Carbohydr. Polym. 2014, 99, 649–665. [Google Scholar] [CrossRef] [PubMed]
- Tonoli, G.H.D.; Teixeira, E.M.; Corrêa, A.C.; Marconcini, J.M.; Caixeta, L.A.; Pereira-da-Silva, M.A.; Mattoso, L.H.C. Cellulose Micro/Nanofibres from Eucalyptus Kraft Pulp: Preparation and Properties. Carbohydr. Polym. 2012, 89, 80–88. [Google Scholar] [CrossRef] [PubMed]
- Kalia, S.; Dufresne, A.; Cherian, B.M.; Kaith, B.S.; Avérous, L.; Njuguna, J.; Nassiopoulos, E. Cellulose-Based Bio- and Nanocomposites: A Review. Available online: https://www.hindawi.com/journals/ijps/2011/837875/ (accessed on 27 December 2020).
- Dong, H.; Snyder, J.F.; Tran, D.T.; Leadore, J.L. Hydrogel, Aerogel and Film of Cellulose Nanofibrils Functionalized with Silver Nanoparticles. Carbohydr. Polym. 2013, 95, 760–767. [Google Scholar] [CrossRef]
- Sahu, U.K.; Mahapatra, S.S.; Patel, R.K. Synthesis and Characterization of an Eco-Friendly Composite of Jute Fiber and Fe2O3 Nanoparticles and Its Application as an Adsorbent for Removal of As(V) from Water. J. Mol. Liq. 2017, 237, 313–321. [Google Scholar] [CrossRef]
- Nagappan, S.; Ha, H.M.; Park, S.S.; Jo, N.-J.; Ha, C.-S. One-Pot Synthesis of Multi-Functional Magnetite–Polysilsesquioxane Hybrid Nanoparticles for the Selective Fe3+ and Some Heavy Metal Ions Adsorption. RSC Adv. 2017, 7, 19106–19116. [Google Scholar] [CrossRef]
- Cao, C.-Y.; Qu, J.; Wei, F.; Liu, H.; Song, W.-G. Superb Adsorption Capacity and Mechanism of Flowerlike Magnesium Oxide Nanostructures for Lead and Cadmium Ions. ACS Appl. Mater. Interfaces 2012, 4, 4283–4287. [Google Scholar] [CrossRef]
- Xu, Q.; Jiang, L. Infrared Spectra of the M(NO)n (M = Sn, Pb; n = 1, 2) and PbNO- Molecules. Inorg. Chem. 2006, 45, 8648–8654. [Google Scholar] [CrossRef]
- Qin, X.; Zhou, J.; Huang, A.; Guan, J.; Zhang, Q.; Huang, Z.; Hu, H.; Zhang, Y.; Yang, M.; Wu, J.; et al. A Green Technology for the Synthesis of Cellulose Succinate for Efficient Adsorption of Cd(II) and Pb(II) Ions. RSC Adv. 2016, 6, 26817–26825. [Google Scholar] [CrossRef]
- Asmaly, H.A.; Abussaud, B.; Ihsanullah; Saleh, T.A.; Bukhari, A.A.; Laoui, T.; Shemsi, A.M.; Gupta, V.K.; Atieh, M.A. Evaluation of Micro- and Nano-Carbon-Based Adsorbents for the Removal of Phenol from Aqueous Solutions. Toxicol. Environ. Chem. 2015, 97, 1164–1179. [Google Scholar] [CrossRef]
- Taipale, T.; Österberg, M.; Nykänen, A.; Ruokolainen, J.; Laine, J. Effect of Microfibrillated Cellulose and Fines on the Drainage of Kraft Pulp Suspension and Paper Strength. Cellulose 2010, 17, 1005–1020. [Google Scholar] [CrossRef]
- Capron, I.; Rojas, O.J.; Bordes, R. Behavior of Nanocelluloses at Interfaces. Curr. Opin. Colloid Interface Sci. 2017, 29, 83–95. [Google Scholar] [CrossRef]
- Visakh, P.M.; Mathew, A.P.; Oksman, K.; Thomas, S. Starch-Based Bionanocomposites: Processing and Properties. In Polysaccharide Building Blocks; John Wiley & Sons, Ltd.: Hoboken, NJ, USA, 2012; pp. 287–306. ISBN 978-1-118-22948-4. [Google Scholar]
- Fengel, D.; Wegener, G. Wood: Chemistry, Ultrastructure, Reactions; Walter de Gruyter: Berlin, Germany, 2011; ISBN 978-3-11-083965-4. [Google Scholar]
- Martínez-Pérez, R.; Pedraza-Bucio, F.E.; Orihuela-Equihua, R.; López-Albarrán, P.; Rutiaga-Quiñones, J.G. Calorific Value and Inorganic Material of Ten Mexican Wood Species. Wood Res. 2015, 60, 12. [Google Scholar]
- Argyropoulos, D.S. Wood and Cellulosic Chemistry. Second Edition, Revised and Expanded Edited by David N.-S. Hon (Clemson University) and Nubuo Shiraishi (Kyoto University). Marcel Dekker: New York and Basel. 2001. Vii + 914 Pp. $250.00. ISBN 0-8247-0024-4. J. Am. Chem. Soc. 2001, 123, 8880–8881. [Google Scholar] [CrossRef]
- Ngangyo-Heya, M.; Foroughbahchk-Pournavab, R.; Carrillo-Parra, A.; Rutiaga-Quiñones, J.G.; Zelinski, V.; Pintor-Ibarra, L.F. Calorific Value and Chemical Composition of Five Semi-Arid Mexican Tree Species. Forests 2016, 7, 58. [Google Scholar] [CrossRef]
- Muthukumar, H.; Matheswaran, M. Amaranthus Spinosus Leaf Extract Mediated FeO Nanoparticles: Physicochemical Traits, Photocatalytic and Antioxidant Activity. ACS Sustain. Chem. Eng. 2015, 3, 3149–3156. [Google Scholar] [CrossRef]
- Zhu, X.; Song, T.; Lv, Z.; Ji, G. High-Efficiency and Low-Cost α-Fe2O3 Nanoparticles-Coated Volcanic Rock for Cd(II) Removal from Wastewater. Process Saf. Environ. Prot. 2016, 104, 373–381. [Google Scholar] [CrossRef]
- Tajik, E.; Naeimi, A.; Amiri, A. Fabrication of Iron Oxide Nanoparticles, and Green Catalytic Application of an Immobilized Novel Iron Schiff on Wood Cellulose. Cellulose 2018, 25, 915–923. [Google Scholar] [CrossRef]
- Gupta, V.K.; Nayak, A. Cadmium Removal and Recovery from Aqueous Solutions by Novel Adsorbents Prepared from Orange Peel and Fe2O3 Nanoparticles. Chem. Eng. J. 2012, 180, 81–90. [Google Scholar] [CrossRef]
- Foo, K.Y.; Hameed, B.H. Insights into the Modeling of Adsorption Isotherm Systems. Chem. Eng. J. 2010, 156, 2–10. [Google Scholar] [CrossRef]
- Papageorgiou, S.K.; Katsaros, F.K.; Kouvelos, E.P.; Nolan, J.W.; Le Deit, H.; Kanellopoulos, N.K. Heavy Metal Sorption by Calcium Alginate Beads from Laminaria Digitata. J. Hazard. Mater. 2006, 137, 1765–1772. [Google Scholar] [CrossRef] [PubMed]
- Wang, F.; Lu, X.; Li, X. Selective Removals of Heavy Metals (Pb2+, Cu2+, and Cd2+) from Wastewater by Gelation with Alginate for Effective Metal Recovery. J. Hazard. Mater. 2016, 308, 75–83. [Google Scholar] [CrossRef] [PubMed]
- Pawar, R.R.; Lalhmunsiama; Kim, M.; Kim, J.-G.; Hong, S.-M.; Sawant, S.Y.; Lee, S.M. Efficient Removal of Hazardous Lead, Cadmium, and Arsenic from Aqueous Environment by Iron Oxide Modified Clay-Activated Carbon Composite Beads. Appl. Clay Sci. 2018, 162, 339–350. [Google Scholar] [CrossRef]
- Elimelech, M.; Chen, W.H.; Waypa, J.J. Measuring the Zeta (Electrokinetic) Potential of Reverse Osmosis Membranes by a Streaming Potential Analyzer. Desalination 1994, 95, 269–286. [Google Scholar] [CrossRef]
- Zirino, A.; Yamamoto, S. A pH-Dependent Model for The Chemical Speciation of Copper, Zinc, Cadmium, and Lead in Seawater. Limnol. Oceanogr. 1972, 17, 661–671. [Google Scholar] [CrossRef]
- Giles, C.H.; D’Silva, A.P.; Easton, I.A. A General Treatment and Classification of the Solute Adsorption Isotherm Part. II. Experimental Interpretation. J. Colloid Interface Sci. 1974, 47, 766–778. [Google Scholar] [CrossRef]
- Giles, C.H.; Smith, D.; Huitson, A. A General Treatment and Classification of the Solute Adsorption Isotherm. I. Theoretical. J. Colloid Interface Sci. 1974, 47, 755–765. [Google Scholar] [CrossRef]
- Prasher, S.O.; Beaugeard, M.; Hawari, J.; Bera, P.; Patel, R.M.; Kim, S.H. Biosorption of Heavy Metals by Red Algae (Palmaria Palmata). Environ. Technol. 2004, 25, 1097–1106. [Google Scholar] [CrossRef]
- Trakal, L.; Veselská, V.; Šafařík, I.; Vítková, M.; Číhalová, S.; Komárek, M. Lead and Cadmium Sorption Mechanisms on Magnetically Modified Biochars. Bioresour. Technol. 2016, 203, 318–324. [Google Scholar] [CrossRef]
- Anwar, J.; Shafique, U.; Waheed-uz-Zaman; Salman, M.; Dar, A.; Anwar, S. Removal of Pb(II) and Cd(II) from Water by Adsorption on Peels of Banana. Bioresour. Technol. 2010, 101, 1752–1755. [Google Scholar] [CrossRef] [PubMed]
- Ge, F.; Li, M.-M.; Ye, H.; Zhao, B.-X. Effective Removal of Heavy Metal Ions Cd2+, Zn2+, Pb2+, Cu2+ from Aqueous Solution by Polymer-Modified Magnetic Nanoparticles. J. Hazard. Mater. 2012, 211–212, 366–372. [Google Scholar] [CrossRef] [PubMed]
- Keshvardoostchokami, M.; Babaei, L.; Zamani, A.A.; Parizanganeh, A.H.; Piri, F. Synthesized chitosan/iron oxide nanocomposite and shrimp shell in removal of nickel, cadmium and lead from aqueous solution. Global J. Environ. Sci. Manag. 2017, 3, 267–278. [Google Scholar]
- Pehlivan, E.; Yanık, B.H.; Ahmetli, G.; Pehlivan, M. Equilibrium Isotherm Studies for the Uptake of Cadmium and Lead Ions onto Sugar Beet Pulp. Bioresour. Technol. 2008, 99, 3520–3527. [Google Scholar] [CrossRef] [PubMed]
- Kataria, N.; Garg, V.K. Green Synthesis of Fe3O4 Nanoparticles Loaded Sawdust Carbon for Cadmium (II) Removal from Water: Regeneration and Mechanism. Chemosphere 2018, 208, 818–828. [Google Scholar] [CrossRef]
- Shalaby, T.I.; El-Kady, M.F.; Zaki, A.E.H.M.; El-Kholy, S.M. Preparation and Application of Magnetite Nanoparticles Immobilized on Cellulose Acetate Nanofibers for Lead Removal from Polluted Water. Water Supply 2017, 17, 176–187. [Google Scholar] [CrossRef]
- Mahdavi, M.; Namvar, F.; Ahmad, M.B.; Mohamad, R. Green Biosynthesis and Characterization of Magnetic Iron Oxide (Fe3O4) Nanoparticles Using Seaweed (Sargassum Muticum) Aqueous Extract. Molecules 2013, 18, 5954–5964. [Google Scholar] [CrossRef]
- Gao, S.; Shi, Y.; Zhang, S.; Jiang, K.; Yang, S.; Li, Z.; Takayama-Muromachi, E. Biopolymer-Assisted Green Synthesis of Iron Oxide Nanoparticles and Their Magnetic Properties. J. Phys. Chem. C 2008, 112, 10398–10401. [Google Scholar] [CrossRef]
- Hokkanen, S.; Repo, E.; Suopajärvi, T.; Liimatainen, H.; Niinimaa, J.; Sillanpää, M. Adsorption of Ni(II), Cu(II) and Cd(II) from Aqueous Solutions by Amino Modified Nanostructured Microfibrillated Cellulose. Cellulose 2014, 21, 1471–1487. [Google Scholar] [CrossRef]
- Zhao, T.; Feng, T. Application of Modified Chitosan Microspheres for Nitrate and Phosphate Adsorption from Aqueous Solution. RSC Adv. 2016, 6, 90878–90886. [Google Scholar] [CrossRef]


| Formula | |
|---|---|
| Concentration (%) | |
| Formula | Concentration (%) |
| MgO | 13.55 |
| SiO2 | 20.65 |
| P2O5 | 24.04 |
| SO3 | 3.68 |
| Cl | 5.26 |
| Fe2O3 | 32.81 |
| Model | Parameters | Metal Ions | |
|---|---|---|---|
| Cd | Pb | ||
| qeexp.1 (mg/g) | 0.1513 | 0.3109 | |
| Pseudo-first-order | KL (1/min) | 0.2445 | 0.0220 |
| qecalc. (mg/g) | 0.1348 | 0.3401 | |
| R | 0.9197 | 0.9858 | |
| Pseudo-second-order | K2 (1/min) | 0.4486 | 0.0170 |
| qecalc. (mg/g) | 0.2937 | 0.7781 | |
| R | 0.9611 | 0.9734 | |
| Elovich | a (1/min) | 0.8112 | 0.00478 |
| b (mg/g) | 59.077 | 2.4590 | |
| R | 0.9895 | 0.9204 | |
| Model | Parameters | Metal Ions | |||||
|---|---|---|---|---|---|---|---|
| Cd | Pb | ||||||
| 25 °C | 30 °C | 40 °C | 25 °C | 30 °C | 40 °C | ||
| qeexp.1 (mg/g) | 12.538 | 13.7377 | 14.4896 | 81.4064 | 89.2212 | 89.0882 | |
| Langmuir | Q0calc. (mg/g) | 21.233 | 34.999 | 49.697 | 467.307 | 956.02 | 357.549 |
| b | 0.0040 | 0.0014 | 0.0010 | 0.0131 | 0.0084 | 0.0263 | |
| R | 0.9789 | 0.9929 | 0.9924 | 0.9149 | 0.7274 | 0.7294 | |
| Freundlich | KF (mg/g) (L/mg)1/n | 0.2601 | 0.0922 | 0.0775 | 4.1092 | 0.7209 | 1.4545 |
| n | 1.5275 | 1.2117 | 1.1443 | 0.8916 | 0.4163 | 0.5055 | |
| R | 0.9617 | 0.9895 | 0.9891 | 0.9262 | 0.9180 | 0.8707 | |
| Langmuir–Freundlich | KLF (mg/g)(L/mg)1/nLF | 0.8453 | 1.0635 | 0.2825 | 0.17961 | 0.3134 | 0.2995 |
| aLF (mg/L) | 1 × 10⁻⁴ | 2 × 10⁻⁶ | 3 × 10⁻⁶ | 0.1394 | 0.1223 | 0.1511 | |
| nLF | 0.4763 | 0.4052 | 0.6554 | 3.1486 | 3.0864 | 3.2310 | |
| R | 0.9234 | 0.8864 | 0.9731 | 0.9934 | 0.9390 | 0.9040 | |
| Metal Ions | ΔG° (kJ/mol) | ΔH° (kJ/mol) | ΔS° (KJ/mol K) | ||
|---|---|---|---|---|---|
| 25 °C | 30 °C | 40 °C | |||
| Cd | −64.339 | −64.904 | −66.031 | −30.701 | 0.1128 |
| Pb | −73.704 | −74.250 | −75.339 | −41.222 | 0.1089 |
Publisher’s Note: MDPI stays neutral with regard to jurisdictional claims in published maps and institutional affiliations. |
© 2021 by the authors. Licensee MDPI, Basel, Switzerland. This article is an open access article distributed under the terms and conditions of the Creative Commons Attribution (CC BY) license (http://creativecommons.org/licenses/by/4.0/).
Share and Cite
Vázquez-Guerrero, A.; Cortés-Martínez, R.; Alfaro-Cuevas-Villanueva, R.; Rivera-Muñoz, E.M.; Huirache-Acuña, R. Cd(II) and Pb(II) Adsorption Using a Composite Obtained from Moringa oleifera Lam. Cellulose Nanofibrils Impregnated with Iron Nanoparticles. Water 2021, 13, 89. https://doi.org/10.3390/w13010089
Vázquez-Guerrero A, Cortés-Martínez R, Alfaro-Cuevas-Villanueva R, Rivera-Muñoz EM, Huirache-Acuña R. Cd(II) and Pb(II) Adsorption Using a Composite Obtained from Moringa oleifera Lam. Cellulose Nanofibrils Impregnated with Iron Nanoparticles. Water. 2021; 13(1):89. https://doi.org/10.3390/w13010089
Chicago/Turabian StyleVázquez-Guerrero, Adriana, Raúl Cortés-Martínez, Ruth Alfaro-Cuevas-Villanueva, Eric M. Rivera-Muñoz, and Rafael Huirache-Acuña. 2021. "Cd(II) and Pb(II) Adsorption Using a Composite Obtained from Moringa oleifera Lam. Cellulose Nanofibrils Impregnated with Iron Nanoparticles" Water 13, no. 1: 89. https://doi.org/10.3390/w13010089
APA StyleVázquez-Guerrero, A., Cortés-Martínez, R., Alfaro-Cuevas-Villanueva, R., Rivera-Muñoz, E. M., & Huirache-Acuña, R. (2021). Cd(II) and Pb(II) Adsorption Using a Composite Obtained from Moringa oleifera Lam. Cellulose Nanofibrils Impregnated with Iron Nanoparticles. Water, 13(1), 89. https://doi.org/10.3390/w13010089