1. Introduction
The effects of microplastics (MP) on the environment and organisms have not yet been sufficiently examined. However, it has been proven that MP can adsorb (harmful) organic substances due to their surface and material properties [
1]. These substances can accumulate in the fatty tissue of organisms and may cause harm to the organism [
2]. Furthermore, additives in plastics can have toxic effects on organisms [
3]. Da Costa et al. [
4] showed that MP can be ingested by tadpoles under laboratory conditions and cause mutagenic effects. Miklos et al. [
5] showed that MP can provide a habitat for (pathogenic) microorganisms. MP can be transferred by winds or currents from one ecosystem into another. Thus, MP can act as a transport medium for substances and microorganisms and thereby influence ecosystems. For example, MP have been detected in mussels and oysters bred for human consumption [
6], in seabirds [
7], in wild fish [
8], and even in human feces [
9].
Many studies have identified municipal wastewater treatment plants (WWTPs) as a source of MP emission into the environment [
10,
11,
12,
13]. Only a few studies have investigated MP discharge into the environment via industrial WWTPs [
14,
15]. The results show removal efficiencies between 79.3% and 99.9% for municipal WWTPs comprising primary and secondary treatment including the conventional activated sludge system (CAS) but no additional filtration stage [
10,
11,
16,
17,
18]. WWTPs represent input paths for drug residues and other environmentally harmful substances. These substances are reduced by using a downstream treatment stage, e.g., dosing of activated carbon combined with single or dual media filtration and/or ozonization [
19]. A filtration stage reduces the solids content and increases the elimination rate of MP. Membranes and different types of other filtration processes have been shown to successfully reduce the MP content of municipal WWTP effluents.
Lv et al. [
20] investigated a WWTP in China with a wastewater flow of 120,000 m
3/day. The influent is divided into two treatment lines. The first treatment line treats about half of the wastewater with an activated sludge system including final clarifiers, while in the second line, a membrane bioreactor (MBR) with a pore size of 0.1 µm replaces the final clarifiers. The total MP elimination efficiency based on the microplastic particles (MPP) and microplastic fibers (MPF) count was 53.6% in the first treatment line (without filtration) and 82.1% in the second treatment line (MBR), with a theoretical detection limit of 25 µm due to the pore width of the sampling filter. However, the analysis was performed using attenuated total reflection-Fourier-transform infrared spectroscopy (ATR-FTIR), which is why the realistic detection limit was around 500 µm [
21].
Bayo et al. [
22] monitored a WWTP in Spain with a volumetric flow of 12,000 m
3/day. The treatment is divided into two lines, with the main line treating about 10,200 m
3 of wastewater per day and comprising a CAS treatment with subsequent sand filtration. The wastewater of the second line is treated in an activated sludge stage with an MBR. MP was identified by FTIR spectroscopy. The total MP elimination rate (based on MPP+MPF count) was 75.49% for the main line (sand filtration) and 79.01% for the second line (MBR). The detection limit was 10 µm (due to the use of FTIR spectroscopy [
21]), but no MP < 200 µm were identified.
Hidayaturrahman et al. [
23] studied two different WWTPs in South Korea with different filtration stages (membrane disc filter and sand filter) and wastewater flows of about 469,000 and 21,000 m
3/day, respectively. Based on MPP+MPF count, the detected elimination rates in filters were 79.4% (membrane disc filter), and 73.8% (sand filtration). The overall MP elimination rates in the WWTPs were increased to 99.1% and 98.9%, respectively. Information on the detection limit was not provided. MP were identified by visual inspection using a stereomicroscope.
Lares et al. [
24] took samples from a Finnish WWTP with an activated sludge stage and a wastewater flow of about 10,000 m
3/day. A small volumetric flow (3 m
3/day) of the final clarifier was treated by an MBR pilot plant. For the wastewater treatment process, an elimination rate of 98.3% without MBR and 99.3% including MBR was determined based on MPP+MPF count by means of Raman- and FTIR spectroscopy (after visual pre-sorting). The detection limit was 250 µm (limited by the sampling filter).
Yang et al. [
25] investigated a wastewater treatment plant in China with an inflow of 1,000,000 m
3/day. The plant is equipped with a final advanced oxidation stage consisting of ultrafiltration, ozonization, and UV disinfection. MP identification was carried out by FTIR spectroscopy after visual sorting. It was shown that in relation to the number of MPP+MPF, 71.67% ± 11.58% of MP is removed from the wastewater by this downstream treatment, resulting in an overall elimination rate of 95.26% ± 1.57%.
Talvitie et al. [
26] examined four Swedish WWTPs with different tertiary treatment processes. On the basis on the number of MPP+MPF, MP elimination rates of 97.1% in a sand filtration, 95.0% in a dissolved air flotation, 99.9% in an MBR, and 98.5% in a disc filtration (20 µm pore size) were determined. Potential MP were visually pre-sorted by using a stereomicroscope and then measured by FTIR spectroscopy. The detection limit of the analytical procedure was 20 µm.
Mintenig et al. [
13] sampled the Oldenburg WWTP in Germany with a wastewater volume of 36,000 m
3/day. A cloth filter (10–15 µm pore size) was used as a final treatment stage. The measured elimination efficiency of MP by the cloth filter based on the MPP+MPF count was 97.3%. The measurement was performed by the combined use of ATR-FTIR and focal-plane-array-FTIR (FPA-FTIR), which has a detection limit of 20 µm [
21].
This study aims to obtain further results of MP elimination efficiency by downstream sand filtration. Sand filtration is often used in municipal WWTPs and in industrial process wastewater treatment as an additional treatment stage to remove total suspended solids (TSS). The present work investigates sand filters from two municipal WWTPs and one industrial polyvinyl chloride (PVC) manufacturer. To our knowledge, this is the first study that investigated the MP elimination efficiency of sand filters in industrial wastewater treatment. Although sand filters in industrial wastewater treatment have not yet been studied with respect to MP retention, we assume that the efficiency is comparable to that of sand filters in municipal WWTPs.
2. Materials and Methods
2.1. Information about Sampled WWTPs
The Mannheim municipal single-stage CAS WWTP treats about 80,000 m
3 of wastewater per day (725,000 population equivalents), which is discharged into the river Rhine. The Frankfurt Sindlingen WWTP treats about 63,000 m
3 of wastewater per day (470,000 population equivalents), which is discharged into the river Main. Both plants consist of a mechanical treatment stage, a biological stage with denitrification and nitrification (including biological phosphorus removal in Mannheim), and chemical phosphorus precipitation with aluminum-based precipitants. The Frankfurt Sindlingen WWTP has a high loaded first biological stage and a low loaded second biological stage. Both WWTPs have a dual media filtration with additional precipitation/flocculation downstream of the final clarifiers. In Mannheim, activated carbon is dosed into the influent of the filter to remove micropollutants. The dual media filter bed in the Frankfurt Sindlingen WWTP consists of an upper anthracite layer (1050 mm, grain size between 1.4 and 2.5 mm) and a lower layer of quartz sand (650 mm, grain size between 0.71 and 1.4 mm). The dual media filter bed in the Mannheim WWTP consists of an upper anthracite layer (400 mm, grain size between 1.4 and 2.5 mm) and a lower layer of quartz sand (600 mm, grain size between 0.71 and 1.25 mm). The dewatered sludge of both WWTPs is incinerated in a mono sewage sludge incineration with energy recovery. The mean concentration of TSS in the effluent of the final clarifiers during sampling was about 11 mg/L in Frankfurt Sindlingen and about 4 mg/L in Mannheim. This was reduced by the sand filters to about 1.7 mg/L in Frankfurt Sindlingen and about 0.2 mg/L in Mannheim (
Table A1).
The PVC manufacturer treats about 3000 m3 of process wastewater per day. The treatment comprises a sedimentation tank with coagulation/flocculation and three parallel downstream single media 2000 mm continuous quartz sand filters (grain size between 1 mm–2 mm). The treated process wastewater is discharged into an industrial WWTP with biological treatment.
2.2. Sampling
Sampling was performed on dry weather days at the Frankfurt Sindlingen and Mannheim WWTP in Germany between 23 October and 4 December 2019. Taking into account the diurnal and weekly variations of municipal wastewater, the sampling was carried out on the same weekdays and at the same time. The sampling at the PVC plant took place between 6 July and 15 July 2020.
The custom-made sampling device consisted of a silicone hose (Technikplaza GmbH, Stolberg, Germany), a stainless-steel cartridge filter (10 μm pore width) with stainless-steel housing (acuraScreen, Fuhr GmbH, Klein-Winternheim, Germany), and a downstream pump (Nowax GPN 1500, EBARA Pumps Europe S.p.A., Cles, Italy). The sample volume was measured with a flow meter (Deltamess DWWF GmbH, Oldenburg (Holstein), Germany) installed in the outlet hose. Prior to sampling, the custom-made sampling device and the connected silicone hose were rinsed with tap water for 30 min.
In both municipal WWTPs, three samples were taken in the effluent of the final clarifiers and the outlet of the sand filters (
Figure 1). The sample volumes of the effluent of the final clarifiers were 26 L in Frankfurt Sindlingen and 134 L in Mannheim on average depending on the concentration of TSS (filters were fully loaded). The sample volumes of the sand filter effluents were 2255 L in Frankfurt Sindlingen and 2503 L in Mannheim on average (
Table 1).
Samples of the influent of the sand filter of the PVC manufacturer were taken in a fully mixed equalizing tank upstream of the sand filter. Due to a very high TSS concentration, only 1 L grab samples were taken without a cartridge filter (except for sample no. 3). The effluent of the sand filter was sampled at a sampling point of a pipeline using the sampling device. Sample volumes varied between 463 and 1000 L (
Table 1).
2.3. Avoidance of Contamination
Precautionary measures in the laboratory minimized sample contamination by MPP and MPF. All materials used were made of glass or stainless steel. In a few exceptions, rarely occurring polymer materials were used, which were not considered in the analysis. Exceptions were: polycarbonate (membrane) for filtration of chemicals, acrylonitrile-butadiene rubber and polytetrafluoroethylene in gaskets, silicone in hoses, and perfluoroalkoxy polymer resin in squirt bottles. All procedural steps were carried out in a laminar flow box (MSC Advantage 12, Thermo Fisher Scientific Inc., Waltham, MA, USA), and cotton lab coats were worn consistently. The chemicals were filtered through a polycarbonate membrane filter (RTTP04700, Merck KGaA, Darmstadt, Germany) with a pore size of 1.2 µm and stored in all-glass chemical bottles until use. The laboratory equipment was thoroughly cleaned using a cleaning agent specially produced for this purpose according to [
27]. The agent consisted of sodium dodecylbenzene sulfonate (Carl Roth GmbH & Co.KG, Karlsruhe, Germany) and polyethylene glycol lauryl ether (Brij-35, Carl Roth GmbH & Co.KG, Karlsruhe, Germany). Afterwards, the materials were rinsed with tap water and ultrapure water (Milli-DI, Merck KGaA, Darmstadt, Germany). All cleaning steps were performed immediately before usage to avoid contamination by storage. Cleaned equipment (e.g., beakers) was covered with aluminum foil for transport into the laminar flow box.
2.4. Sample Processing
2.4.1. Chemical Purification
To remove natural organic residues, the samples were oxidized with H
2O
2 (Rotipuran p.a. 50%, Carl Roth GmbH & Co.KG, Karlsruhe, Germany) for 24 h at 50 °C. A treatment with NaClO (12% tech., Carl Roth GmbH & Co.KG, Karlsruhe, Germany) followed for 6 days at room temperature. By using an all-glass vacuum filter holder (Merck KGaA, Darmstadt, Germany), the samples were filtered through a stainless-steel mesh filter (10 µm twilled weave, Spörl KG, Sigmaringendorf, Germany) between the various processing steps and quantitatively transferred to glass beakers. The glass beakers were rinsed with n-hexane (HiPerSolv CHROMANORM, VWR, Radnor, Pennsylvania, USA) and ultrapure water after each sample transfer. N-hexane has proven to be an appropriate agent for rinsing MP from surfaces [
12].
2.4.2. Density Separation
After the oxidation process, the remaining sample consisted of a mixture of MP and inorganic particles on a stainless-steel mesh filter. The filter was transferred to a 250 mL glass beaker, covered with n-hexane, and ultrasonically treated for 10 min to separate the filter cake. The filter was rinsed with n-hexane and removed from the beaker. For the subsequent density separation, ZnCl
2 (ρ = 1.6 g/cm
3, <97% p.a., Carl Roth GmbH & Co.KG, Karlsruhe, Germany) was added. Density separation was performed with a centrifuge (Sigma 3–16 L, Sigma Laborzentrifugen GmbH, Osterode am Harz, Germany). Considering the maximum volume of the centrifuge tubes, n-hexane was evaporated due to its high volume before density separation. Specially designed silicone centrifuge tubes with a volume of 90 mL were used, according to [
12]. After centrifugation, floating MP from the supernatant were quantitatively transferred to a 1 cm
2 silicon filter (Si filter) (10 μm pore width, Smartmembranes GmbH, Halle, Germany) using the all-glass vacuum filter holder. MP were transferred to the Si filter by pinching off the flexible silicone centrifuge tube with a clamp and rinsing the upper section with n-hexane and ultrapure water. In order to adapt the 47 mm filter holder to the size of the Si filter, the diameter of the filter holder was reduced to 8 mm using a custom-made stainless-steel cone, according to [
12].
2.4.3. Sample Aliquotation
The maximum number of particles that can be measured per Si filter is about 3000–4000. For a reliable measurement using Raman microspectroscopy, the individual particles must not obscure each other. Even with small volume samples of < 1 L, the particle count in industrial samples is often higher. To reduce the number of particles on the analysis filter, a sample aliquotation method was developed: a 1 L beaker (high design) was filled with 100 mL 2-propanol. After density separation (
Section 2.4.2), the whole sample was transferred to an Si filter and rinsed into the beaker with 2-propanol. The suspension in the beaker was filled up to 300 ml 2-propanol. To achieve a homogeneous mixing of the suspension, a custom-made stainless-steel construction of a flow breaker and a 3-blade propeller stirrer (
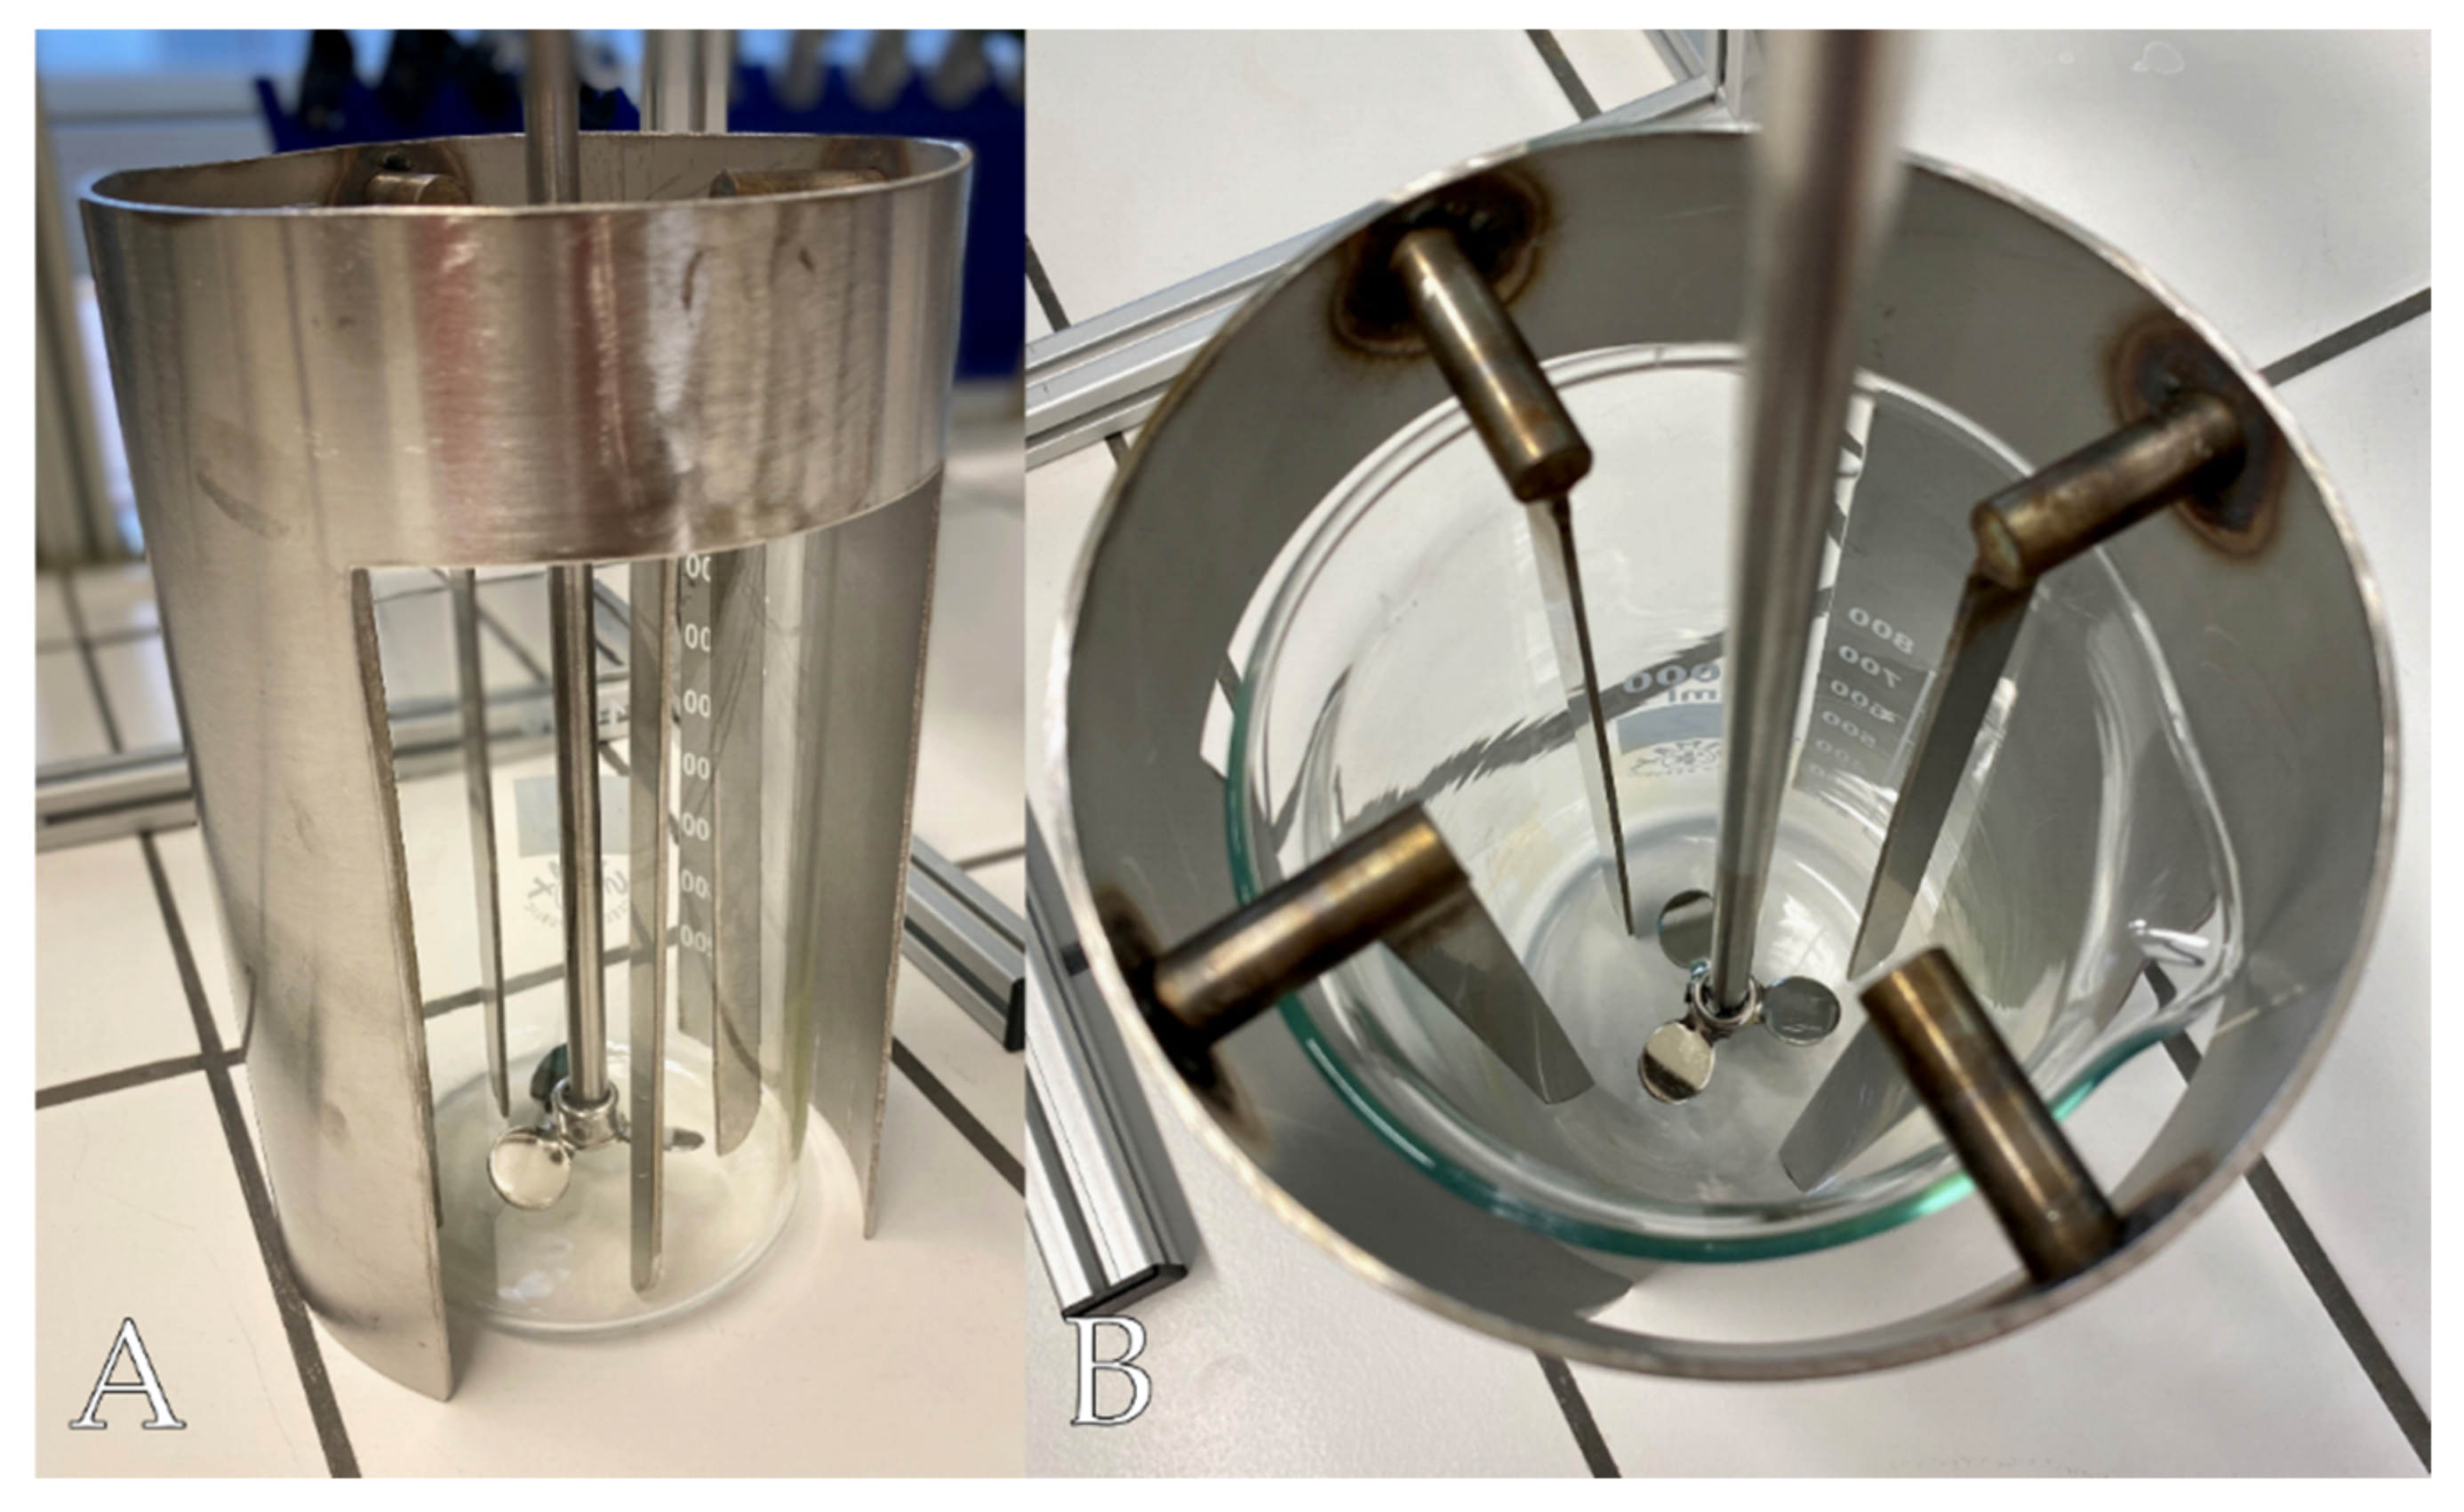
Figure 2) was used. The construction was dimensioned according to DIN 28131. The one-piece design of the flow breaker allows a constant positioning in the beaker (constant distance and constant angle between the four flow-breaker arms) and thus supports the reproducibility of the results.
The stirrer was positioned as close as possible to the bottom of the beaker (this procedure differs from DIN 28131). The suspension was turbulently stirred by using an overhead laboratory stirrer (microstar 7.5 digital, IKA-Werke GmbH & CO. KG, Staufen, Germany) at 350 rpm. For maximum suction speed, a volumetric pipette and an electric pipetting aid (pipetus, Hirschmann Laborgeräte GmbH & Co. KG, Eberstadt (Württemberg), Germany) were used. The aliquot was taken from the center of the suspension while the stirrer was running. The volumetric pipette was previously shortened with a glass cutter to facilitate handling in the Clean Bench and to increase the cross-section of the inlet opening. The cut edges were ground and melted, and the pipettes were recalibrated. The aliquot was transferred to a new Si filter, and the pipette was rinsed with n-hexane and ultrapure water. For rinsing with n-hexane, a 20 mL all-glass syringe (fortuna optima, Poulten & Graf GmbH, Wertheim, Germany) with Luer-Lock connection and stainless-steel cannula (diameter = 0.7 mm) was used.
The representativeness of the aliquoting was investigated for three size classes (22–27 µm, 45–53 µm, 90–106 µm) of spherical, fluorescent PE tracer particles (Cospheric LLC, Santa Barbara, California, USA) by determining the recovery rates. For this purpose, a defined number of tracer particles of each size class (
Table 2) were suspended in 2-propanol. The determination of the recovery rates was performed six times for each size class by transferring a 13.4 mL aliquot onto an Si filter.
The aliquotation was performed for all samples of the PVC manufacturer. It was possible to analyze aliquots of 0.34%–3% of each sample.
Table 3 shows the respective total measured volumes of each sample.
2.5. Raman Microspectroscopy
Measurement was carried out using a Raman microspectrometer (DXR2xi, Thermo Fisher Scientific Inc., Waltham, MA, USA) with a front-illuminated EMCCD detector. The applied acquisition parameters were a laser wavelength of 785 nm, a 50 µm slit aperture, a spectral resolution of 5 cm
−1, a laser power of 20 mW, a step size of 4 µm, an exposure time of 0.025 s, and an acquisition number of five. The optical lens used has a 10× magnification and a numerical aperture of 0.25. In addition, measurements were performed with an activated EM-mode (electron multiplier) and baseline correction. The spectra were compared with a reference library (S.T. Japan Europe GmbH, Köln, Germany) in the range of 50–3250 cm
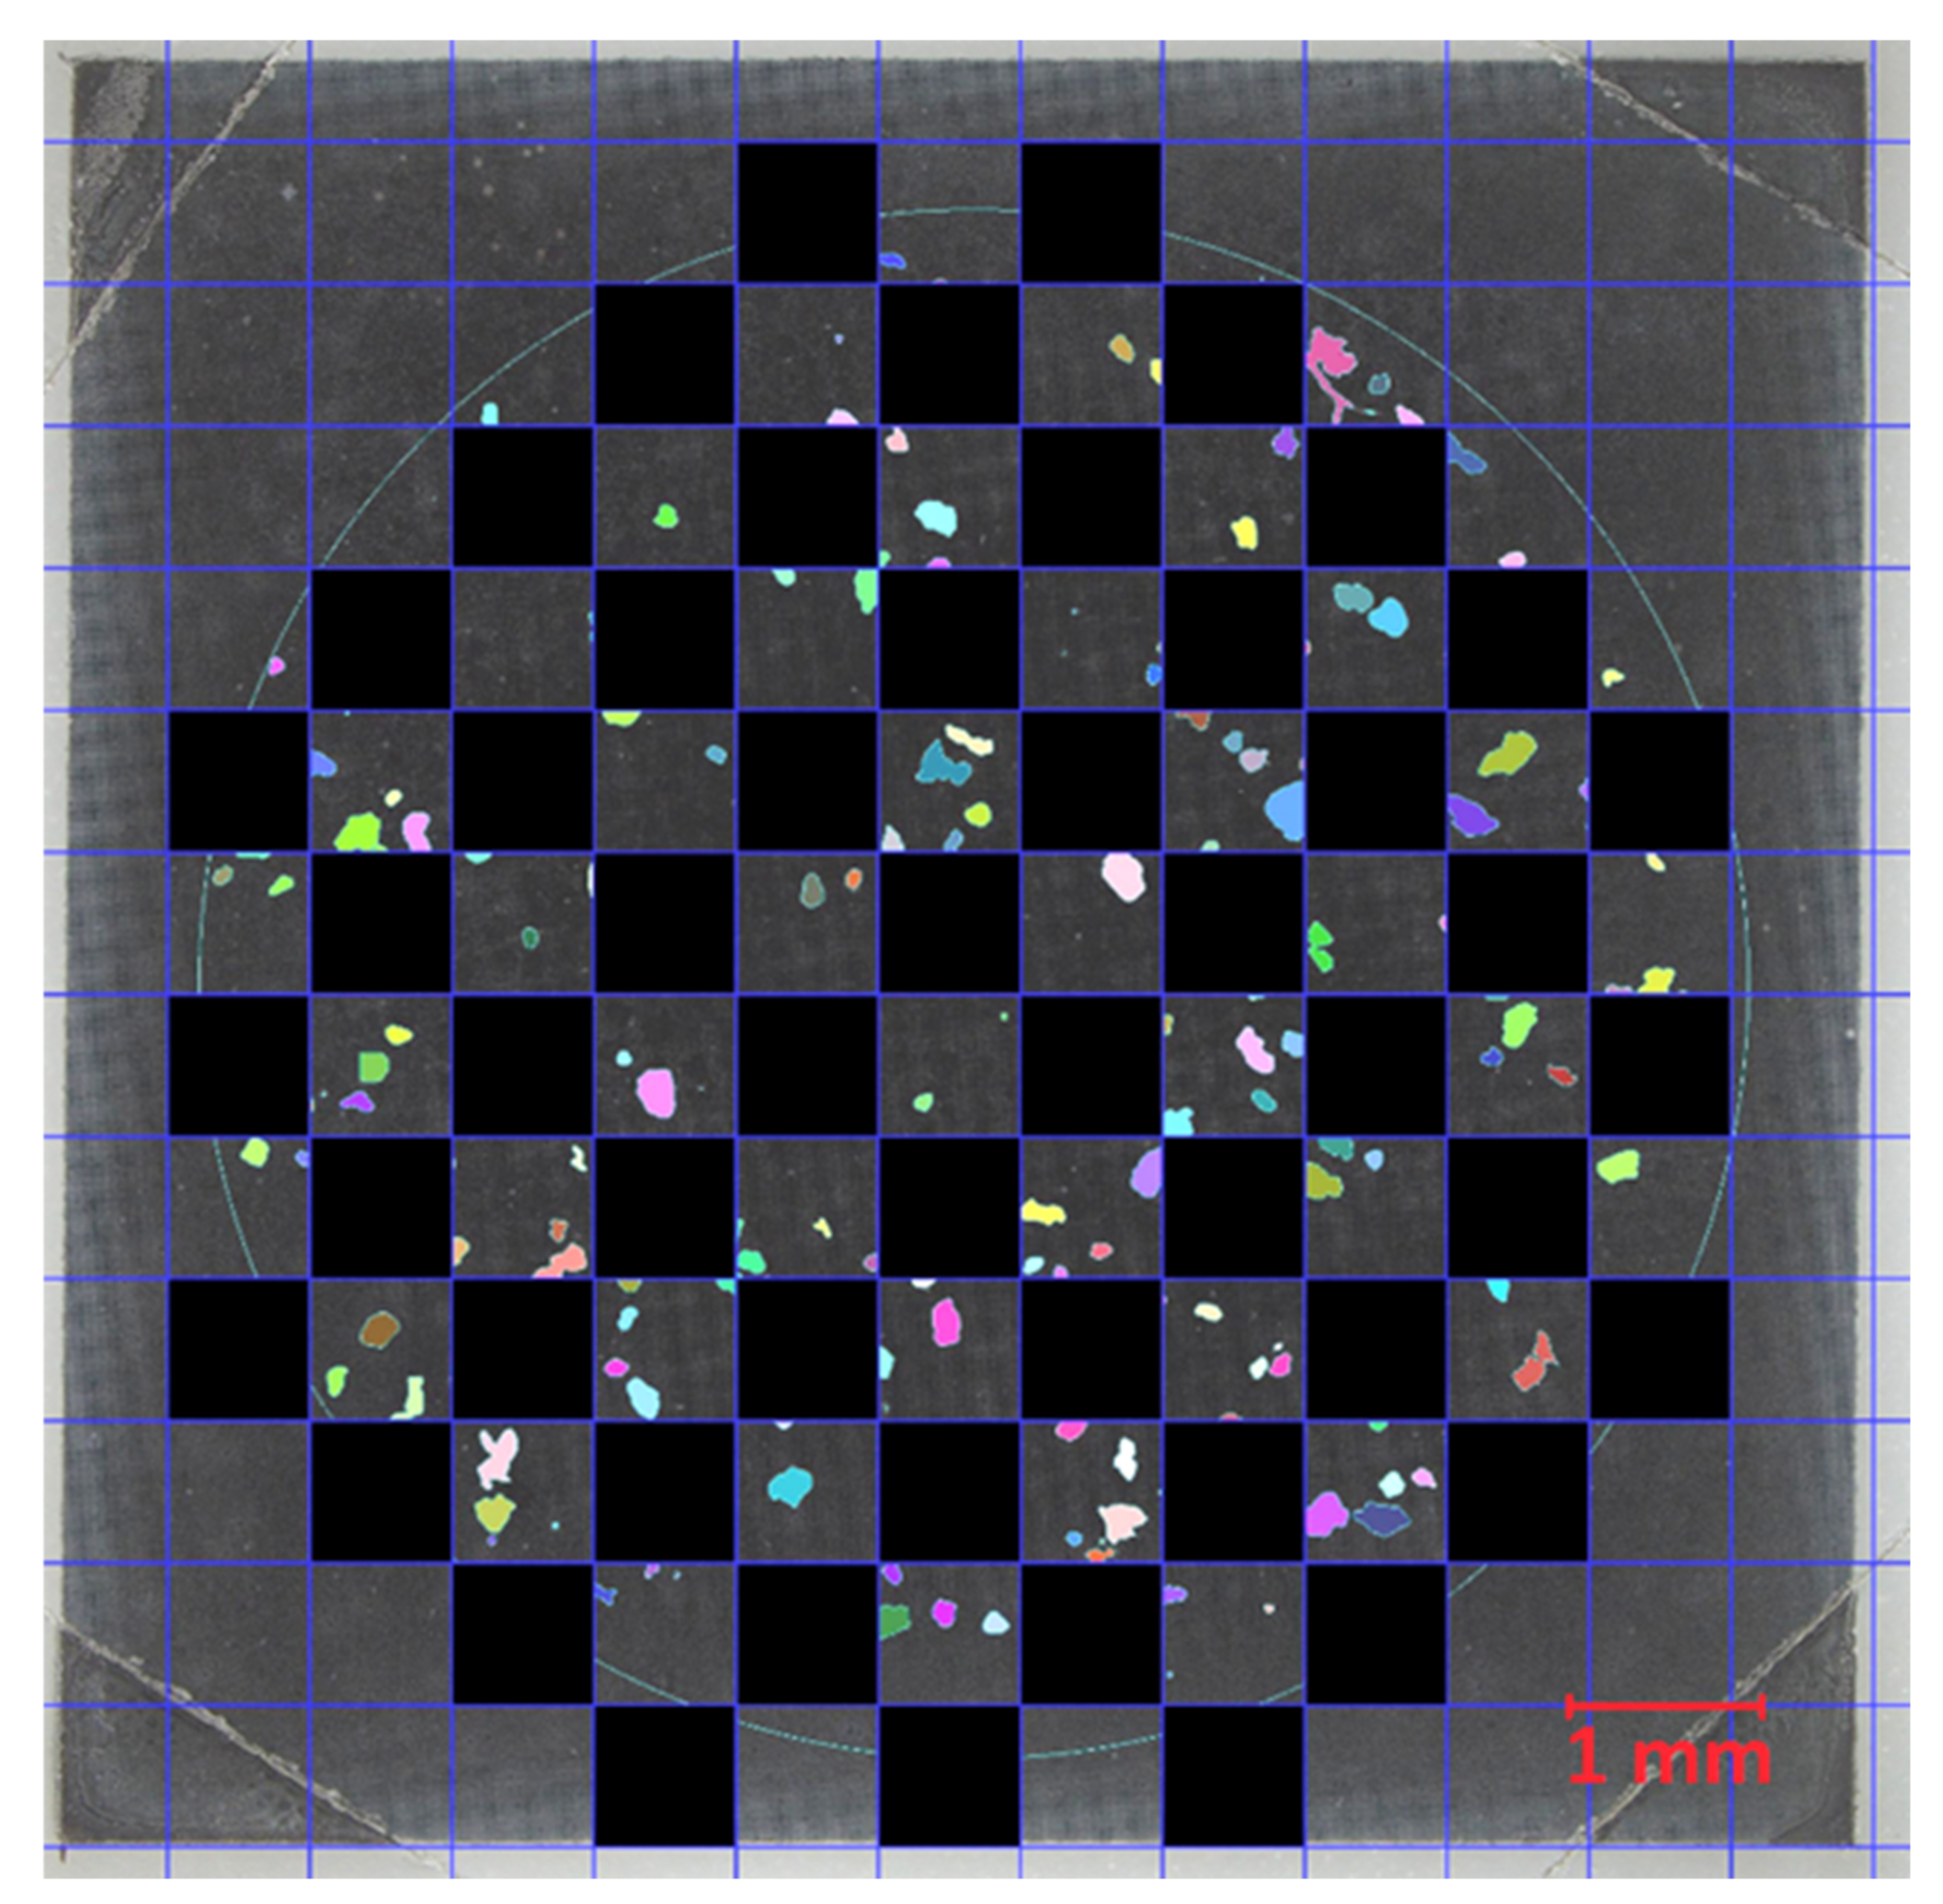
−1. Due to time constraints, only 50% of the filter cake was analyzed by Raman imaging. No homogeneous particle distribution on the Si filter was achieved due to the rinsing procedure in the final filtration step (
Section 2.4.2). To account for the irregular particle distribution, a checkerboard pattern (
Figure 3) as described in [
27] was used. With the checkerboard pattern, each position on the filter was equally weighted during extrapolation. MPP > 100 µm and MPF were analyzed on the total filter area. This increased the accuracy of the results with little additional effort. MPP and MPF identified with the above method were extrapolated to the total filter area for evaluation.
2.6. Blank Samples
A cleaned, unloaded stainless-steel filter and stainless-steel housing served for the examination of blank samples. Eight blank samples were treated in the same way as the regular samples, using the same materials and chemicals and performing the same procedural steps as for the processing of the wastewater samples.
2.7. Statistical Analysis
Statistical analysis was conducted according to [
27]: the particle numbers of each polymer type of each sample determined by Raman microspectroscopy were extrapolated to the total area of the Si filter and then converted to log
10 values and compared with the log
10 values of the corresponding mean blank value. An f-test (significance level of 0.05) was initially used to verify whether or not the variances of each polymer type differed significantly in municipal wastewater samples from procedural blank samples. Then, a two-tailed t-test (significance level of 0.05) was performed for the values with equal variances. In the case of unequal variances, Welch’s t-test (significance level of 0.05) was performed (see
Supplementary Data).
The results of the industrial wastewater samples were considered as single determinations (
Section 4.5). The results were classified as significantly above the blank value if they were above the mean blank value plus six times the standard deviation of the blank values.
Polymer types that did not prove to be significant within each sample series are not mentioned in the results.
4. Discussion
4.1. Sampling and Sample Processing
Samples of the PVC manufacturer were taken during summer, while samples of the municipal WWTPs were taken during winter. It is assumed that there are no seasonal variations in the elimination rate of MP in sand filters within a plant.
The higher the TSS load, the lower the filterable wastewater volume due to filter clogging during on-site sampling. Thus, the TSS concentration of the sample limits the sampling volume. The sample volume must be large enough to obtain enough MPP and MPF and therefore to be able to detect possible significant differences in particle numbers from the blank value. For low procedural blank values, the sample volume may be smaller. Potential errors caused by extrapolating the particle numbers to one cubic meter decrease with a higher sample volume. In wastewater with a low TSS concentration (e.g., after a filtration stage), a higher sample volume is required to obtain a representative sample [
21]. Therefore, the sample volumes of the sand filter effluents of the municipal WWTPs were >2m
3.
Due to the TSS load still present in the effluent of the final clarifiers, the sample volumes taken were quite small (18–190 L). The long hydraulic residence time and internal recirculations within a WWTP reduce fluctuations in the composition of the effluent during dry weather conditions. Therefore, we consider the grab samples taken to be representative.
The TSS in the effluent of the final clarifier consists mainly of activated sludge (bacteria, algae, eukaryotic microorganisms), as well as a few small sand particles and other inorganic substances. MP must be separated from these residues, as they interfere with the Raman measurement. The sample processing removes these organic and inorganic impurities almost completely. Wolff et al. [
12] showed that the recovery rate of fluorescent PE particles within the applied analytical procedure is very good (approx. 66% for the 90–106 µm size class and 90% for the 250–300 µm size class). Furthermore, they [
12] showed that most relevant types of polymer are resistant to the oxidative treatment applied.
The majority of available studies did not investigate the recovery rates or the chemical resistance of MP for the specific procedures. This may be due to a lack of available and suitable reference material (MPP and MPF). This issue needs to be addressed by the MP research community. The aim should be to develop reference materials that represent secondary MP (since this is the predominant type) in water/wastewater matrices as realistically as possible. The use of a common reference material in as many research groups as possible would support the development of a standardized procedure since the performance of different analytical procedures could be compared. Currently, the comparability of the results of different studies is very limited. Von der Esch et al. [
28] showed a promising approach with the development of a simple manufacturing process for PLA, PET, and PS fragments which have similar morphologies and sizes as particles from wastewater samples. The process is based on a treatment of macroplastics with ultrasound and potassium hydroxide. Furthermore, they [
28] showed good reproducibility of the size distribution with their fragmentation procedure. Compared to previous procedures, where, for example, cryogenic grinding was used, this method seems to be quite low in effort. It should be further examined if other commonly used polymer types such as PE and PP can be fragmented as reliably.
4.2. Blank Samples
The consistently low blank values show that the precautions taken to avoid contamination are very effective. On average, the blank values were about 12 times lower than in samples of the final clarifiers and about 6 times lower than in samples of the sand filter effluents from both municipal WWTPs. For the corresponding samples of the PVC manufacturer, this factor was on average 330 and 150. MP made of PE, PP, and PET were identified in the blank samples. A possible source of contamination for PE and PP are chemical containers, which are mostly made of these materials. Contamination by PET is probably mainly due to airborne fibers from synthetic clothing. MP contamination from the tap water used to rinse the sampling device is not relevant since German tap water contains negligible amounts of MP [
27,
29].
4.3. Sample Aliquotation
The MP PE tracer particles used to validate the aliquotation procedure are spherical, with densities of 0.995 and 1.005 g/cm3. No major differences in recovery rates were found for the investigated size classes and densities. Whether this applies to MP of lower or higher densities (e.g., for PVC with a density of about 1.4 g/cm3) cannot be deduced from the data. This constraint also applies to other particle morphologies and different polymer properties, which were not considered in these experiments. Spherical particles are uncommon for MPP in wastewater matrices. Most studies primarily identified irregularly shaped MPP. The flow pattern of irregularly shaped particles may differ from spherical particles. However, the energy input by stirring is very high, so that friction losses due to rough surfaces and moments of inertia of the particles are negligible due to the small dimensions and low mass. The recovery rate of MPF with aliquoting is unknown, since no reference MPF are available for experimental purposes. In order to further solidify the accuracy of the aliquoting process, more experimental work still needs to be done.
4.4. Statistical Analysis
The high effort of sample preparation allowed only three sampling events to be performed at each sampling point.
A statistical evaluation based on absolute particle numbers is not appropriate for samples with low particle numbers (e.g., effluent of sand filters), which hardly differ from the blank values. For example, the difference between a MP count of 2 and 9 in a sample is not relevant, since contamination with MP from air or chemicals cannot be prevented. The small absolute difference in particle number could be statistically significant for the difference from the blank value, although this is not the case at all.
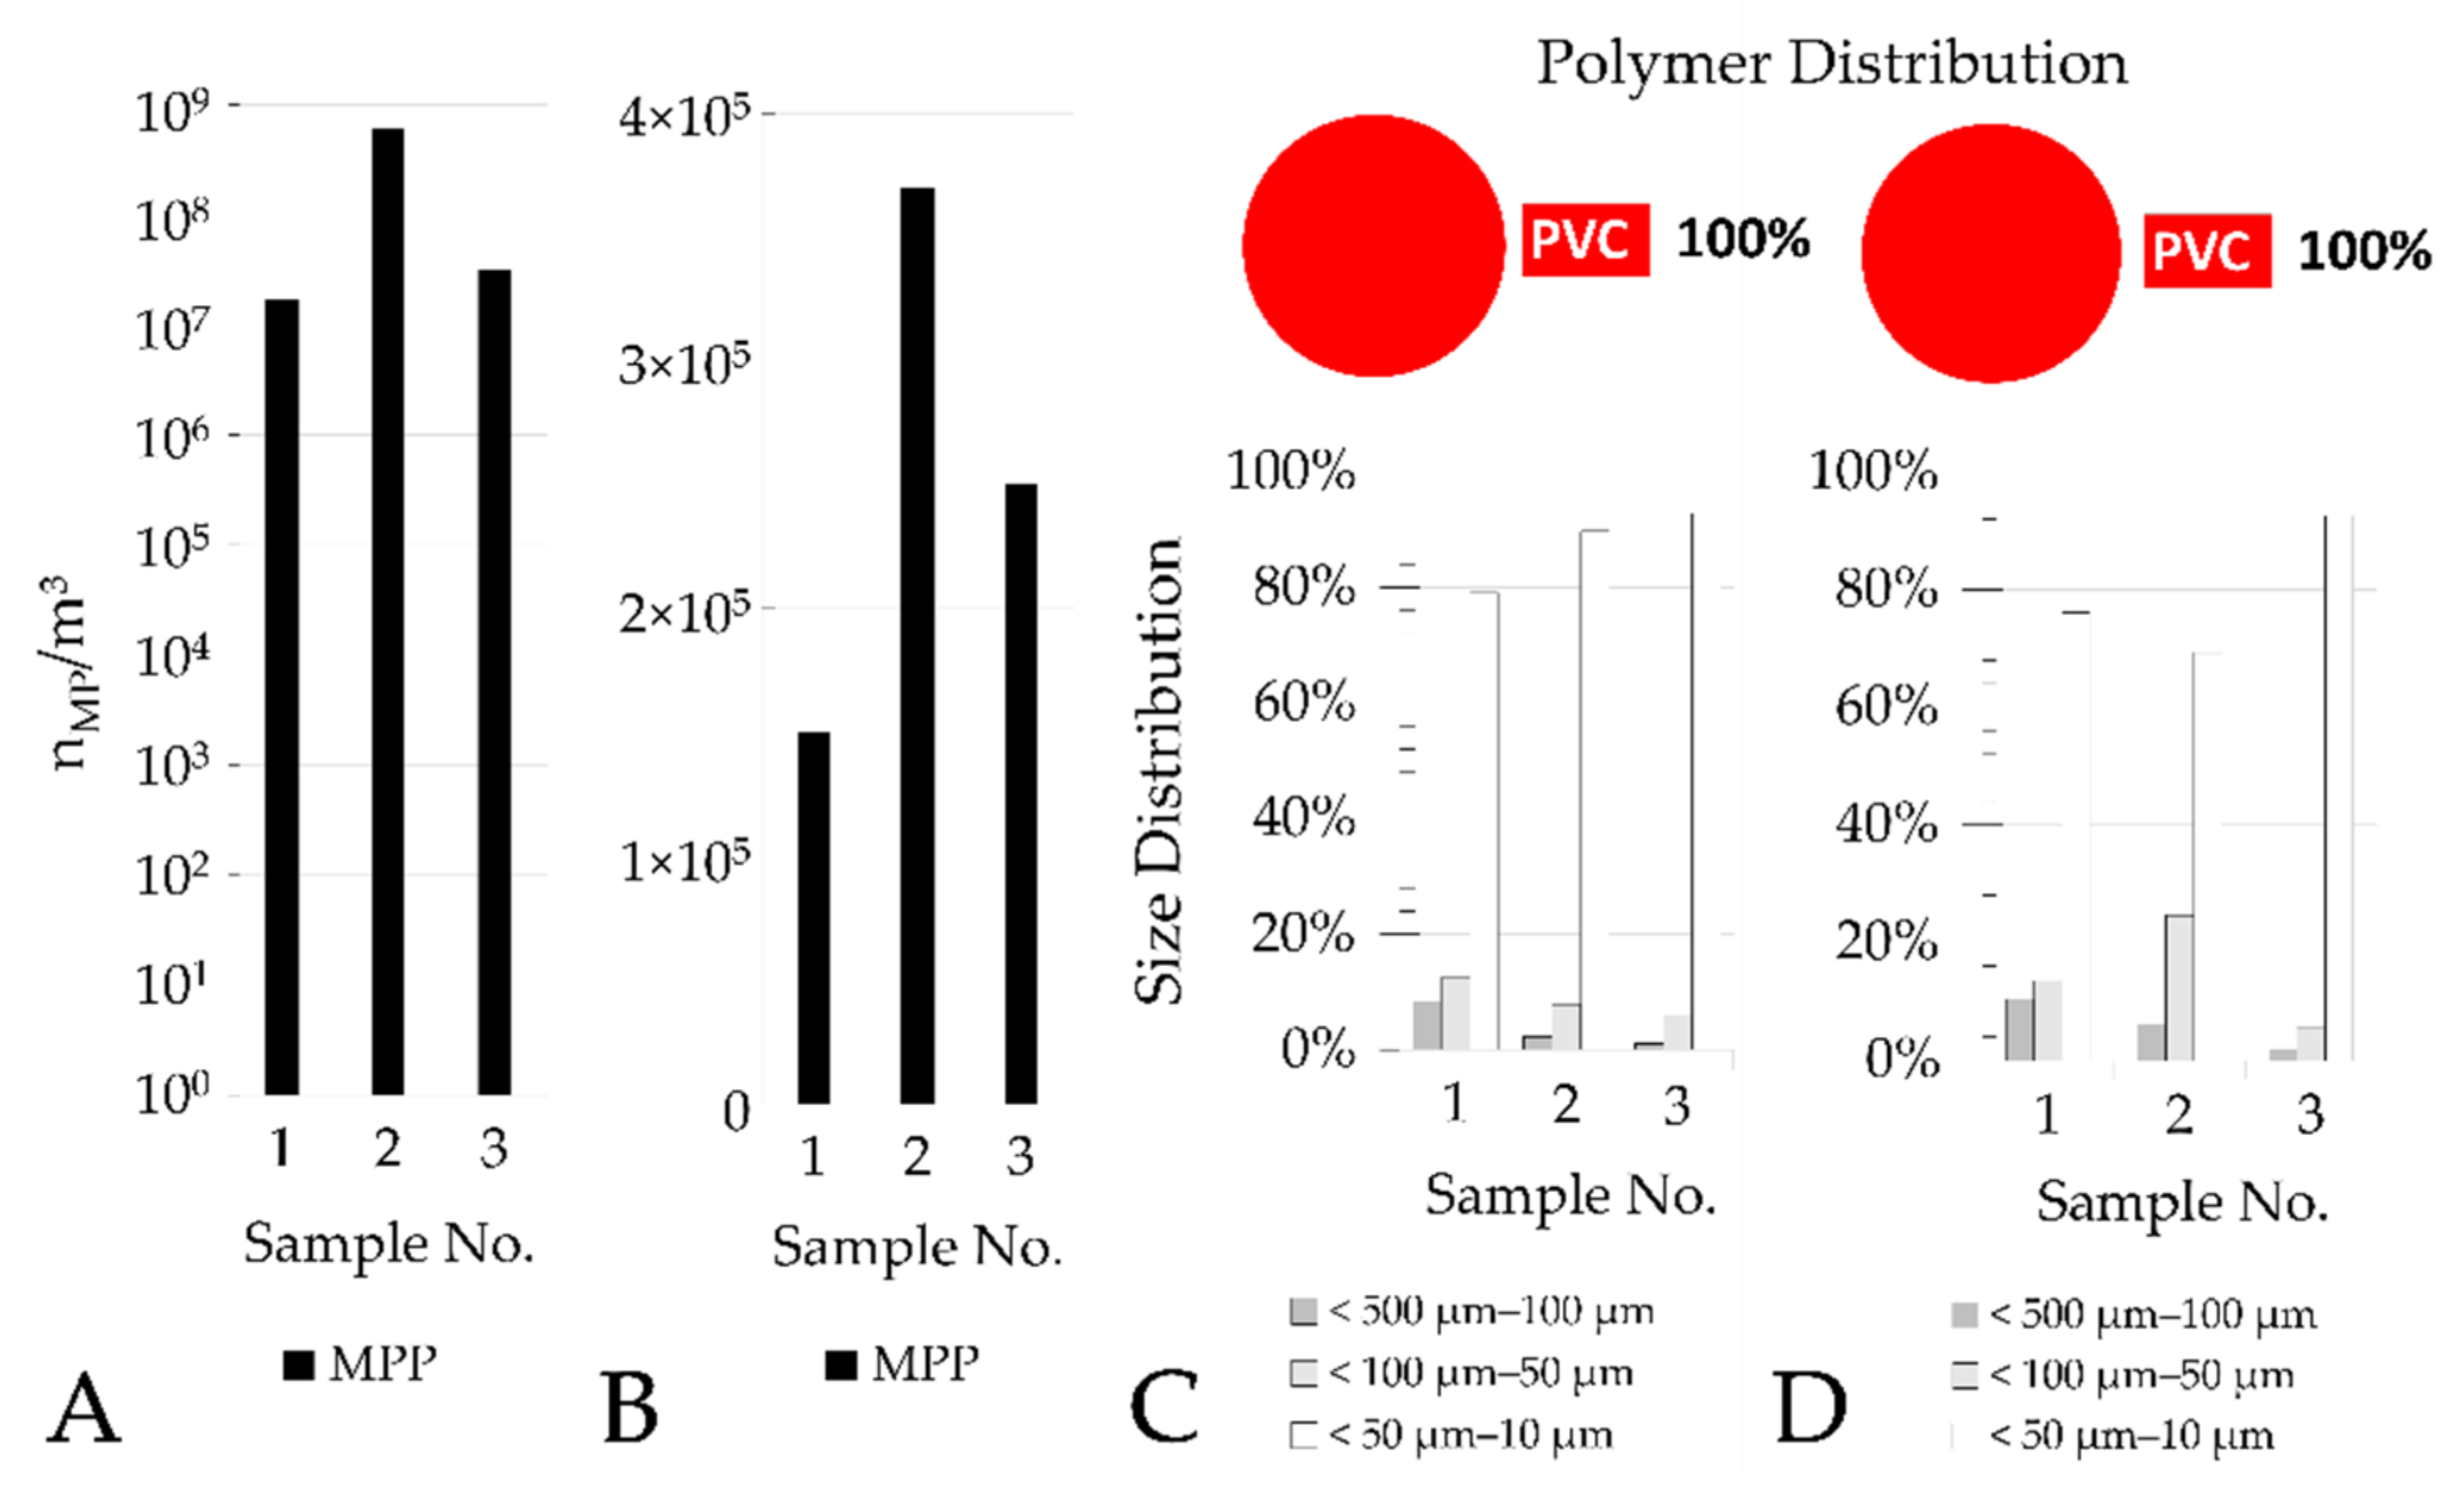
This also applies to samples with a very high particle concentration, which are extrapolated from small sample volumes and the measurement of subsamples. The inlet samples to the PVC wastewater sand filter contained 1.7×10⁷ (log10-value: 7.23), 3.4×10⁷ (log10-value: 7.53), and 6.2×10⁸ MPP (log10-value: 8.79). Although the particle number in one sample is twice as high as in the other sample, this difference is much smaller than the difference to the third sample, which is more than 20 times higher.
4.5. Microplastics Elimination in Sand Filters
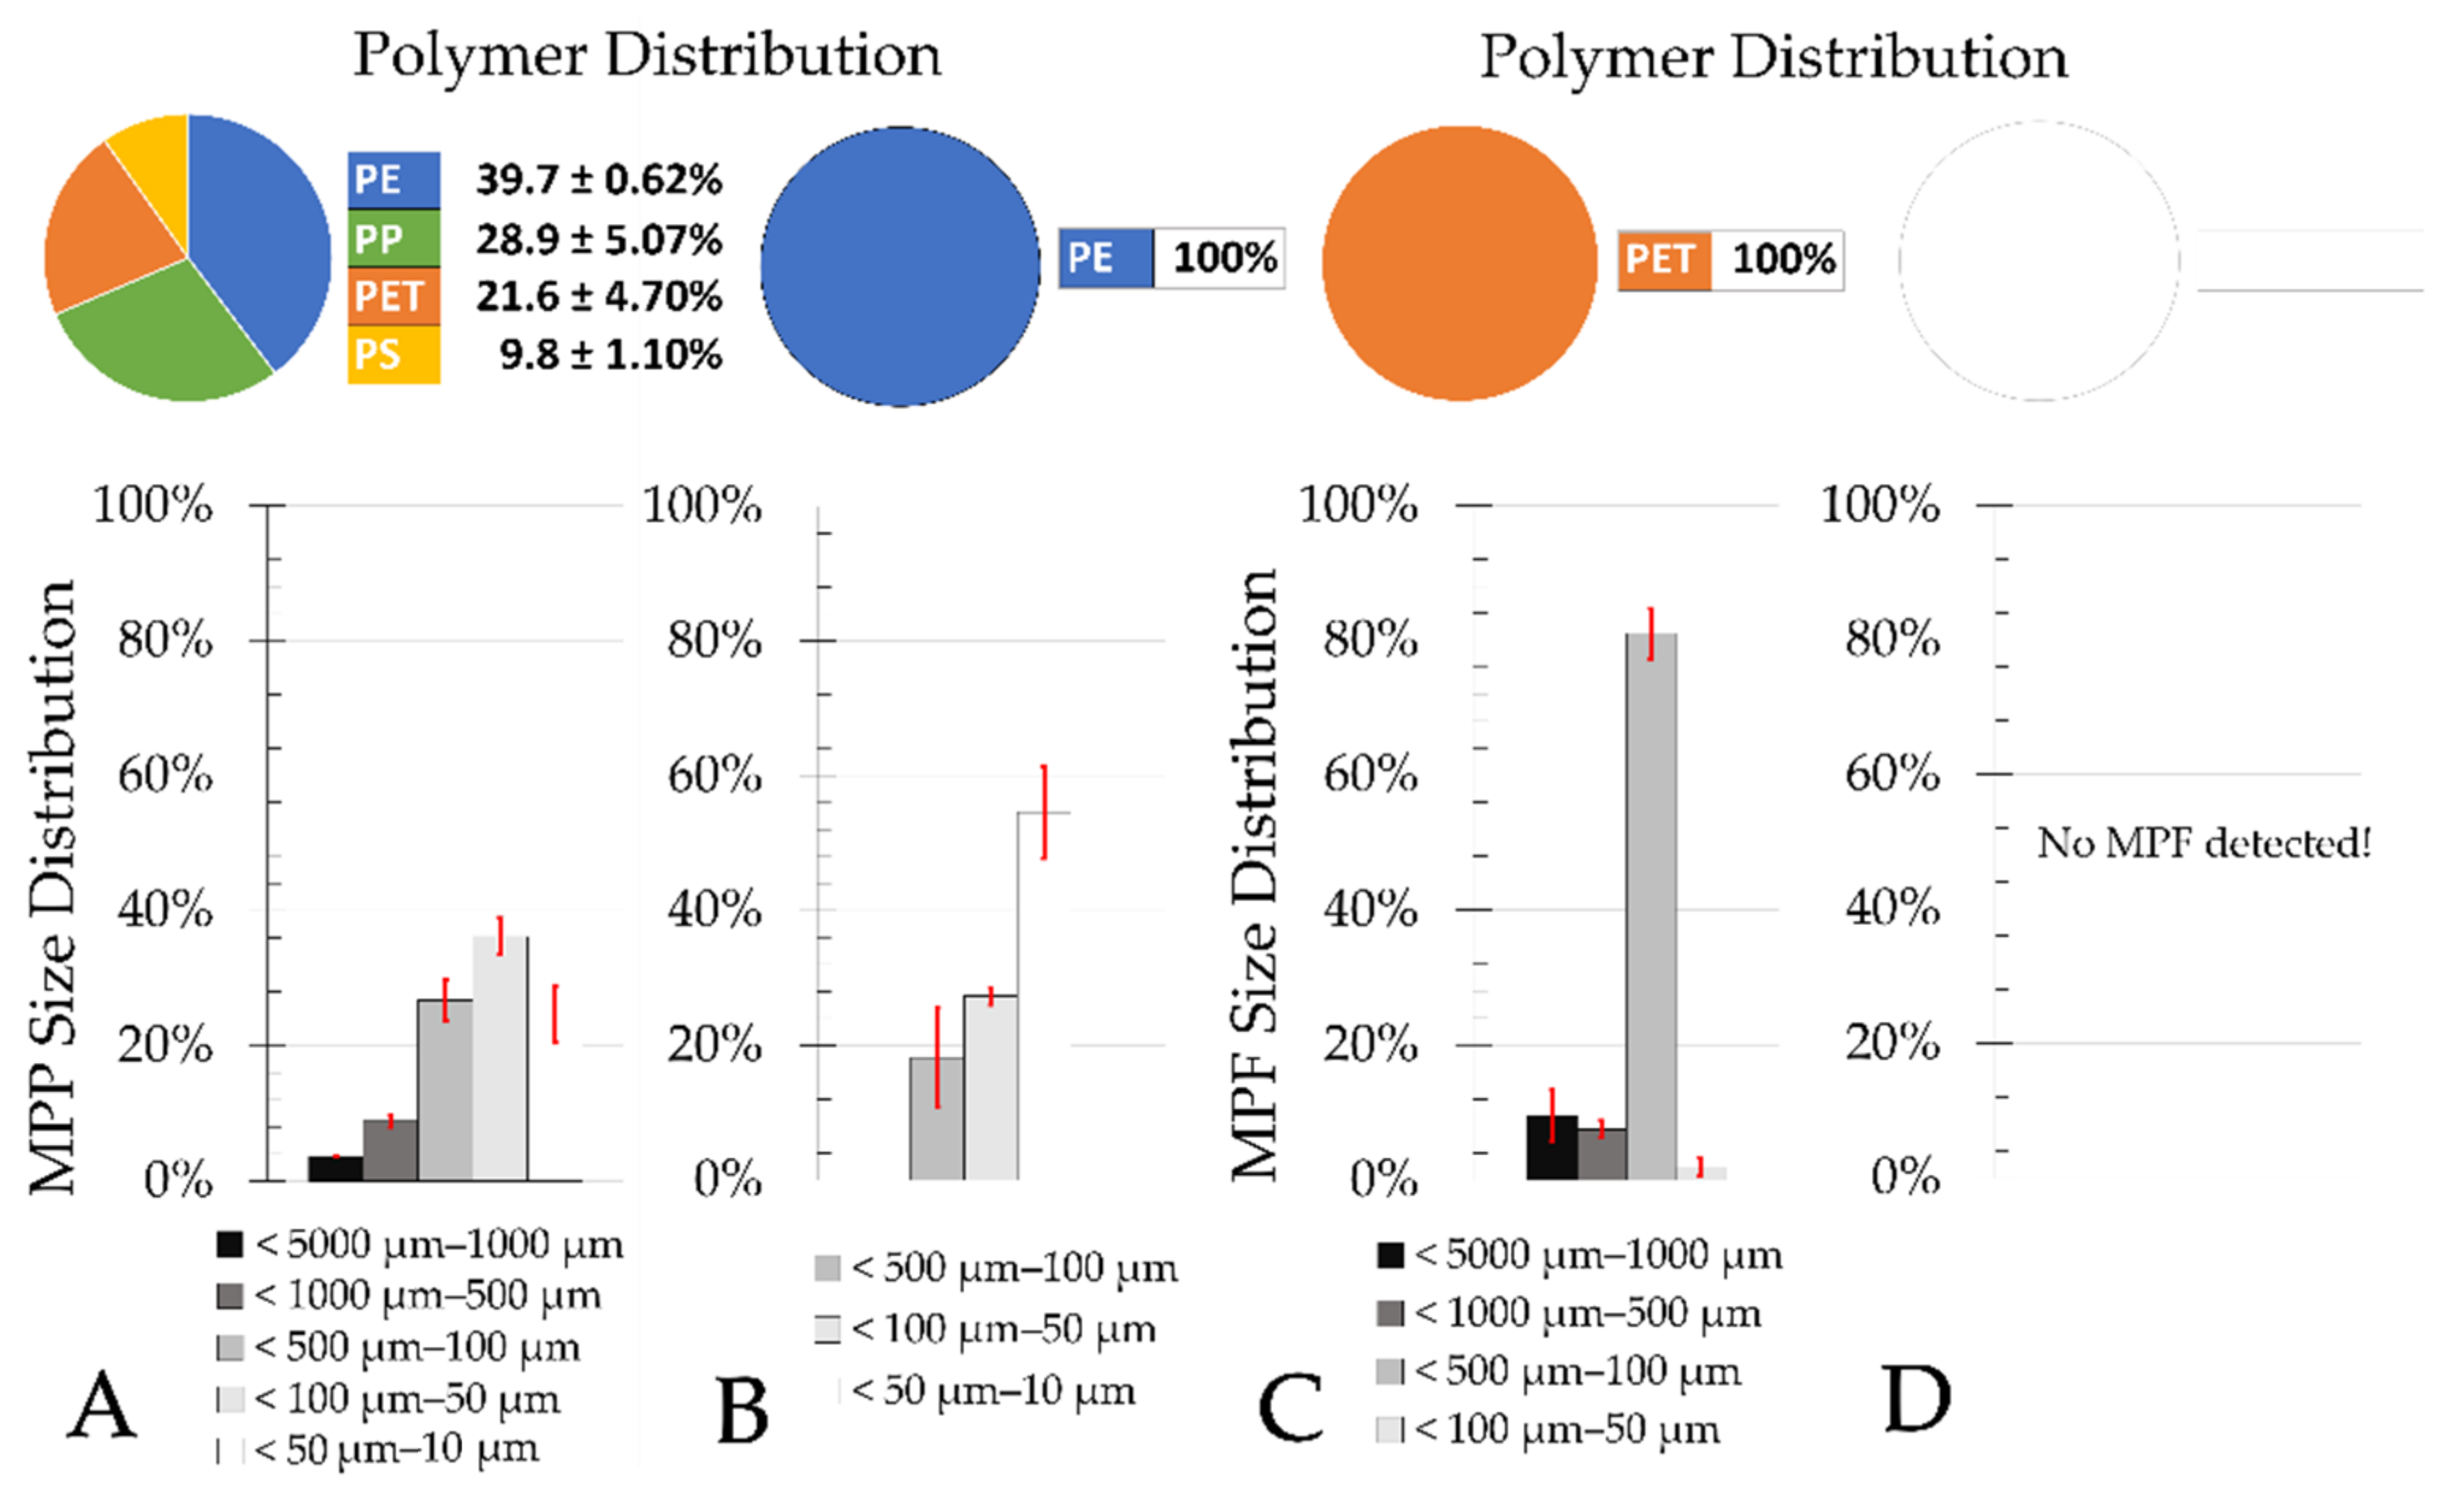
Most MPP in treated municipal wastewater is smaller than 100 µm [
12,
13,
30]. This was confirmed in this study for the final clarifier effluents and the sand filter effluents.
The total number of MP determined in the final clarifier effluents of municipal WWTPs ranged from 6.5 × 10
2 to 3.0 × 10
3 m
−3 and is in the same magnitude as results of other studies [
12,
13,
24,
25,
26]. The number of MP in the effluents of the sand filters ranged from 4 to 22 m
−3, which is comparable with the results of [
13] (cloth filter effluent) and [
26] (MBR, sand filter), whereas [
25] (ultrafiltration), [
24] (MBR), [
22] (MBR, sand filter), and [
26] (disc filter, dissolved air flotation) detected numbers that were higher by about one log
10 scale in the effluents of the respective treatment stages. When comparing the (non-extrapolated) raw MP numbers of the sand filter inflow (
Table A2) and the sand filter effluent (
Table A3), it is noticeable that within the samples of the sand filter effluent, more polymers were within the blank value range. It appears reasonable that an even larger sample volume be taken in sand filter effluents from municipal WWTPs during future sampling events. This would further increase the accuracy of the statistical evaluation of the significance tests.
The continuous sand filtration of the PVC manufacturer consists of a single media filter bed, which is operated in upflow mode with continuous backwash, while the sand filters of both municipal WWTPs consist of dual media filter beds comprising an additional layer with finer grain size. These dual media filters are operated in downflow mode and with periodical backwash. Despite these differences in design and operation, the elimination rate for MP generally remains > 99% (two log
10 scales), when calculated from inflow and outflow counts. This also means that due to the high MP inflow numbers into the sand filter of the PVC manufacturer, the number of MPP in filter effluent is in the dimension of 10
5 m
−3, and therefore considerably higher compared to the WWTP samples in Frankfurt Sindlingen and Mannheim. Considering that the pre-treated PVC process wastewater is further treated in an industrial WWTP, it is likely that these numbers will be further reduced by approximately two log
10 scales (assuming that industrial WWTPs including biological treatment have comparable MP elimination rates to municipal WWTPs [
10,
11,
16,
17,
18]). Thus, the total emitted concentration of MP into the aquatic environment are comparable to those of effluents of municipal WWTPs (without advanced downstream treatment).
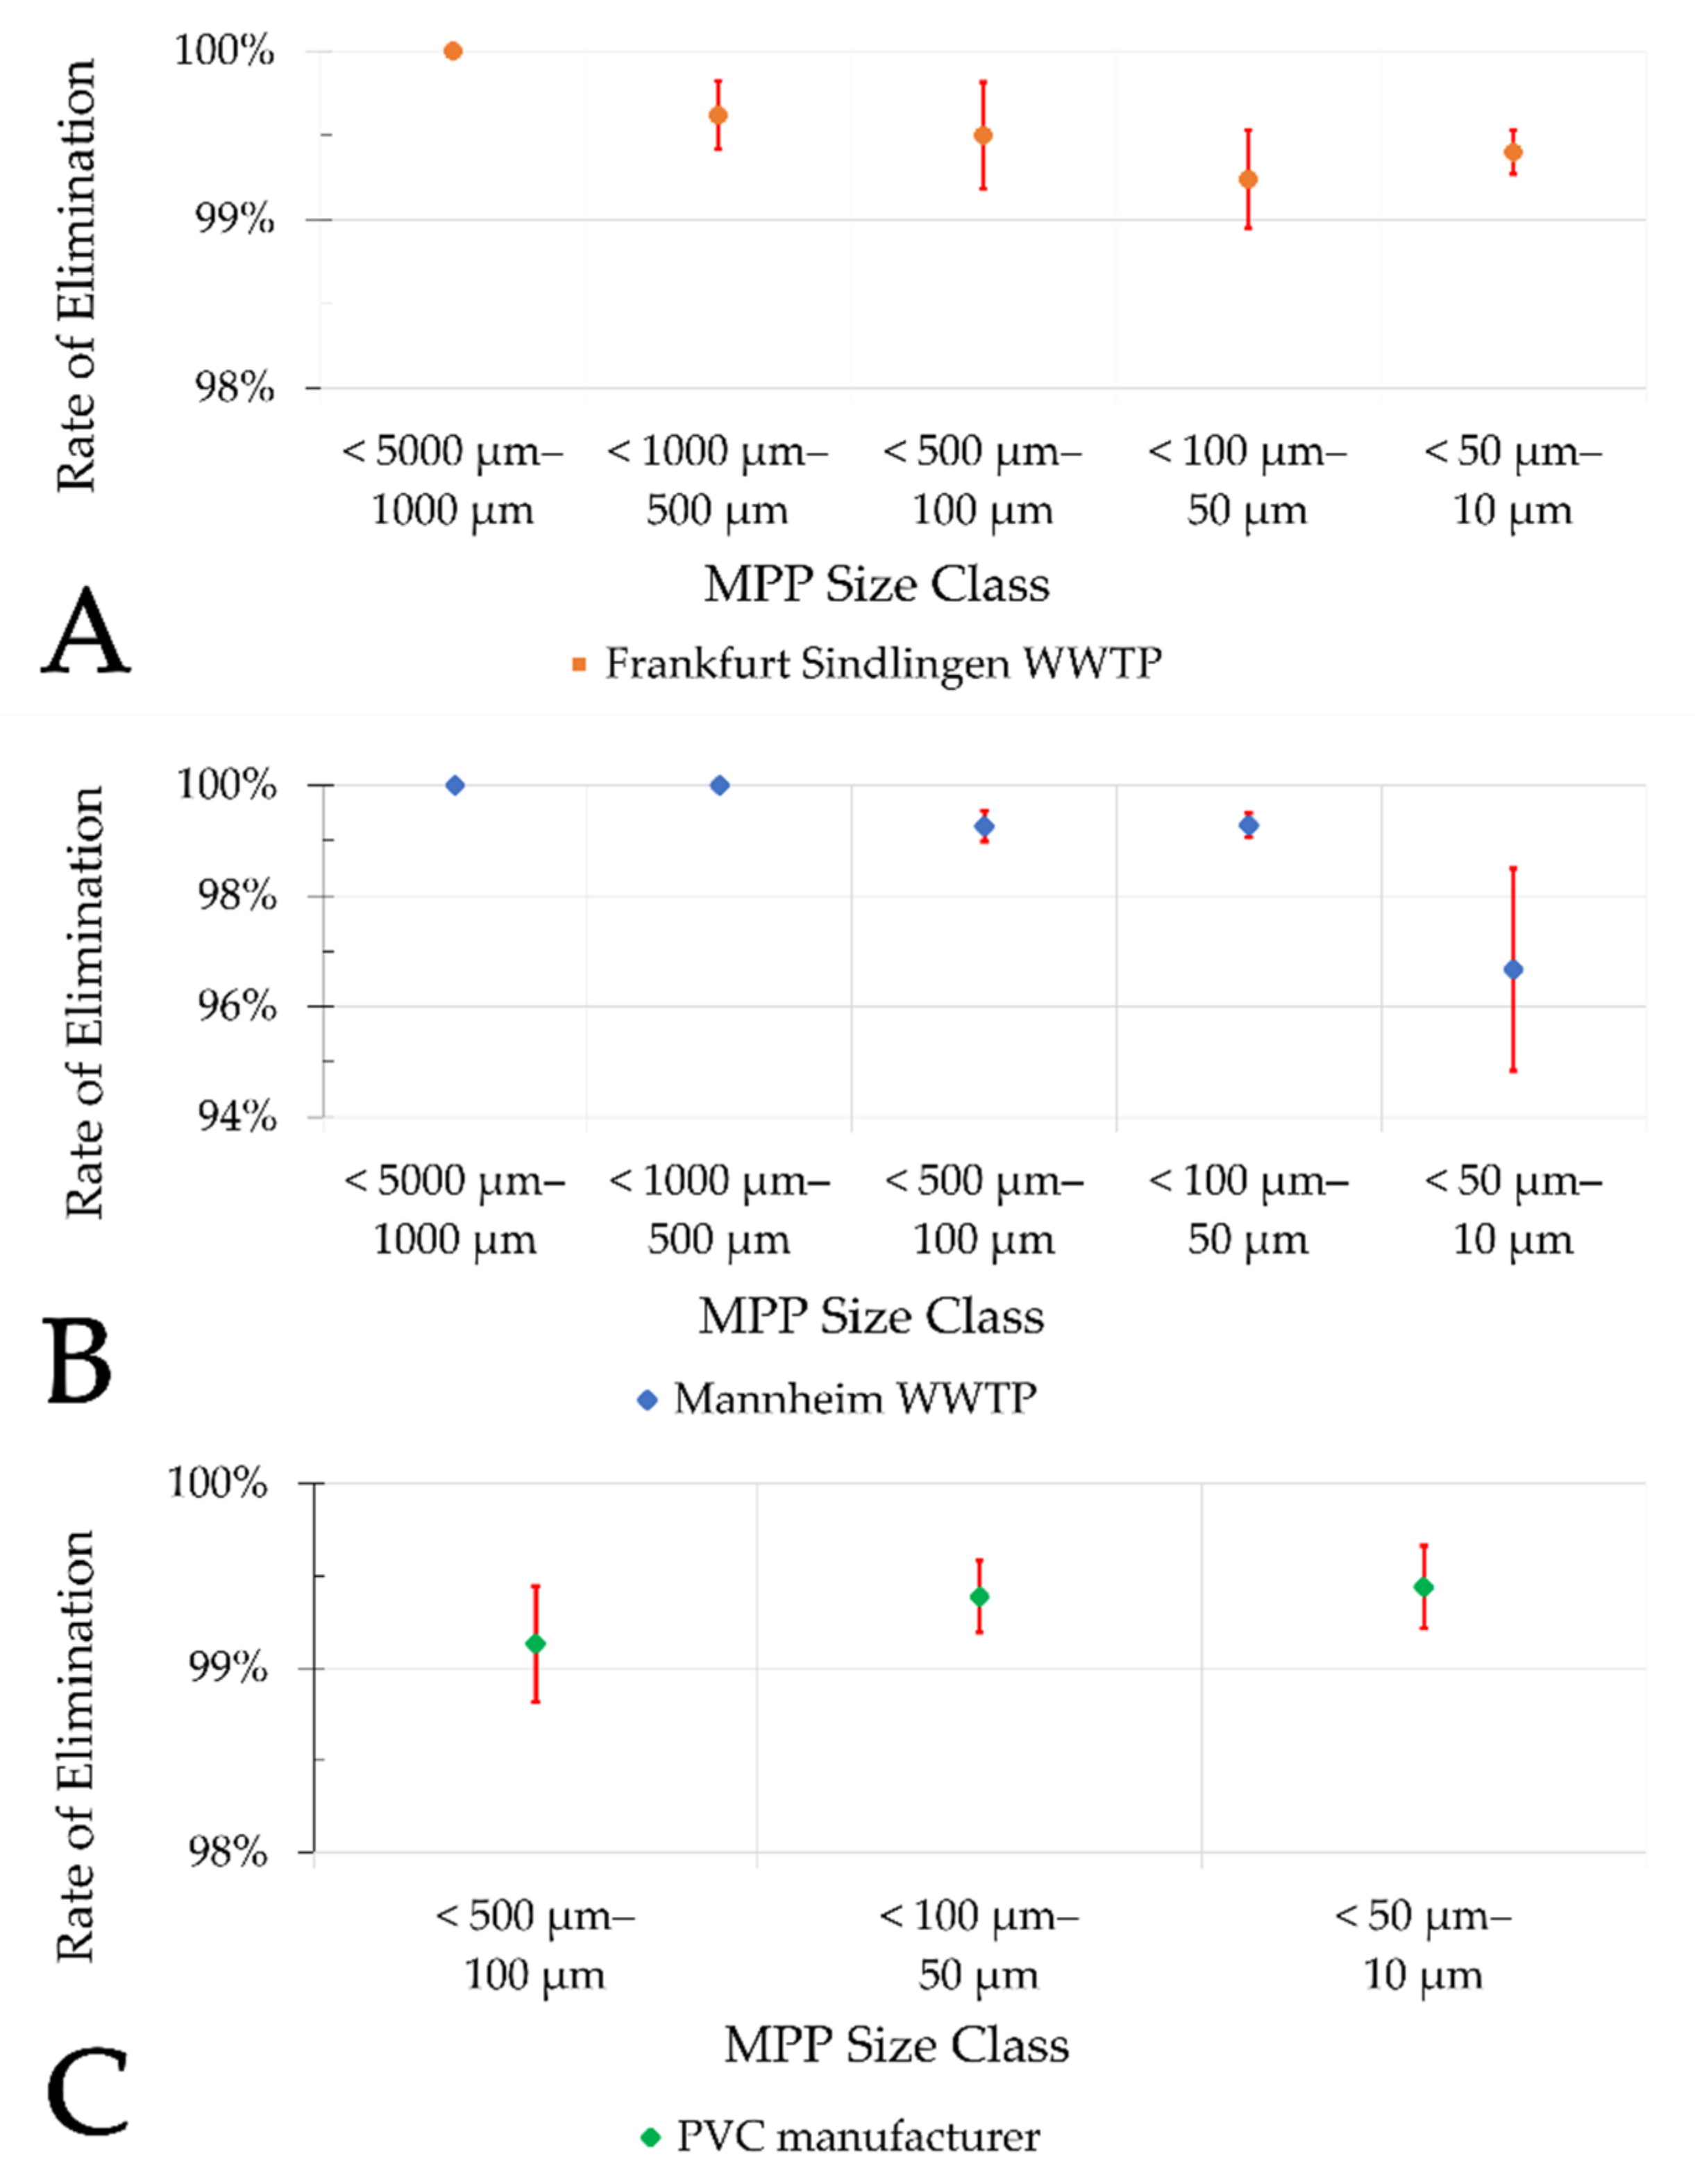
The results of this study also indicate that there is no significant difference (ANOVA, single factor, significance level 0.05) in the elimination rate of different MP size classes in sand filters of municipal WWTPs (
Figure 10A,B) and the PVC manufacturer (
Figure 10C).
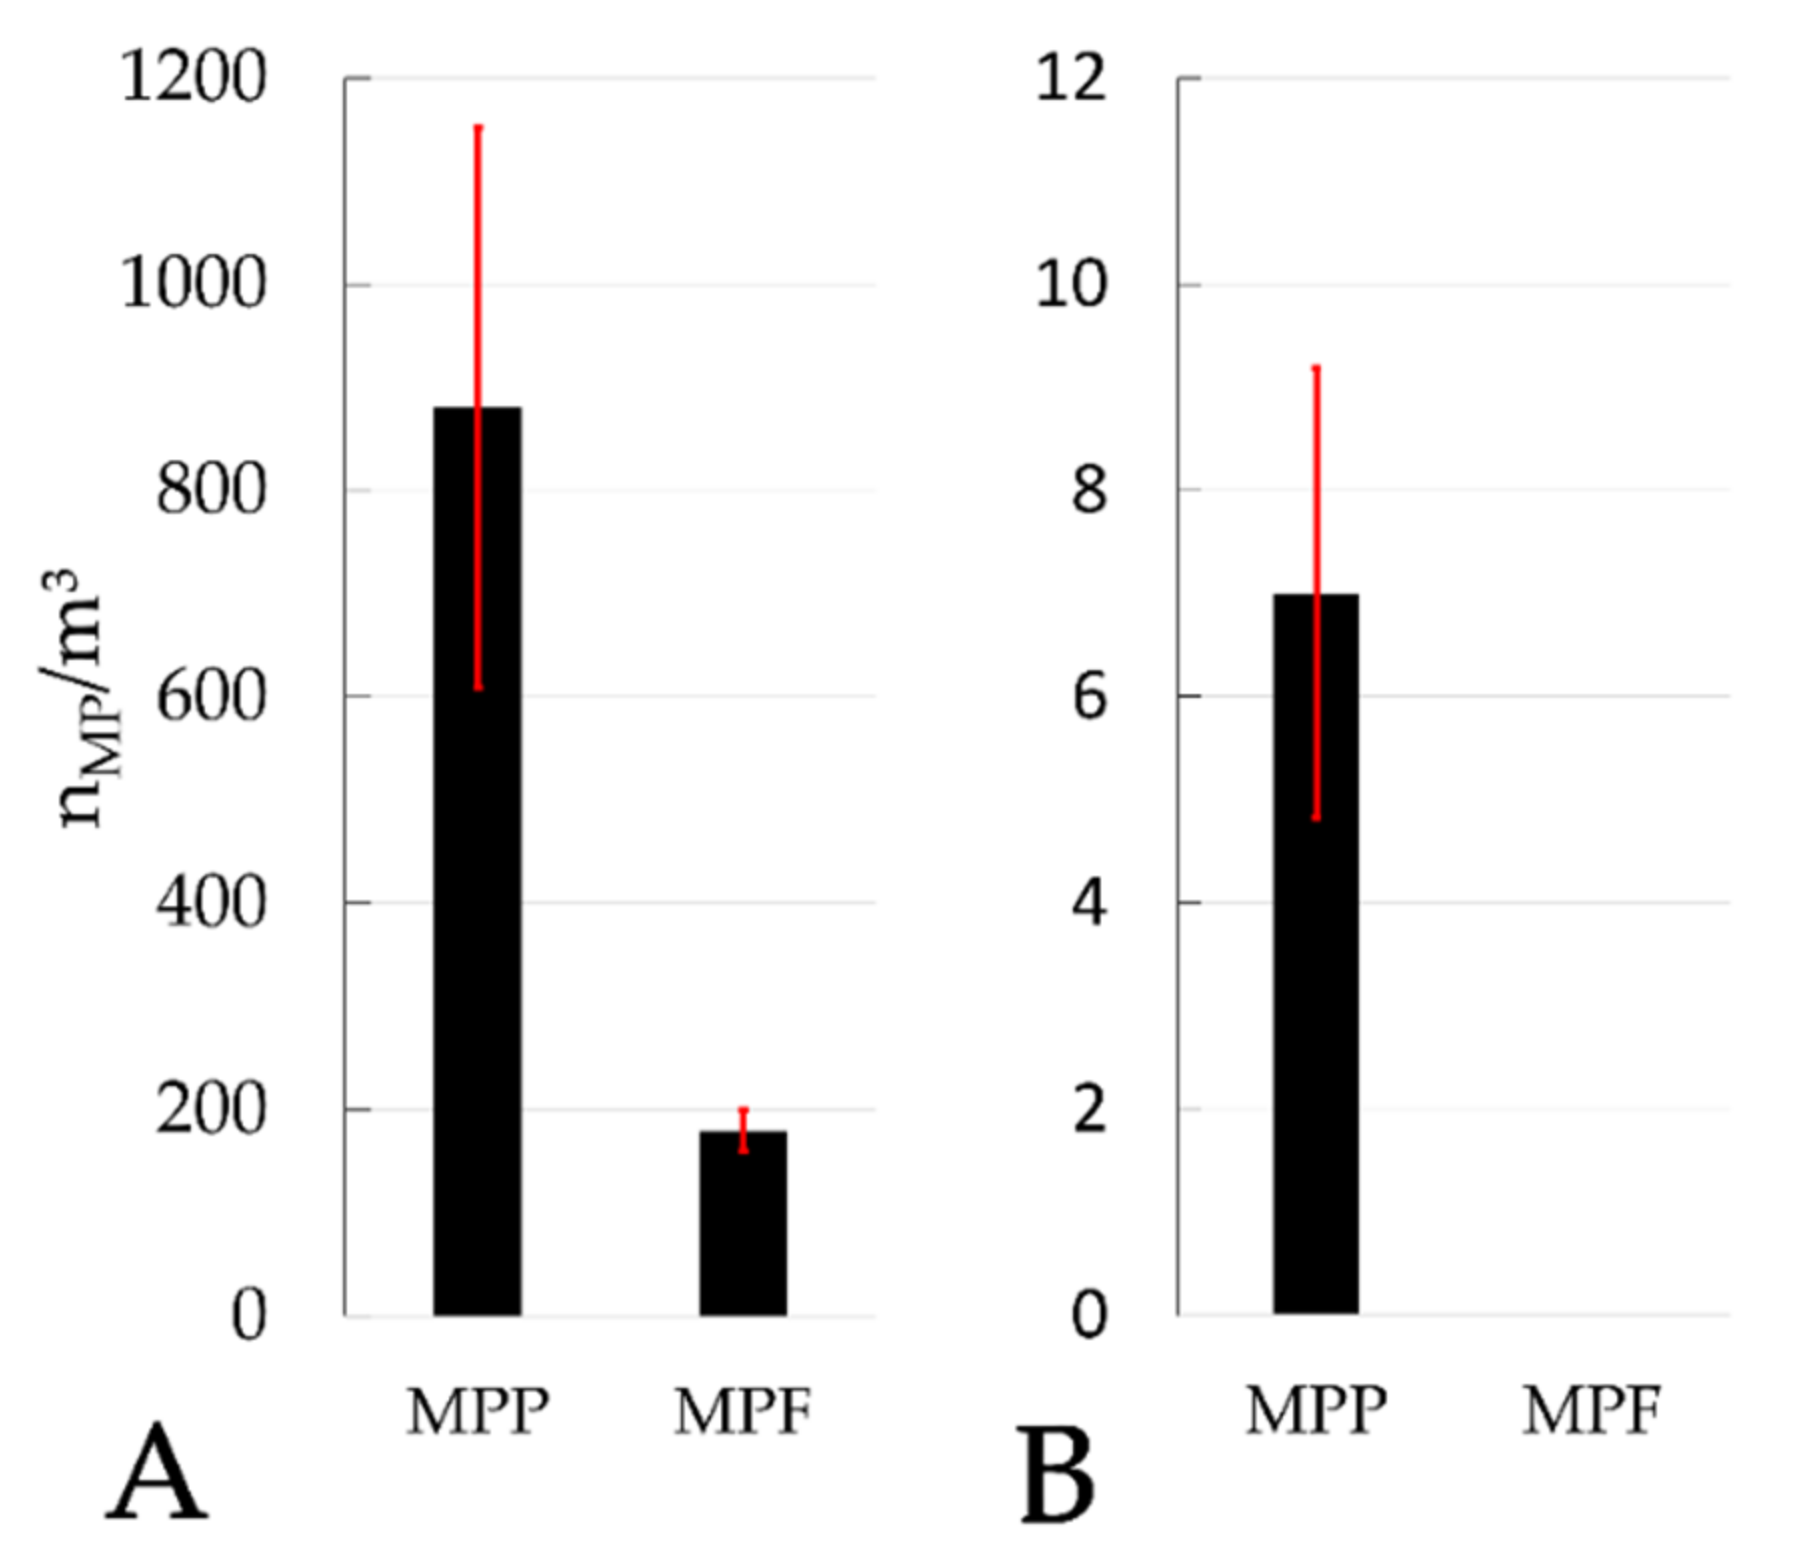
Samples from the effluent of the final clarifier in Mannheim (
Figure 4A) show a lower MP concentration than samples from the effluent of the final clarifier in Frankfurt Sindlingen (
Figure 6A). A possible reason for this is the higher TSS content of the clarifier effluent in Frankfurt Sindlingen. The results within the municipal WWTPs indicate a correlation between TSS and MP concentration (
Figure 11). A specific value (n
MP/TSS) can be derived from the straight-line equations for both treatment plants. Wastewater of the WWTP Mannheim seems to contain approx. 0.28 n
MP/mg TSS, and wastewater of the WWTP Frankfurt Sindlingen contains approx. 0.23 n
MP/mg TSS. A linear correlation between TSS and MP concentration was also observed by [
10] at seven different WWTPs in China (y = 0.051x − 3.62, R
2 = 0.966), but for samples of the inflows of the WWTPs. The determination of TSS is much easier than the determination of MP. Therefore, the relationship between TSS and MP in municipal wastewater should be further investigated. To our knowledge, there are no studies which investigated a correlation between MP and TSS in activated sludge.
The effluent values of the PVC manufacturer are probably not dependent on specific diurnal or weekly variations, but rather on less predictable, production-specific differences. This is confirmed by the widespread nature of the results of the individual samples (
Figure 8), which sometimes differ by more than tenfold. Therefore, no mean values and standard deviations were calculated for the results of the PVC manufacturer.
The results of this study indicate that the MP elimination rate by sand filtration is very high. As indicated, average elimination of at least two log
10 scales (filter influent—effluent) may be expected. No major difference in the percentage elimination rate was found between the municipal WWTPs and the PVC manufacturer. The calculated elimination rates are slightly higher compared to the results of most other studies that investigated tertiary treatment stages (
Table 5). Whether these differences are due to the analytical procedures applied or to the respective differences in the examined treatment stages cannot be deduced from the current data.
Many of these studies identified MP only by light microscopy [
23] or by spectroscopic methods after presorting by light microscope [
24,
25,
26]. According to the current state of knowledge, it is known that reliable identification of MP by means of visual inspection is not possible [
31,
32,
33]. Future studies should be focused on spectroscopic or thermoanalytical methods for better comparability.
5. Conclusions
The rate of removal of MP in WWTPs with a downstream filtration stage is very high, which means that less MP are emitted into the rivers. WWTPs are a good sink for MP when the sludge is incinerated. In many countries, it is still common practice to dump sewage sludge containing the entire quantity of separated MP in landfills or to spread it as fertilizer on agricultural areas. The occurrence of MP in agricultural soils has been proven in several studies [
34,
35]. The state of the art is the incineration of sewage sludge with energy recovery. Phosphorus can be recovered from the ashes of the sewage sludge and used as fertilizer.
A further challenge in wastewater treatment is the presence of micropollutants (e.g., pharmaceuticals or additives to cosmetics) which cannot be completely removed by biological treatment processes. For this reason, more and more WWTPs in Germany upgrade their plants with a downstream treatment stage for the elimination of micropollutants. These treatment stages are separation technologies that often include a final filtration step, e.g., for previously dosed activated carbon loaded with micropollutants. In future studies, various types of advanced treatment stages (e.g., sand filtration, MBR, etc.) should be further investigated for their MP elimination efficiency. These findings must be taken into account when designing and implementing downstream treatment stages in WWTPs.

 ,
, 


