Article

Soil Moisture Dynamics in Response to Precipitation and Thinning in a Semi-Dry Forest in Northern Mexico

by
Argelia E. Rascón-Ramos
1,
Martín Martínez-Salvador
1,
Gabriel Sosa-Pérez
2,*,
Federico Villarreal-Guerrero
1,
Alfredo Pinedo-Alvarez
1,
Eduardo Santellano-Estrada
1 and
Raúl Corrales-Lerma
1
1
Facultad de Zootecnia y Ecología, Universidad Autónoma de Chihuahua, Periférico Francisco R. Almada Km. 1, Chihuahua, Chihuahua C.P. 31453, Mexico
2
Instituto Nacional de Investigaciones Forestales Agrícolas y Pecuarias (INIFAP), Campo Experimental La Campana, Km. 33.3 Carretera Chihuahua-Ojinaga, Aldama, Chihuahua C.P. 32910, Mexico
*
Author to whom correspondence should be addressed.
Water 2021, 13(1), 105; https://doi.org/10.3390/w13010105
Submission received: 9 December 2020 / Revised: 26 December 2020 / Accepted: 27 December 2020 / Published: 5 January 2021
(This article belongs to the Section Hydrology)

Abstract

:
Understanding soil moisture behavior in semi-dry forests is essential for evaluating the impact of forest management on water availability. The objective of the study was to analyze soil moisture based in storm observations in three micro-catchments (0.19, 0.20, and 0.27 ha) with similar tree densities, and subject to different thinning intensities in a semi-dry forest in Chihuahua, Mexico. Vegetation, soil characteristics, precipitation, and volumetric water content were measured before thinning (2018), and after 0%, 40%, and 80% thinning for each micro-catchment (2019). Soil moisture was low and relatively similar among the three micro-catchments in 2018 (mean = 8.5%), and only large rainfall events (>30 mm) increased soil moisture significantly (29–52%). After thinning, soil moisture was higher and significantly different among the micro-catchments only during small rainfall events (<10 mm), while a difference was not noted during large events. The difference before–after during small rainfall events was not significant for the control (0% thinning); whereas 40% and 80% thinning increased soil moisture significantly by 40% and 53%, respectively. Knowledge of the response of soil moisture as a result of thinning and rainfall characteristics has important implications, especially for evaluating the impact of forest management on water availability.

1. Introduction

Semi-dry forests where mean annual rainfall is below 650 mm occupy approximately six percent of the world’s forest area [1]. The area with semi-dry forests in Mexico corresponds to transition zones between semi-arid and temperate ecosystems and occupies approximately 22 million hectares, located from 1400 to 2600 m above sea level [2,3,4]. Semi-dry forests are critical in northern Mexico, as they are the main suppliers of water for agriculture and cities located at the valley bottom of watersheds [5]. Water regulation or retention by semi-dry forests are regarded as typical subjects for hydrological services [6]. However, there is a lack of knowledge regarding hydrological processes and more specifically soil moisture behavior as a result of lumber harvesting and silvicultural practices in these ecosystems.
Knowledge of soil moisture is fundamental for developing an understanding of numerous hydrological processes in soil hydrology, meteorology, and ecology research [7]. Soil moisture is also an important indicator of the hydrological health of ecosystems, as there is a positive correlation with porosity, organic carbon, and sand content [6,8]. Soil moisture varies greatly in both space and time because it is controlled by several factors such as atmospheric dynamics, soil properties, vegetation characteristics, and topographic features [7]. The canopy structure plays a significant role in forested ecosystems due to rainfall interception, moisture uptake for transpiration, and shading of the forest floor, which affects sub-canopy microclimate and evaporative drying of soil [9]. Consequently, soil moisture can be affected by silvicultural practices, including thinning. There are several studies on the effects of thinning and clear-cutting on soil water storage, including spatial and temporal variability [9,10,11,12]. Some studies report that high intensity thinning in dry forests increases soil water content due to the reduced interception and transpiration rates [13,14]. For example, the decrease in tree density from 100% to 74% in an alepo pine forest, and from 100% to 41% in an oak forest, increased soil water content up to 26% and 18%, respectively [15]. Several studies have also reported higher soil water content in low-density ponderosa pine stands compared to denser stands [12,16,17,18]. However, intense thinning could also increase evaporation from the ground and decrease soil moisture [11,19].
Precipitation patterns are among other important factors influencing the spatial and temporal variability in soil moisture [10]. In semi-arid ecosystems, Heisler-White et al. [20] showed that only large rainfall events (15 and 20 mm) increased soil water content and facilitated the moisture penetration deep into the soil profile (20 and 40 cm) of grasslands in the United States, located in northeastern Colorado. Although large rainfall events are needed to increase soil moisture, Sun et al. [6] found some ecosystems are far more sensitive to individual rainfall events, whereas others need periods of frequent rainfall to exhibit a response. Numerous studies in the literature address the effects of thinning on soil moisture dynamics and soil hydrological response, including changes in soil water storage, seasonal soil water content, and spatial and temporal variability of soil moisture at different scales [9,10,11,12]. However, extensive uncertainty persists since results vary greatly with climate, forest type and age, soil type and depth, thinning type and intensity, and time since thinning [10,11,19]. More important, there is little research describing eco-hydrological consequences of thinning in Mexico, and specifically, soil moisture behavior after thinning in semi-dry forests. Unfortunately, hydrological studies in the transitional zones of Mexico are limited, as long periods of observation are required to evaluate the impacts of management and land use. Nevertheless, studies for a limited time and specific purposes are a valuable source of information for a better understanding of hydrological processes in these zones.
The general objective of this study was to analyze the changes in soil moisture of three micro-catchments with similar tree densities subject to different thinning intensities in a semi-dry forest in Chihuahua, Mexico. The specific objectives were to (1) analyze the soil moisture dynamics as a function of rainfall events on three micro-catchments with similar tree densities (before thinning), and (2) evaluate the changes in moisture dynamics of the same micro-catchments after different thinning intensities (0%, 80%, and 40%). Knowledge of the response of soil moisture as a result of tree density and rainfall characteristics has important implications, especially for evaluating the impact of forest management over water availability in transition zones of northern Mexico.

2. Materials and Methods
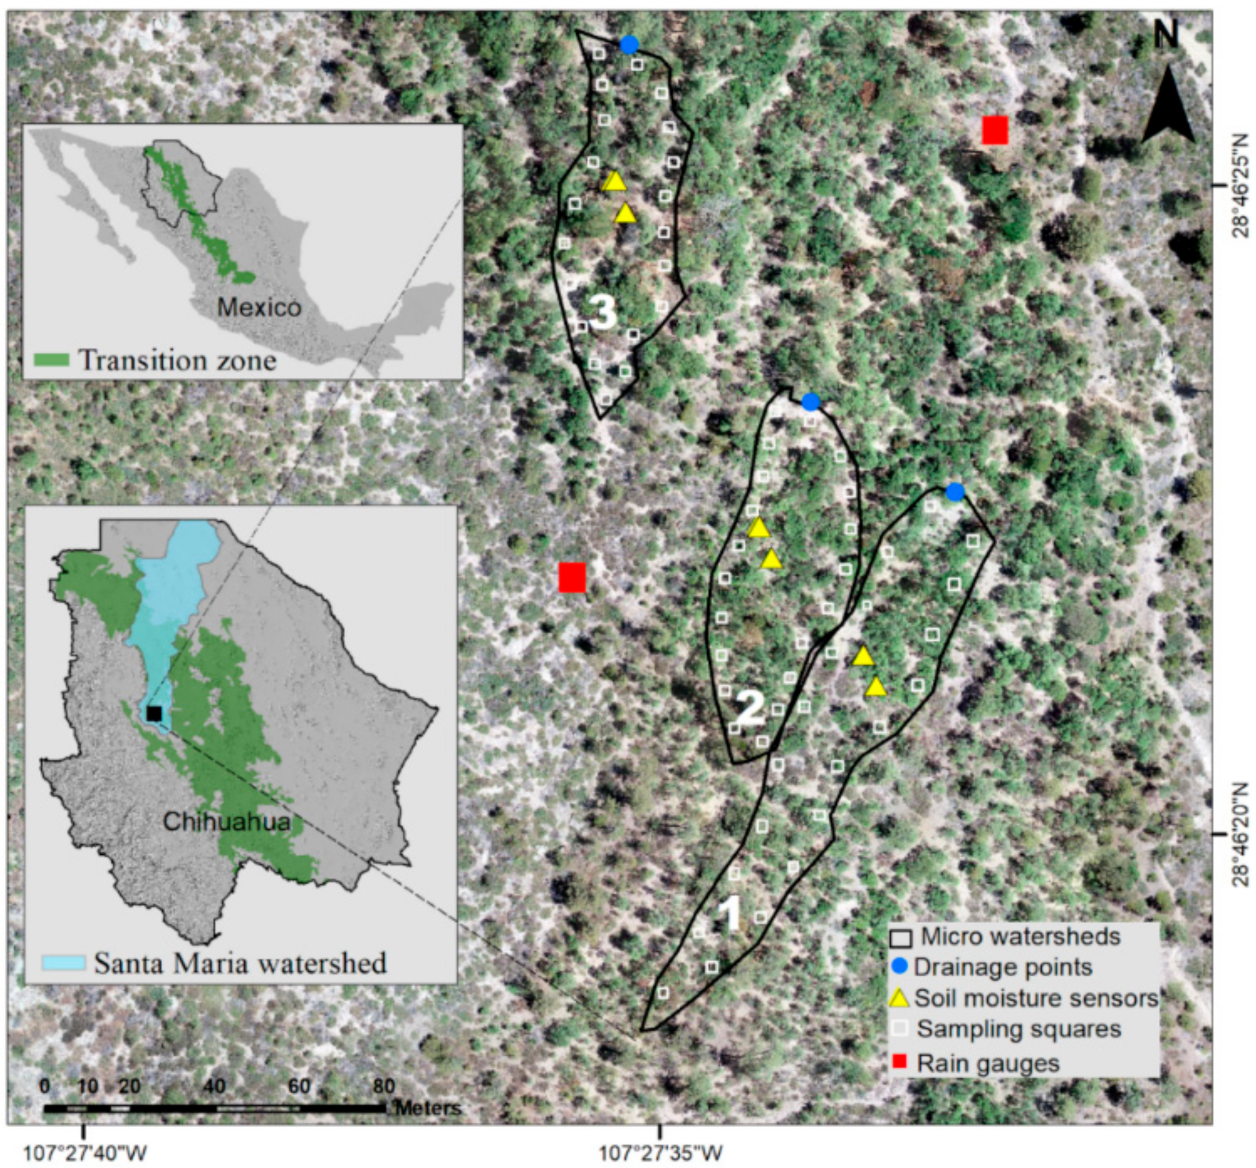
2.1. Study Area

The study area is located in the Hydrological Region Cuencas Cerradas del Norte (RH34) [21], within the Santa Maria river watershed in the municipality of Namiquipa, in the State of Chihuahua, Mexico (Figure 1). The climate is semi-dry and semi-cold with a mean annual temperature of 14.8 °C. The mean annual precipitation of 494 mm falls as rain, primarily between June and October [5]. The highest temperatures in the year are during this rainy season, and the mean temperature during these months is 19.4 °C, while the mean maximum temperature during the same period is 27.3 °C. The mean annual evaporation is 1878 mm with approximately 59% occurring between March and July [5]. The area is at an elevation of 2150 m where the oak-pine forest is represented by Quercus hypoleucoides A. Camus., Quercus grisea Liebm., and Pinus engelmannii Carriere. The soil is haplic phaeozem, derived from the disintegration of igneous rocks with a loamy-clay texture [22]. Three micro-catchments with natural limits (watershed divide), similar soil, and vegetation characteristics were selected in this area (Figure 1). The areas were 0.27, 0.20, and 0.19 ha for micro-catchments 1, 2, and 3, respectively.

2.2. Micro-Catchments Characterization

The diameter at breast height, total height, and crown diameter of each tree located inside the micro-catchments were measured in January 2018. Basal area (m2 ha−1), canopy cover (%), and tree density (number of trees ha−1) were estimated from these measurements [23]. Ground cover inside the micro-catchments was characterized by sampling 20 (0.6 m2) quadrants, distributed on both sides of the mainstream (Figure 1). Inside each quadrant, the percentage of ground cover by litter, herbaceous vegetation, and bare soil were registered [24], including slope and roughness [25]. Soil infiltration, soil depth, bulk density, and soil porosity were estimated in three representative points in each micro-catchment [26].

2.3. Study Design and Thinning Application

The study included two time-periods: before thinning (2018), and after thinning (2019). The analysis was concentrated on the rainy season of each year (June–October). Thinning was performed in January 2019 with 0% (control), 80%, and 40% of intensity for micro-catchments 1, 2, and 3, respectively. These none, high, and intermediate thinning intensities were chosen to create different scenarios. Micro-catchment 1 was not thinned to control the rainfall variability between the two periods. The remaining tree densities after thinning were 100%, 20%, and 60% for micro-catchments 1, 2, and 3, respectively (Figure 2).

2.4. Rainfall Measurements

Two tipping bucket rain gauges (203 mm diameter) were installed to measure rainfall, with each tip representing 0.25 mm (Figure 1). Rainfall records were periodically downloaded using the software HOBO Ware Pro [27]. Additionally, rainfall depth, relative humidity, temperature, wind speed, and direction were measured by a weather station Vantage Vue (Davis Instruments), located 1 km from the study area. Various precipitation metrics were calculated for each rainfall event using the RIST software (Rainfall Intensity Summarization Tool) version 3.94 [28] (Table 1). Individual rainfall events were defined as precipitation events separated from each other by six hours with less than 1.27 mm of rain [28]. Additionally, the Antecedent Precipitation Index (API) was calculated following Dunne and Leopold [29]. The API is a running day-by-day measure of catchment wetness based on rainfall that occurred over the preceding days. It assumes natural drainage with evapotranspiration, reducing soil moisture continuously at a logarithmic rate.

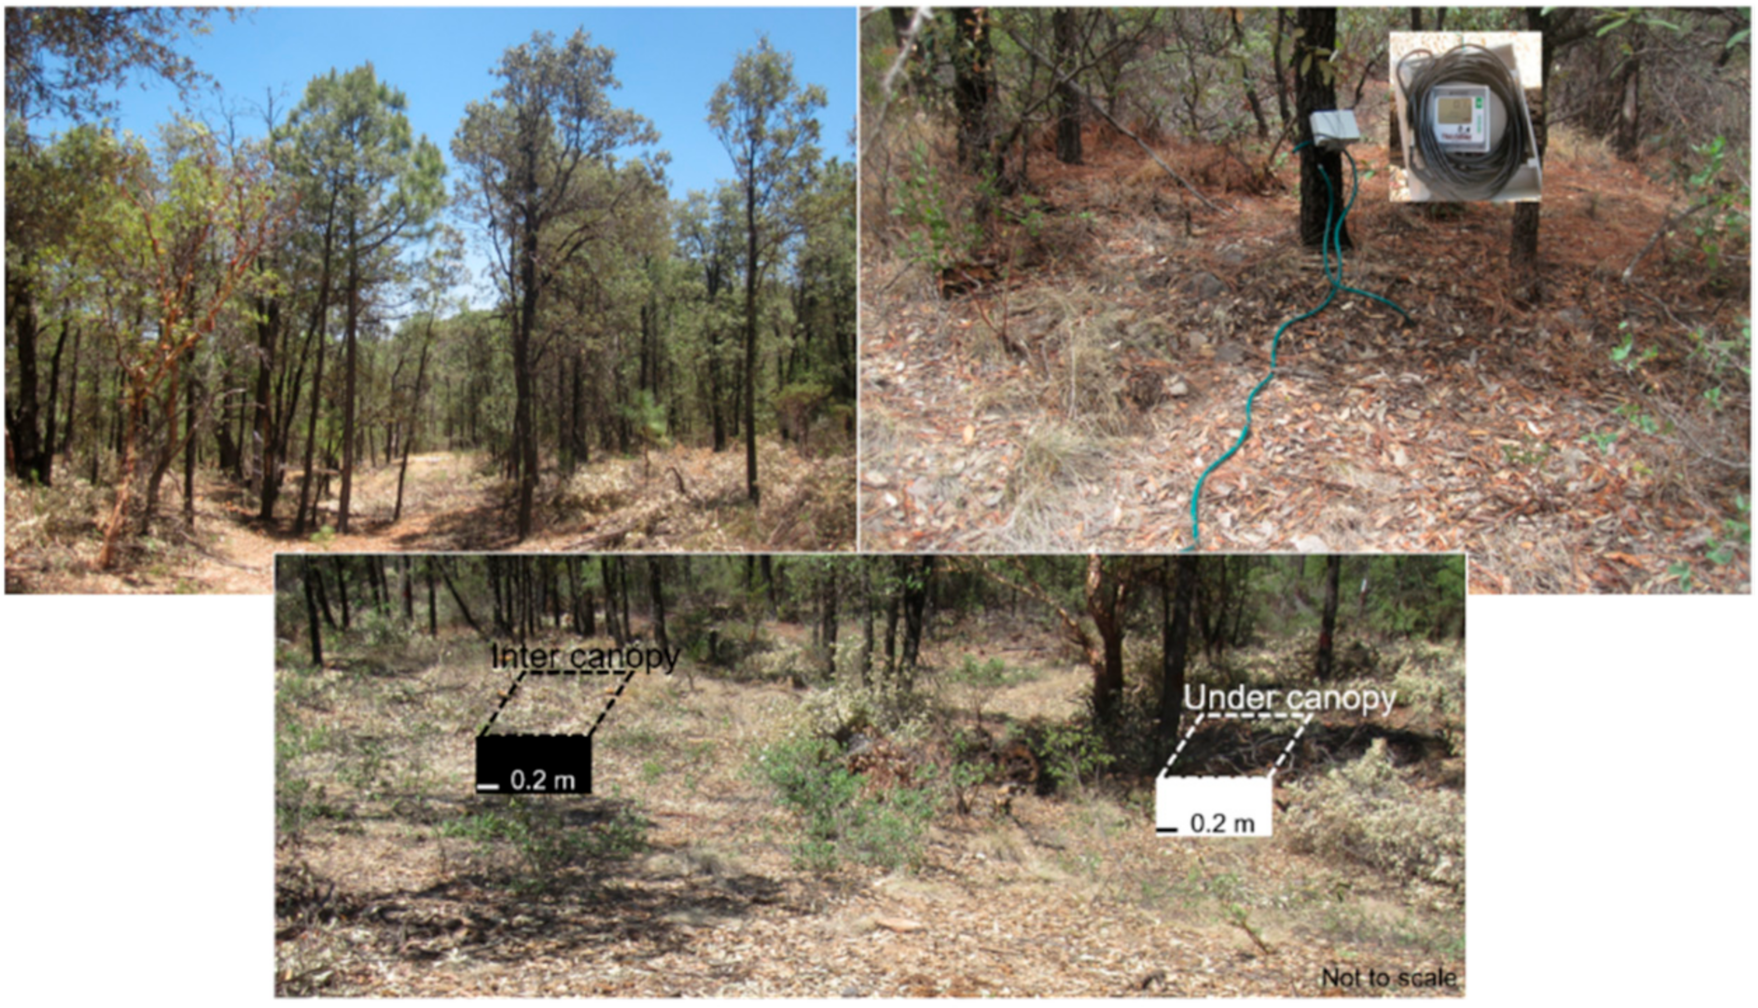
2.5. Soil Moisture Monitoring

Soil volumetric water content (VWC) was monitored using sensors WaterScout SM100 [30] with 0.1% resolution and 3% accuracy. Two sensors were placed in each micro-watershed at 20 cm depth in two scenarios: (1) under canopy, and (2) inter canopy (Figure 3). The sensors under canopy remained under a tree after thinning, but some trees around the sensors were removed, depending on the thinning intensity. The sensors were connected to a micro-stations WatchDog serie-1000, which recorded VWC every 30 min. Data loggers were downloaded periodically using the SpecWare 9 software. The soil moisture records were related to the beginning and end time of each precipitation event to select the maximum and average VWC for each rainfall event (Table 1). Additionally, the mean and maximum daily, monthly, and total rainy season values were calculated.

2.6. Data Analysis

All data were graphically analyzed for each rainfall event and series of events throughout the rainy season of each year. Statistical analysis was performed using the mean and maximum daily records of soil moisture before and after thinning for both scenarios: inter canopy and under canopy. The difference among micro-catchments for each rainy season was evaluated by applying independent samples Student’s t-tests. The difference before and after thinning for each micro-catchment was analyzed using paired-samples t-tests. Additionally, data were analyzed using the Before-After-Control-Impact (BACI) design [31]. The BACI design used for the analysis was: one site impact; one site control; with multiple years before/after, where instead of years were analyzed multiple rainfall events. The BACI analysis was performed between micro-catchment 1 and 2, and between 1 and 3. The level used to determine differences was p ≤ 0.05. All statistical analyses were performed using SAS software [32].

3. Results

3.1. Soil and Vegetation Characteristics

Canopy coverage before thinning was similar between micro-catchments 1 and 3, and approximately 20% lower for micro-catchment 2 (Table 2). The mean basal area was 23.7 m2 ha−1, and the mean tree density was 2210 trees ha−1, with a similar number of trees between micro-catchment 2 and 3, and approximately 100 more trees ha−1 in micro-catchment 1. These slight differences, however, were not significant because the lower number of trees in some cases was compensated by the size of the trees. For example, micro-catchment 3 had a lower number of trees, but a higher basal area (Table 2). Ground cover was mainly litter (general mean, 68.8%), with a small variation between micro-catchments. Slope, soil depth, and roughness were also similar. Mean soil bulk density was 1.13 g cm−3 and mean soil porosity was high at 57%. The mean infiltration capacity was 146 mm h−1 (s.d. = 13.6). Thinning was conducted with minimal disturbance on the ground so changes after thinning were mainly on tree densities (Table 2).

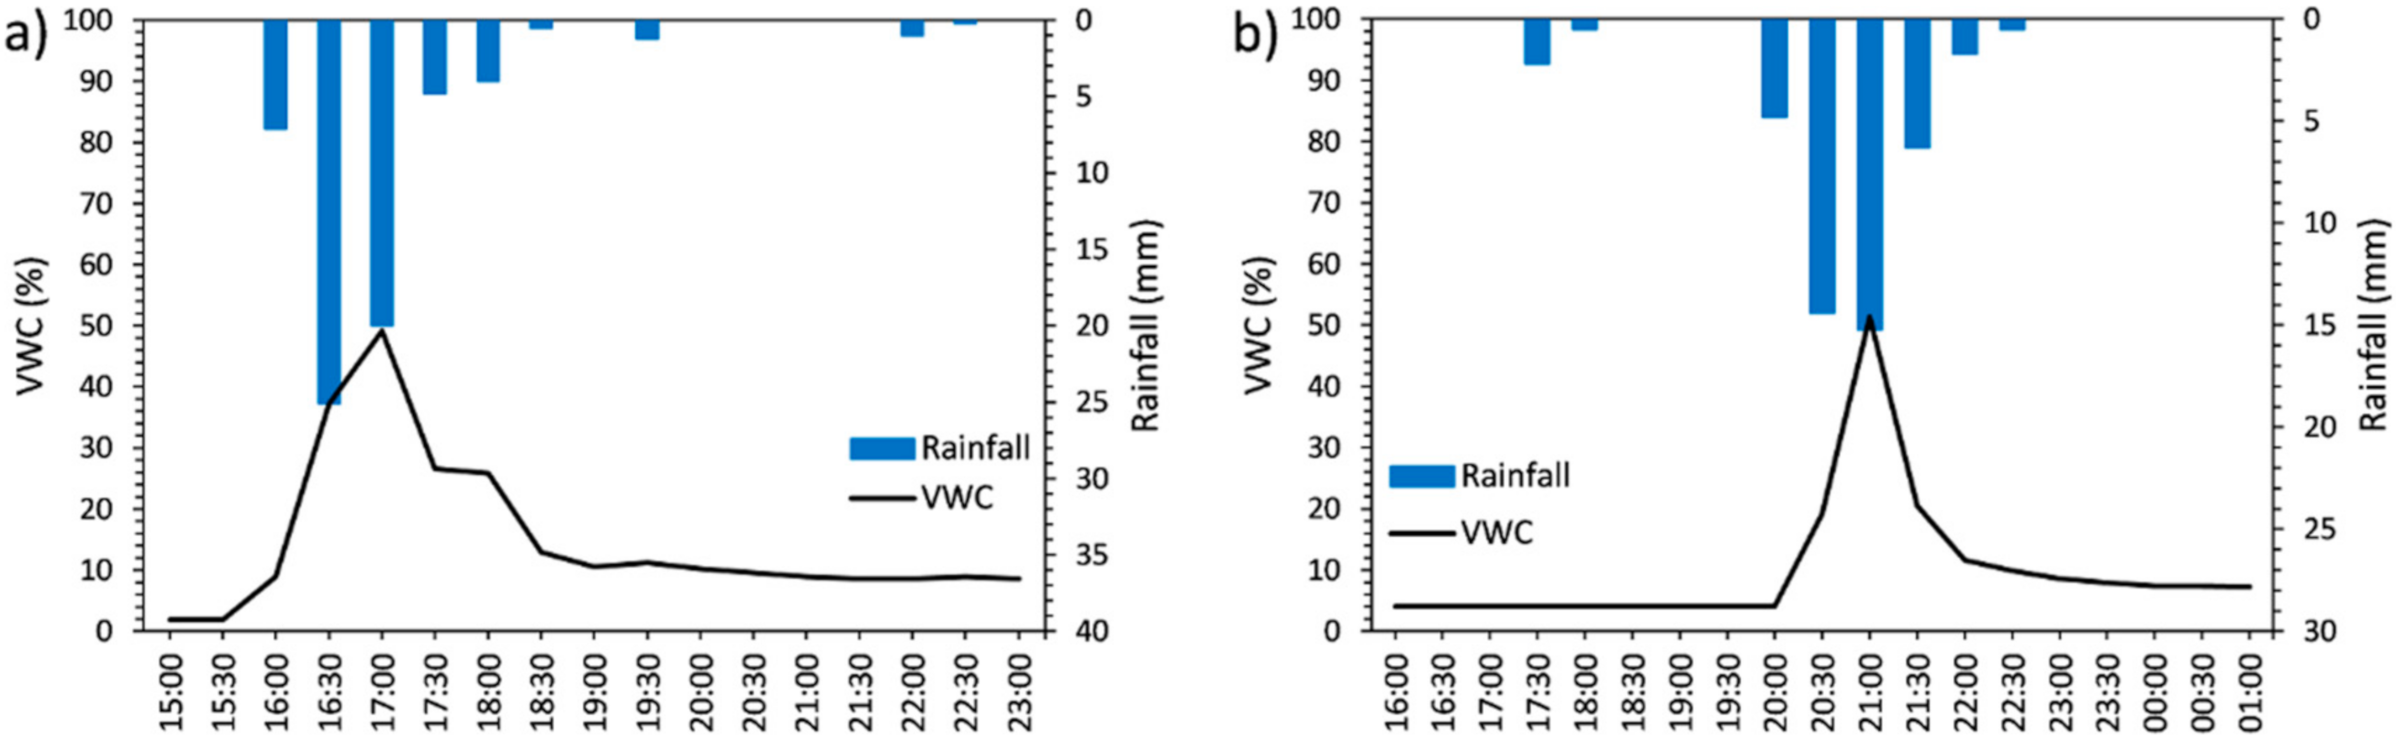
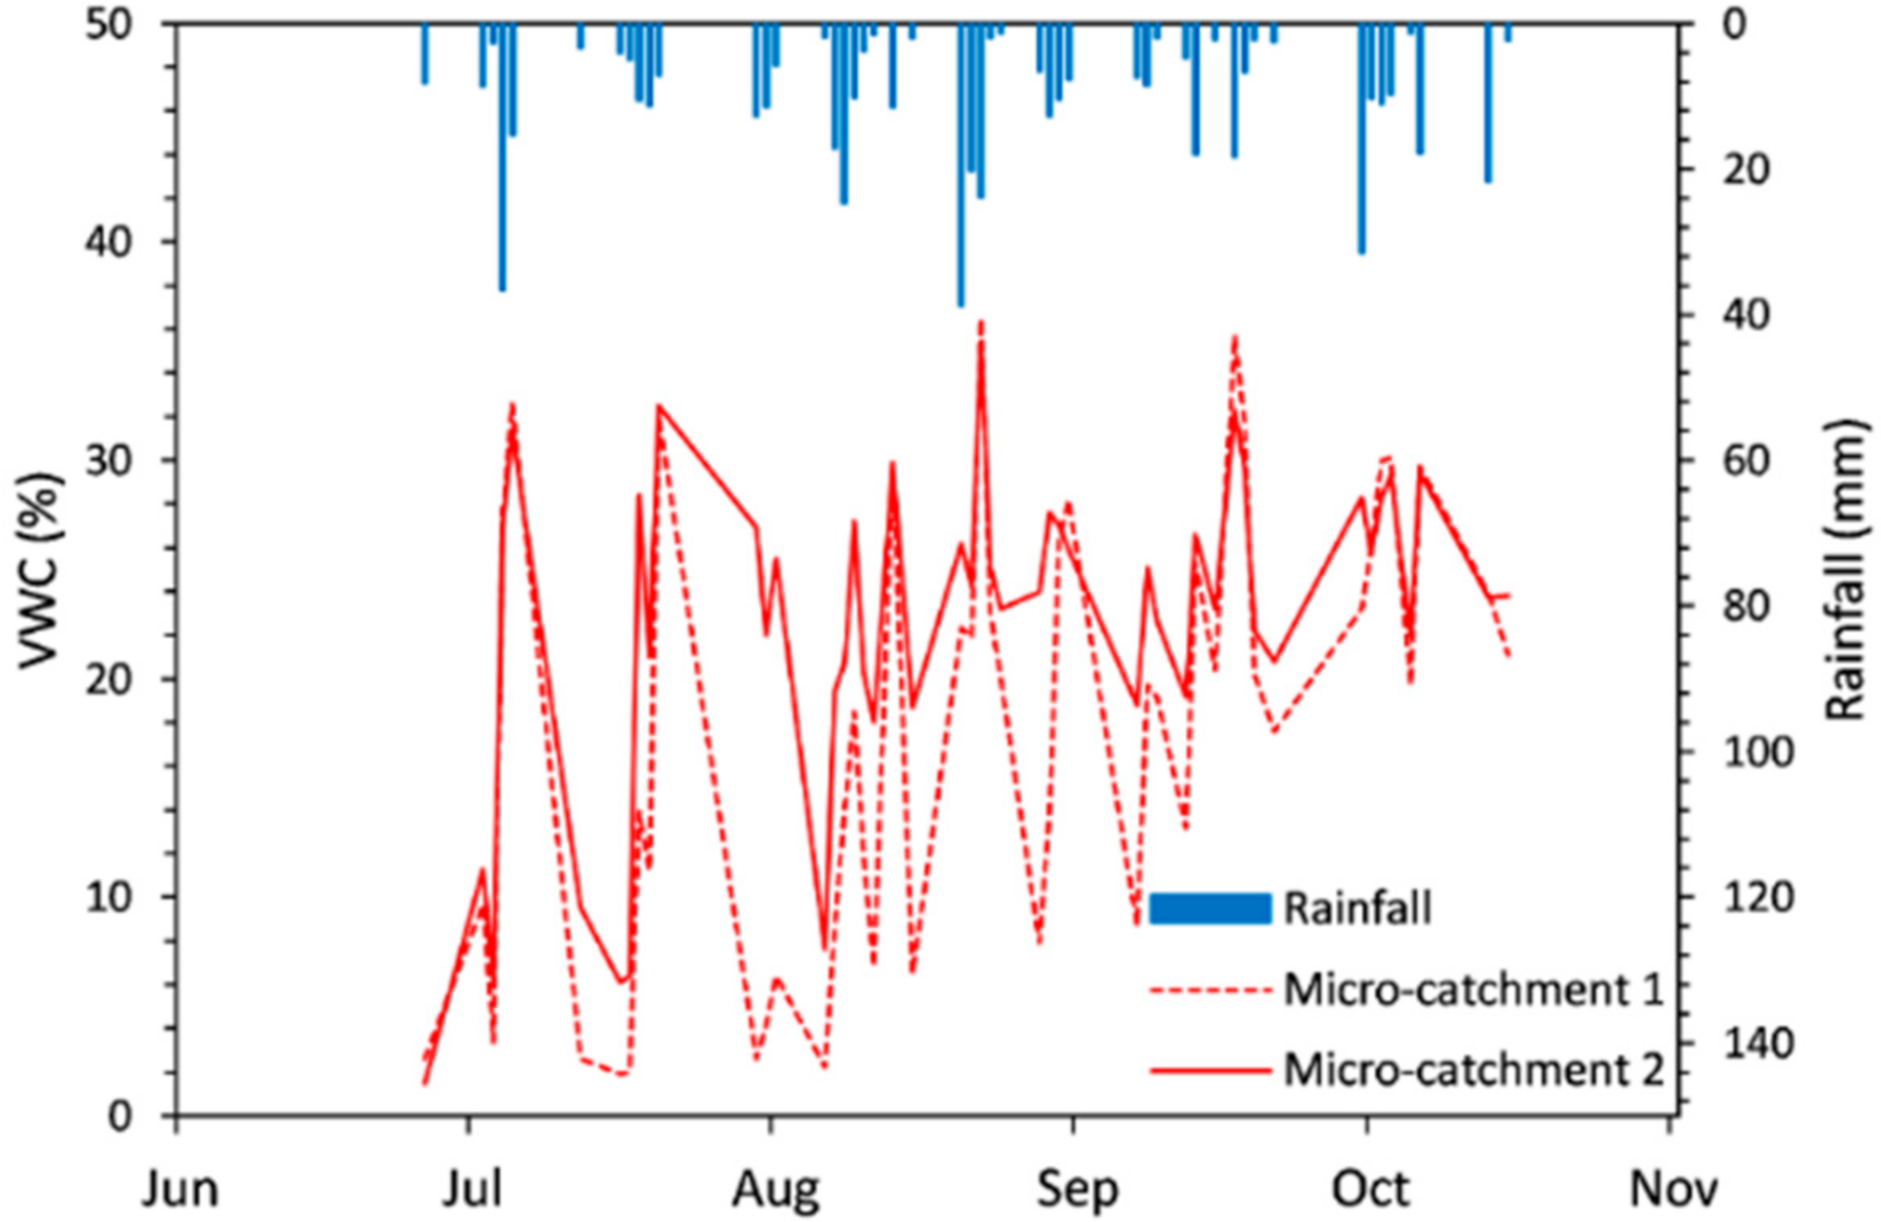
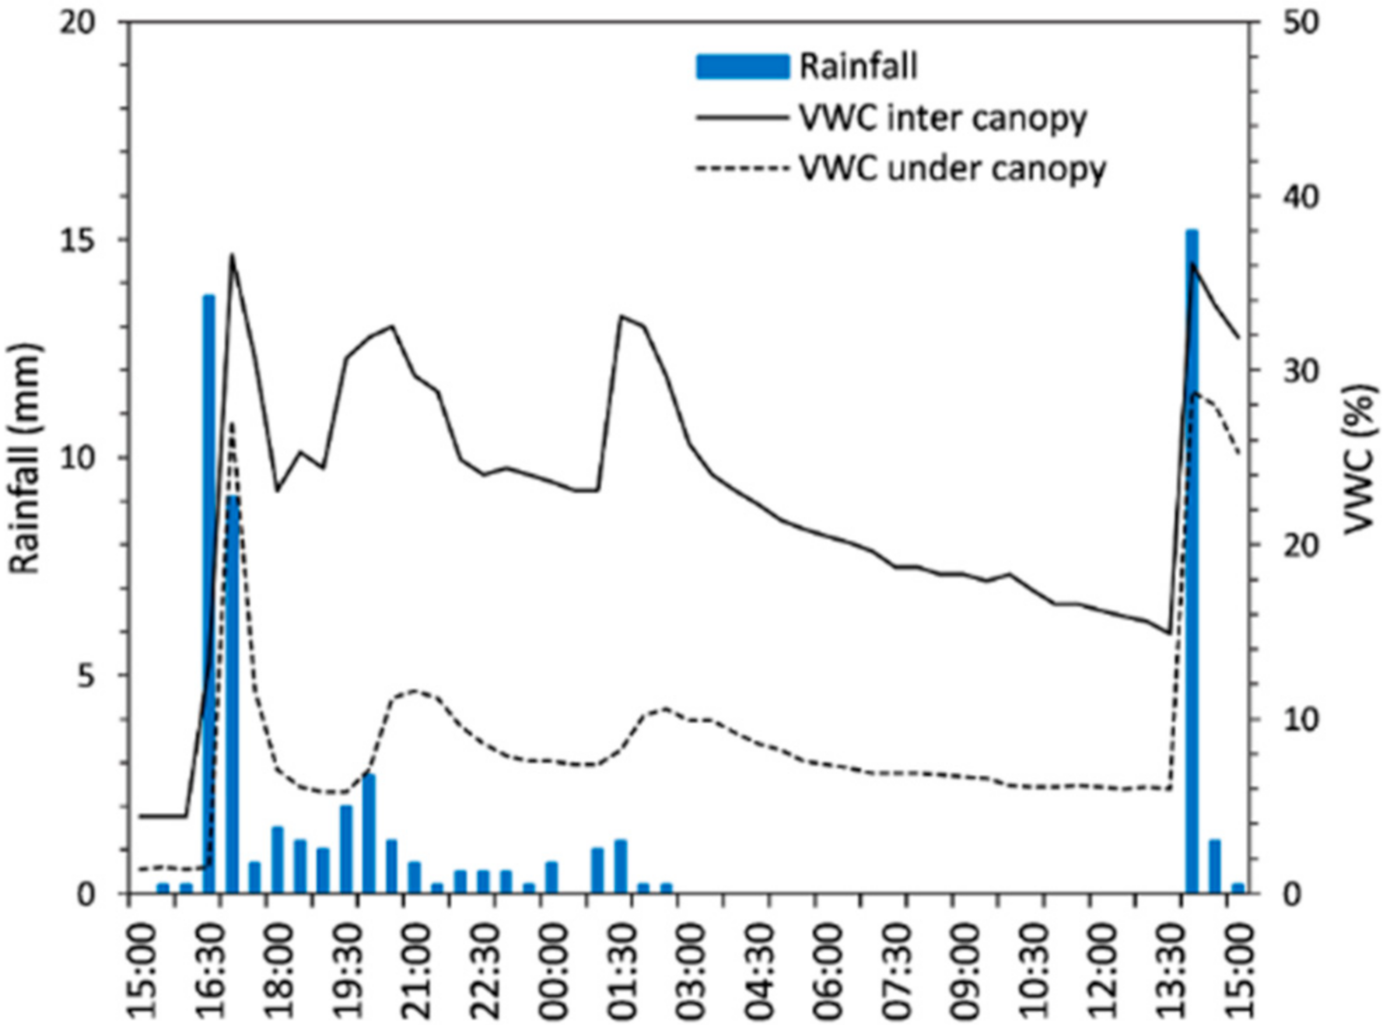
3.2. Precipitation and Soil Moisture before Thinning (2018)

Precipitation from June to October in 2018 was 470 mm, which represented 82% of the annual rainfall. Fifty-one rainfall events were recorded from June to October (Figure 4) with a mean of 8.9 mm (s.d. = 10.9 mm) and a mean of 6.9 h (s.d. = 5.4 h) of duration. Most of the rainfall events were small with low intensity. Seventy-five percent of the events were lower than 10 mm and the mean 30-min rainfall intensity was only 8.9 mm h−1 (s.d. = 10.1 mm h−1). The API was estimated to be between 1.4 and 79 mm, with a mean of 26.9 mm and a median of 21.4 mm.
Rainfall events started in June, but these small events did not cause any significant change in soil moisture (Figure 4). After 10 July, some rainfall events were larger, but only rainfall events greater than 20 mm produced significant changes in soil moisture. Higher changes in soil moisture were noted when precipitation depth was above 30 mm. These rainfall events increased soil moisture to more than 30%, but the increase was followed by a drastic decrease immediately after each rainfall event. From 51 rainfall events, 12 caused the most significant increase in soil moisture, with similar results between micro-catchments, reaching maximum values between 29% and 52%. During the 153 days of the rainy season in 2018, the soil moisture was found to be higher than 30% in only 12 of those days. Considering the records of each 30 min, the soil moisture during the entire rainy season in micro-catchments 1 and 2 was similar, with a mean of 9.3% and 9.2%, respectively. Mean soil moisture in micro-catchment 3 was lower, at 7.2%. The relatively small difference found in micro-catchment 3 was more evident during large rainfall events (>30 mm), while soil moisture during small rainfall events (<10 mm) was similar among the three catchments (Table 3).
A detailed analysis of individual rainfall events showed that it was necessary to have at least 10-mm of rain during the first 30 min, to reach values of approximately 50% in soil moisture (Figure 5a,b). Surprisingly, after the peak in soil moisture, there was a rapid decrease, and this decrease was almost at the same time as the decrease in rainfall (Figure 5a,b). Our results also indicated soil moisture reached similar values as before the rainfall in only 24 h after the event. This pattern was similar for all rainfall events in the three micro-catchments. The only difference found in this pattern was when comparing the response of soil moisture under canopy versus inter canopy (Figure 6). Soil moisture under canopy remained higher for a longer time compared to the uncovered areas.

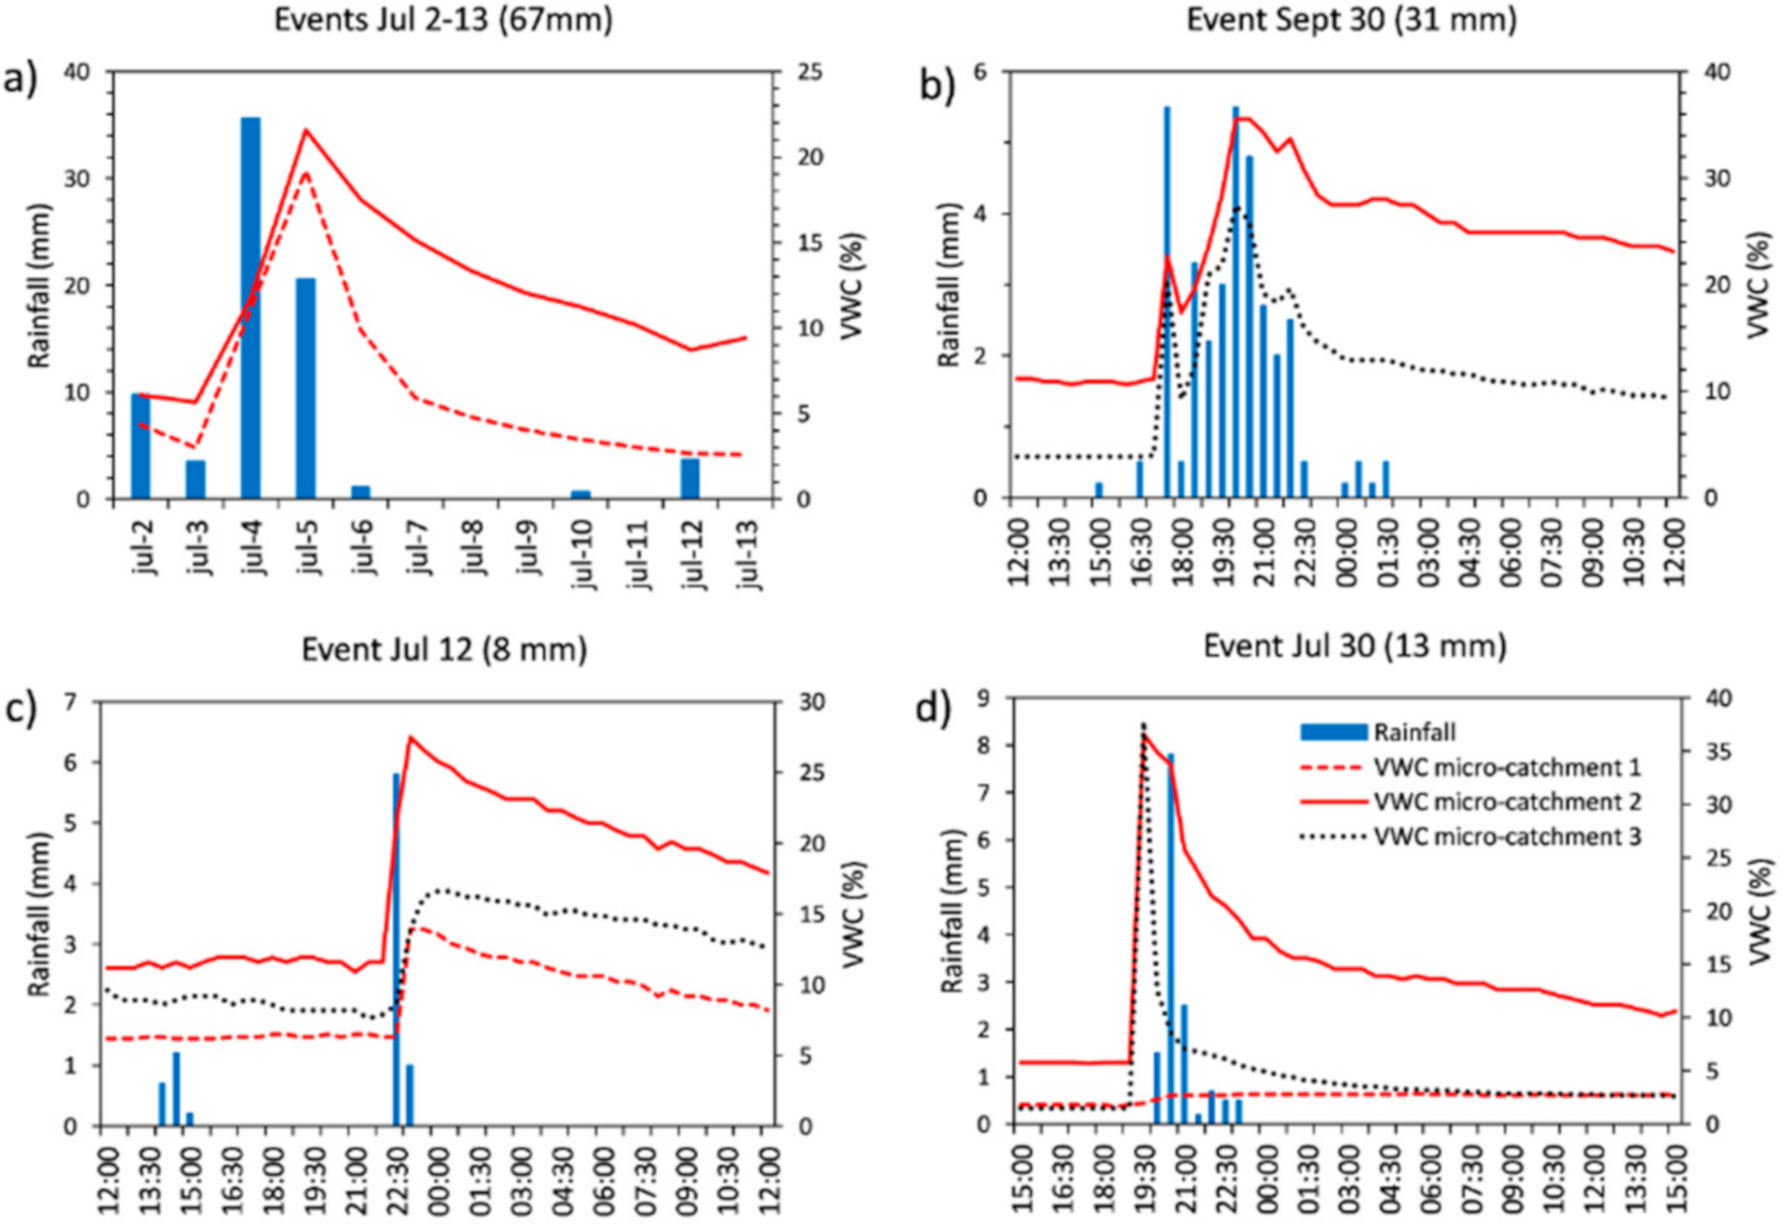
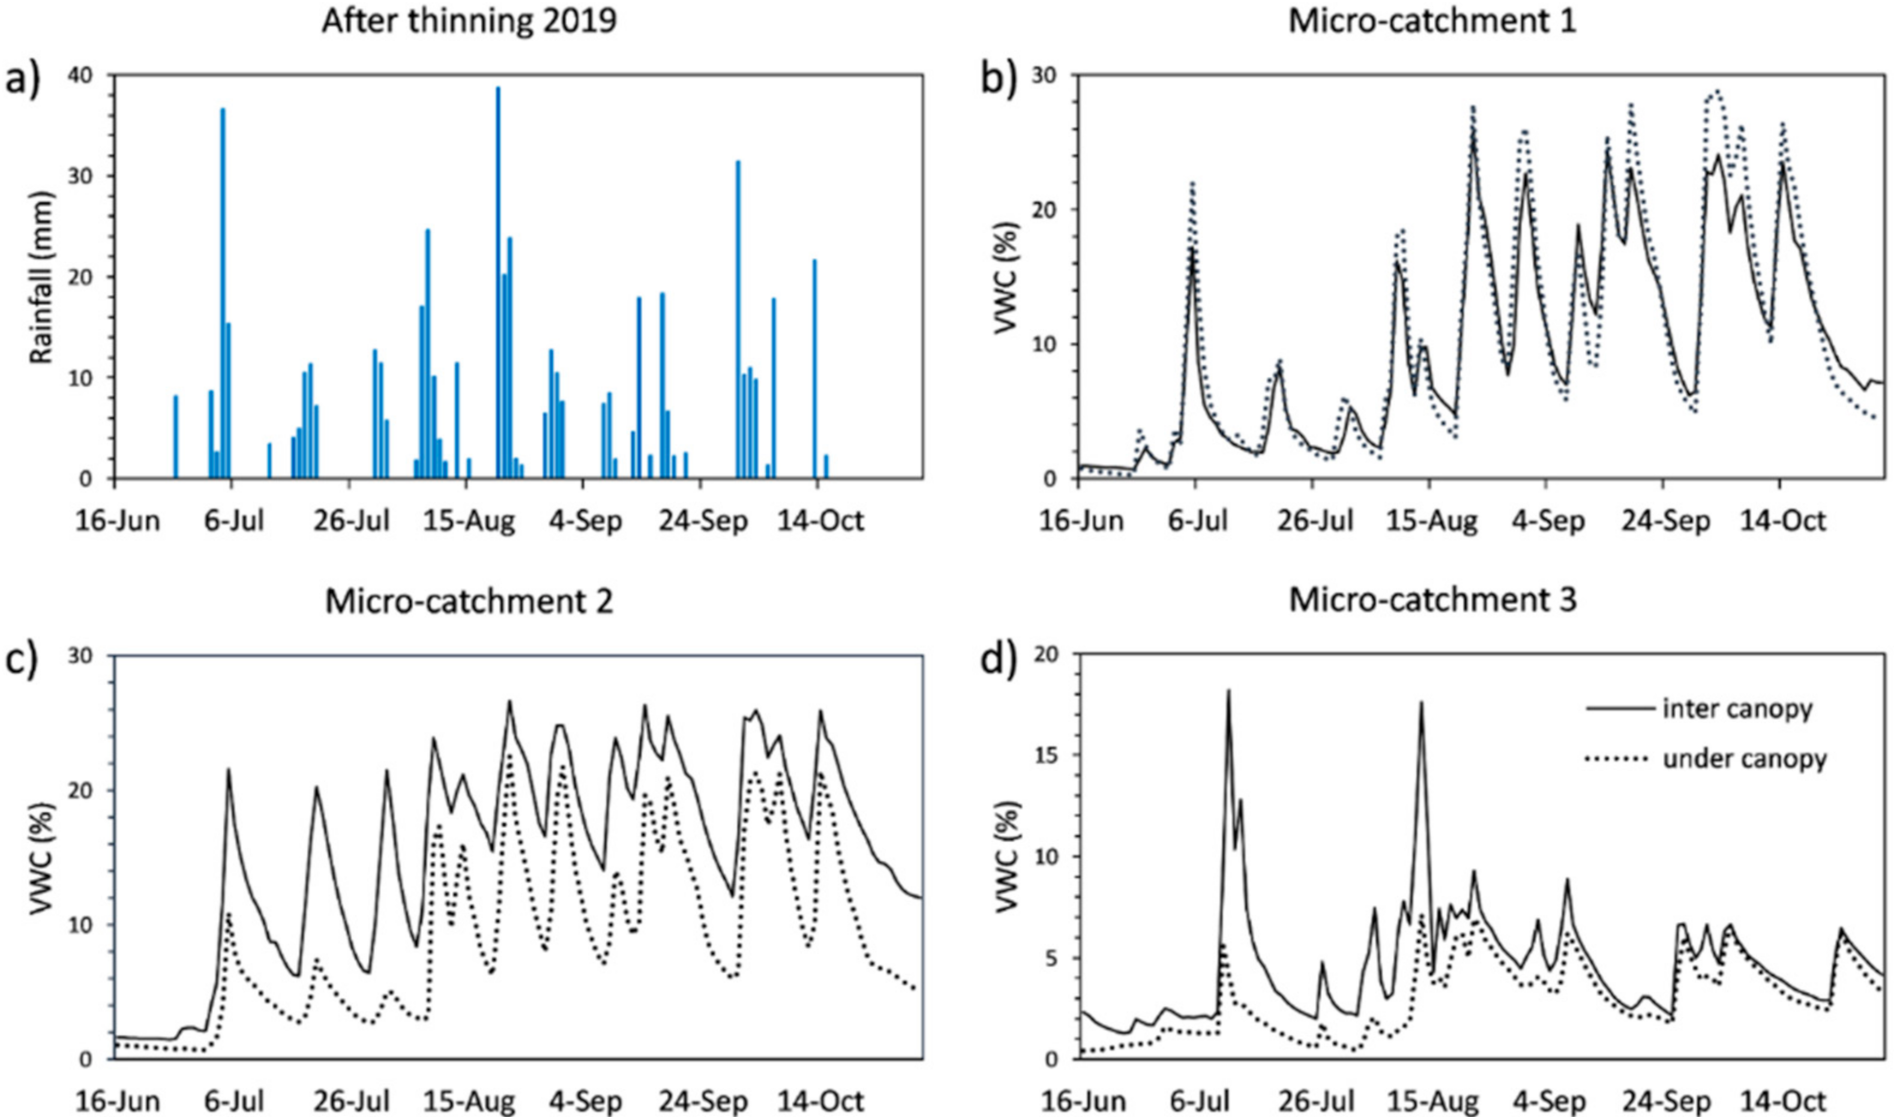
3.3. Precipitation and Soil Moisture after Thinning (2019)

Precipitation from June to October 2019 was 530 mm, which represented 83% of the annual rainfall and 60 mm more than 2018 (Figure 7). There were 49 rainfall events in 2019, two events less than in 2018 (Figure 8), with a mean of 10.5 mm (s.d. = 9 mm) and a mean 6.2 h (s.d. = 6.1 h) of duration. Fifty-five percent of the events were lower than 10 mm and only three events were higher than 30 mm (31, 36, and 38 mm). The large rainfall events represented 20% of the total rainfall. Most of the events were of low intensity with a mean of 11.6 mm h−1 (s.d. = 10.6 mm h−1) and only six events were greater than 25 mm h−1. The API was estimated to be between 8 and 96 mm during the measurement period, with a mean of 37.4 mm and a median of 36.1 mm. The mean was 10.5 mm higher than in 2018, and was consistent with the increase in rainfall compared to 2018.
Rainfall events in 2019 started on 10 June, but similar to 2018, small rainfall events did not cause any significant change in soil moisture. Soil moisture remained relatively constant between 10 June and 3 July, with a mean of 1.1% (s.d. = 0.8%). Rainfall began to increase on 4 July, and similar to 2018, soil moisture in 2019 increased up to 45% when rainfall was above 20 mm. However, in contrast to 2018, soil moisture also exceeded 45% during consecutive events not necessarily greater than 20 mm (Figure 8). Soil moisture records for each 30 min in micro-catchment 1 (0% thinning) showed the same trend as in 2018, with the same mean of 9.3% during the entire period of 2019. Conversely, the soil moisture in micro-catchments 2 and 3 was higher with a mean of 14.1% and 10.1%, respectively. These values represented an increase in soil moisture of 53% for micro-catchments 2 (80% thinning) and 40% for micro-catchment 3 (40% thinning).
The difference in soil moisture after thinning was mainly produced by small rainfall events. Data on the individual rainfall events showed that during small rainfall events (<10 mm), the increase in soil moisture in micro-catchments 2 and 3 was higher, compared to micro-catchment 1 (Table 4). However, the increase in soil moisture during large events (>30 mm) was in the same magnitude for the three micro-catchments. Overall, the maximum and average soil moisture values were higher in micro-catchment 2, followed by micro-catchment 3, and finally, micro-catchment 1. The difference in response to soil moisture as an effect of tree density, mainly between the micro-catchments 1 and 2, is shown in Figure 8.
A detailed analysis of individual rainfall events showed soil moisture in micro-catchments 2 and 3 reached values of 45% with only 5-mm rain accumulated during the first 30 min. This value is much lower compared to the 10 mm of rain accumulation in 2018. Additionally, soil moisture remained longer in micro-catchment 2, compared to the micro-catchments 1 and 3, and this difference was noticed during several days (Figure 9a), as well as during large rainfall events (Figure 9b). The response to the change in soil moisture was also faster in micro-catchment 2 than in micro-catchment 1 and 3, particularly during small events (Figure 9c,d).
Similar to 2018 (before thinning), in 2019 soil moisture in micro-catchment 1 was higher under canopy, compared to the areas inter canopy. In contrast, micro-catchments 2 and 3 showed more soil moisture inter canopy than under canopy, and this was particularly notable in micro-catchment 2 (Figure 10). This pattern was consistent for the entire rainy season (Figure 11).

3.4. Statistical Analysis of Soil Moisture before and after Thinning

Statistical analysis showed the difference in mean daily soil moisture between micro-catchment 1 and 2 before thinning (2018) was not significant (p = 0.18), but the difference between micro-catchment 1 and 3 was significant (p ≤ 0.0001), as micro-catchment 3 had lower values compared to catchments 1 and 2 (Table 5).
There were no significant differences (paired t-test) between before thinning (2018) and after thinning (2019) for micro-catchment 1 (0% thinning), in either under or inter canopy (Table 5). In contrast, micro-catchment 2 (80% thinning) had significant differences in before-after results in both canopy scenarios. The same was found in micro-catchment 3 (40% thinning), except for the maximum values inter canopy in catchment 3 (Table 5). The BACI analysis provides evidence of the thinning impact on mean daily soil moisture when comparing micro-catchments 1 vs. 2 (p ≤ 0.0001). Conversely, there was no evidence of impact when using the daily maximum values (p = 0.15). These findings were consistent when comparing micro-catchments 1 vs. 3, as the impact was significant using the mean daily soil moisture (p = 0.04); however, there was no evidence of impact using the maximum values (p = 0.29). Overall, the results were consistent; the impact of thinning on soil moisture was more perceptible during small rainfall events than during large events.

4. Discussion

4.1. Soil Moisture before Thinning

Data from the micro-catchments indicated moisture behaved similarly at different points given the relatively small size of the micro-catchments and similar characteristics in the soil depth, ground cover, and tree density. Even with these similarities, it is not surprising to find some differences, such as the low values recorded in micro-catchment 3. Several elements affect the dynamic of soil moisture and therefore, it is common to find variations in moisture values, even in sites with the same vegetation characteristics [10,33]. According to other studies, the influence of vegetation on soil moisture dynamics include interception and stem flow [34,35], soil surface temperature due to plant shading [36], availability of soil moisture due to the extraction of water from the plant root system [37], and contributions of plants to evapotranspiration [38,39].
Two other important issues are the low rate of soil moisture throughout the rainy season and the drastic decrease after each rainfall event. Concerning the low moisture values, we consider canopy interception played a significant role, especially during small rainfall events (<10 mm), which corresponded to 75% of the rainfall events. According to Návar [40], semi-dry ecosystems present a higher percentage of losses due to interception than other types of ecosystems. Similarly, other studies in dry ecosystems have reported that approximately 35% of total precipitation is lost by interception [41,42]. High interception leads to low moisture values, as reported by Zhu et al. [11] in a similar study from a Picea crassifolia Kom. plantation, which found a moisture average of only 19% at a soil depth of 20 cm. Similarly, Heisler-White et al. [20] and Muñoz-Villers et al. [43] also found high interception percentages are related to small rainfall events and low rainfall intensities. It should not be a surprise that small rainfall events in our study area had no impact on the increase in soil moisture before thinning, resulting in low values throughout the rainy season.
Concerning the drastic decrease in soil moisture after each rainfall event (soil moisture dropped between 90% and 100% in only 24 h), other studies found evapotranspiration is usually greater than 90% of precipitation in dry ecosystems, especially when precipitation is less than 500 mm [44,45]. For instance, evapotranspiration values near 90% have been found in semi-dry areas covered by Pinus halepensis Mill., and Quercus ilex ssp. ballota Samp [15], whose tree density and basal area were 50% of that found in our study area. On the other hand, evapotranspiration rates have been reported to be less than 75% in temperate coniferous forests [46]. Our drastic decrease in moisture after each rainfall event suggests water not intercepted by the canopy that reaches the ground is almost immediately lost by evaporation from the ground. A weather station located close to our study area confirmed this assumption as the recorded mean maximum temperature during 2018 was 33 °C, while the mean temperature was 25 °C. The wind speed reached 55 km h−1 with an average of 17 km h−1 and the average relative humidity was 46%. The API also had low values during several days of the season, with a median of only 21.4 mm. These data reflect high evaporation from the ground [47] and a subsequent low possibility of maintaining the increased moisture over-time.
In this study, a considerable increase in soil moisture occurred only when the amount of rainfall exceeded 20 mm, or when at least 10-mm rain occurred during the first 30 min of the rainfall event. Additionally, only large rainfall events (>30 mm) increased soil moisture in similar proportions in the three micro-catchments (29–52%). Similarly, other studies of grasslands have reported a significant increase in soil moisture (more than 1%) up to 40 cm depth when rainfall events were greater than 15 mm, and greater than 20 mm in prairies with a semi-dry climate [10]. Likewise, Zhu et al. [11] found the depth of soil moisture tended to increase with an increase in the amount and intensity of rainfall. This finding indicated that when two large and high-intensity rainfall events occurred, within a short timeframe between them, soil moisture showed a double “peak” at 40 cm depth in micro-catchments similar to those in our study area. Findings from our study indicate large rainfall events are needed for soil moisture to increase to a depth of 20 cm in these semi-dry ecosystems. Small rainfall events are more frequent, but they do not have a significant impact on the increase in soil moisture. Our results from before thinning suggest soil saturation and the probability of runoff generation by infiltration excess overland flow in these ecosystems are low, as only 10% of the rainfall events were greater than 20 mm.

4.2. Soil Moisture after Thinning

The BACI analysis indicated there was evidence of the thinning impact when using the mean daily soil moisture, whereas there was no evidence of impact when using the daily maximum values. This is consistent with the fact that small rainfall events (<10 mm) significantly increased the maximum and average soil moisture after thinning, especially for high thinning intensity. Conversely, the thinning intensity did not affect soil moisture during large rainfall events (>30 mm). Relative to the effect of thinning, previous studies have revealed stands with low densities have higher soil water contents due to the reduction of interception and transpiration rates [12,48,49]. Fedorová [50], found an increase in the soil moisture between 26% and 43% after applying a thinning of 50% in a forest of Quercus petraea (Matt.) Liebl. Likewise, Zou et al. [12] found the increase in soil moisture in a semi-arid ecosystem was higher after thinning, even in deeper layers because trees consume excessive amounts of water stored mainly in the subsurface-layers of soil. Similar to Zou et al. (2008), Zhu et al. [11] found thinning increased soil moisture at a depth of 40 cm, even when the residual density was higher as compared to our study.
Regarding the soil moisture response to the rainfall size, our data indicate that only 5 mm during the first 30 min of a rainfall event was enough to reach values of 45% of soil moisture after thinning. This amount corresponds to 50% of the amount needed before thinning. This could be explained by the interception of the canopy, as thinning reduces interception allowing the water to reach the soil immediately [48]. Nonetheless, interception could be negligible during large rainfall events, and this explains the similar response among micro-catchments during events higher than 30 mm. Studies in other ecosystems have found interception was between 30% and 74% when precipitation and rainfall intensity was below 20 mm and 15 mm h−1, respectively; but the interception decreased to between 10% and 20% for storms above those thresholds [42].
Our data indicated that the soil moisture inter canopy remained high for longer periods compared to similar events before thinning. This indicates moisture can stay retained longer, despite the increase in radiation and evaporation created by thinning [51]. This increase in moisture, however, is finally lost after some days, given the time without rain after each event, as indicated by the API. In this regard, other studies have indicated moisture permanence after small rainfall events, is affected more by the soil moisture antecedent, than the amount of precipitation or thinning intensity. Some studies have observed temporal patterns regarding the response of moisture in small rainfall events. Cantón et al. [52], reported small events (<3 mm) may or may not affect soil moisture, depending on the background moisture values in a semi-arid region of southeastern Spain. Similarly, Lozano-Parra et al. [51] found that in ecosystems with higher moisture content, even small rainfall events (<3 mm), produced a hydrological response of the soil moisture in both forests and grasslands, whereas in drier conditions, rainfall hardly reaches deeper soils. Overall, these studies argue that the incidence of small rainfall events on soil moisture depends on antecedent moisture. Thus, the increase in soil moisture after thinning in our study area, and consequently, the potential for surface runoff, depends not only on thinning intensity, but also on antecedent moisture.

4.3. Management Implications

It is important to note that the measurements of this study are restricted to a few points for each micro-catchment. Notwithstanding limitations, this study presents interesting findings of soil moisture dynamics in a semi-dry forest of northern Mexico, where previous studies on this topic are limited. This study shows thinning increases soil moisture, especially during small rainfall events and when thinning intensity is high. However, some considerations are worthy of discussion relative to forest management in the long term. Previous studies have indicated high thinning intensities not only affect soil moisture, but also other conditions, such as evaporation, infiltration, and changes in the understory. Consequently, the potential evapotranspiration in our high-thinned catchment could be high in the long term, given discontinuous rainfall events and increasingly frequent years of drought. Other studies have also indicated low canopy cover and high rainfall intensities could increase soil bulk density, and reduce water infiltration [53,54,55]. Qualitative observations after the rainy season in our high thinned area also showed a rapid growth of the understory, including grasses, herbs, and oak regrowth. These changes in ground cover not only increase interception, but also the water demand from the soil profile. Given these considerations, forestry practices including clear cuts or high thinning intensities to increase water recharge should be taken with caution.
Forest management in Mexico rarely involves high intensity thinning in semi-dry ecosystems due to the low rate of growth. Nonetheless, there are many high-density areas lacking management; intermediate intensities might be an option for such areas. Some studies have reported moderate intensity thinning of 20–40% facilitates the recharge of deep soil water [11]. This is especially important for our study area, where the soil is shallow with a high infiltration capacity, which increases the probability of groundwater recharge. Water conservation in semi-dry forests should be an essential component of forest management and a requirement for achieving sustainable productivity [56]. In this regard, it is important to consider the effects of thinning and clear-cutting at broader spatial and temporal scales in future research studies.

5. Conclusions

This study examined soil moisture based on storm observations of three micro-catchments, before and after two thinning intensities (40% and 80%), plus the control. Soil moisture before thinning was low most of the rainy season due to the high evapotranspiration rates and high interception, especially during small rainfall events. The precipitation threshold that led to a drastic increase in soil moisture before thinning was the accumulation of 10-mm of rain in the first 30 min. Only large rainfall events (>30 mm) increased soil moisture in similar proportions in the three micro-catchments before thinning. Mean soil moisture per rainfall event did not exceed 12% when events were less than 10 mm, and significant increases were recorded only when the amount of rainfall was higher than 20 mm. However, only 10% of the events had precipitation greater than 20 mm. After each rainfall event, soil moisture had a drastic decrease in only 24 h. This behavior was influenced by high evaporation rates from the ground and the low moisture antecedent.
Only small rainfall events (<10 mm) significantly increased the daily maximum and average soil moisture after thinning, especially for high thinning intensity. Conversely, the thinning intensity did not affect soil moisture during large rainfall events (>30 mm). The different response to the amount of rain is explained by interception; as thinning reduces interception, however, the amount of intercepted water tends to be negligible during large rainfall events. Thinning also impacted the rapid increase in soil moisture, since only 5 mm of rain over 30 min was enough to reach values above 45% VWC. Additionally, soil moisture remained high for a longer time period compared to similar events before thinning. Nonetheless, this increase was finally lost after some days, given the relatively long period without rain. Overall, our findings at the micro-catchment scale indicate the effect of thinning on soil moisture in these semi-dry ecosystems is relatively short and highly dependent on the amount of rain and antecedent moisture.

Author Contributions

Conceptualization, A.E.R.-R. and M.M.-S.; methodology, A.E.R.-R., M.M.-S., and G.S.-P.; software, G.S.-P. and F.V.-G.; formal analysis, A.E.R.-R., G.S.-P., and E.S.-E.; investigation, A.E.R.-R.; resources, M.M.-S., R.C.-L., and G.S.-P.; data curation, A.E.R.-R.; writing—original draft preparation, A.E.R.-R., G.S.-P., and M.M.-S.; writing—review and editing, F.V.-G., A.P.-A., E.S.-E., and R.C.-L.; supervision, M.M.-S., F.V.-G., A.P.-A., and E.S.-E.; project administration, M.M.-S.; funding acquisition, M.M.-S. All authors have read and agreed to the published version of the manuscript.

Funding

This research was funded by CFE (Comisión Federal de Electricidad), grant number (CERESO-1723).

Institutional Review Board Statement

Not applicable.

Informed Consent Statement

Not applicable.

Data Availability Statement

The data presented in this study are available on request from the corresponding author.

Acknowledgments

The first author thanks the Postgraduate Program in Natural Resources Management of Autonomous University of Chihuahua (UACH) and the National Council for Science and Technology (CONACYT) for the scholarship received.

Conflicts of Interest

The authors declare no conflict of interest. The funders had no role in the design of the study; in the collection, analyses, or interpretation of data; in the writing of the manuscript, or in the decision to publish the results.

References

  1. FAO (Organización de las Naciones Unidas para la Agricultura y la Alimentación). Evaluación de los Recursos Forestales Mundiales 2010–Informe Principal, 1st ed.; Estudios FAO: Roma, Italia, 2010; pp. 11–47. [Google Scholar]
  2. INEGI (Instituto Nacional de Estadística y Geografía). Ecorregiones Terrestres de Mexico, Escala 1:1000000, Mexico. 2008. Available online: http://www.conabio.gob.mx/informacion/gis/layouts/ecort08gw.png (accessed on 20 September 2019).
  3. SEMARNAT (Secretaría de Medio Ambiente y Recursos Naturales). Atlas de Biodiversidad de Mexico. 2010. Available online: http://gisviewer.semarnat.gob.mx/geointegrador/enlace/atlas2010/atlas_biodiversidad.pdf (accessed on 26 September 2019).
  4. González-Elizondo, S.; González-Elizondo, M.; Tena-Flores, J.A.; Ruacho-González, L.; López-Enríquez, I.L. Vegetación de la sierra madre occidental, Mexico: Una síntesis. Acta Bot. Mex. 2012, 100, 351–403. [Google Scholar] [CrossRef] [Green Version]
  5. CONAGUA (Comisión Nacional del Agua). Normales Climatológicas de Mexico por Estado. 2020. Available online: https://smn.conagua.gob.mx/es/informacion-climatologica-por-estado?estado=chih (accessed on 22 April 2020).
  6. Sun, F.; Lüa, Y.; Wang, J.; Hua, J.; Fua, B. Soil moisture dynamics of typical ecosystems in response to precipitation: A monitoring-based analysis of hydrological service in the Qilian Mountains. Catena 2015, 129, 63–75. [Google Scholar] [CrossRef]
  7. Chow, V.T. Handbook of Applied Hydrology, 1st ed.; McGraw-Hill Book Company: New York, NY, USA, 1964. [Google Scholar]
  8. Bras, R.L. Hydrology, an Introduction to Hydrologic Science, 1st ed.; Addison-Wesley: Boston, MA, USA, 1990. [Google Scholar]
  9. He, L.; Ivanov, V.Y.; Bohrer, G.; Thomsen, J.E.; Vogel, C.S.; Moghaddam, M. Temporal dynamics of soil moisture in a northern temperate mixed successional forest after a prescribed intermediate disturbance. Agric. For. Meteorol. 2013, 180, 22–33. [Google Scholar] [CrossRef]
  10. He, Z.B.; Zhao, W.Z.; Liu, H.; Chang, X.X. The response of soil moisture to rainfall event size in subalpine grassland and meadows in a semi-arid mountain range: A case study in northwestern China’s Qilian Mountains. J. Hydrol. 2012, 421, 183–190. [Google Scholar] [CrossRef]
  11. Zhu, X.; He, Z.B.; Dua, J.; Chen, L.F.; Lin, P.F.; Li, J. Temporal variability in soil moisture after thinning in semi-arid Picea crassifolia plantations in northwestern China. For. Ecol. Manag. 2017, 401, 273–285. [Google Scholar] [CrossRef]
  12. Zou, C.B.; Breshears, D.D.; Newman, B.D.; Wilcox, B.P.; Gard, M.O.; Rich, P.M. Soil water dynamics under low-versus high-ponderosa pine tree density: Ecohydrological functioning and restoration implications. Ecohydrology 2008, 4, 309–315. [Google Scholar] [CrossRef]
  13. Del Campo, A.D.; González-Sanchis, M.; Molina, A.J.; García-Prats, A.; Ceacero, C.J.; Bautista, I. Effectiveness of water-oriented thinning in two semiarid forests: The redistribution of increased net rainfall into soil water, drainage and runoff. For. Ecol. Manag. 2019, 438, 163–175. [Google Scholar] [CrossRef]
  14. Dung, B.X.; Gomi, T.; Miyata, S.; Sidle, R.C.; Kosugi, K.; Onda, Y. Runoff responses to forest thinning at plot and catchment scales in a headwater catchment draining Japanese cypress forest. J. Hydrol. 2012, 444, 51–62. [Google Scholar] [CrossRef]
  15. Del campo, A.D.; González-Sanchis, M.; Lidón, A.; Ceacero, C.J.; García-Prats, A. Rainfall partitioning after thinning in two low-biomass semiarid forests: Impact of meteorological variables and forest structure on the effectiveness of water-oriented treatments. J. Hydrol. 2018, 556, 74–86. [Google Scholar] [CrossRef]
  16. Baker, M.B. Effects of ponderosa pine treatments on water yield in Arizona. Water Resour. Res. 1986, 22, 67–73. [Google Scholar] [CrossRef]
  17. Feeney, S.R.; Kolb, T.E.; Covington, W.W.; Wagner, M.R. Influence of thinning and burning restoration treatments on presettlement ponderosa pines at the Gus Pearson Natural Area. Can. J. For. Res. 1998, 28, 1295–1306. [Google Scholar] [CrossRef]
  18. Stone, J.E.; Kolb, T.E.; Covington, W.J. Effects of restoration thinning on presettlement Pinus ponderosa in northern Arizona. Restor. Ecol. 1999, 7, 172–182. [Google Scholar] [CrossRef]
  19. Dunkerley, D. Measuring interception loss and canopy storage in dryland vegetation: A brief review and evaluation of available research strategies. Hydrol. Process. 2000, 14, 669–678. [Google Scholar] [CrossRef]
  20. Heisler-White, J.L.; Knapp, A.K.; Kelly, E.F. Increasing precipitation event size increases aboveground net primary productivity in a semi-arid grassland. Oecologia 2008, 158, 129–140. [Google Scholar] [CrossRef] [PubMed]
  21. INEGI (Instituto Nacional de Estadística y Geografía). Síntesis de Información Geográfica del Estado de Chihuahua, 1st ed.; INEGI: Aguascalientes, Mexico, 2003. [Google Scholar]
  22. FAO (Food and Agriculture Organization of the United Nations). World Reference Base for Soil Resources 2014. International Soil Classification System for Naming Soils and Creating Legends for Soil Maps, 1st ed.; World Soil Resources Reports 106; FAO: Rome, Italy, 2014. [Google Scholar]
  23. Romahn, C.F.; Ramírez, H. Dendrometría, 2nd ed.; Universidad Autónoma Chapingo: Texcoco, Mexico, 2010; 354p. [Google Scholar]
  24. Booth, D.T.; Cox, S.E.; Beeryman, R.D. Point sampling digital imagery with SamplePoint. Environ. Monit. Assess. 2006, 123, 97–108. [Google Scholar] [CrossRef] [PubMed]
  25. Sosa-Pérez, G.; MacDonald, L.H. Effects of closed roads, traffic, and road decommissioning on infiltration and sediment production: A comparative study using rainfall simulations. Catena 2017, 159, 93–105. [Google Scholar] [CrossRef]
  26. Chen, L.; Yuan, Z.; Shao, H.; Wang, D.; Mu, X. Effects of thinning intensities on soil infiltration and water storage capacity in a Chinese pine-oak mixed forest. Sci. World J. 2014, 268157, 1–7. [Google Scholar] [CrossRef]
  27. Onset Computer Corporation. HOBO Pendant Event Data Logger (UA-003-64) Manual 2019. Available online: https://www.onsetcomp.com/files/manual_pdfs/9831-I%20MAN-UA-003.pdf (accessed on 16 January 2020).
  28. USDA (U.S. Department of Agriculture). RIST-Rainfall Intensity Summarization Tool Software; Version 3.94; Agricultural Research Service: Oxford, MS, USA, 2015. [Google Scholar]
  29. Dunne, T.; Leopold, L.B. Water in Environmental Planning, 1st ed.; W.H. Freeman: New York, NY, USA, 1978. [Google Scholar]
  30. Spectrum Technologies. SM100 Soil Moisture Sensor Product Manual 2018. Available online: https://www.specmeters.com/assets/1/22/6460_SM1003.pdf (accessed on 16 January 2020).
  31. Smith, E.P. BACI Design. In Encyclopedia of Environmetrics, 1st ed.; El-Shaarawi, A.H., Piegorsch, W.W., Eds.; John Wiley & Sons Ltd.: Chichester, UK, 2002; pp. 141–148. [Google Scholar]
  32. SAS (Statistical Analysis Software) Institute. SAS Software; Version 9.3; SAS Inc.: Cary, NC, USA, 2010. [Google Scholar]
  33. Miller, P.C.; Poole, D.K.; Miller, P.M. The influence of annual precipitation, topography and vegetative cover on soil moisture and summer drought in southern California. Oecologia 1983, 56, 385–391. [Google Scholar] [CrossRef]
  34. He, Z.B.; Yang, J.J.; Du, J.; Zhao, W.Z.; Liu, H.; Chang, X.X. Spatial variability of canopy interception in a spruce forest of the semiarid mountain regions of China. Agric. For. Meteorol. 2014, 188, 58–63. [Google Scholar] [CrossRef]
  35. Zhang, Y.F.; Wang, X.P.; Hu, R.; Pan, Y.X. Throughfall and its spatial variability beneath xerophytic shrub canopies within water-limited arid desert ecosystems. J. Hydrol. 2016, 539, 406–416. [Google Scholar] [CrossRef]
  36. Breshears, D.D.; Nyhan, J.W.; Heil, C.E.; Wilcox, B.P. Effects of woody plants on microclimate in a semiarid woodland: Soil temperature and evaporation in canopy and intercanopy patches. Int. J. Plant. Sci. 1998, 159, 1010–1017. [Google Scholar] [CrossRef]
  37. Scott, R.L.; Shuttleworth, W.J.; Keefer, T.O.; Warrick, A.W. Modeling multiyear observations of soil moisture recharge in the semiarid American Southwest. Water Resour. Res. 2000, 36, 2233–2247. [Google Scholar] [CrossRef] [Green Version]
  38. Chang, X.X.; Zhao, W.Z.; He, Z.B. Radial pattern of sap flow and response to microclimate and soil moisture in Qinghai spruce (Picea crassifolia) in the upper Heihe River Basin of arid northwestern China. Agric. For. Meteorol. 2014, 187, 14–21. [Google Scholar] [CrossRef]
  39. Chen, Y.; Wang, S.; Ren, Z.; Huang, J.; Wang, X.; Liu, S.; Deng, H.; Lin, W. Increased evapotranspiration from land cover changes intensified water crisis in an arid river basin in northwest China. J. Hydrol. 2019, 574, 383–397. [Google Scholar] [CrossRef]
  40. Návar, J. Fitting rainfall interception models to forest ecosystems of Mexico. J. Hydrol. 2017, 548, 458–470. [Google Scholar] [CrossRef]
  41. Bari, M.A.; Smith, N.; Ruprecht, J.K.; Boyd, B.W. Changes in streamflow components following logging and regeneration in the southern forest of Western Australia. Hydrol. Process. 2015, 10, 447–458. [Google Scholar] [CrossRef]
  42. Brasil, J.B.; Andrade, E.M.; De Queiroz-Palacio, H.A.; Augusto-Medeiros, P.H.; Neves-Dos Santos, J.C. Characteristics of precipitation and the process of interception in a seasonally dry tropical forest. J. Hydrol. 2018, 19, 307–317. [Google Scholar] [CrossRef]
  43. Muñoz-Villers, L.E.; Geissert, D.R.; Holwerda, F.; McDonnell, J.J. Factors influencing stream base flow transit times in tropical montane watersheds. Hydrol. Earth Syst. Sc. 2016, 20, 1621–1635. [Google Scholar] [CrossRef] [Green Version]
  44. Wang, H.; Xu, W.; Zhang, M.; Cui, L.; Yu, X. Effects of forest on mean annual runoff in North China. Pol. J. Environ. Studies 2018, 27, 889–896. [Google Scholar] [CrossRef]
  45. Zhang, Y.; Wei, H.; Nearing, M.A. Effects of antecedent soil moisture on runoff modeling in small semiarid watersheds of southeastern Arizona. Hydrol. Earth Syst. Sc. 2011, 15, 3171–3179. [Google Scholar] [CrossRef] [Green Version]
  46. Perry, T.D.; Jones, J.A. Summer streamflow deficits from regenerating Douglas-fir forest in the Pacific Northwest, USA. Ecohydrology 2017, 10, e1790. [Google Scholar] [CrossRef]
  47. Ariza-Villaverde, A.B.; Pavón-Domínguez, P.; Carmona-Cabezas, R.; Gutiérrez-Ravé, E.; Jiménez-Hornero, F.J. Joint multifractal analysis of air temperature, relative humidity and reference evapotranspiration in the middle zone of the Guadalquivir river valley. Agric. For. Meteorol. 2019, 278, 107657. [Google Scholar] [CrossRef]
  48. Gebhardt, T.; Häberleb, K.; Matyssekb, R.; Schulzc, C.; Ammer, C. The more, the better? Water relations of Norway spruce stands after progressive thinning. Agric. For. Meteorol. 2014, 197, 235–243. [Google Scholar] [CrossRef]
  49. Schrumpf, M.; Axmacher, J.C.; Zech, W.; Lyaruu, H.V.M. Net precipitation and soil water dynamics in clearings, old secondary and old-growth forests in the montane rain forest belt of Mount Kilimanjaro, Tanzania. Hydrol. Process. 2011, 25, 418–428. [Google Scholar] [CrossRef]
  50. Fedorová, B.; Kadavy, J.; Adamec, Z.; Knott, R.; Kucera, A.; Kneifl, M.; Drápela, K. Effect of thinning and reduced throughfall in young coppice dominated by Quercus petraea (Matt.) Liebl. and Carpinus betulus L. Austrian J. For. Sci. 2018, 135, 1–17. [Google Scholar]
  51. Lozano-Parra, J.; Schnabel, S.; Ceballos-Barbancho, A. The role of vegetation covers on soil wetting processes at rainfall event scale in scattered tree woodland of Mediterranean climate. J. Hydrol. 2015, 529, 951–961. [Google Scholar] [CrossRef]
  52. Cantón, Y.; Solé-Benet, A.; Domingo, F. Temporal and spatial patterns of soil moisture in semiarid badlands of SE Spain. J. Hydrol. 2004, 285, 199–214. [Google Scholar] [CrossRef]
  53. Carter, M.C.; Dean, T.J.; Wang, Z.; Newbold, R.A. Impacts of harvesting and postharvest treatments on soil bulk density, soil strength, and early growth of Pinus taeda in the Gulf Coastal Plain: A long-term soil productivity affiliated study. Can. J. For. Res. 2006, 36, 601–614. [Google Scholar] [CrossRef]
  54. Tarpey, R.A.; Jurgensen, M.F.; Palik, B.J.; Kolka, R.K. The long-term effects of silvicultural thinning and partial cutting on soil compaction in red pine (Pinus resinosa Ait.) and northern hardwood stands in the northern Great Lakes Region of the United States. Can. J. Soil Sci. 2008, 88, 849–857. [Google Scholar] [CrossRef]
  55. Wall, A. Risk analysis of effects of whole-tree harvesting on site productivity. For. Ecol. Manag. 2012, 282, 175–184. [Google Scholar] [CrossRef]
  56. Keesstra, S.D.; Mol, G.; De Leeuw, J.; Okx, J.; Molenaar, C.; De Cleen, M.; Visser, S. Soil related sustainable development goals: Four concepts to make land degradation neutrality and restoration work. Land 2018, 7, 133. [Google Scholar] [CrossRef] [Green Version]
Figure 1. Location of the three micro-catchments and monitoring equipment in the study area in Chihuahua, Mexico.
Water 13 00105 g001
Figure 2. Aerial image from a drone showing the characteristics of micro-catchment 2 before thinning (left) and after 80% thinning (right).
Water 13 00105 g002
Figure 3. Location of soil moisture sensors inter canopy, and under canopy in an oak-pine forest in Chihuahua, Mexico.
Water 13 00105 g003
Figure 4. Mean soil moisture by rainfall event before thinning (2018) for micro-catchments 1 and 2.
Water 13 00105 g004
Figure 5. Soil moisture response in micro-catchment 3 as a result of two precipitation events in 2018: (a) 26 September 2018 (59 mm); and (b) 4 October 2018 (37 mm). The x-axis represents the time of day.
Water 13 00105 g005
Figure 6. Soil moisture behavior inter canopy and under canopy for one rainfall event (29 mm) on 10 July 2018, in micro-catchment 1.
Water 13 00105 g006
Figure 7. Monthly precipitation during the 2018 and 2019 rainy seasons in a semi-dry forest of Chihuahua, Mexico.
Water 13 00105 g007
Figure 8. Mean soil moisture by rainfall event after thinning (2019) for micro-catchments 1 and 2.
Water 13 00105 g008
Figure 9. Soil moisture behavior after thinning of three micro-catchments with different magnitudes of rainfall events: (a) series of rainfall events in July 2019; (b) large rainfall event; (c,d) small rainfall events.
Water 13 00105 g009
Figure 10. Soil moisture behavior inter canopy and under canopy for one rainfall event (37 mm) on 4 July 2019, in micro-catchment 2.
Water 13 00105 g010
Figure 11. (a) Rainfall after thinning (2019); (bd) Mean daily soil moisture inter canopy and under canopy during the entire study period for micro-catchment 1, 2, and 3, respectively.
Water 13 00105 g011
Table 1. Variables evaluated in the study of soil moisture dynamics of three micro-catchments in a semi-dry forest in Chihuahua, Mexico.
FactorVariableUnit
PrecipitationRainfall depthmm
Rainfall event durationh
Maximum 30-min rainfall intensitymm h−1
Antecedent precipitation indexmm
Soil moistureMaximum VWC inter canopy * % VWC
Average VWC inter canopy *
Maximum VWC under canopy *
Average VWC under canopy *
VWC: Volumetric Water Content. * For each rainfall event, day, month, and rainy season.
Table 2. Vegetation and soil characteristics before and after thinning.
Before Thinning (2018)
Micro-Catchment
Characteristic123
Tree density (trees ha−1)231121722147
Basal area (m2 ha−1)22.421.926.9
Canopy cover (%)110.589.7106.4
Litter (%)60.469.776.4
Herbaceous vegetation (%)16.018.411.0
Bare soil (%)23.611.912.6
Slope (%)10.311.512.0
Surface roughness0.9470.9450.954
Soil depth (m)0.290.480.47
Soil bulk density (g cm−3)1.031.101.27
After Thinning (2019)
Percentage of Standing Trees by Catchment
Characteristic1 = 100%2 = 20%3 = 60%
Tree density (trees ha−1)23114341290
Basal area (m2 ha−1)22.46.617.2
Canopy cover (%)110.519.161.5
Table 3. Precipitation metrics and volumetric water content for three large rainfall events (>30 mm) and three small rainfall events (<10 mm) before thinning (2018).
DateR
(mm)
D
(h)
I30
(mm h−1)
API
(mm)
VWC (%)
Catchment 1Catchment 2Catchment 3
MaxAvgMaxAvgMaxAvg
Large rainfall events
Sept 2659.36.649.872.044.328.443.124.549.216.9
Oct 436.85.129.073.843.123.141.420.444.910.2
Oct 2334.27.326.945.543.125.3--41.410.0
Small rainfall events
Jun 294.82.54.818.72.11.72.42.22.82.5
Aug 410.59.29.826.227.56.613.65.024.97.2
Aug 96.710.42.134.87.95.811.98.56.97.1
R: Rainfall depth; D: Rainfall event duration; I30: Maximum 30-min rainfall intensity; API: Antecedent precipitation index; Max and Avg VWC: Maximum and Average Volumetric Water Content; (-) no data.
Table 4. Precipitation metrics and volumetric water content for three large rainfall events (>30 mm) and three small rainfall events (<10 mm) after thinning (2019).
DateR
(mm)
D
(h)
I30
(mm h−1)
API
(mm)
VWC (%)
Catchment 1Catchment 2Catchment 3
MaxAvgMaxAvgMaxAvg
Large rainfall events
Jul 436.610.940.949.545.527.636.627.050.615.8
Aug 2038.78.837.267.547.922.337.826.249.211.1
Sept 3031.515.711.748.538.423.235.528.327.514.1
Small rainfall events
Jul 1810.51.617.835.329.713.937.228.448.518.1
Aug 286.50.612.559.98.67.924.424.020.515.4
Sept 077.43.45.941.413.68.723.118.818.39.2
R: Rainfall depth; D: Rainfall event duration; I30: Maximum 30-min rainfall intensity; API: Antecedent precipitation index; Max and Avg VWC: Maximum and Average Volumetric Water Content.
Table 5. Soil moisture differences (daily average and maximum values) between before thinning (2018) and after thinning (2019) for inter canopy and under canopy scenarios in the three micro-catchments.
Micro-Catchment 1Micro-Catchment 2Micro-Catchment 3
Daily VWC (%)Daily VWC (%)Daily VWC (%)
AverageMaxAverageMaxAverageMax
Inter canopy
20188.612.59.715.94.67.9
20199.614.715.019.45.410.1
df137137112112137137
t-Value−1.9−1.7−8.8−2.8−2.5−1.8
p-Value0.10.1<0.00010.00690.010.07
Under canopy
201810.415.36.28.42.95.4
201910.115.78.611.44.77.8
df137137112112137137
t-Value0.4−0.3−4.6−3.2−9.0−2.5
p-Value0.70.8<0.00010.0019<0.00010.01
A significant p-Value at a 95% confidence level is indicated in italics. VWC: volumetric water content; Max: maximum; df: degrees of freedom.
Publisher’s Note: MDPI stays neutral with regard to jurisdictional claims in published maps and institutional affiliations.

