An Interval Fuzzy, Double-Sided, Chance-Constrained Stochastic Programming Model for Planning the Ecological Service Value of Interconnected River Systems

Abstract
1. Introduction
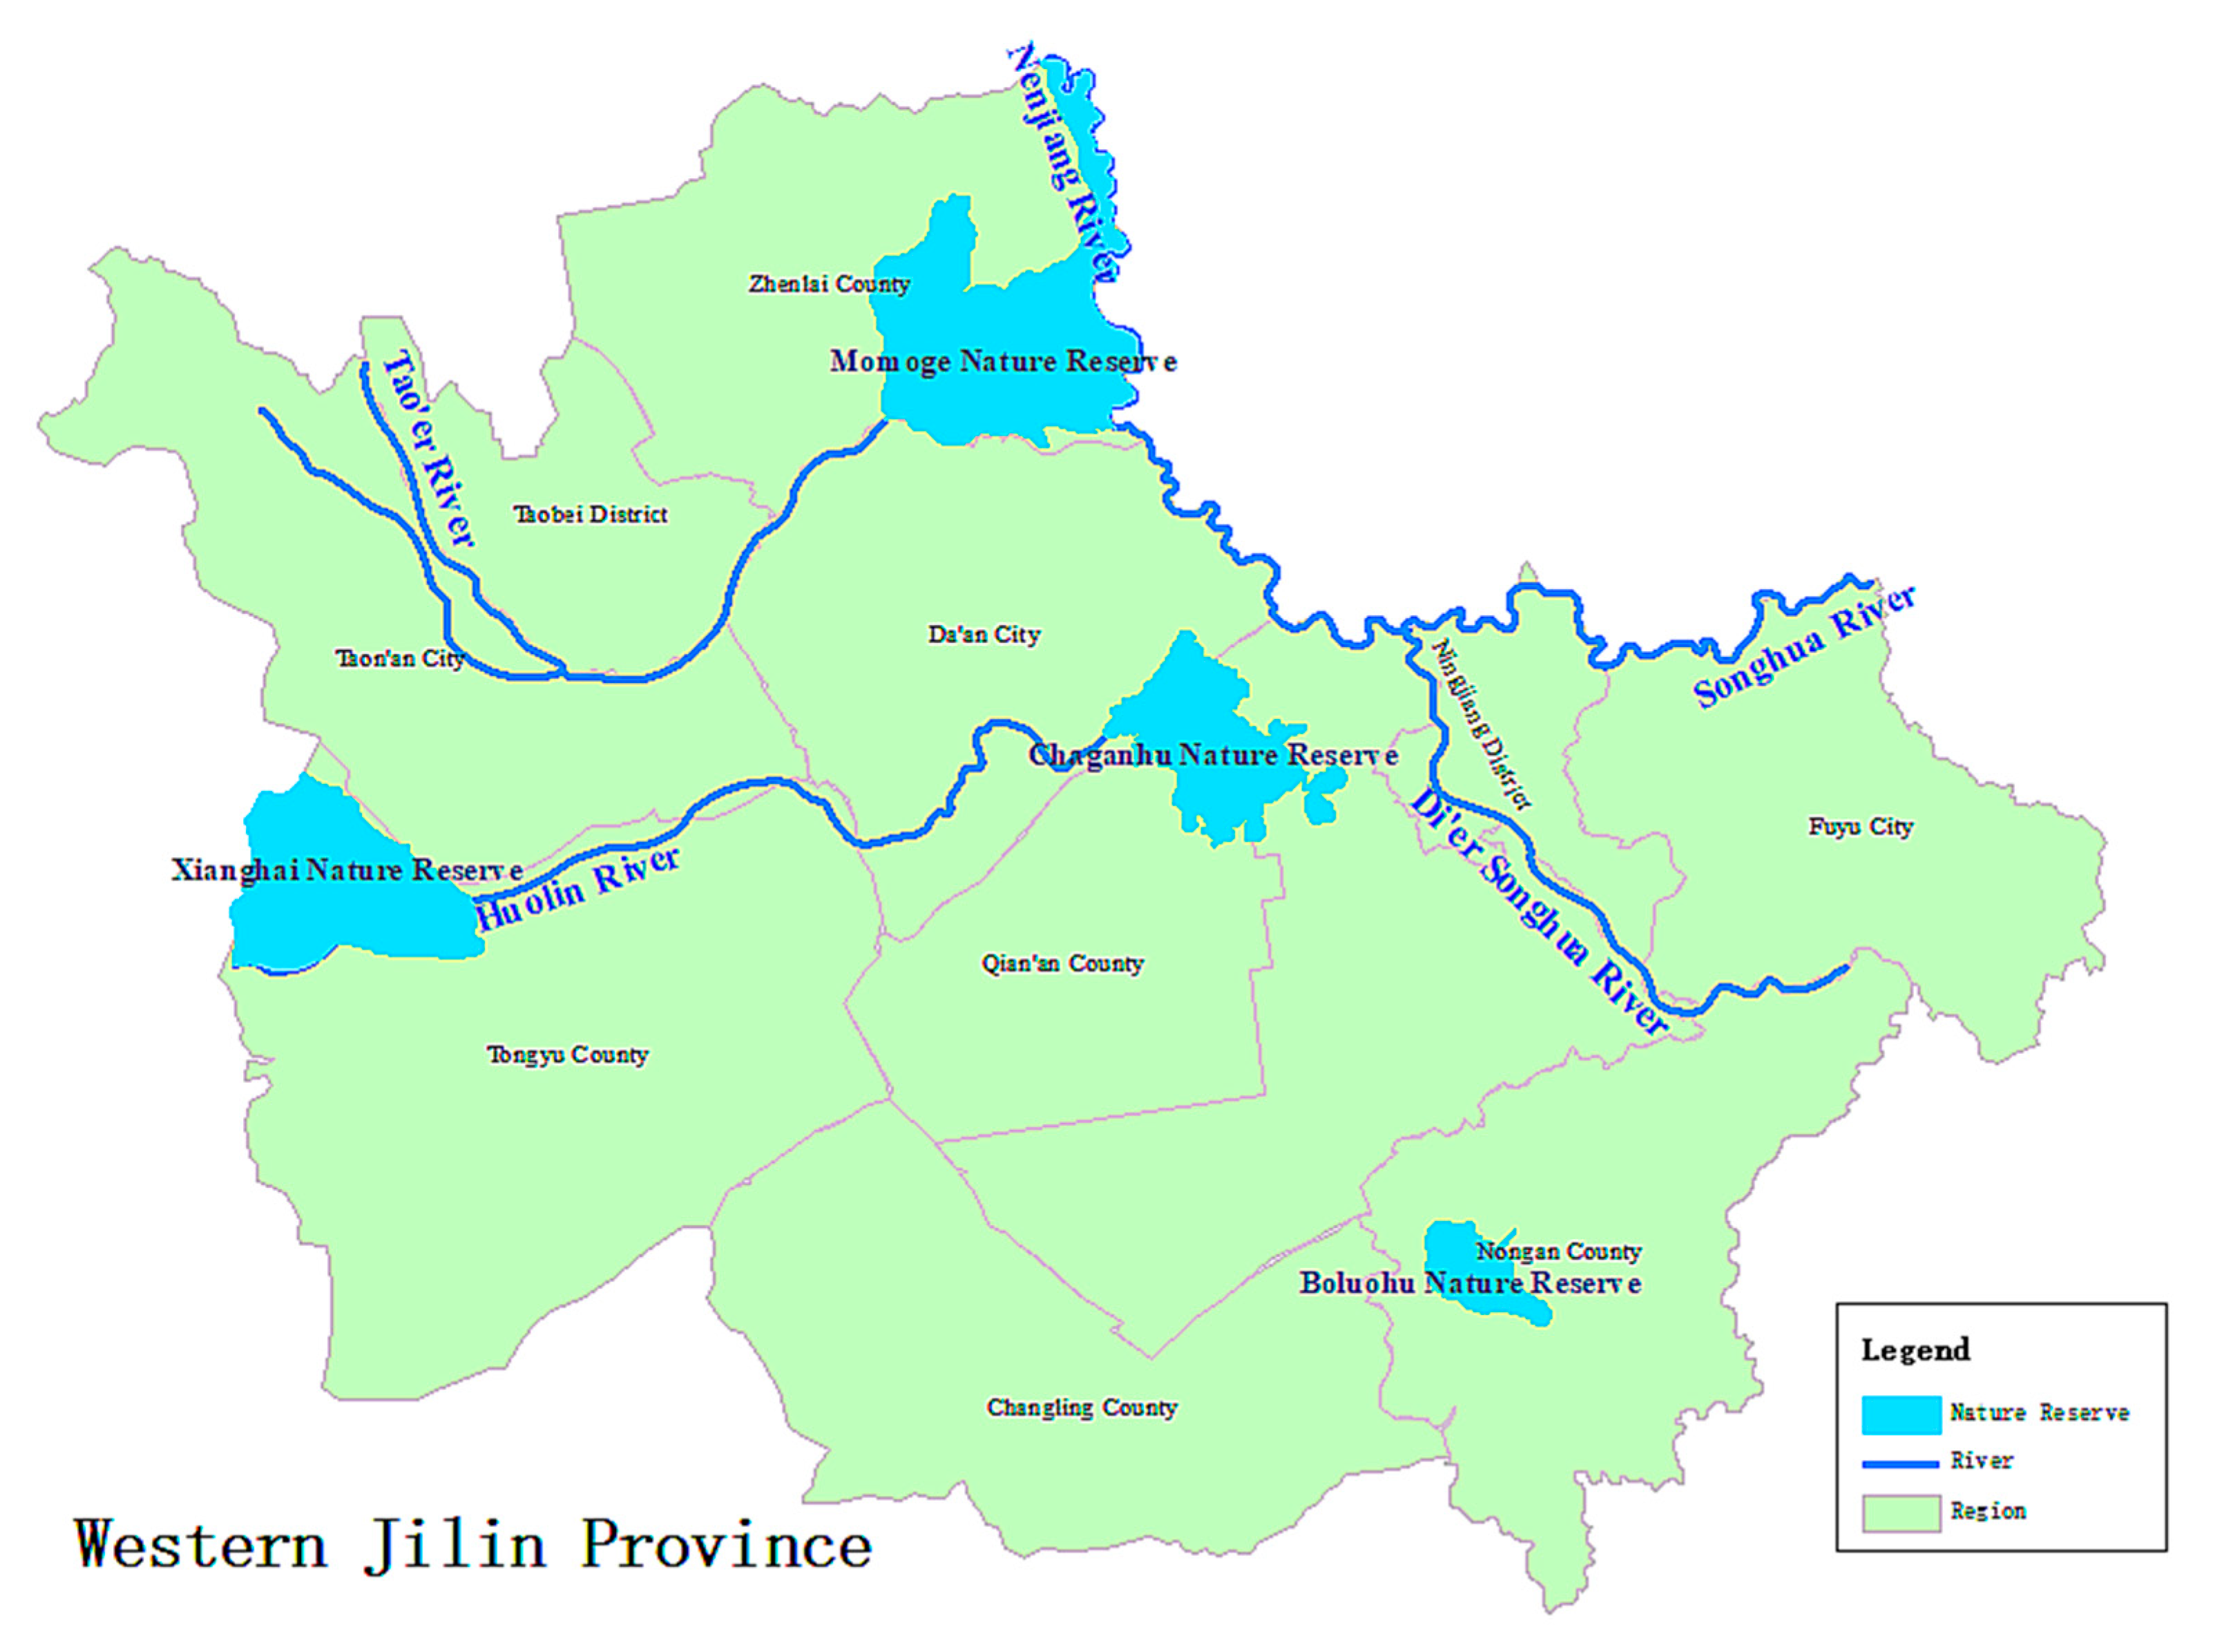
2. Case Study
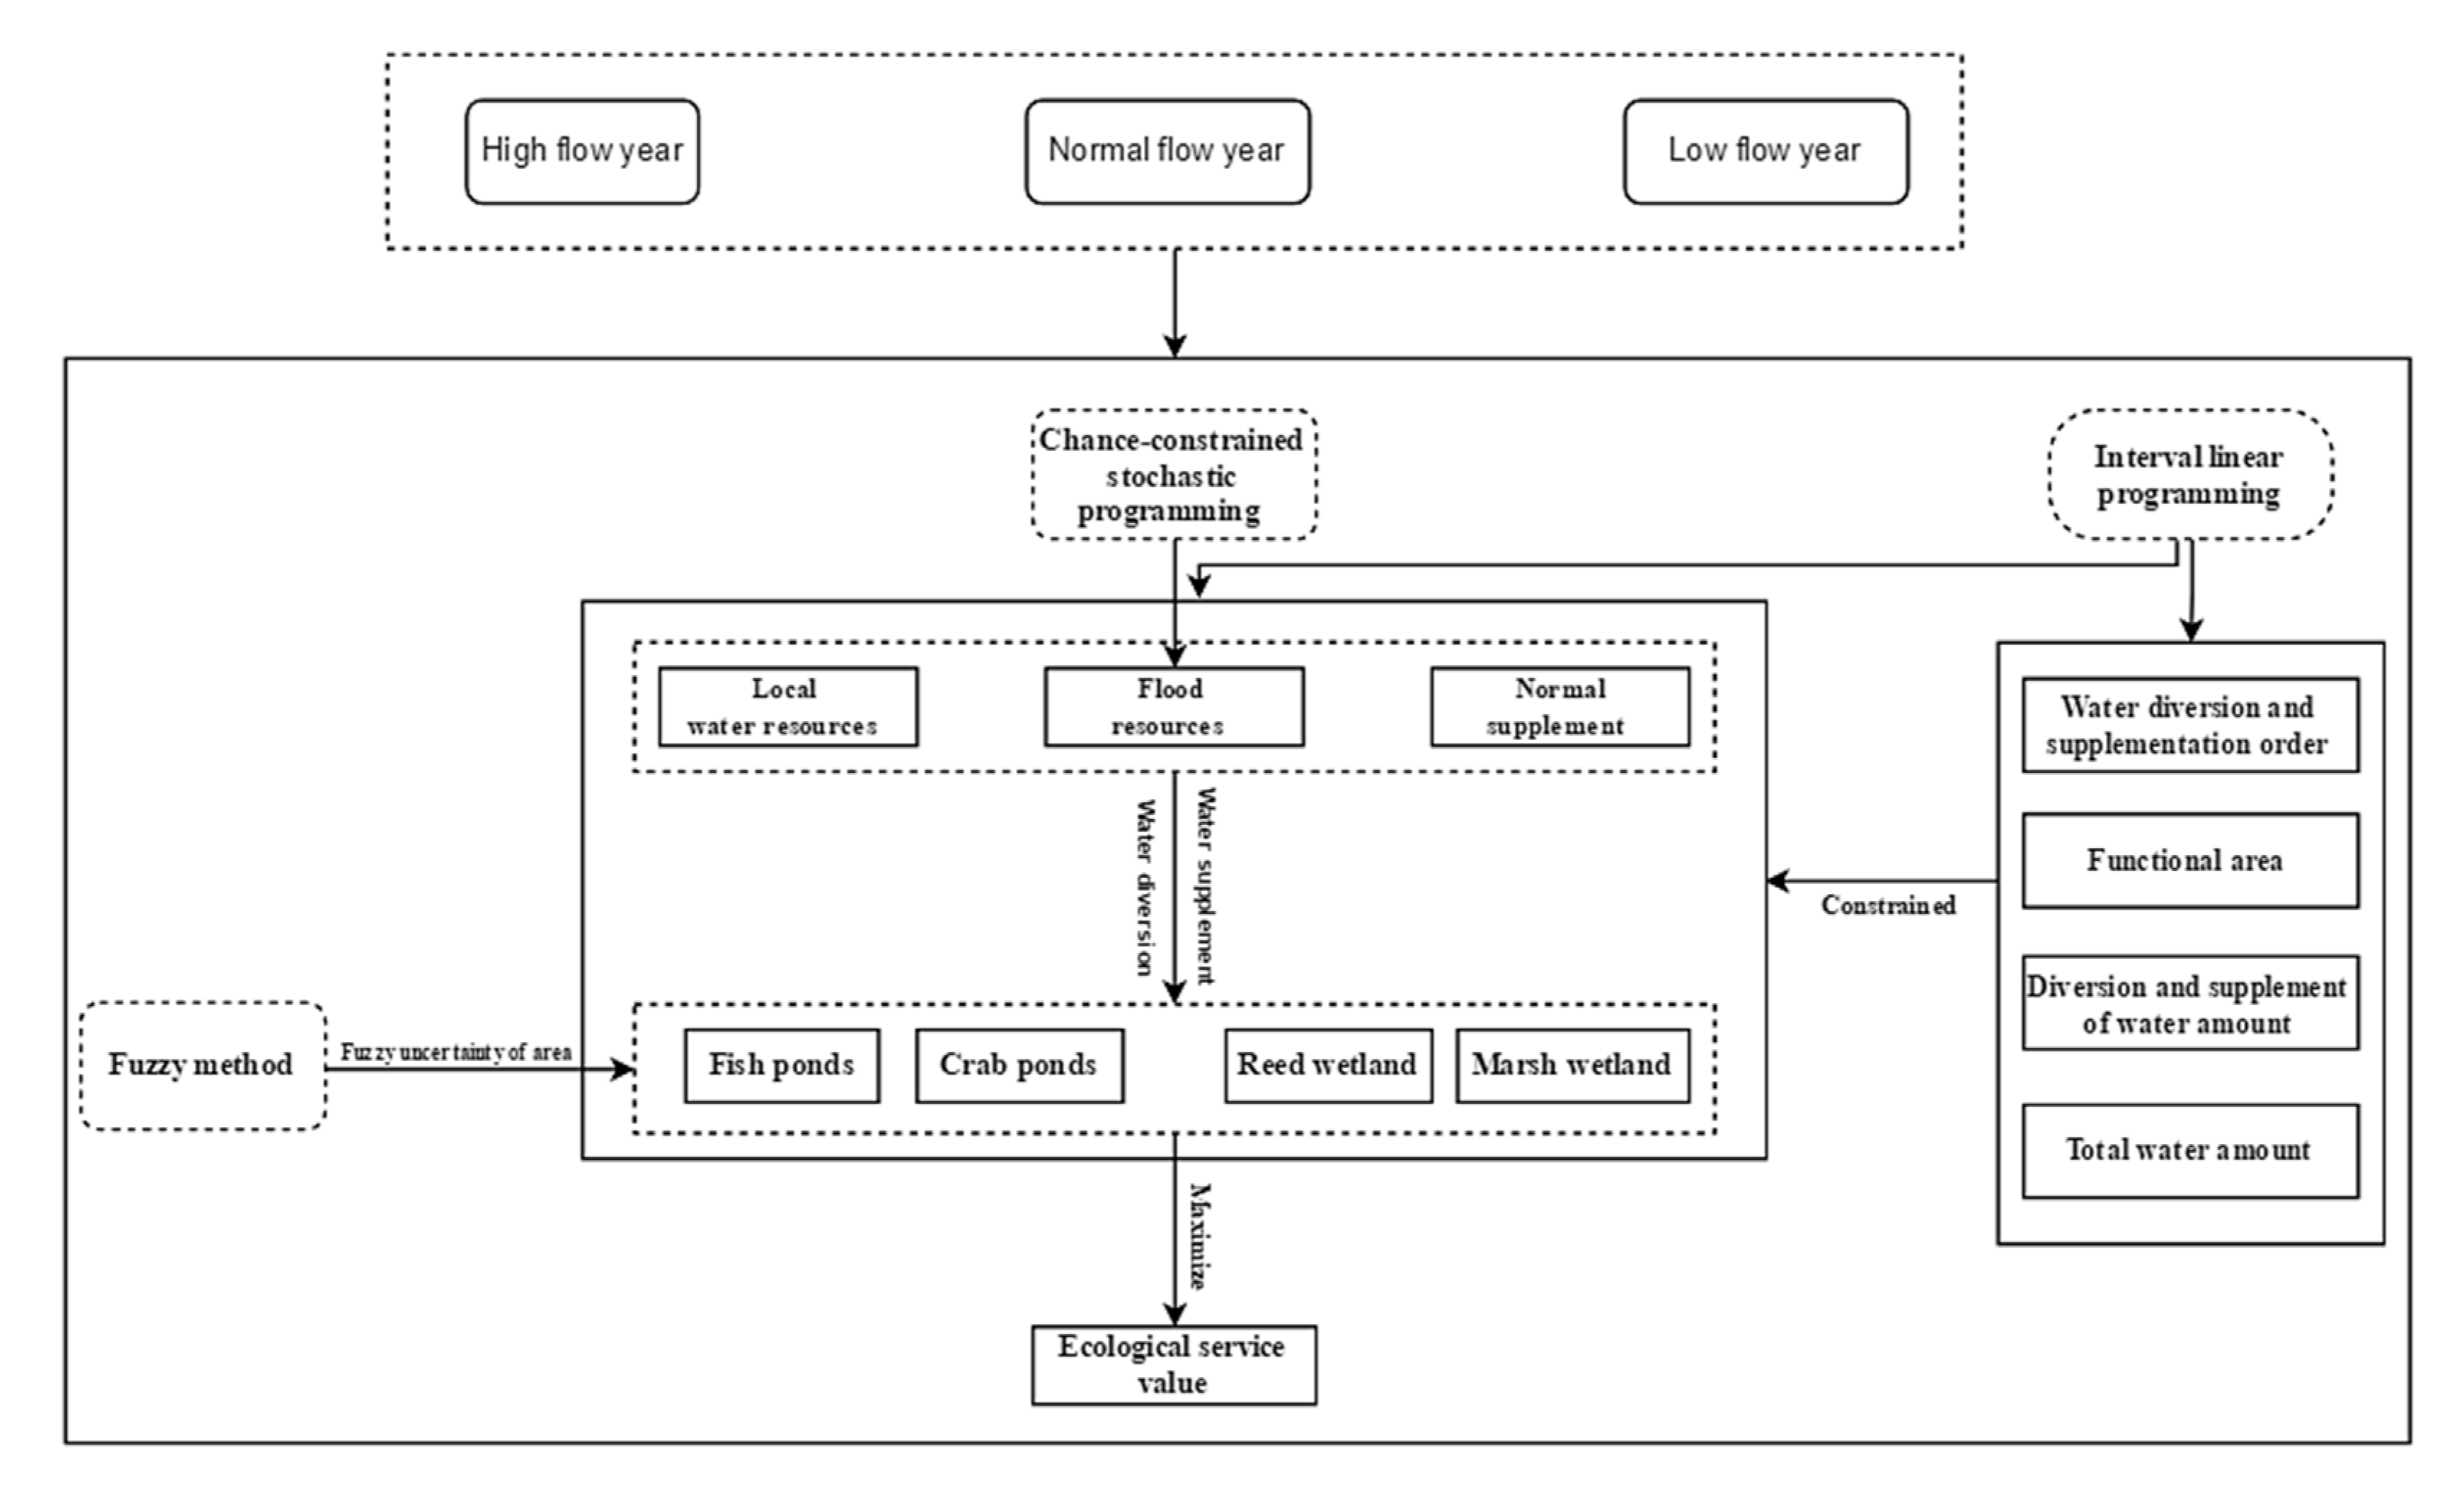
3. Model Formulation
3.1. Ecological Service Value Optimization Model, Based on the Interval, Double-Sided, Chance-Constrained Stochastic Programming Model
- (1)
- Constraints for water diversion and supplementation order:
- (2)
- Constraints for functional area:
- (3)
- Constraints for the diversion and supplement of water amount:
- (4)
- Constraints for the total water amount:
3.2. Ecological Service Value Optimization Model Based on the Interval Fuzzy, Double-Sided, Chance-Constrained Stochastic Programming
- (1)
- Constraints for water diversion and supplementation order:
- (2)
- Constraints for the functional area:
- (3)
- Constraints for the diversion and supplement of water amount:
- (4)
- Constraints for the total water amount:
3.3. Model Parameters
4. Results
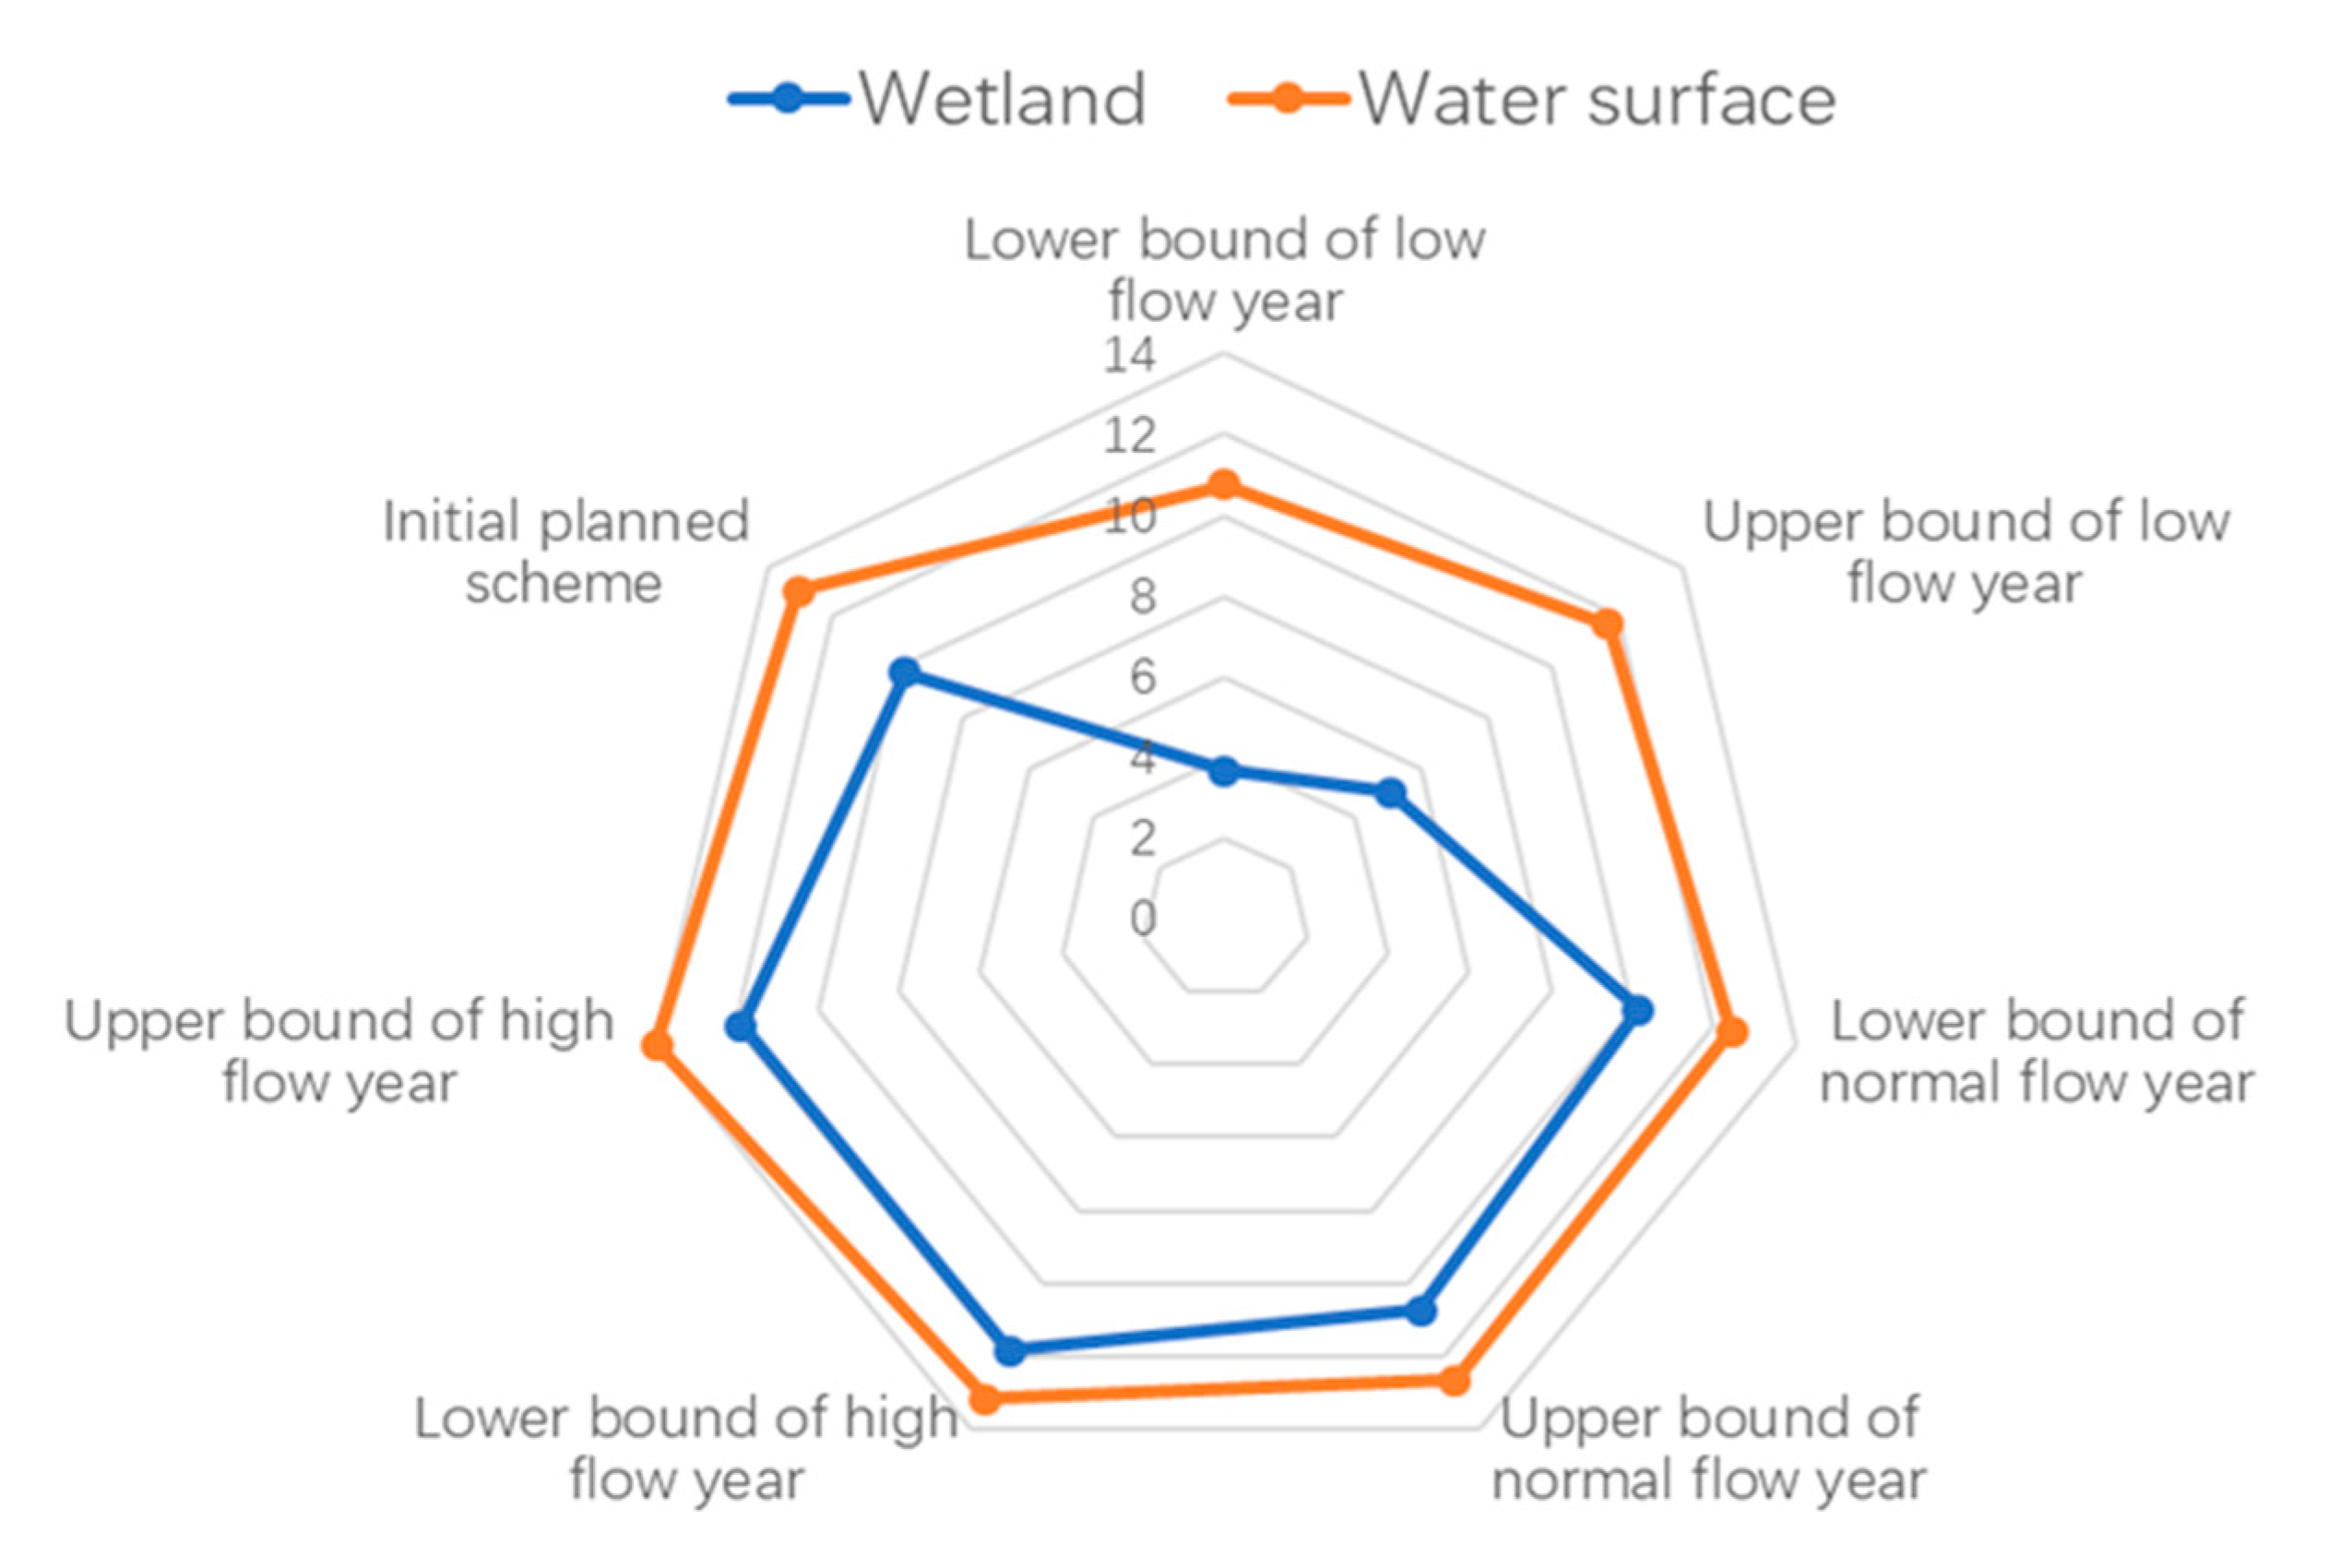
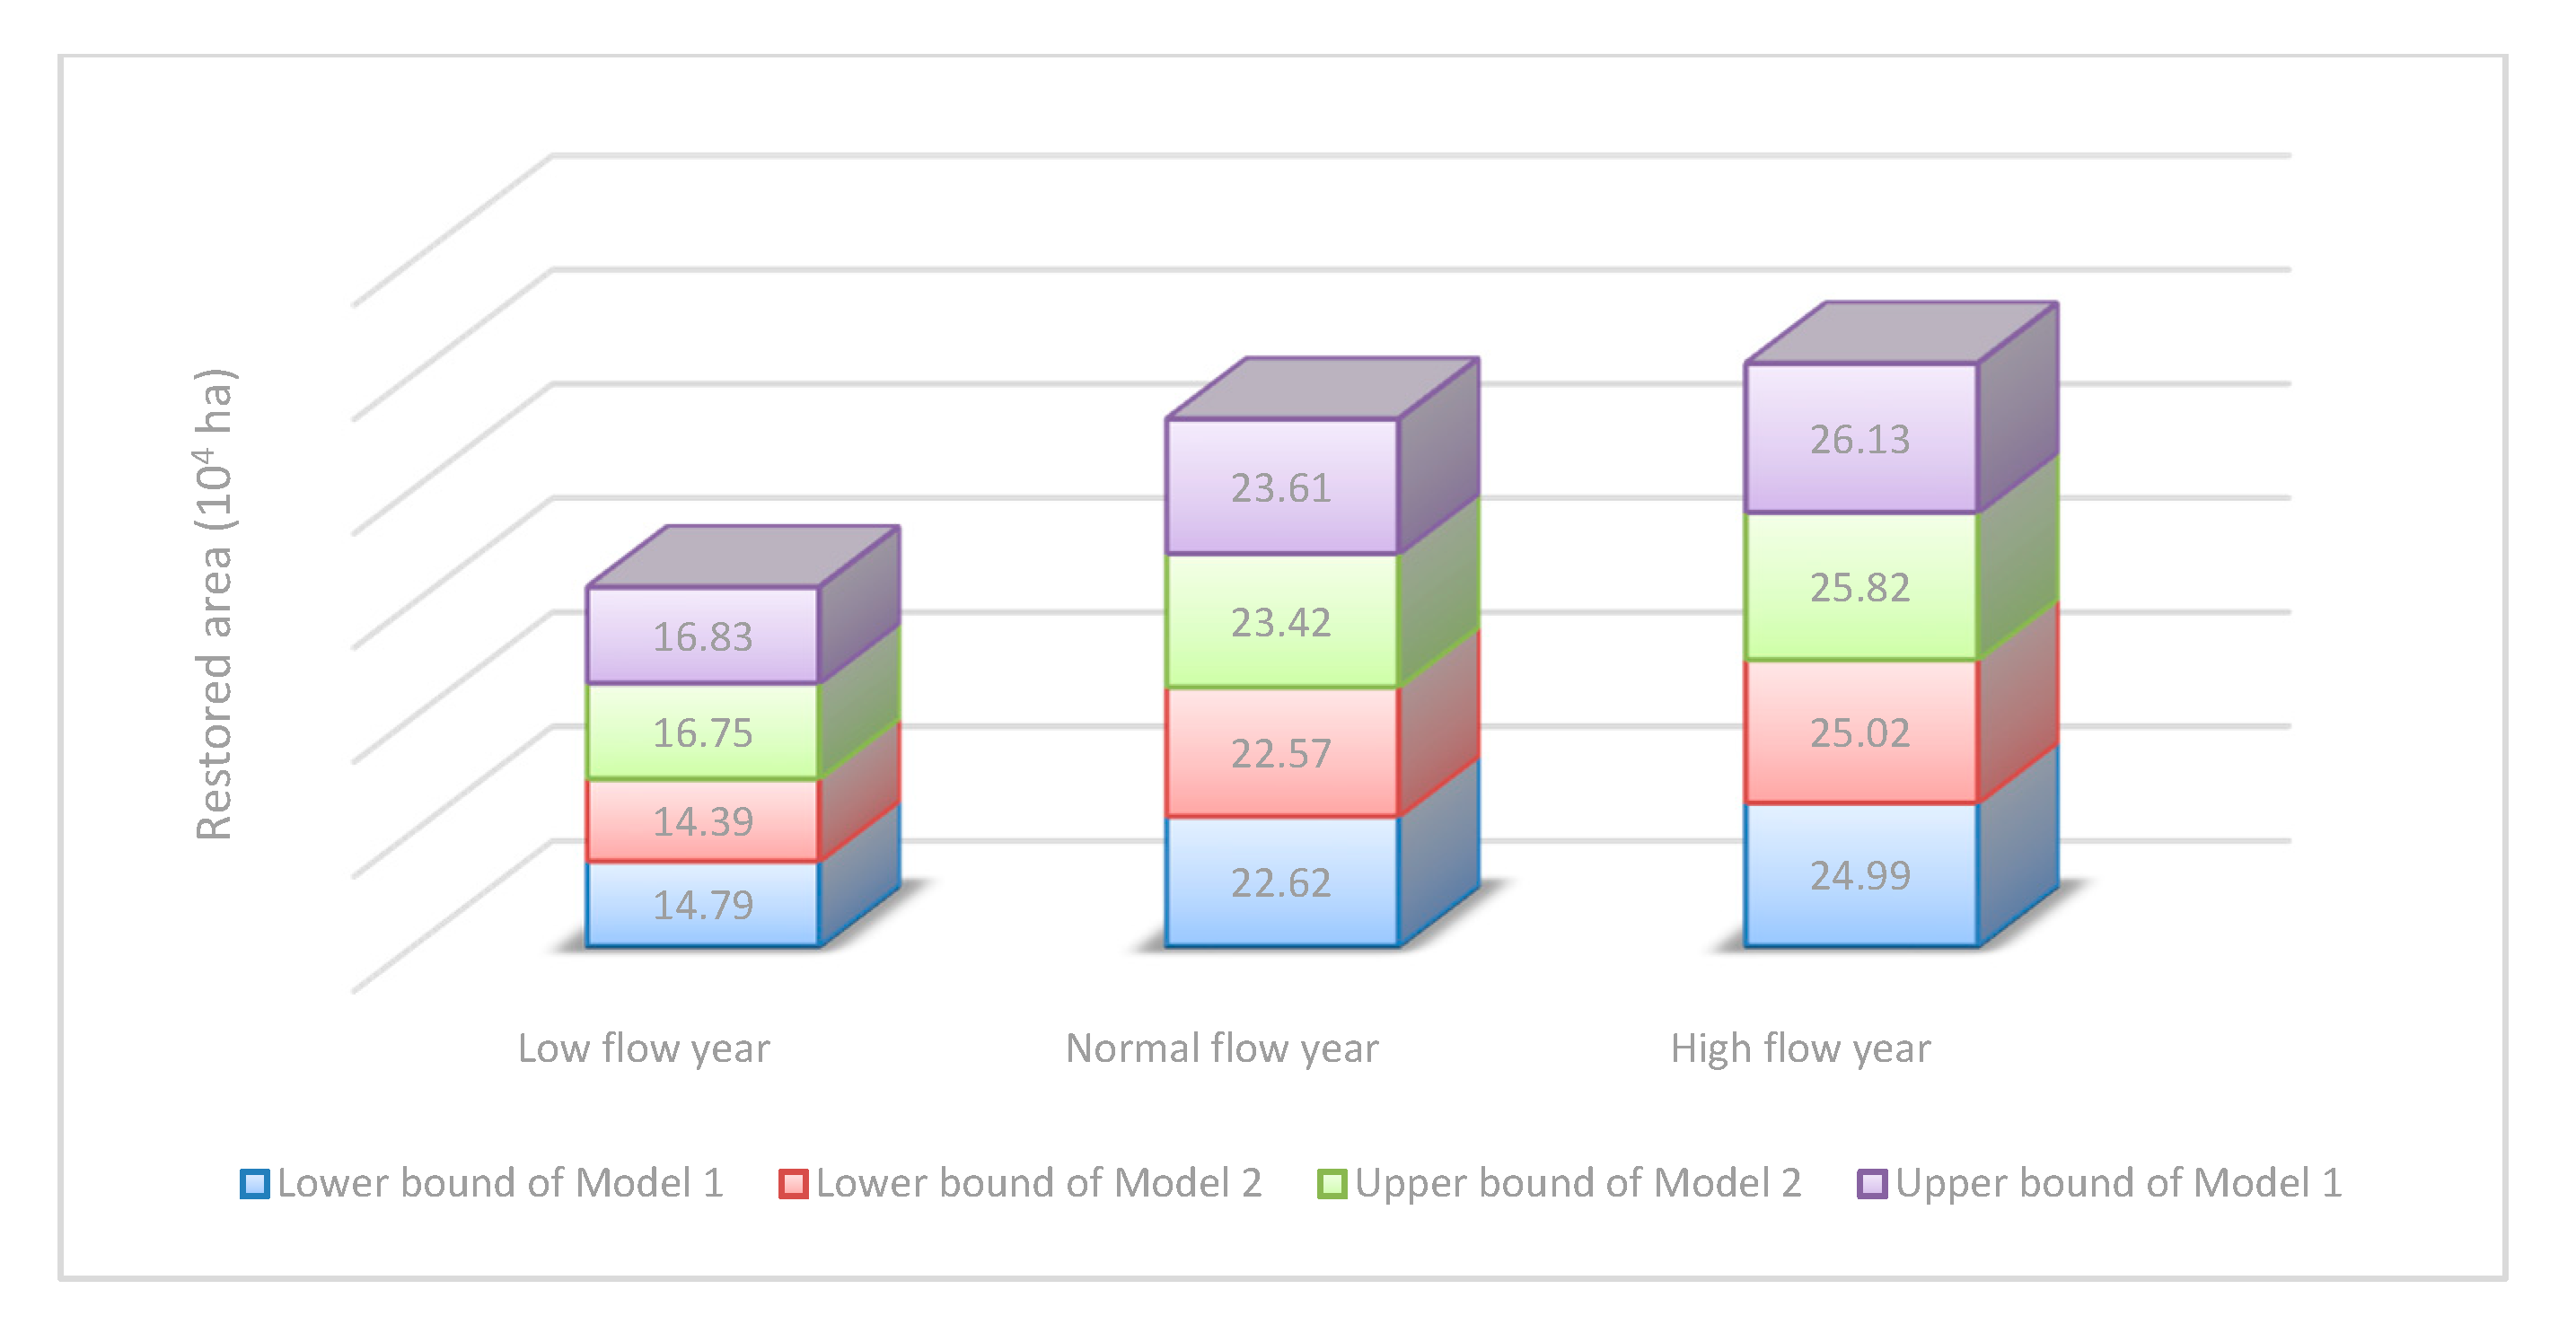
4.1. Results of the Restored Area of Wetlands, Lakes, and Ponds Based on the IFDCP
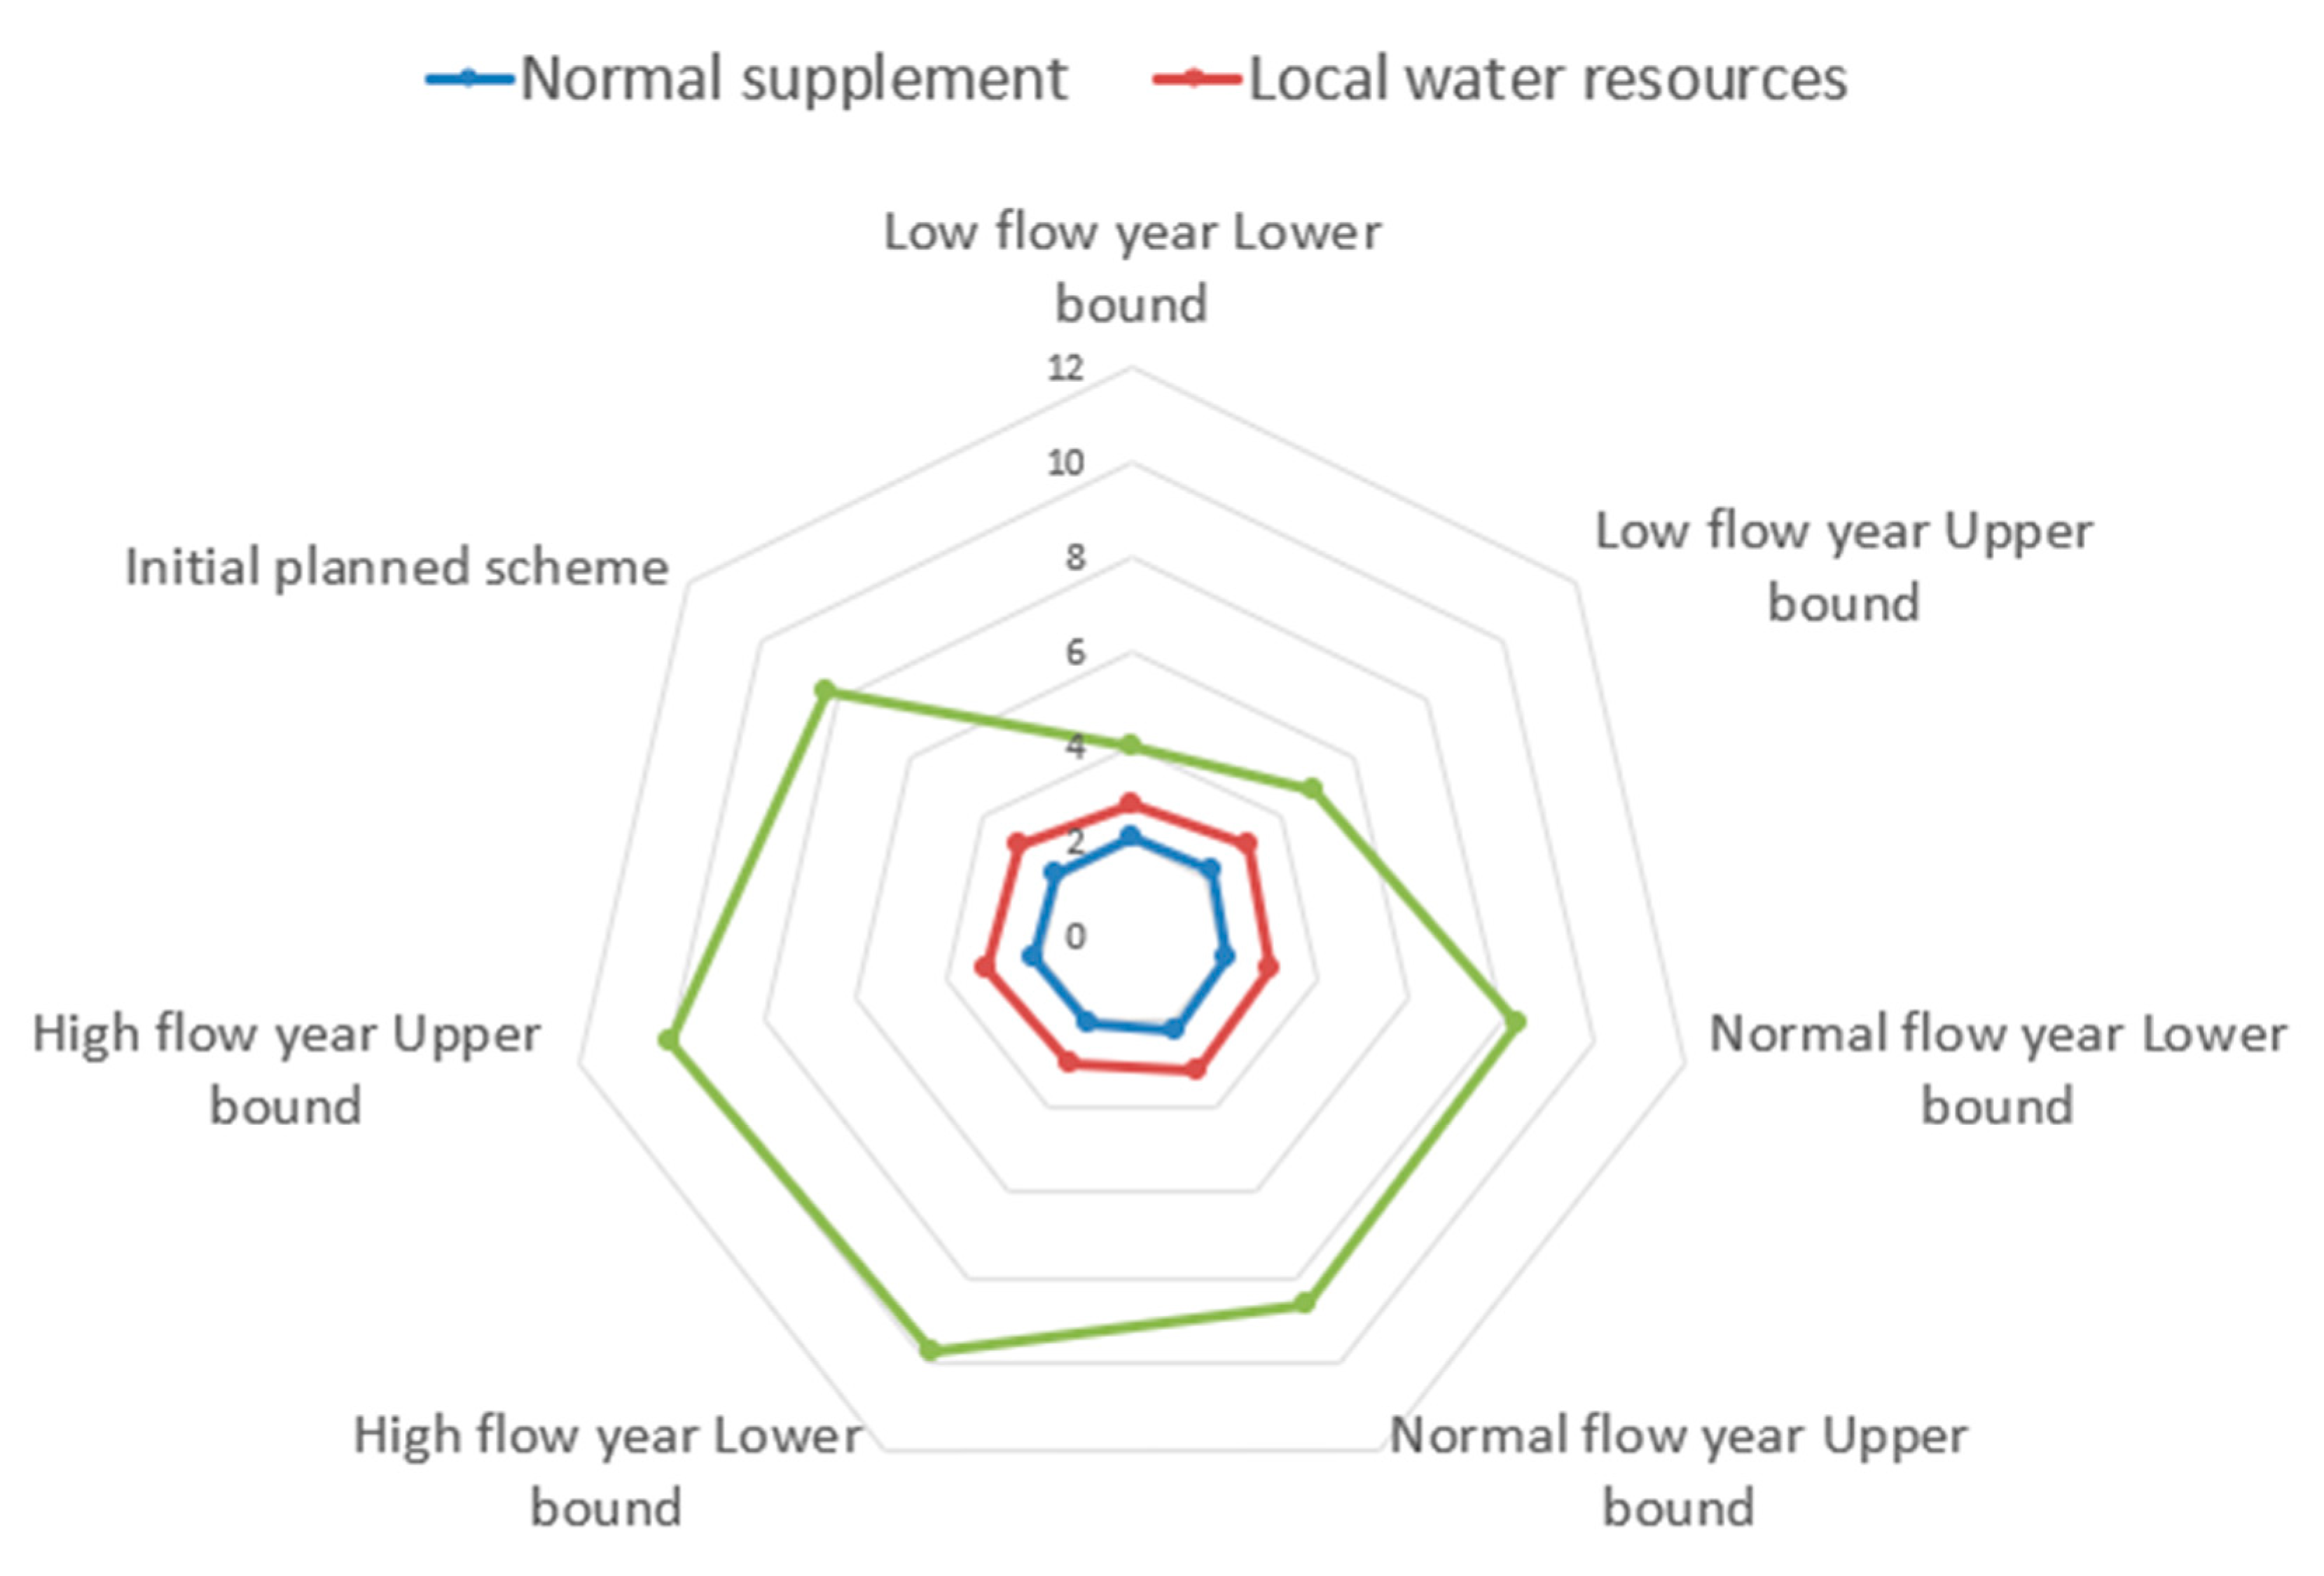
4.2. Results of the Optimization of Water Diversion and Supplement Based on the IFDCP
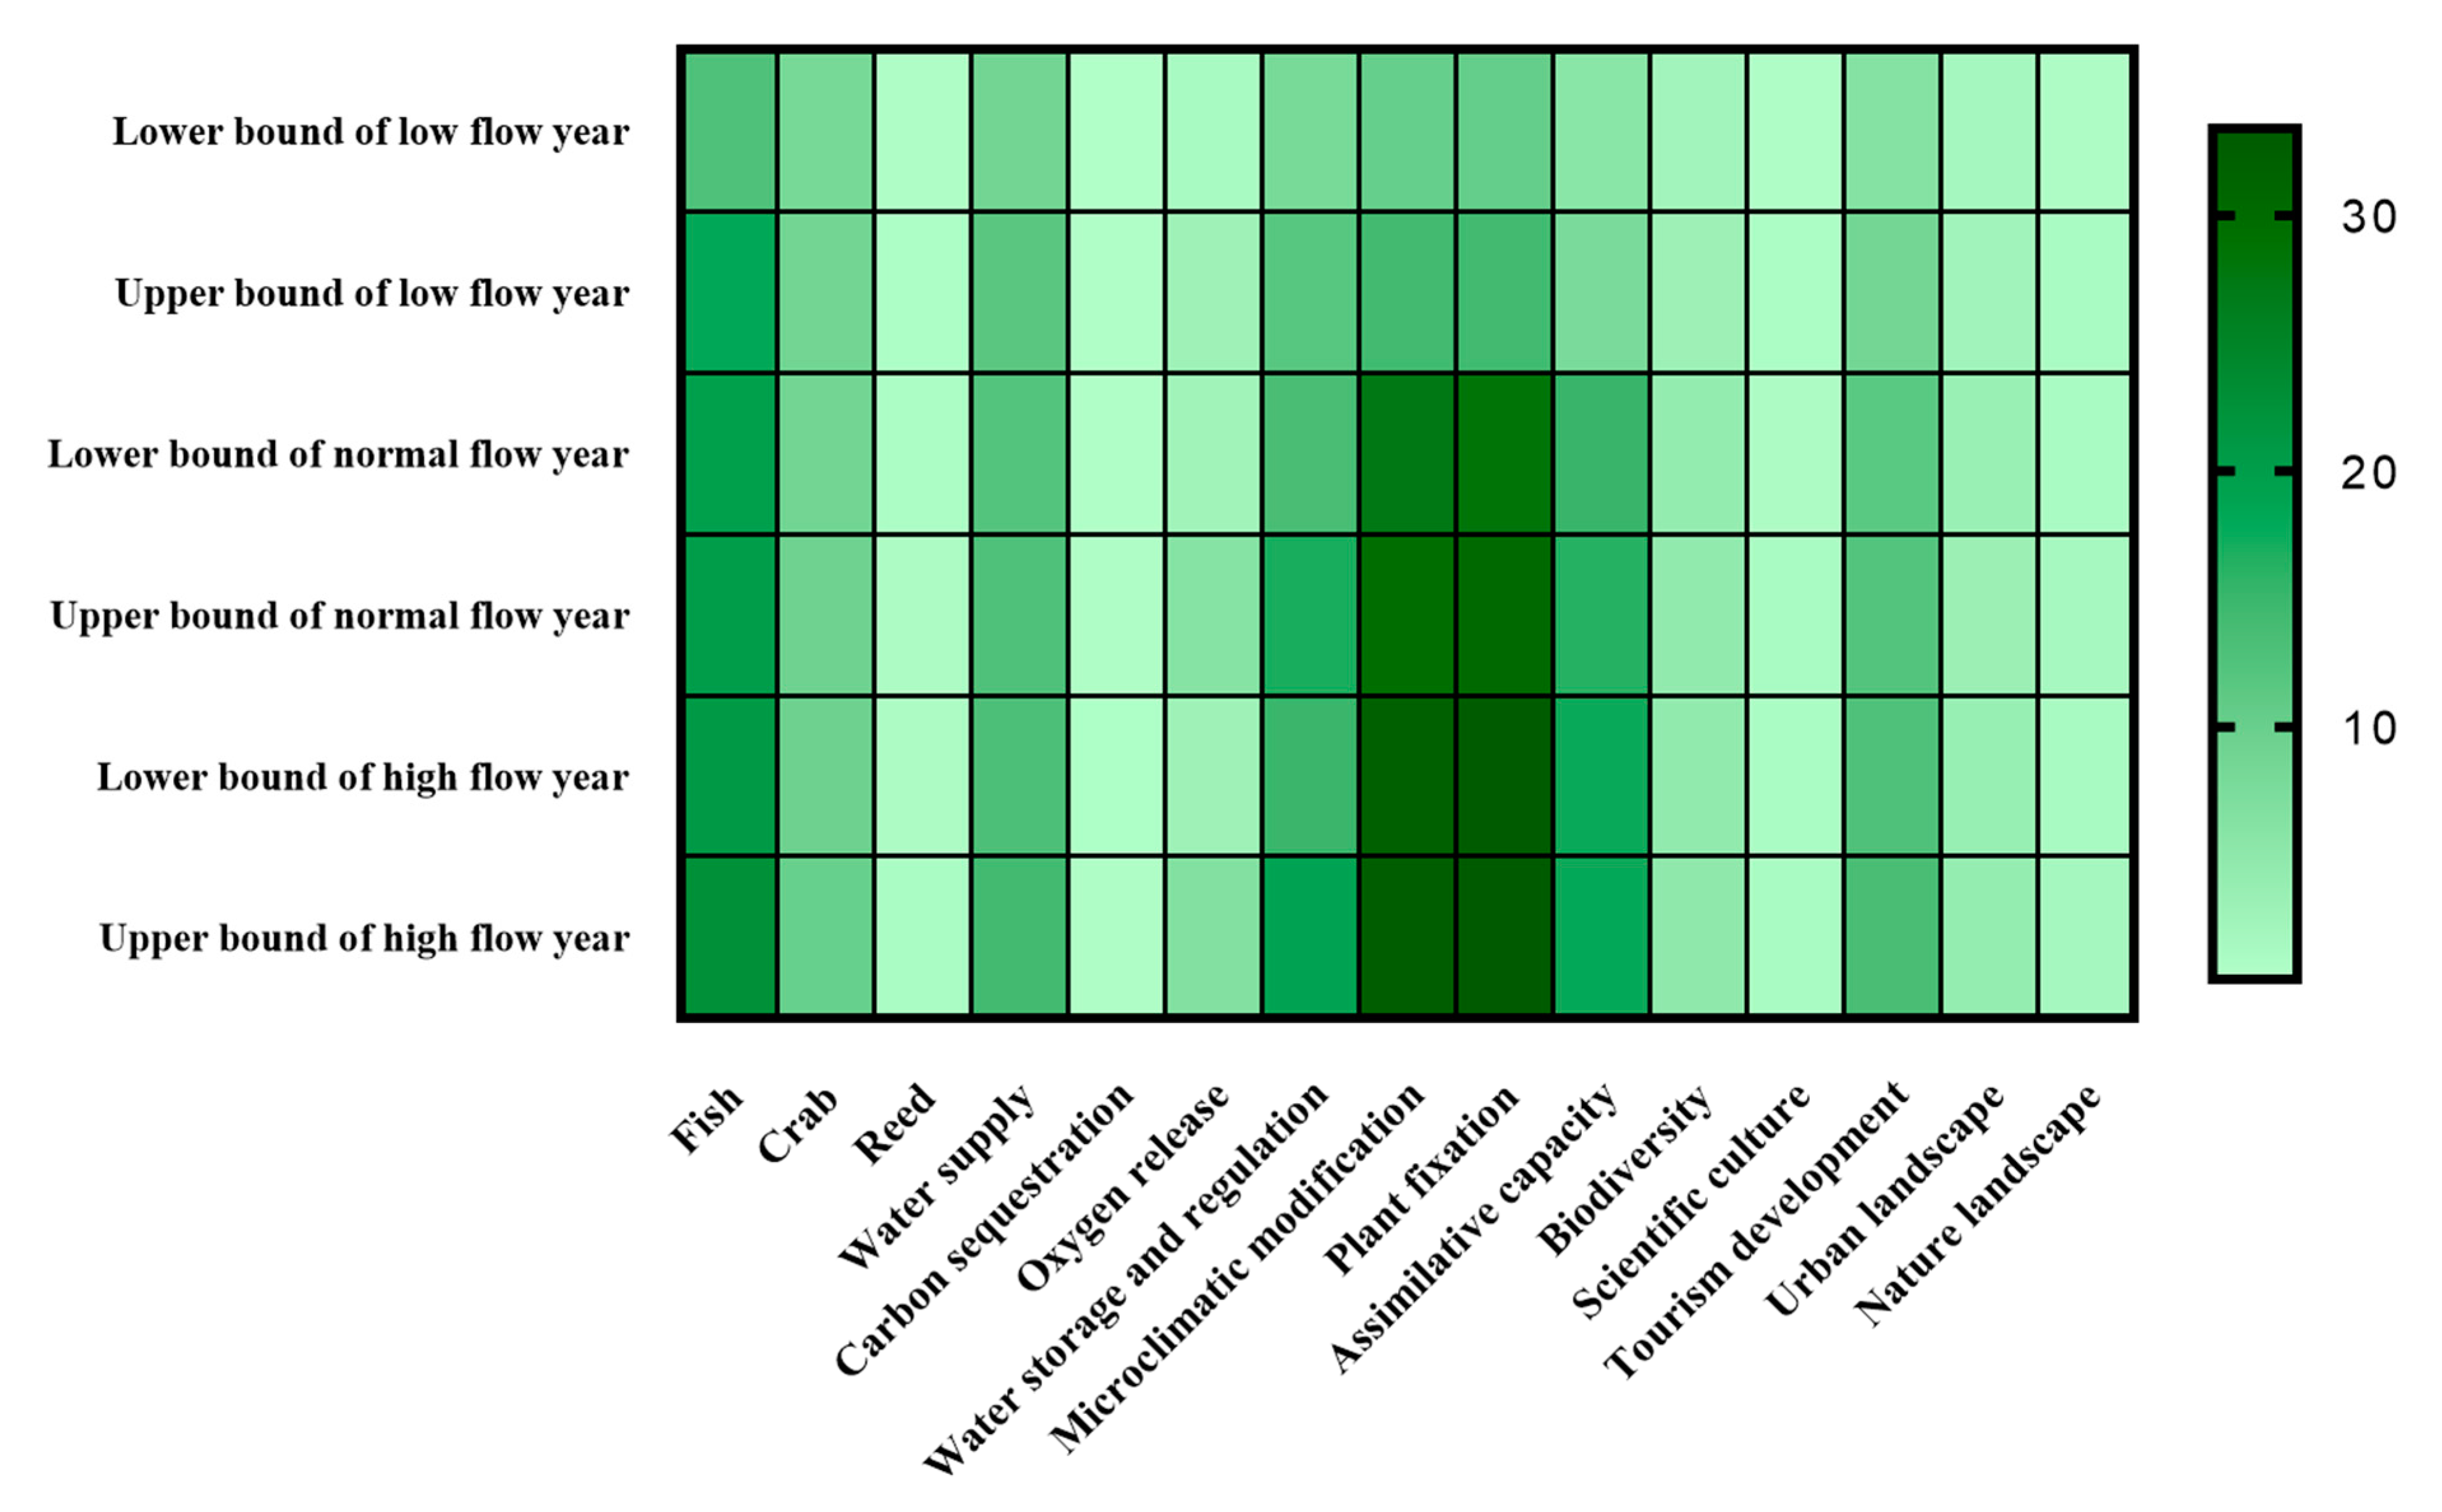
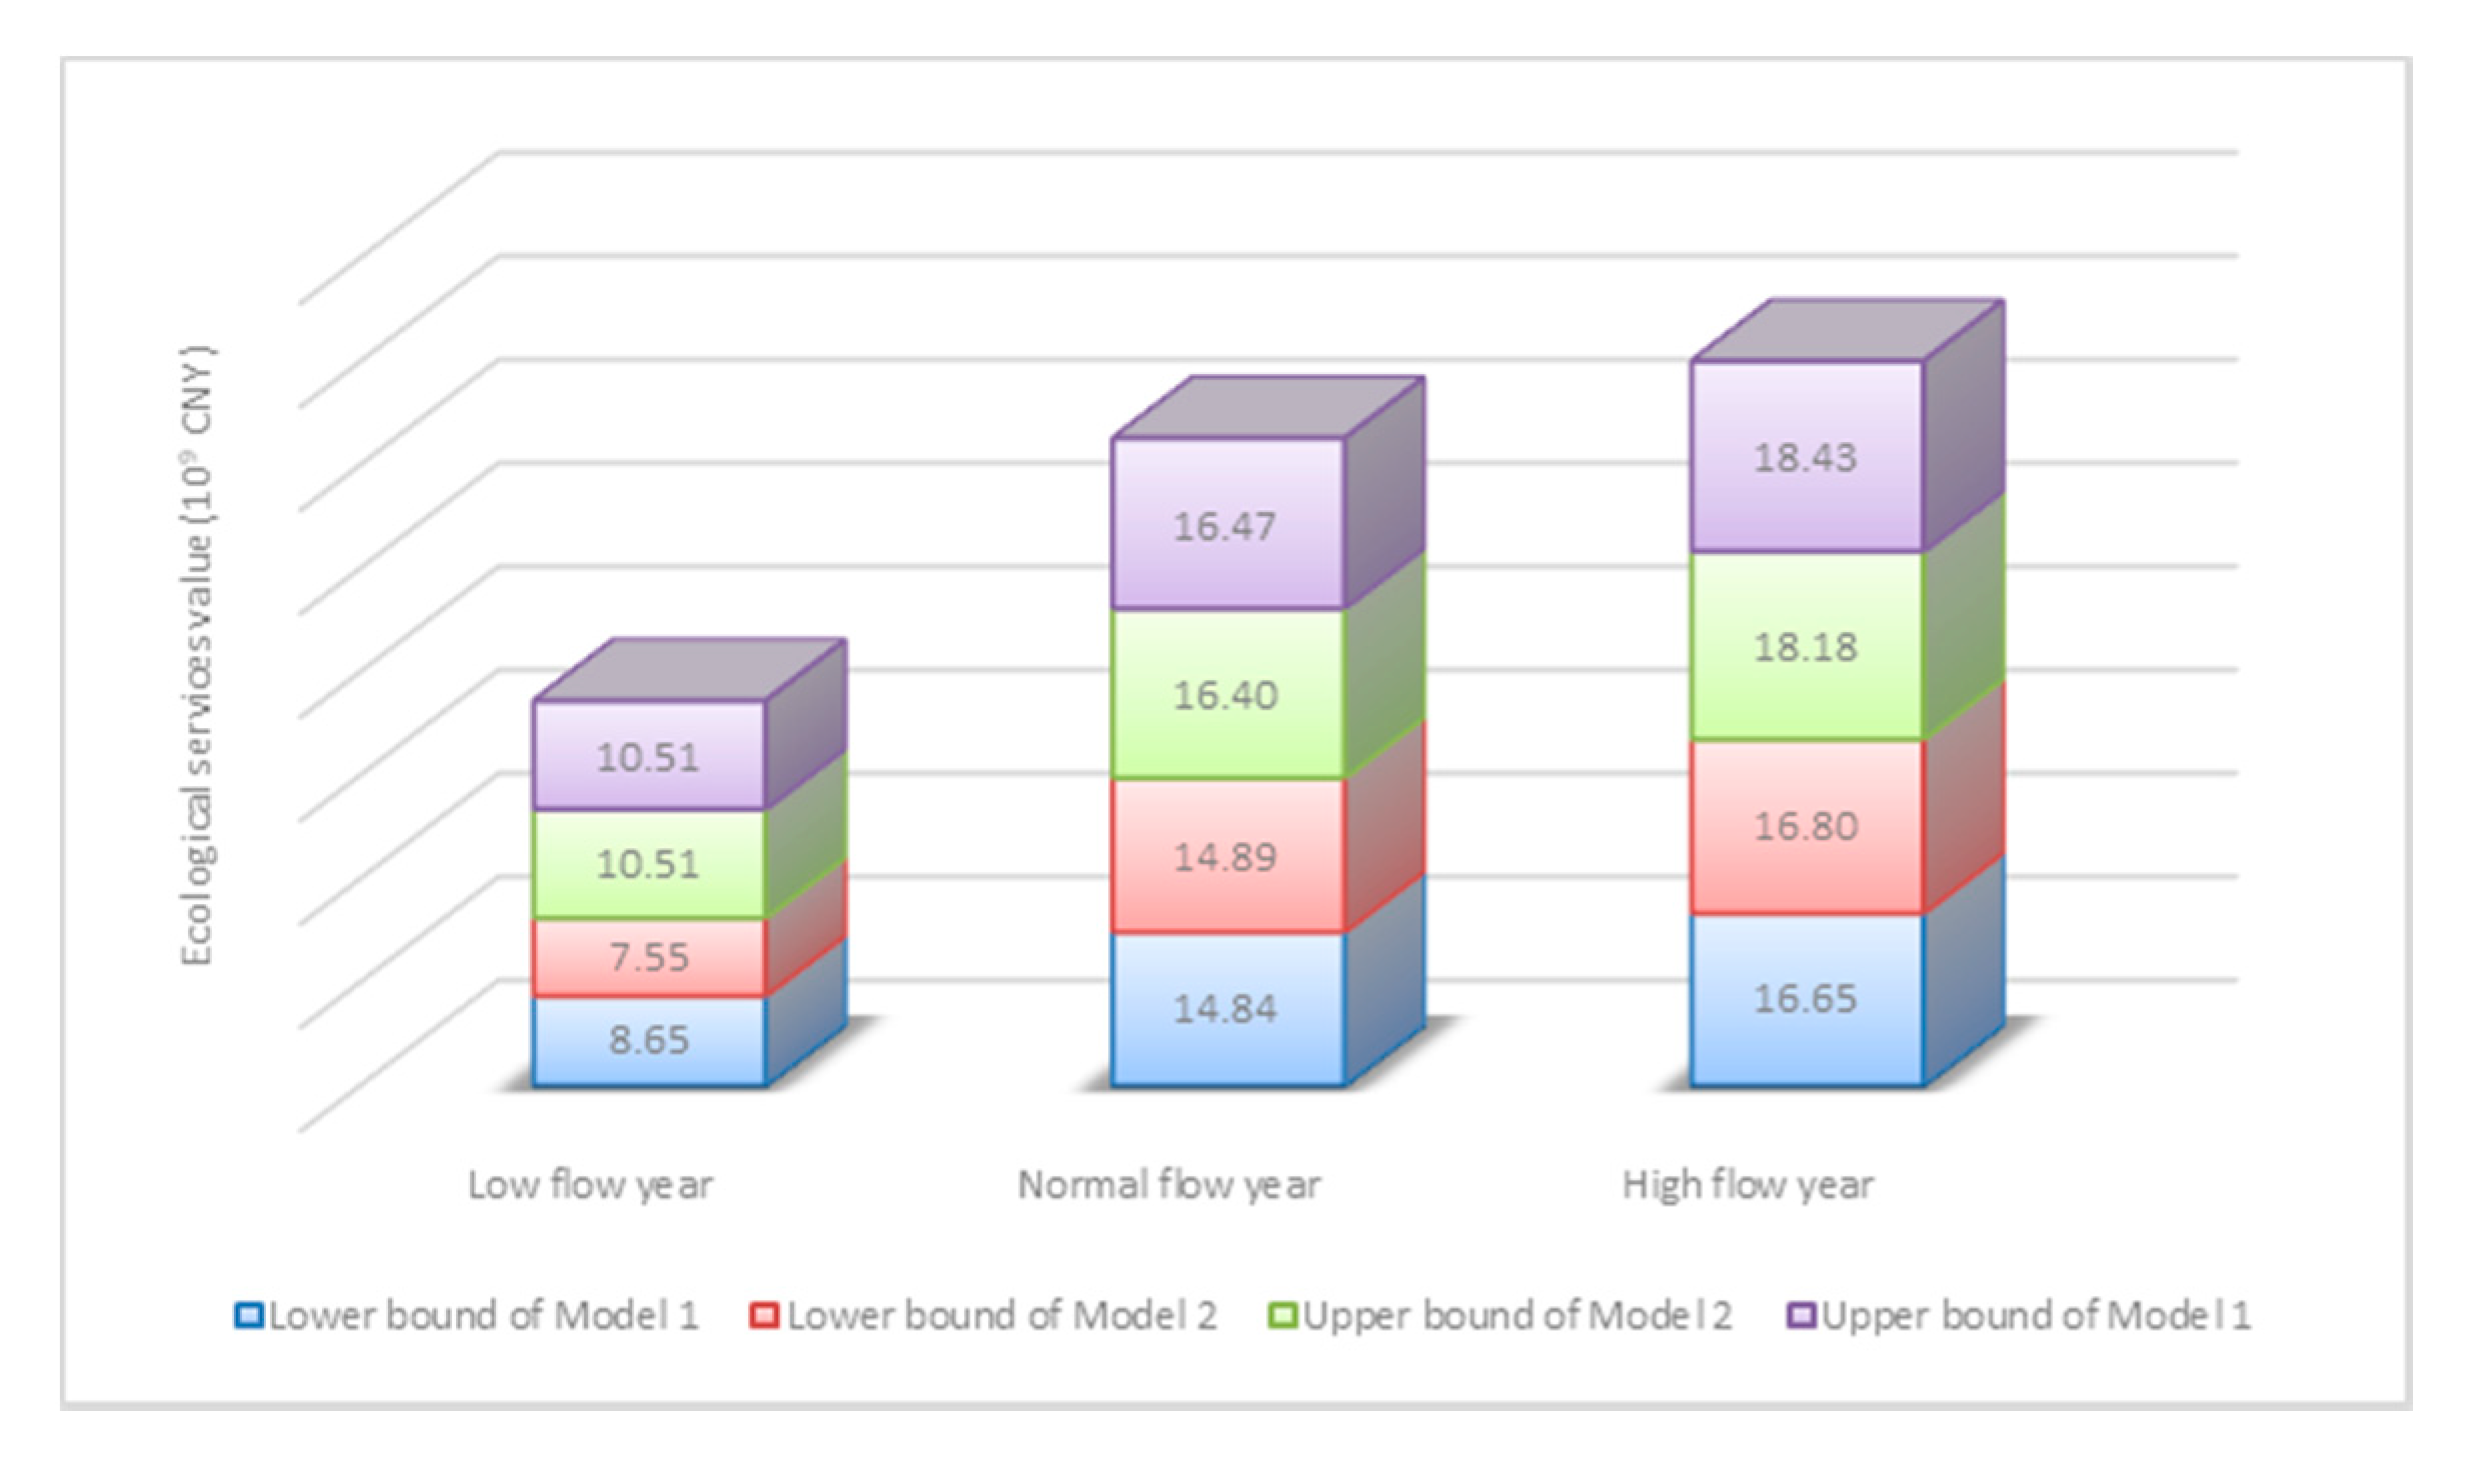
4.3. Results of the Optimization of the Ecological Service Value Based on the IFDCP
4.4. Comparison Results of the IDCP and IFDCP
4.5. Comparison Results of Multiple Models Based on the Optimization of the Ecological Service Value
5. Discussion
5.1. Analysis of the Restored Area of Wetlands, Lakes, and Ponds Based on the IFDCP
5.2. Analysis of the Optimization of Water Diversion and Supplement Based on the IFDCP
5.3. Analysis of the Optimization of the Ecological Service Value Based on the IFDCP
5.4. Comparison Analysis of the IDCP and IFDCP
5.5. Comparison Analysis of Multiple Models Based on the Optimization of the Ecological Service Value
6. Conclusions
Author Contributions
Funding
Acknowledgments
Conflicts of Interest
References
- Zhang, L.; Hou, G.L.; Zhang, G.X.; Liu, Z.L.; Sun, G.Z.; Li, M.N. Calculation of Wetlands Ecological Water Requirement in China’s Western Jilin Province Based on Regionalization and Gradation Techniques. Appl. Ecol. Environ. Res. 2015, 14, 463–478. [Google Scholar] [CrossRef]
- Zhang, J.Z.; Yu, Z.Q.; Yu, T.F.; Si, J.H.; Feng, Q.; Cao, S.X. Transforming flash floods into resources in arid China. Land Use Policy 2018, 76, 746–753. [Google Scholar] [CrossRef]
- Hao, C.L.; Yan, D.H.; Qin, T.L.; Zhang, C.; Yin, J. Water Ecosystem Services and Their Value-a Case Study in Luan River Basin, North China. Appl. Mech. Mater. 2014, 448, 225–234. [Google Scholar] [CrossRef]
- Zedler, J.B.; Kercher, S. Wetland resources: Status, trends, ecosystem services, and restorability. Annu. Rev. Environ. Resour. 2005, 30, 39–74. [Google Scholar] [CrossRef]
- Li, T.; Gao, X. Ecosystem Services Valuation of Lakeside Wetland Park beside Chaohu Lake in China. Water 2016, 8, 301. [Google Scholar] [CrossRef]
- Wu, G.; Tan, L.B.; Yan, Y.; Tian, Y.; Shen, Y.; Cao, H.M.; Dong, M.T. Measures and planning for wetland restoration of Xianghe Segment of China’s Grand Canal. Int. J. Sust. Dev. World Ecol. 2016, 23, 326–332. [Google Scholar] [CrossRef]
- Zhang, L.; Wang, M.H.; Hu, J.; Ho, Y.S. A review of published wetland research, 1991–2008: Ecological engineering and ecosystem restoration. Ecol. Eng. 2010, 36, 973–980. [Google Scholar] [CrossRef]
- Zhang, L.; Hou, G.L.; Li, F.P. Dynamics of landscape pattern and connectivity of wetlands in western Jilin Province, China. Environ. Dev. Sustain. 2020, 22, 2517–2528. [Google Scholar] [CrossRef]
- Cai, B.F.; Wang, X.E.; Li, Y. Application of a Double-Sided Chance-Constrained Integer Linear Program for Optimization of the Incremental Value of Ecosystem Services in Jilin Province, China. Water 2017, 9, 629. [Google Scholar] [CrossRef]
- Cai, B.F. Research on the Optimization Model of Ecosystem Service Value of River-lake Connectivity Project in Western Jilin Province. Ph.D. Thesis, Jilin University, Changchun, China, 2019. [Google Scholar]
- Cai, B.F.; Meng, C.; Wang, X.E.; Li, Y. Application of a Fuzzy Two-Stage Chance Constrained Stochastic Programming Model for Optimization of the Ecological Services Value of the Interconnected River System Network Project in the Western Jilin Province, China. Water 2019, 11, 68. [Google Scholar] [CrossRef]
- Liu, B.D.; Iwamura, K. Fuzzy programming with fuzzy decisions and fuzzy simulation-based genetic algorithm. Fuzzy Sets Syst. 2001, 122, 253–262. [Google Scholar] [CrossRef]
- Qu, G.L.; Tan, S.K.; Zhou, M.; Lu, S.S.; Tao, Y.H.; Zhang, Z.; Zhang, L.; Yan, D.P.; Guan, X.L.; Wu, G. An interval chance-constrained fuzzy modeling approach for supporting land-use planning and eco-environment planning at a watershed level. J. Environ. Manag. 2017, 204, 651–666. [Google Scholar]
- Zhang, C.L.; Engel, B.A.; Guo, P. An Interval-based Fuzzy Chance-constrained Irrigation Water Allocation model with double-sided fuzziness. Agric. Water Manag. 2018, 210, 22–31. [Google Scholar] [CrossRef]
- Cheng, H.C.; Li, Y.P.; Sun, J. Interval Double-Sided Fuzzy Chance-Constrained Programming Model for Water Resources Allocation. Environ. Eng. Sci. 2018, 35, 525–544. [Google Scholar] [CrossRef]
- Li, X.W.; Yu, X.B.; Jiang, L.G.; Li, W.Y.; Li, W.Y.; Liu, Y.; Hou, X.Y. How important are the wetlands in the middle-lower Yangtze River region: An ecosystem service valuation approach? Ecosyst. Serv. 2014, 10, 54–60. [Google Scholar] [CrossRef]
- Yang, W.; Zhang, L.P.; Zhang, Y.J.; Li, Z.L.; Xiao, Y.; Xia, J. Developing a comprehensive evaluation method for Interconnected River System Network assessment: A case study in Tangxun Lake group. J. Geogr. Sci. 2019, 29, 389–405. [Google Scholar] [CrossRef]
- Uluocha, N.O.; Okeke, I.C. Implications of wetlands degradation for water resources management: Lessons from Nigeria. GeoJournal 2004, 61, 151–154. [Google Scholar] [CrossRef]
- Sun, Z.; Wen, J.Y.; Hu, Y.; Li, Z.; Li, Y.; Pang, T.Y. Interval Fuzzy Linear Programming for Total Amount Control and Emissions Trading of Regional Atmospheric Pollutants. In Proceedings of the International Conference on Remote Sensing, Environment and Transportation Engineering, Nanjing, Jiangsu, China, 1–3 June 2012. [Google Scholar]


| Region | Fishpond Area (104 ha) | Crab Pond Area (104 ha) | ||||||
|---|---|---|---|---|---|---|---|---|
| Initial Planned Scheme | Low Flow Year | Normal Flow Year | High Flow Year | Initial Planned Scheme | Low Flow Year | Normal Flow Year | High Flow Year | |
| 1 | 0.75 | 0.75–0.75 | 0.76–0.78 | 0.8–0.93 | 0.28 | 0.28–0.37 | 0.29–0.37 | 0.38–0.37 |
| 2 | 3.45 | 3.2–3.47 | 3.43–3.47 | 3.44–3.72 | 0.02 | 0.02–0.02 | 0.02–0.03 | 0.03–0.03 |
| 3 | 0.17 | 0.17–0.17 | 0.24–0.22 | 0.24–0.23 | 0.18 | 0.18–0.18 | 0.25–0.24 | 0.25–0.24 |
| 4 | 0.15 | 0.09–0.11 | 0.15–0.16 | 0.18–0.19 | 0 | 0–0 | 0–0 | 0–0 |
| 5 | 0 | 0–0 | 0–0 | 0–0 | 0 | 0–0 | 0–0 | 0–0 |
| 6 | 0 | 0–0 | 0–0 | 0–0 | 0 | 0–0 | 0–0 | 0–0 |
| 7 | 0.03 | 0.03–0.03 | 0.03–0.03 | 0.03–0.03 | 0.01 | 0.01–0.01 | 0.01–0.01 | 0.01–0.01 |
| 8 | 0.84 | 0.42–0.53 | 0.83–0.84 | 1.02–1.09 | 0.14 | 0.07–0.09 | 0.13–0.17 | 0.18–0.18 |
| 9 | 0.91 | 0.21–0.9 | 0.9–0.91 | 1.01–1.11 | 0.02 | 0.02–0.02 | 0.02–0.02 | 0.03–0.03 |
| 10 | 1.19 | 0.45–0.93 | 1.19–1.2 | 1.34–1.42 | 0.02 | 0.02–0.02 | 0.02–0.02 | 0.03–0.03 |
| 11 | 0 | 0–0 | 0–0 | 0–0 | 0 | 0–0 | 0–0 | 0–0 |
| 12 | 0.36 | 0–0.36 | 0.36–0.36 | 0.36–0.36 | 1.27 | 1.21–1.25 | 1.26–1.27 | 1.26–1.32 |
| 13 | 0 | 0–0 | 0–0 | 0–0 | 0.06 | 0.06–0.06 | 0.06–0.06 | 0.06–0.07 |
| 14 | 0.14 | 0–0.14 | 0.14–0.14 | 0.14–0.14 | 0.36 | 0.32–0.37 | 0.36–0.36 | 0.38–0.44 |
| 15 | 0.15 | 0–0.13 | 0.15–0.15 | 0.17–0.18 | 0.02 | 0.01–0.01 | 0.02–0.02 | 0.02–0.02 |
| Total | 8.15 | 5.3–7.53 | 8.19–8.26 | 8.71–9.39 | 2.38 | 2.2–2.41 | 2.44–2.56 | 2.64–2.73 |
| Region | Reed Wetland (104 ha) | Marsh wetland (104 ha) | ||||||
|---|---|---|---|---|---|---|---|---|
| Initial Planned Scheme | Low Flow Year | Normal Flow Year | High Flow Year | Initial Planned Scheme | Low Flow Year | Normal Flow Year | High Flow Year | |
| 1 | 0.41 | 0.19–0.29 | 0.41–0.42 | 0.41–0.42 | 0.31 | 0.29–0.28 | 0.39–0.37 | 0.38–0.37 |
| 2 | 0.91 | 0.34–0.43 | 0.9–1.04 | 1.15–1.14 | 0.13 | 0.07–0.07 | 0.15–0.15 | 0.16–0.15 |
| 3 | 0.15 | 0.07–0.15 | 0.2–0.19 | 0.2–0.19 | 0.28 | 0.11–0.17 | 0.35–0.34 | 0.35–0.34 |
| 4 | 0.02 | 0–0 | 0.02–0.02 | 0.02–0.02 | 0 | 0–0 | 0–0 | 0–0 |
| 5 | 0 | 0–0 | 0–0 | 0–0 | 0.19 | 0.11–0.11 | 0.19–0.2 | 0.21–0.22 |
| 6 | 0.13 | 0.13–0.13 | 0.13–0.13 | 0.15–0.16 | 0.51 | 0.12–0.22 | 0.53–0.54 | 0.64–0.61 |
| 7 | 0.16 | 0–0.16 | 0.16–0.17 | 0.17–0.19 | 0.01 | 0–0 | 0.02–0.02 | 0.02–0.02 |
| 8 | 0.1 | 0–0 | 0.1–0.12 | 0.13–0.12 | 0.2 | 0.02–0 | 0.21–0.24 | 0.25–0.24 |
| 9 | 0.27 | 0–0 | 0.27–0.27 | 0.35–0.33 | 0.34 | 0–0 | 0.36–0.41 | 0.43–0.41 |
| 10 | 0.07 | 0–0 | 0.07–0.09 | 0.1–0.09 | 0.25 | 0–0 | 0.25–0.29 | 0.31–0.3 |
| 11 | 0.11 | 0.07–0.1 | 0.11–0.11 | 0.13–0.13 | 0.1 | 0.01–0 | 0.11–0.12 | 0.13–0.12 |
| 12 | 1.15 | 1.18–1.16 | 1.14–1.16 | 1.14–1.44 | 3.41 | 0.87–1.63 | 3.44–3.69 | 4.25–4.1 |
| 13 | 0.07 | 0.01–0.04 | 0.07–0.07 | 0.09–0.09 | 0.04 | 0–0 | 0.04–0.04 | 0.05–0.04 |
| 14 | 0.14 | 0–0.03 | 0.14–0.14 | 0.19–0.18 | 0.31 | 0.07–0.07 | 0.31–0.35 | 0.39–0.37 |
| 15 | 0.04 | 0–0 | 0.04–0.05 | 0.06–0.05 | 0 | 0–0 | 0–0 | 0–0 |
| Total | 3.72 | 1.99–2.5 | 3.77–4 | 4.28–4.56 | 6.07 | 1.68–2.53 | 6.36–6.77 | 7.57–7.3 |
| Functional Area | Ecological Services Value of Low Flow Year (106 CNY) | Ecological Services Value of Normal Flow Year (106 CNY) | Ecological Services Value of High Flow Year (106 CNY) |
|---|---|---|---|
| Fishpond | 4129.5–2846.84 | 4529.46–4393.53 | 5149.19–4673.85 |
| Crab pond | 1611.27–1441.83 | 1709.07–1602.3 | 1826.34–1732.89 |
| Reed wetland | 2399.61–1825.86 | 3831.08–3469.49 | 4375.96–3939.36 |
| Marsh wetland | 2370.58–1431.11 | 6331.4–5419.87 | 6832.02–6457.17 |
| Lake and Pond | Fishpond Area (104 ha) | Crab Pond Area (104 ha) | Reed Wetland Area (104 ha) | Marsh Wetland Area (104 ha) | ||||||||
|---|---|---|---|---|---|---|---|---|---|---|---|---|
| Model 2 | Model 3 | Model 5 | Model 2 | Model 3 | Model 5 | Model 2 | Model 3 | Model 5 | Model 2 | Model 3 | Model 5 | |
| i = 1 | 0.04–0.03 | 0.04 | 0.02 | 0–0 | 0 | 0 | 0.08–0.08 | 0.08 | 0.09 | 0.03–0.03 | 0.03 | 0.02 |
| i = 2 | 0.72–0.74 | 0.66 | 0.86 | 0–0 | 0 | 0 | 0.27–0.27 | 0.27 | 0.35 | 0.17–0.16 | 0.17 | 0.18 |
| i = 3 | 0–0 | 0 | 0 | 0.01–0.01 | 0.01 | 0.01 | 0–0 | 0 | 0 | 0–0 | 0 | 0 |
| i = 4 | 0–0 | 0 | 0 | 0–0 | 0 | 0 | 0–0 | 0 | 0 | 0–0 | 0 | 0 |
| i = 5 | 0–0 | 0 | 0 | 0.07–0.09 | 0.10 | 0.08 | 0.03–0.03 | 0.03 | 0.02 | 0.08–0.08 | 0.08 | 0.09 |
| i = 6 | 0–0 | 0 | 0 | 0–0 | 0 | 0 | 0.01–0.01 | 0.01 | 0.01 | 0.04–0.04 | 0.04 | 0.04 |
| i = 7 | 0–0 | 0 | 0 | 0.2–0.26 | 0.25 | 0.23 | 0.03–0.03 | 0.03 | 0.02 | 0.06–0.06 | 0.06 | 0.07 |
| Total | 0.76–0.77 | 0.69 | 0.88 | 0.28–0.36 | 0.36 | 0.33 | 0.42–0.42 | 0.42 | 0.49 | 0.38–0.37 | 0.38 | 0.39 |
| Evaluation Indices | Ecological Services Value of Model 2 (106 CNY) | Ecological Services Value of Model 3 (106 CNY) | Ecological Services Value of Model 4 (106 CNY) | Ecological Services Value of Model 5 (106 CNY) |
|---|---|---|---|---|
| Fish | 1958.27–1989.00 | 1807.94 | 1956.00 | 1793.53 |
| Crab | 876.45–922.63 | 869.76 | 856.80 | 658.7 |
| Reed | 65.09–74.92 | 73.95 | 67.00 | 76.52 |
| Water supply | 1227.15–1265.85 | 1156.58 | 1515.98 | 1300.64 |
| Carbon sequestration | 25.90–37.35 | 28.95 | 26.12 | 30.62 |
| Oxygen release | 253.37–589.29 | 283.30 | 255.63 | 299.87 |
| Water storage and regulation | 1360.19–1699.62 | 1366.55 | 1546.01 | 1524.10 |
| Microclimatic modification | 2738.47–2938.84 | 2961.60 | 2683.25 | 3268.59 |
| Plant fixation | 2833.90–3027.17 | 3067.41 | 2747.03 | 3383.72 |
| Assimilative capacity | 1511.92–1622.56 | 1640.33 | 1469.00 | 1809.48 |
| Biodiversity | 403.16–437.04 | 407.25 | 445.26 | 453.40 |
| Scientific culture | 76.27–97.12 | 78.32 | 85.63 | 87.19 |
| Tourism development | 1136.33–1214.01 | 1159.09 | 1267.29 | 1290.46 |
| Urban landscape | 309.77–339.92 | 313.27 | 342.51 | 348.77 |
| Nature landscape | 108.96–145.68 | 125.31 | 137.00 | 139.51 |
| Total | 14,885.19–16401.01 | 15,339.59 | 15,400.51 | 16,465.10 |
© 2020 by the authors. Licensee MDPI, Basel, Switzerland. This article is an open access article distributed under the terms and conditions of the Creative Commons Attribution (CC BY) license (http://creativecommons.org/licenses/by/4.0/).
Share and Cite
Yang, L.; Cong, W.; Meng, C.; Cai, B.; Liu, M. An Interval Fuzzy, Double-Sided, Chance-Constrained Stochastic Programming Model for Planning the Ecological Service Value of Interconnected River Systems. Water 2020, 12, 2649. https://doi.org/10.3390/w12092649
Yang L, Cong W, Meng C, Cai B, Liu M. An Interval Fuzzy, Double-Sided, Chance-Constrained Stochastic Programming Model for Planning the Ecological Service Value of Interconnected River Systems. Water. 2020; 12(9):2649. https://doi.org/10.3390/w12092649
Chicago/Turabian StyleYang, Luze, Weiyi Cong, Chong Meng, Baofeng Cai, and Miao Liu. 2020. "An Interval Fuzzy, Double-Sided, Chance-Constrained Stochastic Programming Model for Planning the Ecological Service Value of Interconnected River Systems" Water 12, no. 9: 2649. https://doi.org/10.3390/w12092649
APA StyleYang, L., Cong, W., Meng, C., Cai, B., & Liu, M. (2020). An Interval Fuzzy, Double-Sided, Chance-Constrained Stochastic Programming Model for Planning the Ecological Service Value of Interconnected River Systems. Water, 12(9), 2649. https://doi.org/10.3390/w12092649