Did the COVID-19 Lockdown-Induced Hydrological Residence Time Intensify the Primary Productivity in Lakes? Observational Results Based on Satellite Remote Sensing

 ,
,  ,
,  ,
,  ,
, 
Abstract
1. Introduction
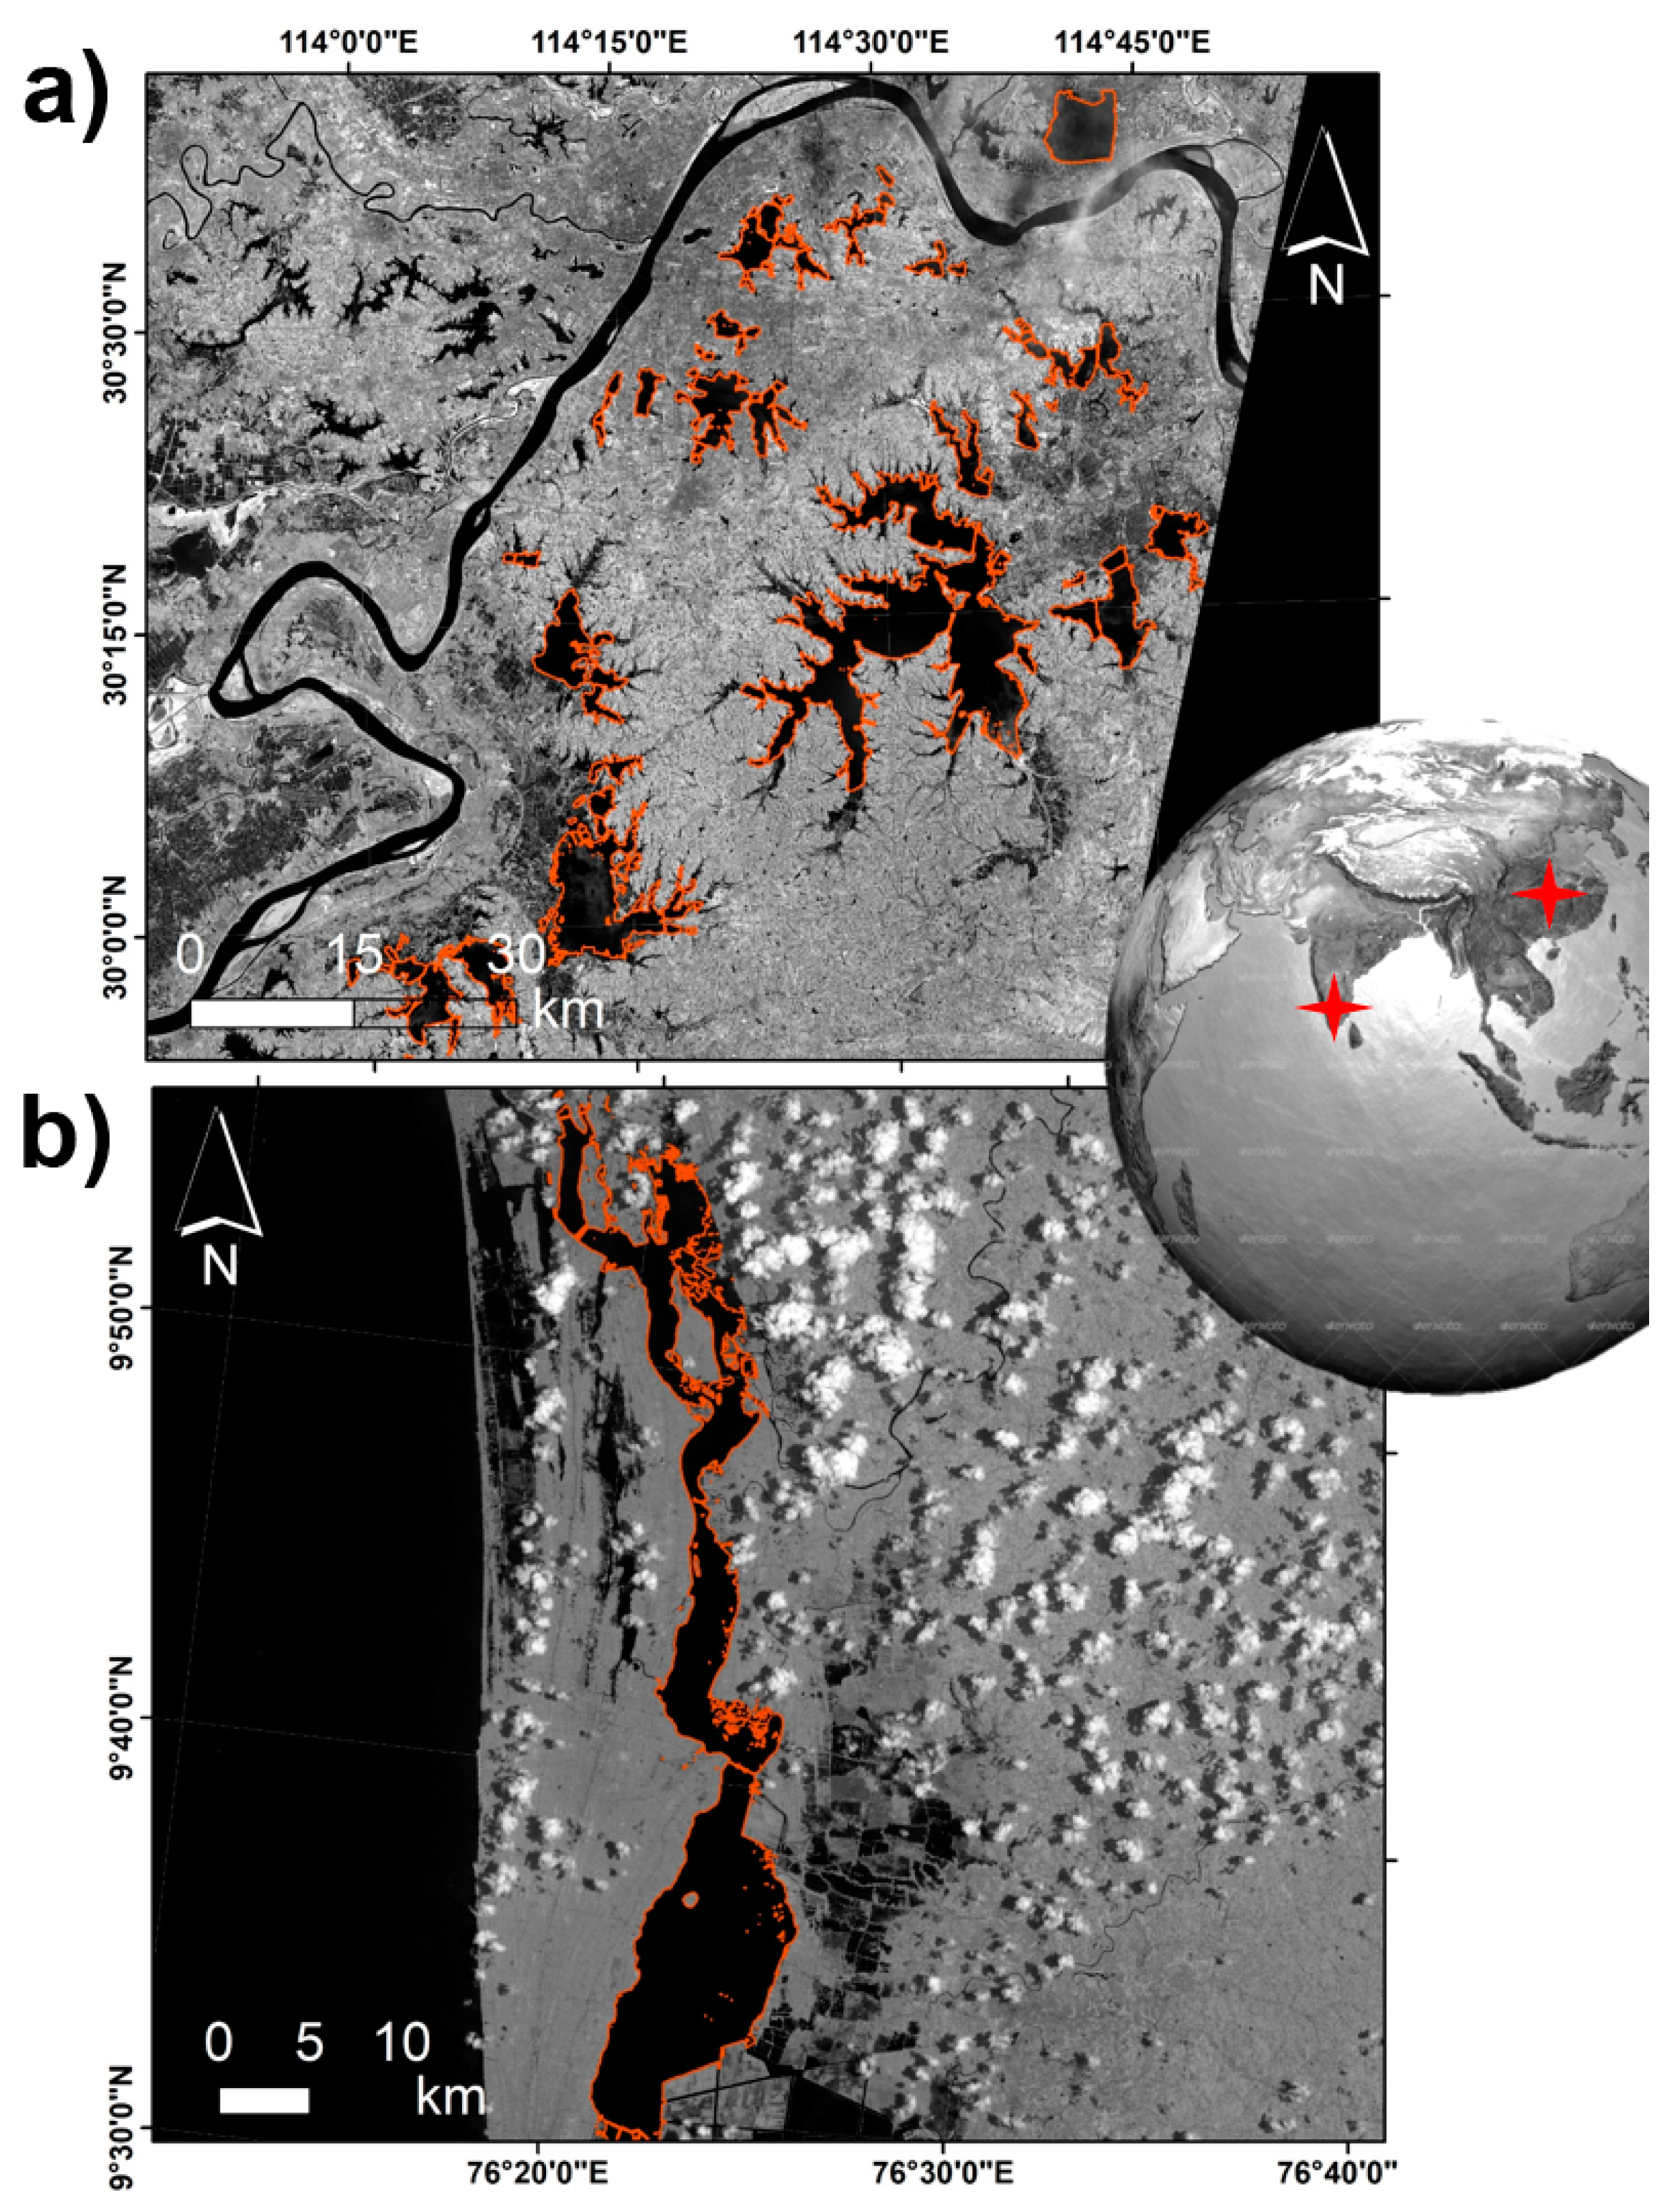
2. Study Area
3. Data and Methodology
3.1. Theoretical Framework
3.2. Image Acquisition and Data Processing
3.3. Chlorophyll-a Retrieval
4. Results and Discussion
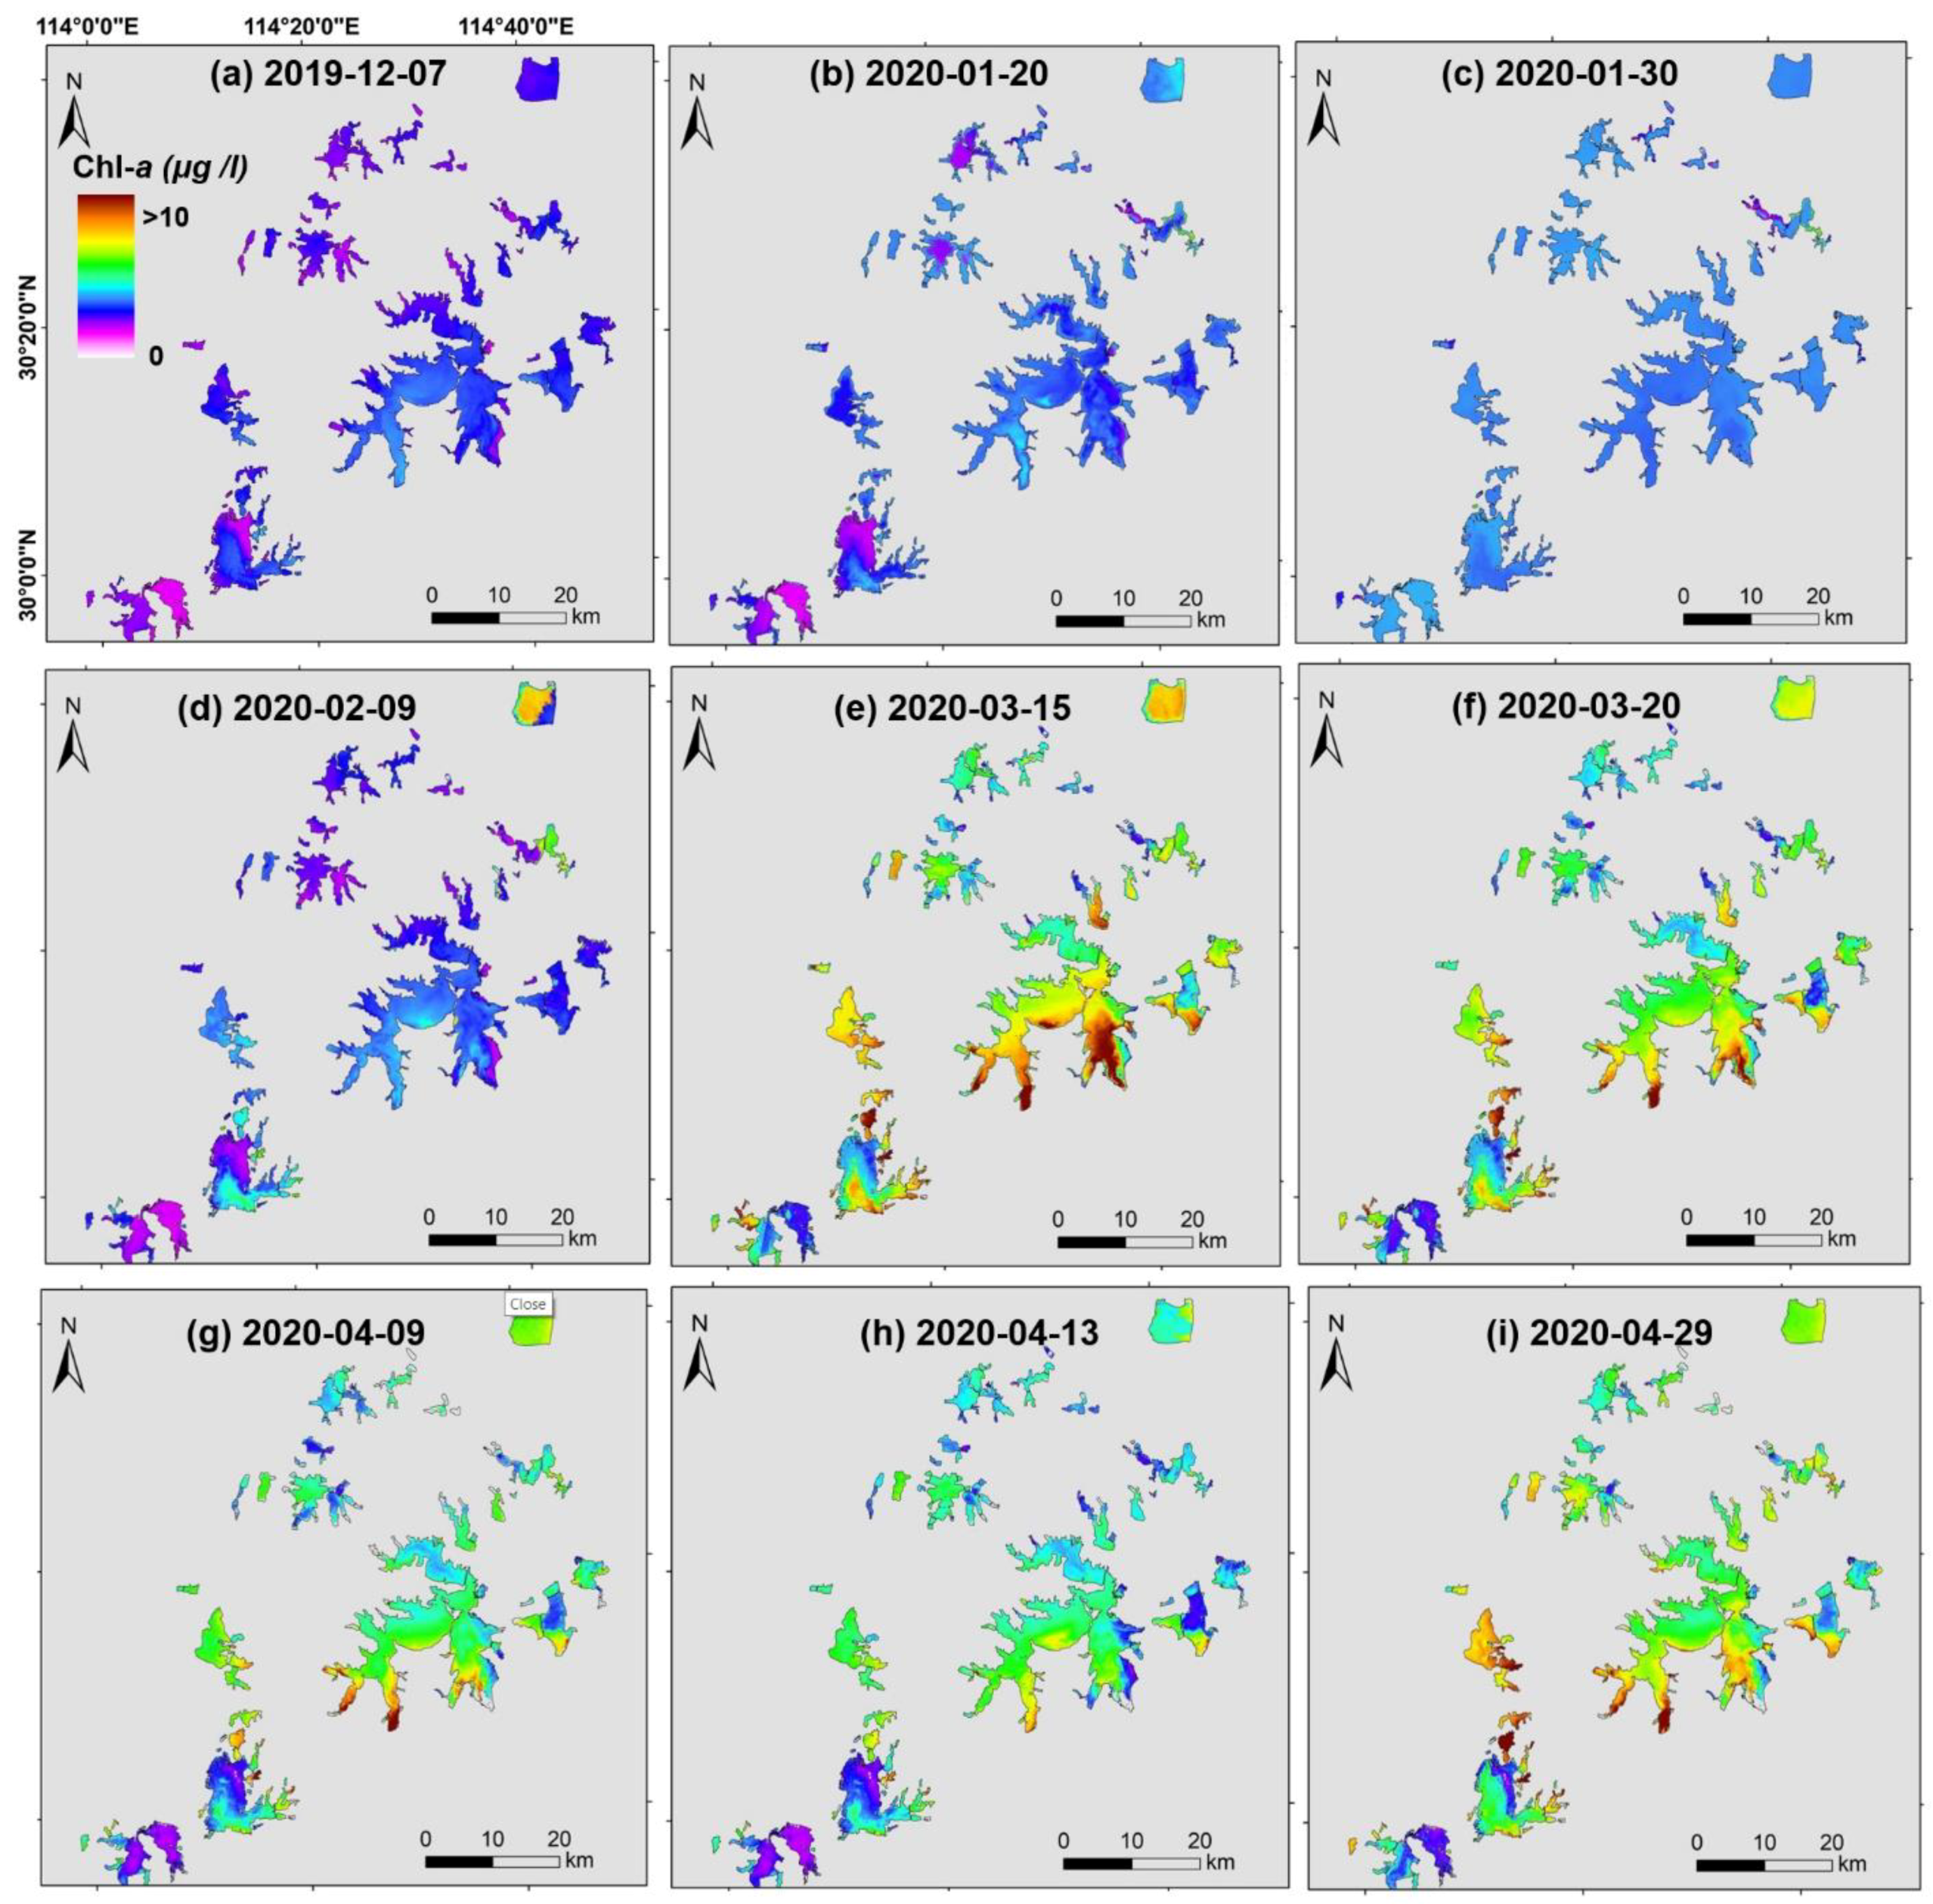
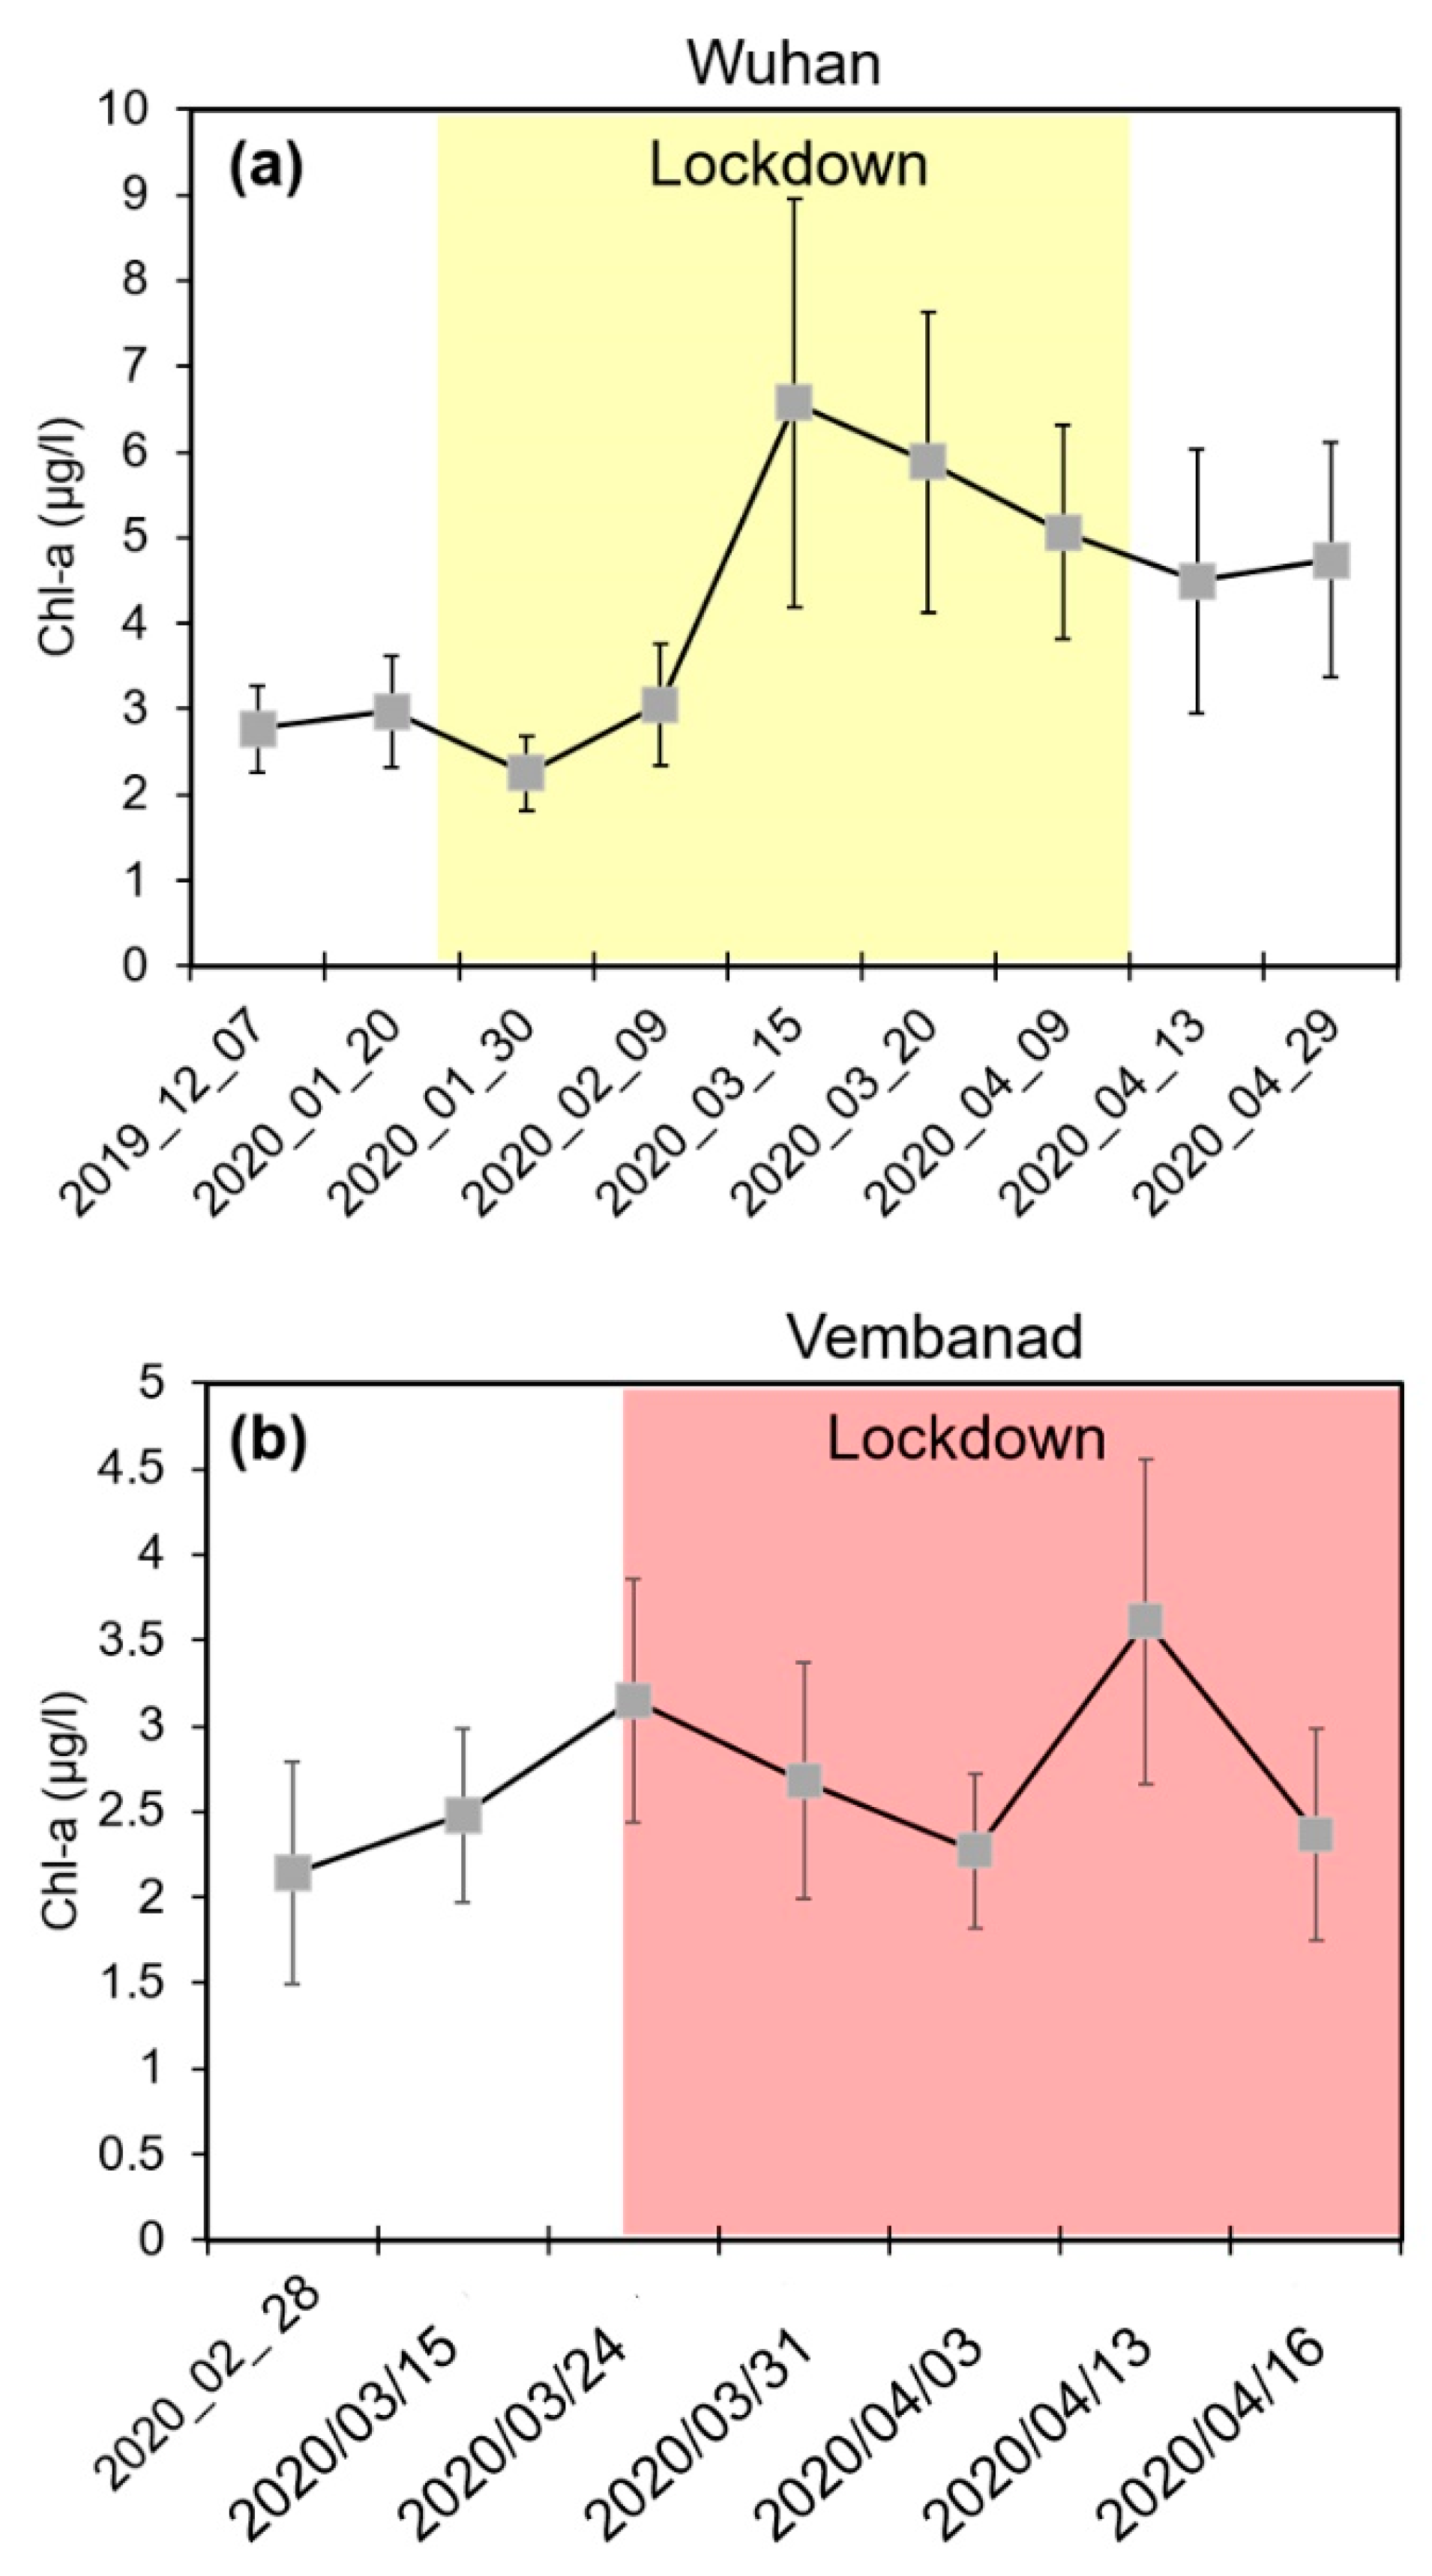
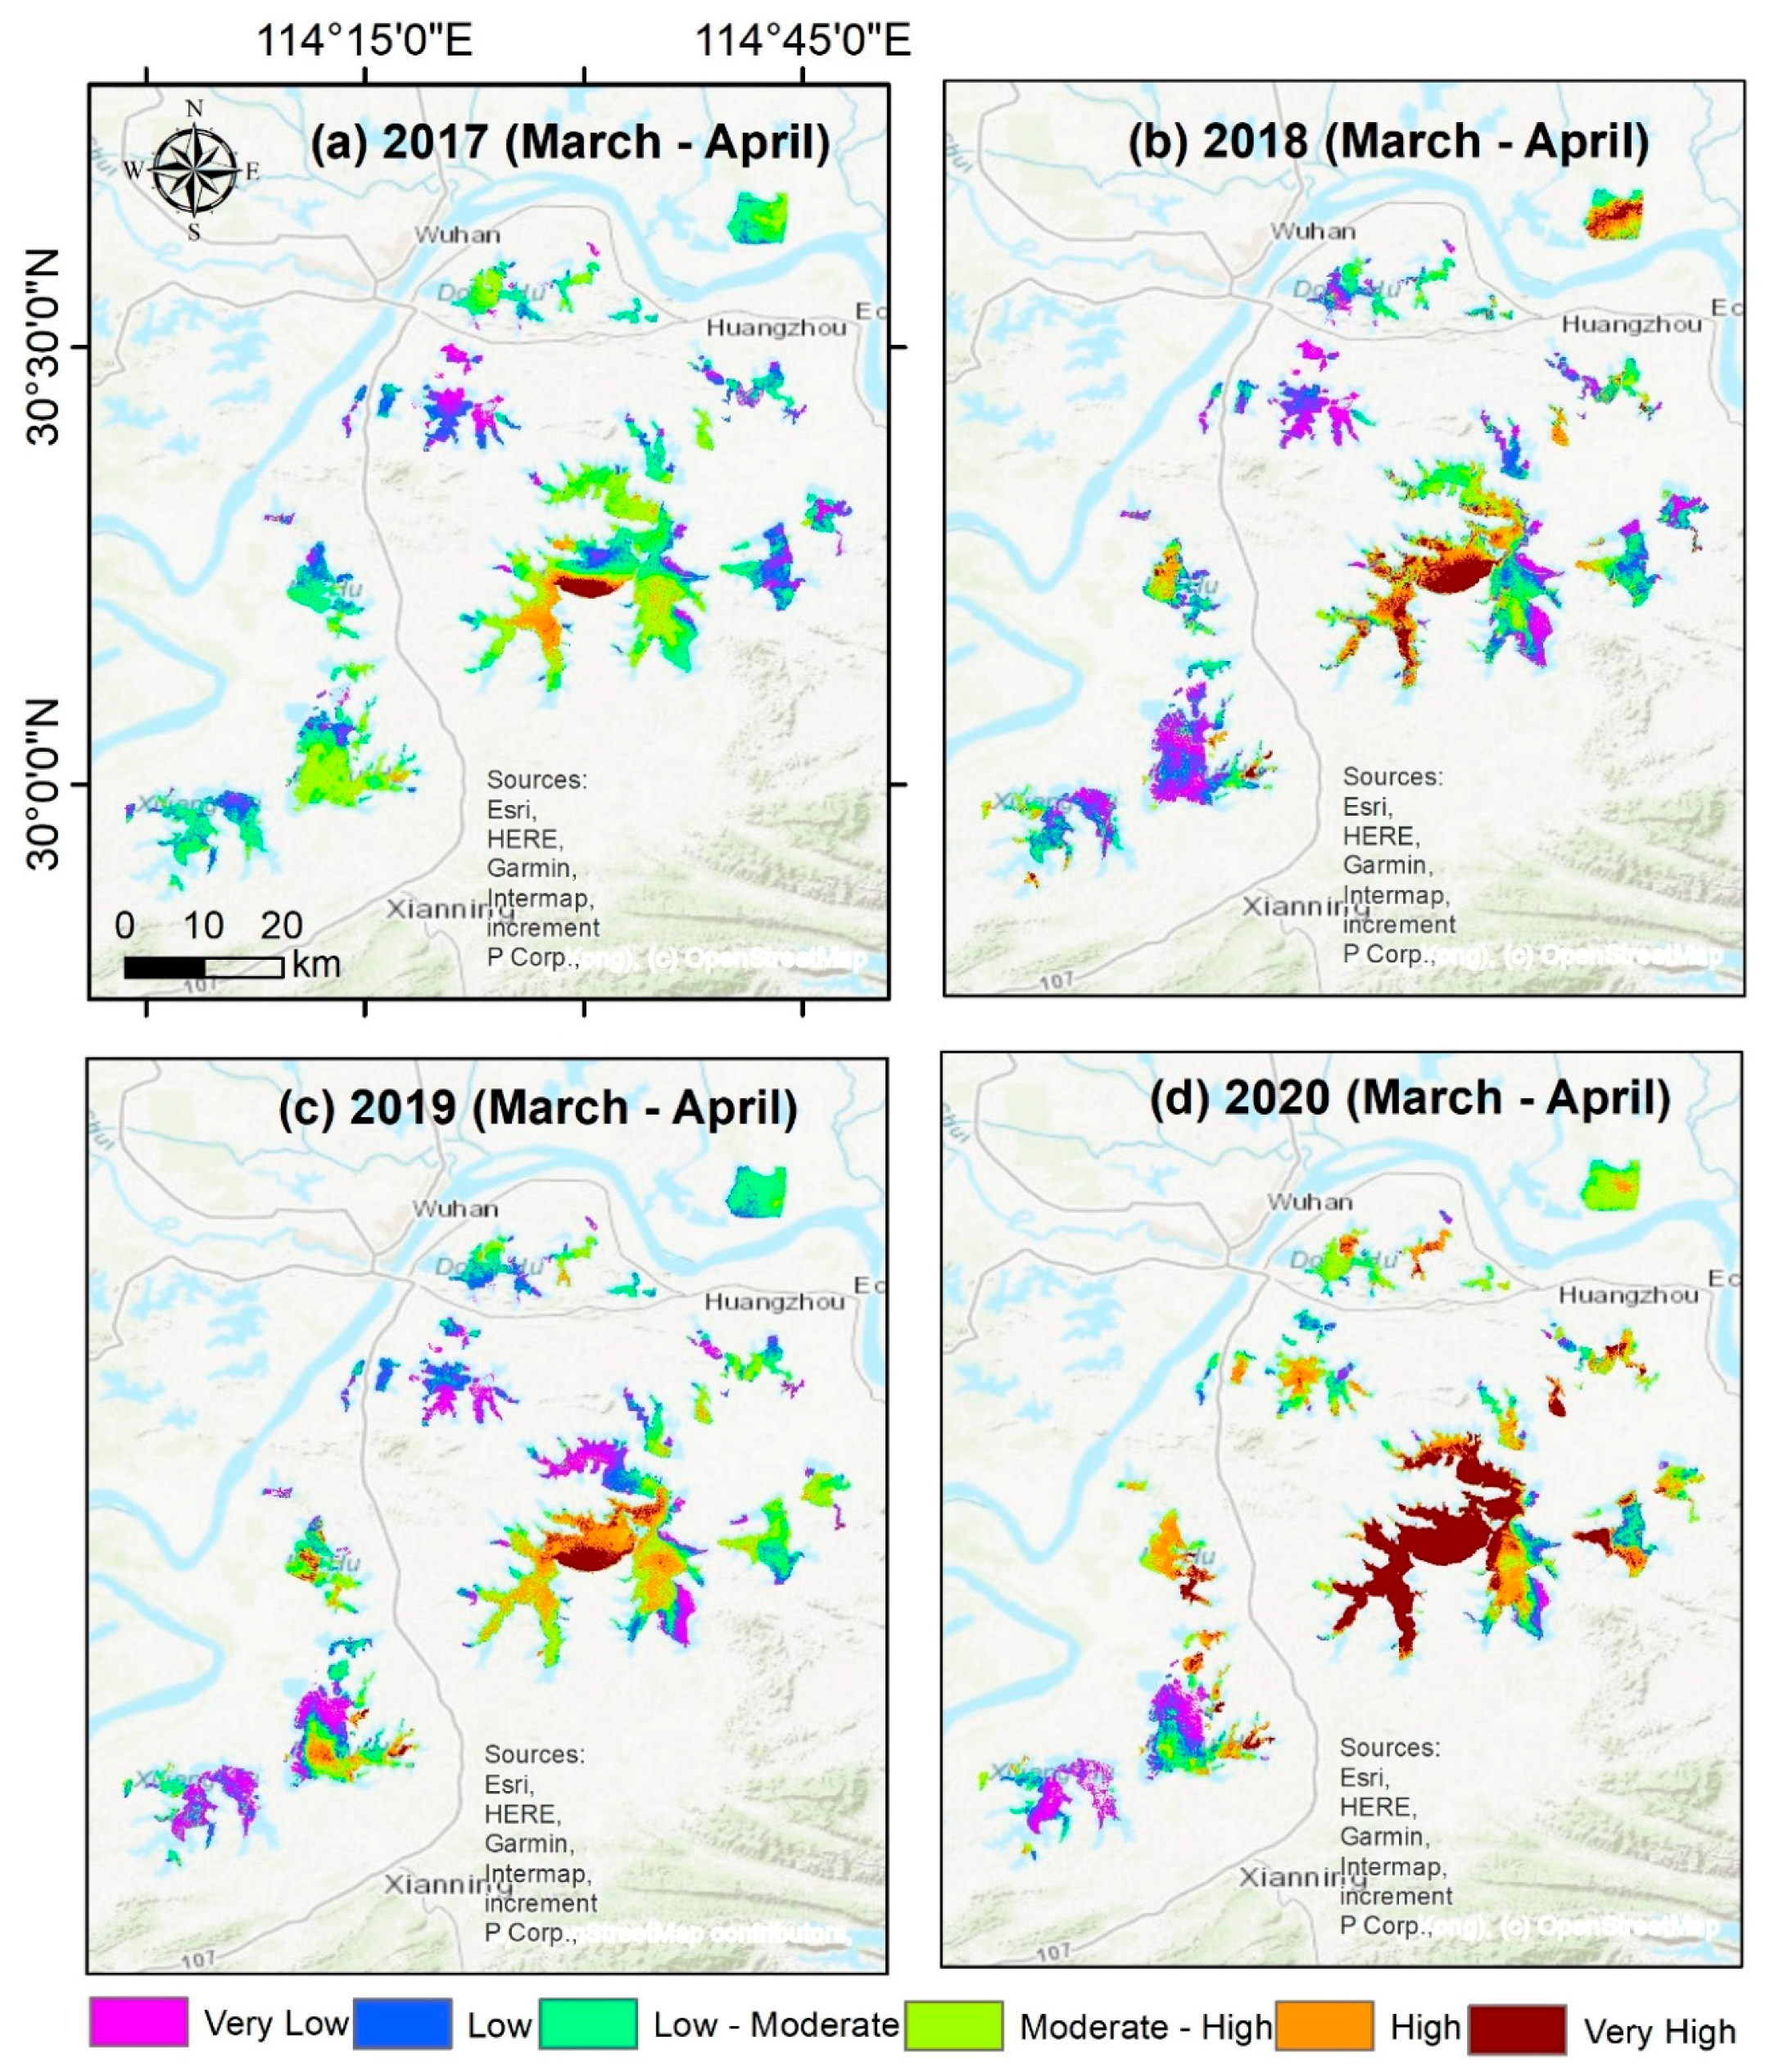
4.1. Lakes in Wuhan
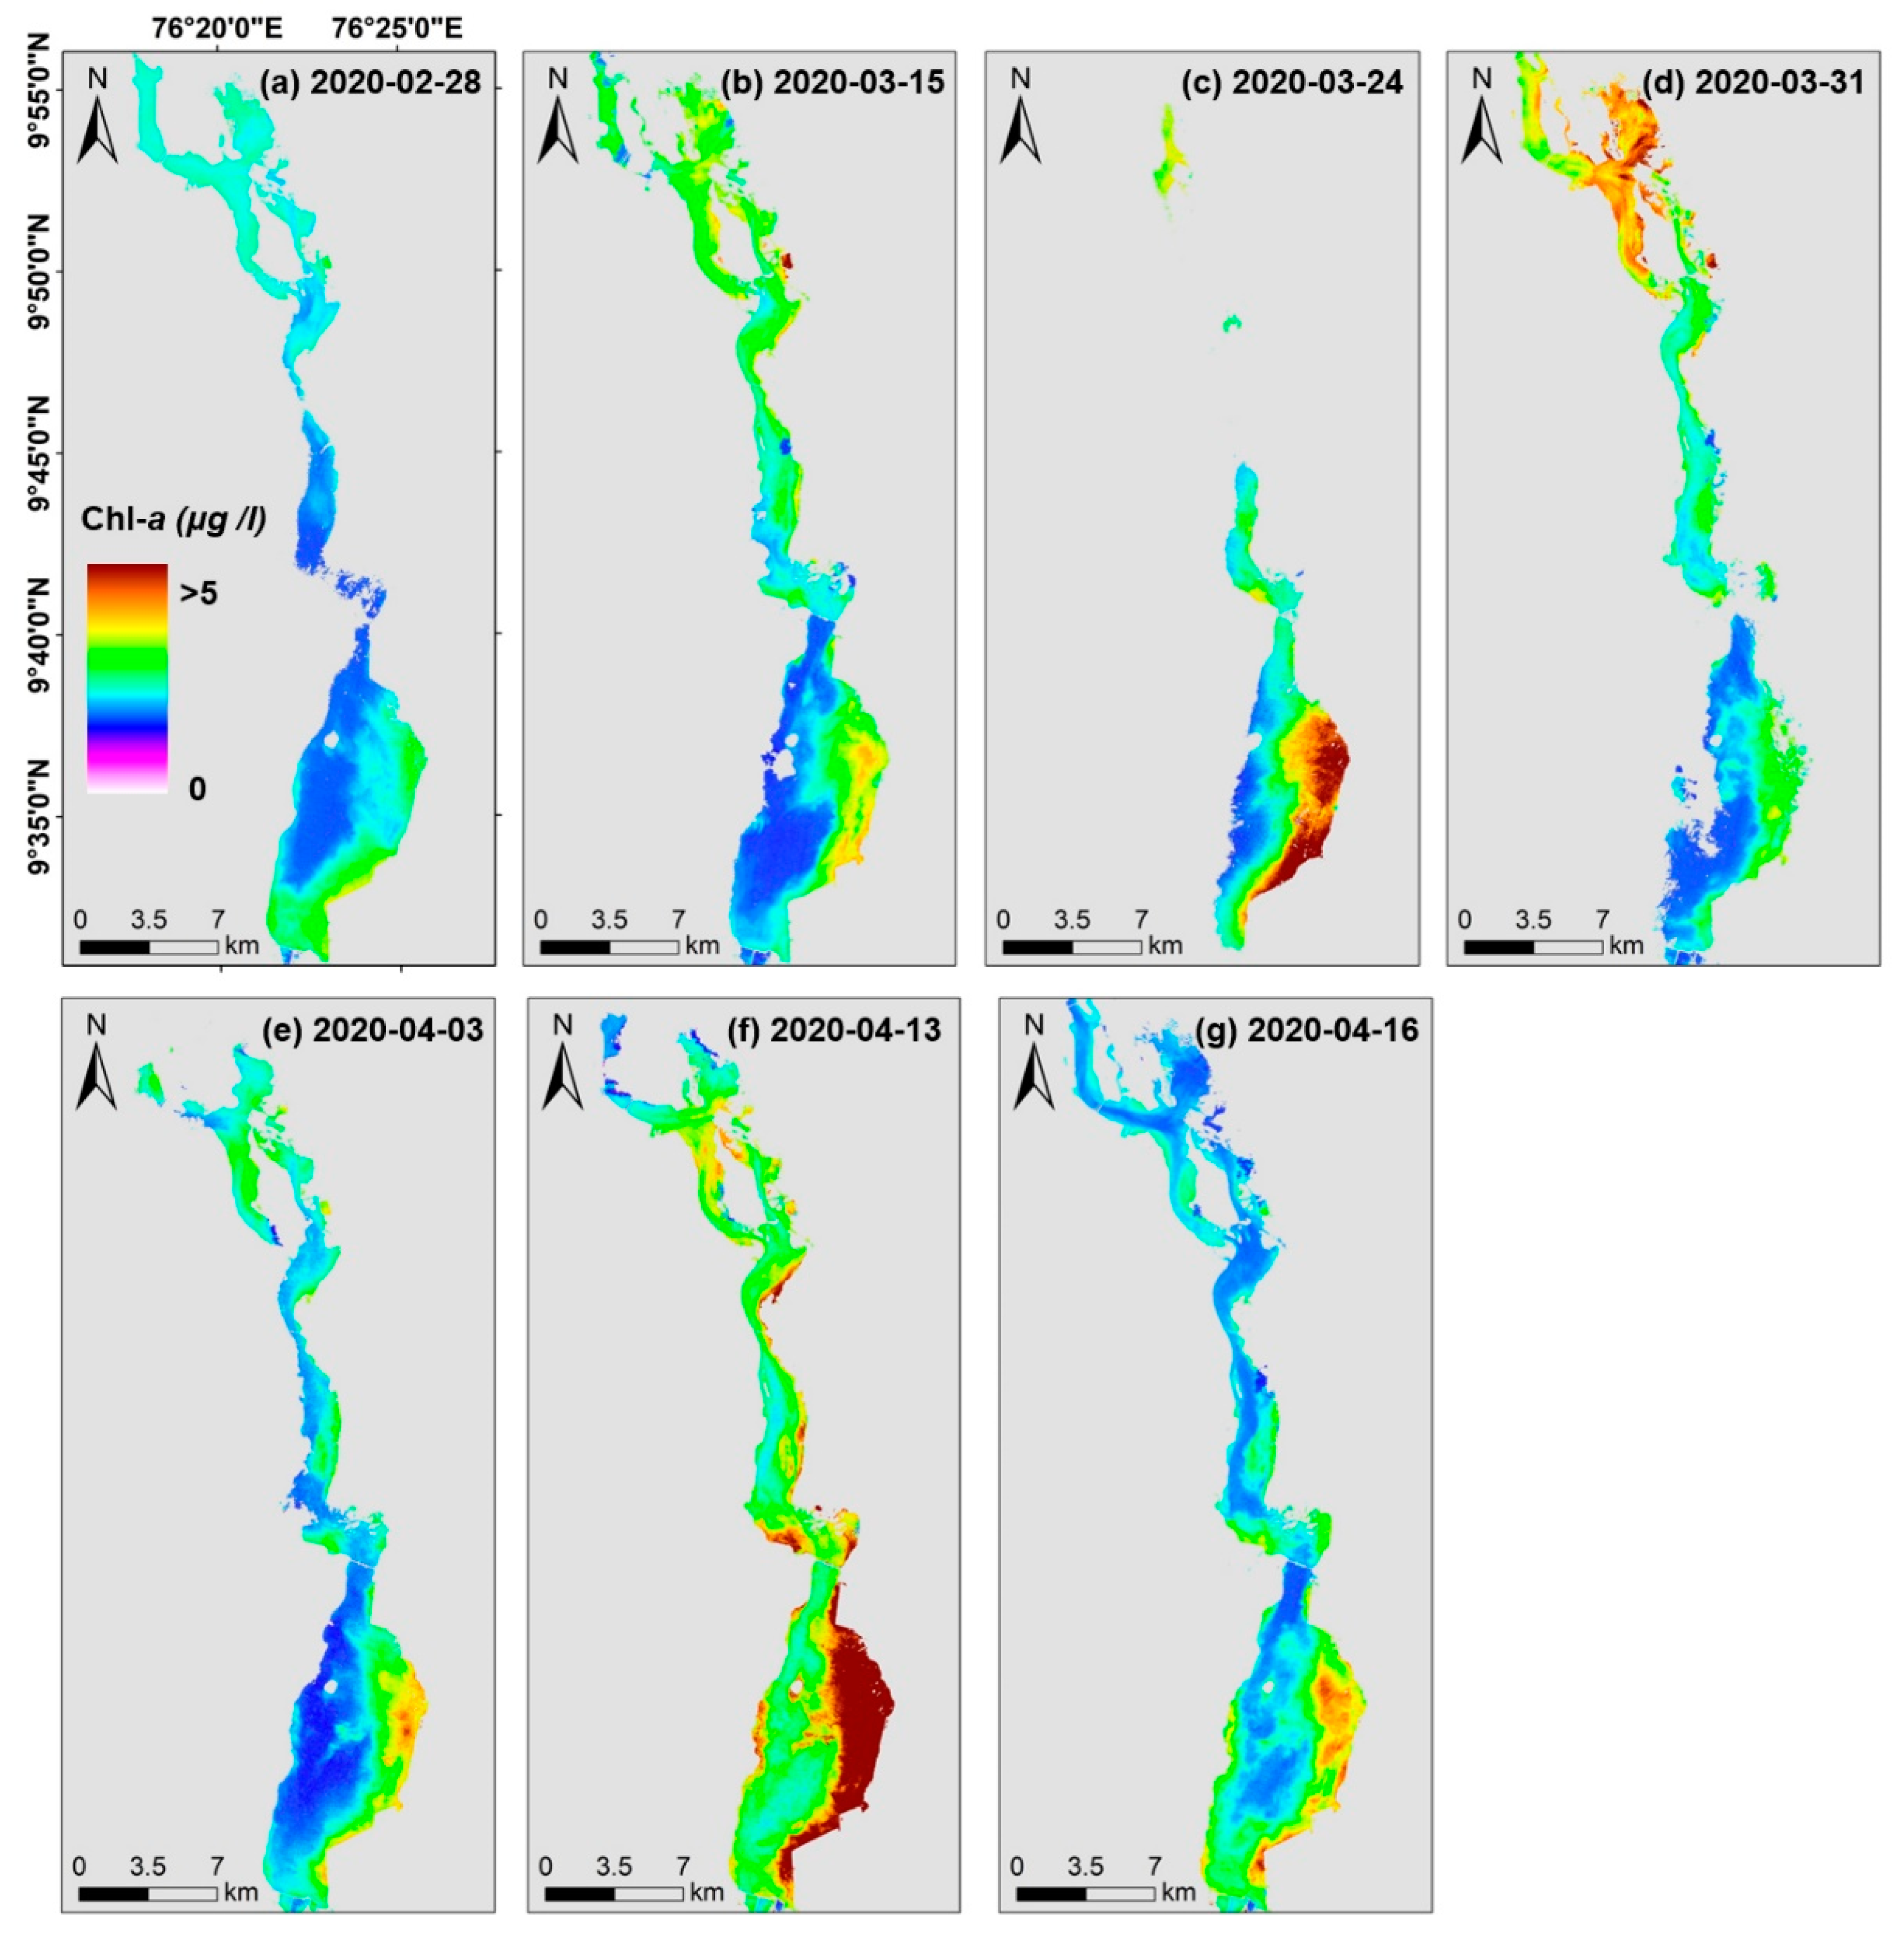
4.2. Vembanad Lake, India
4.3. Validation
5. Discussion and Concluding Remarks
Supplementary Materials
Author Contributions
Funding
Acknowledgments
Conflicts of Interest
References
- Leray, S.; Engdahl, N.B.; Massoudieh, A.; Bresciani, E.; McCallum, J. Residence time distributions for hydrologic systems: Mechanistic foundations and steady-state analytical solutions. J. Hydrol. 2016, 543, 67–87. [Google Scholar] [CrossRef]
- Baker, M.A.; Dahm, C.N.; Valett, H.M. Anoxia, anaerobic metabolism biogeochemistry of the stream water-ground water interface. In Streams and Ground Waters; Academic Press: San Diego, CA, USA, 2000; pp. 259–284. [Google Scholar]
- Neumann, R.B.; LaBolle, E.M.; Harvey, C.F. The Effects of Dual-Domain Mass Transfer on the Tritium-Helium-3 Dating Method. Environ. Sci. Technol. 2008, 42, 4837–4843. [Google Scholar] [CrossRef]
- Zwart, J.A.; Sebestyen, S.D.; Solomon, C.T.; Jones, S.E. The influence of hydrologic residence time on lake carbon cycling dynamics following extreme precipitation events. Ecosystems 2017, 20, 1000–1014. [Google Scholar] [CrossRef]
- Hein, T.; Baranyi, C.; Heiler, G.; Holarek, C.; Riedler, P.; Schiemer, F. Hydrology as a major factor determining plankton development in two floodplain segments and the River Danube, Austria. Large Rivers 1999, 11, 439–452. [Google Scholar] [CrossRef]
- León, J.G.; Beamud, S.G.; Temporetti, P.F.; Atencio, A.G.; Diaz, M.M.; Pedrozo, F.L. Stratification and residence time as factors controlling the seasonal variation and the vertical distribution of chlorophyll-a in a subtropical irrigation reservoir. Int. Rev. Hydrobiol. 2016, 101, 36–47. [Google Scholar] [CrossRef]
- Stumpner, E.B.; Bergamaschi, B.A.; Kraus, T.E.; Parker, A.E.; Wilkerson, F.P.; Downing, B.D.; Dugdale, R.C.; Murrell, M.C.; Carpenter, K.D.; Orlando, J.L.; et al. Spatial variability of phytoplankton in a shallow tidal freshwater system reveals complex controls on abundance and community structure. Sci. Total Environ. 2020, 700, 134392. [Google Scholar] [CrossRef] [PubMed]
- Worldometers. Coronavirus Updates. Available online: https://www.worldometers.info/ (accessed on 3 May 2020).
- ESA COVID-19: Nitrogen Dioxide over China. Available online: https://www.esa.int/Applications/Observing_the_Earth/Copernicus/Sentinel-5P/COVID-19_nitrogen_dioxide_over_China (accessed on 17 April 2020).
- Yunus, A.P.; Masago, Y.; Hijioka, Y. COVID-19 and surface water quality: Improved lake water quality during the lockdown. Sci. Total Environ. 2020, 731, 139012. [Google Scholar] [CrossRef]
- O’Reilly, J.E.; Maritorena, S.; Mitchell, B.G.; Siegel, D.A.; Carder, K.L.; Garver, S.A.; Kahru, M.; McClain, C. Ocean color chlorophyll algorithms for SeaWiFS. J. Geophys. Res. Oceans 1998, 103, 24937–24953. [Google Scholar] [CrossRef]
- Nukapothula, S.; Chen, C.; Yunus, A.P.; Wu, J. Satellite-based observations of intense chlorophyll-a bloom in response of cold core eddy formation: A study in the Arabian Sea, Southwest Coast of India. Reg. Stud. Mar. Sci. 2018, 24, 303–310. [Google Scholar] [CrossRef]
- Gao, K.; Xu, J.; Gao, G.; Li, Y.; Hutchins, D.A.; Huang, B.; Wang, L.; Zheng, Y.; Jin, P.; Cai, X.; et al. Rising CO2 and increased light exposure synergistically reduce marine primary productivity. Nat. Clim. Change 2012, 2, 519–523. [Google Scholar] [CrossRef]
- Hu, C.; Lee, Z.; Franz, B. Chlorophyll a algorithms for oligotrophic oceans: A novel approach based on three-band reflectance difference. J. Geophys. Res. Oceans 2012, 117. [Google Scholar] [CrossRef]
- Scofield, A.E.; Watkins, J.M.; Osantowski, E.; Rudstam, L.G. Deep chlorophyll maxima across a trophic state gradient: A case study in the Laurentian Great Lakes. Limnol. Oceanogr. 2020. [Google Scholar] [CrossRef]
- Castelao, R.M.; Mavor, T.P.; Barth, J.A.; Breaker, L.C. Sea surface temperature fronts in the California Current System from geostationary satellite observations. J. Geophys. Res. Oceans 2006, 111. [Google Scholar] [CrossRef]
- Atique, U.; An, K.-G. Landscape heterogeneity impacts water chemistry, nutrient regime, organic matter and chlorophyll dynamics in agricultural reservoirs. Ecol. Indic. 2020, 110, 105813. [Google Scholar] [CrossRef]
- Sruthy, S.; Ramasamy, E. Microplastic pollution in Vembanad Lake, Kerala, India: The first report of microplastics in lake and estuarine sediments in India. Environ. Pollut. 2017, 222, 315–322. [Google Scholar] [CrossRef]
- Zhu, S.; Yang, G.; Dai, J. Sediment Management in East Lake, China: A Combined Bio-Physical and Socioeconomic Approach for Managing Sediments in a Polluted Lake System. Pol. J. Environ. Stud. 2018, 27, 1891–1900. [Google Scholar] [CrossRef]
- Dickman, M. Some Effects of Lake Renewal on Phytoplankton Productivity and Species Composition 1. Limnol. Oceanogr. 1969, 14, 660–666. [Google Scholar] [CrossRef]
- Gomes, L.; Miranda, L. Hydrologic and climatic regimes limit phytoplankton biomass in reservoirs of the Upper Paraná River Basin, Brazil. Hydrobiologia 2001, 457, 205–214. [Google Scholar] [CrossRef]
- Lee, S.; Lee, S.; Kim, S.H.; Park, H.; Park, S.; Yum, K. Examination of critical factors related to summer Chlorophyll a concentration in the Sueo Dam Reservoir, Republic of Korea. Environ. Eng. Sci. 2012, 29, 502–510. [Google Scholar] [CrossRef]
- Wan, Y.; Qiu, C.; Doering, P.; Ashton, M.; Sun, D.; Coley, T. Modeling residence time with a three-dimensional hydrodynamic model: Linkage with Chlorophyll a in a subtropical estuary. Ecol. Model. 2013, 268, 93–102. [Google Scholar] [CrossRef]
- Liu, W.-C.; Chen, W.-B.; Kuo, J.-T.; Wu, C. Numerical determination of residence time and age in a partially mixed estuary using three-dimensional hydrodynamic model. Cont. Shelf Res. 2008, 28, 1068–1088. [Google Scholar] [CrossRef]
- Vanhellemont, Q.; Ruddick, K. Atmospheric correction of metre-scale optical satellite data for inland and coastal water applications. Remote Sens. Environ. 2018, 216, 586–597. [Google Scholar] [CrossRef]
- Vanhellemont, Q. Adaptation of the dark spectrum fitting atmospheric correction for aquatic applications of the Landsat and Sentinel-2 archives. Remote Sens. Environ. 2019, 225, 175–192. [Google Scholar] [CrossRef]
- Caballero, I.; Stumpf, R.P. Retrieval of nearshore bathymetry from Sentinel-2A and 2B satellites in South Florida coastal waters. Estuar. Coast. Shelf Sci. 2019, 226, 106277. [Google Scholar] [CrossRef]
- Pahlevan, N.; Roger, J.-C.; Ahmad, Z. Revisiting short-wave-infrared (SWIR) bands for atmospheric correction in coastal waters. Opt. Exp. 2017, 25, 6015–6035. [Google Scholar] [CrossRef]
- Clark, D.K.; Baker, E.T.; Strong, A.E. Upwelled spectral radiance distribution in relation to particulate matter in sea water. Bound. Layer Meteorol. 1980, 18, 287–298. [Google Scholar] [CrossRef]
- Gordon, H.R.; Clark, D.K. Remote sensing optical properties of a stratified ocean: An improved interpretation. App. Opt. 1980, 19, 3428–3430. [Google Scholar] [CrossRef]
- McKee, D.; Cunningham, A.; Dudek, A. Optical water type discrimination and tuning remote sensing band-ratio algorithms: Application to retrieval of chlorophyll and Kd (490) in the Irish and Celtic Seas. Estuar. Coast. Shelf Sci. 2007, 73, 827–834. [Google Scholar] [CrossRef]
- Bowers, D.G.; Harker, G.E.L.; Stephan, B. Absorption spectra of inorganic particles in the Irish Sea and their relevance to remote sensing of chlorophyll. Int. J. Remote Sens. 1996, 17, 2449–2460. [Google Scholar] [CrossRef]
- O’Reilly, J.E.; Maritorena, S.; Siegel, D.A.; O’Brien, M.C.; Toole, D.; Mitchell, B.G.; Kahru, M.; Chavez, F.P.; Strutton, P.; Cota, G.F.; et al. Ocean color chlorophyll a algorithms for SeaWiFS, OC2, and OC4: Version 4. In SeaWiFS Postlaunch Calibration and Validation Analyses; NASA Center for AeroSpace Information: Hanover, MD, USA, 2000; Volume 3, pp. 9–23. [Google Scholar]
- Jena, B. The effect of phytoplankton pigment composition and packaging on the retrieval of chlorophyll-a concentration from satellite observations in the Southern Ocean. Int. J. Remote Sens. 2017, 38, 3763–3784. [Google Scholar] [CrossRef]
- Nagamani, P.; Hussain, M.; Choudhury, S.; Panda, C.; Sanghamitra, P.; Kar, R.; Das, A.; Ramana, I.; Rao, K. Validation of chlorophyll-a algorithms in the coastal waters of Bay of Bengal initial validation results from OCM-2. J. Ind. Soc. Remote Sens. 2013, 41, 117–125. [Google Scholar] [CrossRef]
- O’Reilly, J.E.; Werdell, P.J. Chlorophyll algorithms for ocean color sensors-OC4, OC5 & OC6. Remote Sens. Environ. 2019, 229, 32–47. [Google Scholar]
- Witter, D.L.; Ortiz, J.D.; Palm, S.; Heath, R.T.; Budd, J.W. Assessing the application of SeaWiFS ocean color algorithms to Lake Erie. J. Gt. Lakes Res. 2009, 35, 361–370. [Google Scholar] [CrossRef]
- Yunus, A.P.; Dou, J.; Sravanthi, N. Remote sensing of chlorophyll-a as a measure of red tide in Tokyo Bay using hotspot analysis. Remote Sens. Appl. Soc. Environ. 2015, 2, 11–25. [Google Scholar] [CrossRef]
- Pahlevan, N.; Smith, B.; Schalles, J.; Binding, C.; Cao, Z.; Ma, R.; Alikas, K.; Kangro, K.; Gurlin, D.; Hà, N.; et al. Seamless retrievals of chlorophyll-a from Sentinel-2 (MSI) and Sentinel-3 (OLCI) in inland and coastal waters: A machine-learning approach. Remote Sens. Environ. 2020, 240, 111604. [Google Scholar] [CrossRef]
- Winarso, G.; Marini, Y. MODIS standard (OC3) chlorophyll-a algorithm evaluation in Indonesian seas. Int. J. Remote Sens. Earth Sci. 2017, 11, 11–20. [Google Scholar] [CrossRef]
- Reynolds, C.S. The Ecology of Phytoplankton; Cambridge University Press: Cambridge, UK, 2006. [Google Scholar]
- May, C.L.; Koseff, J.R.; Lucas, L.V.; Cloern, J.E.; Schoellhamer, D.H. Effects of spatial and temporal variability of turbidity on phytoplankton blooms. Mar. Ecol. Prog. Ser. 2003, 254, 111–128. [Google Scholar] [CrossRef]
- Bennion, D.H.; Warner, D.M.; Esselman, P.C.; Hobson, B.; Kieft, B. A comparison of chlorophyll a values obtained from an autonomous underwater vehicle to satellite-based measures for Lake Michigan. J. Gt. Lakes Res. 2019, 45, 726–734. [Google Scholar] [CrossRef]


| S. No | Wuhan Lakes | Vembanad Lake |
|---|---|---|
| 1 | ID: LC08_L1TP_123039_20191207_20191217_01_T1 Acquisition Date: 2019-12-07, Path: 123 Row: 39 | ID: LC08_L1TP_144053_20200228_20200313_01_T1 Acquisition Date: 2020-02-28, Path: 144, Row: 53 |
| 2 | ID: L1C_T50RKU_A023910_20200120T030612 Acquisition Date: 2020/01/20, Tile Number: T50RKU | ID: LC08_L1TP_144053_20200315_20200325_01_T1 Acquisition Date: 2020-03-15 |
| 3 | ID: L1C_T50RKU_A024053_20200130T030534 Acquisition Date: 2020/01/30 | ID: LC08_L1TP_144053_20200331_20200410_01_T1 Acquisition Date: 2020-03-31 |
| 4 | ID: LC08_L1TP_123039_20200209_20200211_01_T1 Acquisition Date: 2020-02-09 | ID: L1C_T43PFL_A024755_20200319T051246 Acquisition Date: 2020/03/19, Tile Number: T43PFL |
| 5 | ID: L1C_T50RKU_A015788_20200315T030729 Acquisition Date: 2020/03/15 | ID: L1C_T43PFL_A015918_20200324T052110 Acquisition Date: 2020/03/24 |
| 6 | ID: L1C_T50RKU_A024768_20200320T030130 Acquisition Date: 2020/03/20 | D: LC08_L1TP_144053_20200331_20200410_01_T1 Acquisition Date: 2020-03-31 |
| 7 | ID: L1C_T50RKU_A025054_20200409T030244 Acquisition Date: 2020/04/09 | ID: L1C_T43PFL_A016061_20200403T052351 Acquisition Date: 2020/04/03 |
| 8 | ID: LC08_L1TP_123039_20200413_20200422_01_T1 Acquisition Date: 2020-04-13 | ID: LC08_L1TP_144053_20200416_20200423_01_T1 Acquisition Date: 2020-04-16 |
| 9 | ID: L1C_T50RKU_A025340_20200429T030455 Acquisition Date: 2020/04/29 | |
| 10 | ID: LC08_L1TP_123039_20200429_20200509_01_T1 Acquisition Date: 2020-04-29 |
© 2020 by the authors. Licensee MDPI, Basel, Switzerland. This article is an open access article distributed under the terms and conditions of the Creative Commons Attribution (CC BY) license (http://creativecommons.org/licenses/by/4.0/).
Share and Cite
Avtar, R.; Kumar, P.; Supe, H.; Jie, D.; Sahu, N.; Mishra, B.K.; Yunus, A.P. Did the COVID-19 Lockdown-Induced Hydrological Residence Time Intensify the Primary Productivity in Lakes? Observational Results Based on Satellite Remote Sensing. Water 2020, 12, 2573. https://doi.org/10.3390/w12092573
Avtar R, Kumar P, Supe H, Jie D, Sahu N, Mishra BK, Yunus AP. Did the COVID-19 Lockdown-Induced Hydrological Residence Time Intensify the Primary Productivity in Lakes? Observational Results Based on Satellite Remote Sensing. Water. 2020; 12(9):2573. https://doi.org/10.3390/w12092573
Chicago/Turabian StyleAvtar, Ram, Pankaj Kumar, Hitesh Supe, Dou Jie, Netranada Sahu, Binaya Kumar Mishra, and Ali P. Yunus. 2020. "Did the COVID-19 Lockdown-Induced Hydrological Residence Time Intensify the Primary Productivity in Lakes? Observational Results Based on Satellite Remote Sensing" Water 12, no. 9: 2573. https://doi.org/10.3390/w12092573
APA StyleAvtar, R., Kumar, P., Supe, H., Jie, D., Sahu, N., Mishra, B. K., & Yunus, A. P. (2020). Did the COVID-19 Lockdown-Induced Hydrological Residence Time Intensify the Primary Productivity in Lakes? Observational Results Based on Satellite Remote Sensing. Water, 12(9), 2573. https://doi.org/10.3390/w12092573