Abstract
A few studies have evaluated the impact of land use land cover (LULC) change on surface water quality in the Vietnamese Mekong Delta (VMD), one of the most productive agricultural deltas in the world. This study aims to evaluate water quality parameters inside full- and semi-dike systems and outside of the dike system during the wet and dry season in An Giang Province. Multivariable statistical analysis and weighted arithmetic water quality index (WAWQI) were used to analyze 40 water samples in each seasons. The results show that the mean concentrations of conductivity (EC), phosphate (PO43−), ammonium (NH4+), chemical oxygen demand (COD), and potassium (K+) failed to meet the World Health Organization (WHO) and Vietnamese standards for both seasons. The NO2− concentration inside triple and double rice cropping systems during the dry season exceeds the permissible limit of the Vietnamese standard. The high concentration of COD, NH4+ were found in the urban area and the main river (Bassac River). The WAWQI showed that 97.5 and 95.0% of water samples fall into the bad and unsuitable, respectively, for drinking categories. The main reason behind this is direct discharge of untreated wastewater from the rice intensification and urban sewerage lines. The finding of this study is critically important for decision-makers to design different mitigation or adaptation measures for water resource management in lieu of rapid global changes in a timely manner in An Giang and the VMD.
1. Introduction
Deltas around the world have played a vital role in food security and economic development. However, the rapid exploitation of natural resources and changes in land use land cover (LULC) have also caused severe environmental degradation, such as water quality deterioration in many deltas in recent years [1,2,3,4]. The heavy metal concentrations and high bacterial pathogens due to industrial, agricultural activities, poor sanitation, and hygiene were found in the Middle Nile Delta, Egypt [5]. Several studies have also reported irregulated urban expansion and animal husbandry and its impact on water quality deterioration in Irrawaddy delta, Myanmar [6,7]. Consequently, when this polluted water flows into the city during monsoon, it causes several waterborne diseases such as cholera, gastroenteritis, skin diseases [6,8,9]. Surface water pollution from organic pollutants, microbial contamination, pesticides, metals, etc. is revealed in the Mekong Delta Basin, in both the Cambodian (Phnom Penh) and Vietnamese (Chau Doc, Tan Chau, and Can Tho) part [10,11,12,13,14,15].
The well-known trans-boundary river of the Mekong River Basin (MRB) in the Asian region has a natural area of 795,000 km2 and mean annual discharge of 14,500m3/s [16,17,18]. The glaciers in the Himalaya mountains is the source of the international Mekong River, which flows to China, Myanmar, Thailand, Laos, Cambodia, Vietnam, and finally to the Pacific Ocean [18]. Therefore, the lower Mekong Delta in Vietnam, located in the downstream of the MRB and accounting for 8% of the entire basin, has dominant diurnal tidal seawater entering twice a day. Changes in water quality and quantity in the upstream region would directly affect the health of proximally 242 million people (2018 data) [19] who live in the lower Mekong river [18,20]. The upper region of the VMD receives from 60% to 80% discharge from outside of the VMD, in which the only location of An Giang Province lies between the two main rivers of Mekong and Bassac. Therefore, the covered lands of An Giang are of fertile soil due to the abundance of water resources and fluvial sedimentation from the Mekong River. Consequently, An Giang has large agricultural areas with dominant rice production [21], but this province has also faced substantial damage by natural flooding phenomena annually from August to November due to the monsoon season in the Asian region [21,22,23].
The full- and semi-dike systems in An Giang were rapidly built since the 1990s to prevent flooding and to grow rice both for food security and economic development [22,24,25]. The full-dike system and the hydraulic infrastructure were developed to protect the triple-rice cropping system as well as the urban cities [21,25]. Local farmers can grow two or three rice crops per year inside the dike systems instead of single rice crops per year as in the past [21]. Although the dike systems can protect residential areas and increase income for the local farmers, the most critical disadvantage of this system is the surface water quality deterioration [21,22,25]. Water quality degradation may be derived from both natural conditions like rock–water interaction, ion exchange, groundwater–surface water interaction, evapotranspiration, and human activities such as a discharge of untreated wastewater from a point or nonpoint source in natural water bodies [16,21,26].
Water demand for agriculture and aquaculture alone consumes a significant portion of total available water, resulting in high waste discharged from agriculture [27]. Although few studies have reported the impact of land use on stream water quality [21,28,29], studies focusing on different types of dike development for agricultural intensification and its impacts on water quality remain scarce. Henceforth, the objective of this study is to assess the physicochemical properties of the surface water in An Giang Province using the multivariate statistical analysis approach and the weighted arithmetic water quality index (WAWQI). The primary focus of this study is to evaluate the impact of dike development on surface water quality compared to other remaining areas in An Giang. The hypothesis of this study is that the water quality inside the full-dike systems was worse than the outside ones, and water quality in the dry season was worse than that of the wet season.
2. Methodology
2.1. Study Area
An Giang Province (10°12′ N to 10°57′ N and 104°46′ to 105°35′) is located in the most upper part of the VMD and borders with Cambodia in the northwest (104 km long). An Giang is a home to over 2.4 million people (2019) [30], and the total area of 3536 km2, 70% of which is for agricultural production. There are two distinct seasons: dry and wet (monsoon) in the region. The wet season occurs between May and November annually in which the high rainfall usually occurs at the end of the wet season from October to November (Figure 1). Although total annual rainfall in An Giang is low compared with the average rainfall of the VMD, the rainfall occurs nearly at the same time with the flooding season leading risk at deep inundation. Thus, An Giang has to build a large area of the dike systems (Figure 2) to increase agricultural production and to protect crops during the flooding season (July to November). Multi-dike protection systems have been built to protect residential areas from flooding, and have mainly supported agricultural intensification since the early 1990s. In addition, hydropower plants were built along the Mekong River, and its branches have led to a change in the water regime (Figure 1). During 1991 and 2015, the average discharge was decreased in the wet season and increased in the dry season. The primary soil type is alluvial soil, accounting for 44.5% of all 37 different soil types present in the province. About 72% of the area is alluvial soil or land receiving huge sediment supply and is suitable for many kinds of crops. The dike systems and hydropower plants have reduced the amount of alluvial soil to be added to the region annually [31,32].
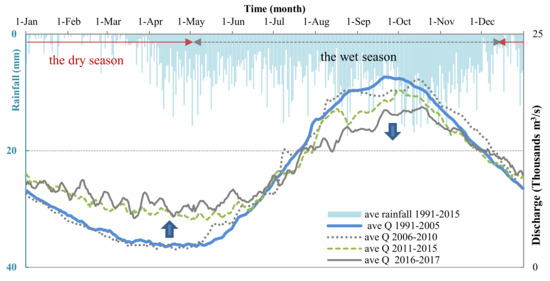
Figure 1.
Average hourly discharge (Q) from 2006 to 2017 and average daily rainfall from 1991 to 2015 at Tan Chau Station in An Giang. The discharge imposes a decreasing trend in the wet season and an increasing trend in the dry season. All data were collected from the Southern Regional Hydro-meteorological Center (SRHMC) in Vietnam [33].
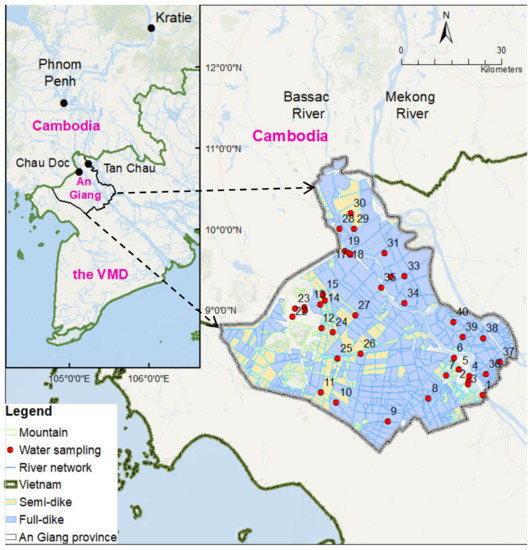
Figure 2.
Study area and water sampling sites in An Giang, the Mekong Delta in Vietnam.
2.2. Collection of Water Samples and Analytical Methods
Surface water quality samples were collected and analyzed in the wet and the dry seasons inside the full- and semi-dike systems and outside of the dike system (on the main river and single rice cropping system), as shown in Figure 3. Analyzed data were processed using statistical tools and used to calculate water quality indicators. Finally, the obtained result is discussed to observe spatio-temporal water quality classification and the impact of the dike system on water quality parameters.
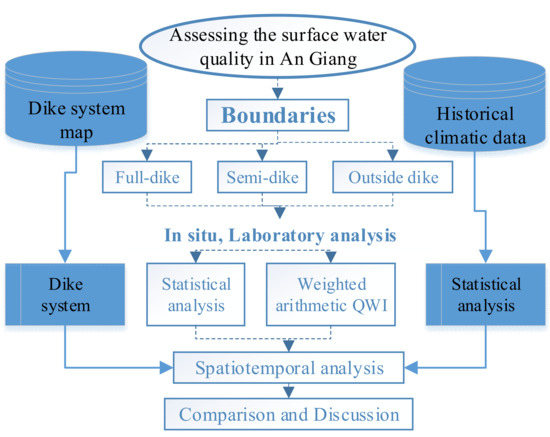
Figure 3.
Flowchart for study methodology.
Each season, 40 surface water samples were taken from inside the full- and semi-dike systems, and outside the dike system in An Giang (Figure 3). Sampling was done both for the dry season (22–28 April 2018) and the wet season (6–13 October 2018). Water sample locations were taken by geotagged photos, which were marked in the global positioning system (GPS). The stratified random sampling technique was conducted to select the sampling sites: Cluster 1 includes ten samples outside of the dike system (6 in the main rivers and 4 in single-rice cropping system), Cluster 2 includes ten samples inside the semi-dike system (3 in the forest and 7 in the double-rice cropping system), and Cluster 3 includes 20 samples inside the full-dike system (6 in the urban area and 14 in triple-rice cropping system). After collection, water samples were brought to the laboratory in an ice chest and stored below 4 °C. The collected samples were analyzed for twelve water quality parameters: pH, EC, chloride (Cl−), nitrite (NO2−), nitrate (NO3−), NH4+, COD, PO43−, sodium (Na+), calcium (Ca2+), magnesium (Mg2+), and K+. The HORIBA multi-parameter meter (Kyoto, Japan) with a precision of 1% and a handheld meter (Oaklom; Tokyo, Japan) was used for in situ analysis of the physical parameters such as pH, Cl−, EC, and some chemical parameters of NO2−, NO3−, NH4+, COD and PO43 were measured using pack test-. Anions were analyzed by DIONEX ICS-90 ion chromatography with an error percentage of <2%, while cations were analyzed by a Shimadzu mass spectrometer with a precision of <1% using duplicates. The historical meteorological data were collected from the Southern Regional Hydro-meteorological Center (SRHMC) [33].
2.3. Statistical Analyses
2.3.1. Multivariate Statistical Analysis
Multivariate statistical analysis was completed to obtain a better understanding of the processes governing water quality [34,35,36,37,38,39,40]. First, we conducted correlation and discriminant analysis (DA) [41] to find out the significant relationship among parameters and discriminant among clusters in terms of water quality characteristics. Second, we used box plots to show differences among different clusters in the dry and wet seasons. Finally, we used the WAWQI method to classify the water quality for human use. XLSTAT Software version 2018 (Addinosoft SARL, Paris, France) and the inverse distance weighting (IDW) interpolation were used to make different plots and display the results [42,43,44,45].
We conducted Spearman rank–order to evaluate the relationship among parameters at each season since most of the dataset had a non-normal distribution. Spearman rank–order consumption does not require any distribution test, such as a person correlation with a normal distribution [46,47]. Moreover, Spearman rank–order is used to identify the correlation between related parameters by producing the significance of the data, as reported in previous studies [45,48].
In this study, we use the DA technique to determine the most significant parameters among 40 samples sites as well as between the dry and wet seasons. The DA was also found in various studies [48,49]. The standard DA, forward stepwise, and backward stepwise were applied, which was previously documented [21,48,50]. The forward stepwise adds a parameter in each step, starting from the most significant fit improvement until no change was found. In the case of backward stepwise, each parameter is excluded step-by-step, starting from the least significant fit improvement until no significant changes [51,52]. After standard DA, the backward stepwise model helped to clarify which parameters are the most important. In this standard model, step-by-step, variables were removed from the beginning of the less significant until no significant changes in removal criteria are achieved [48,51].
2.3.2. Weighted Arithmetic Water Quality Index (WAWQI) Model
The WAWQI is an index number that represents the overall quality of water and is a standard tool for the classification of water pollution (Figure 4). The WAWQI can be identified as a reflection of the composite influence of multivariable quality parameters [53]. Thus, WAWQI becomes an important indicator for the assessment and management of water resources. Here, all the selected water quality parameters are aggregated into an overall index, which is the most effective tool to express water quality [54].
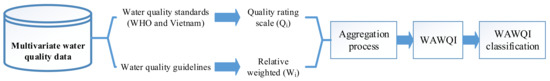
Figure 4.
Flowchart of the weighted arithmetic water quality index (WAWQI) model.
In this study, we chose the Horton method to calculate the WAWQI [21,35,54]. The standard for the drinking water was based on the permissible standard for drinking water set by WHO guidelines [55]. These all variables were turned into sub-indices such as quality rating (qi) and unit weights (Wi). The sub-indices were expressed on a single scale, and water quality was classified. The WAWQI was estimated using Equation (1) [56]:
where,
- WAWQI is weighted arithmetic water quality index;
- Qi is a quality rating of nth parameters, in which Vi is estimated value of nth parameters based on sample location, Vd is ideal value in pure water for nth parameters (pH = 7.0 and other parameters is 0); Si is permissible limits of nth parameters;
- Wi is the unit weight of nth parameters,, in which K is proportionality constant, .
Based on the ranges of WAWQI value, the corresponding status of water quality and their possible drinking use are summarized in Table 1.

Table 1.
Water quality classification for human consumption using the weighted arithmetic water quality index (WAWQI) [55].
3. Results
3.1. Statistical Assessment Using Correlation
The results of correlations matrices among 12 water quality parameters in the dry and wet season are shown in Table 2 and Table 3, respectively. The parameters showing weak correlation coefficients with others in both seasons in An Giang have been affected by multiple sources such as agriculture, urbanization, and industry [13,21,57]. In the dry season, COD had a strong statistically significant correlation with Mg2+ (0.61) and EC (0.61) and a moderately positive relation with PO43− (0.49) and NH4+ (0.461). In contrast, in the rainy season, COD had no correlation with PO43− and Mg2+ parameters, excluding EC, pH, and NH4+, with which it showed weak correlations. PO43− had a weak correlation with EC and NH4+ in both seasons and had a very weak relationship with the only NO2− in the wet season. On the other hand, NO3− had a strong correlation with NO2−, while NO3− did not correlate to others in both seasons. During flooding, a large amount of water flowing from the upper Mekong River discharges into An Giang with high COD concentration, supported by previous observation [13]
Table 2.
Correlation matrices in the dry season using Spearman rank–order.
Table 3.
Correlation matrices in the wet season using Spearman rank–order.
Interestingly, the characteristics of physical parameters in the dry season are strongly correlated than those in the wet season. Physical parameters such as EC and pH had a negative correlation in the wet season and had almost no correlation in the dry season. In the dry season, EC correlated with COD, NH4+, and PO43− while pH only correlated with NO2−. In the wet season, pH and EC had a moderate correlation with COD and NH4+. Besides, EC correlated with PO43− and pH correlated with Mg2+ in the wet season. The EC parameter qualitatively reflects the status of inorganic pollution [58]. The significantly high relation between EC and NH4+ for both seasons signifies the excess of breakdown/decomposition of organic matters, animal, and human waste. Nitrogen fixation is an indicator of anthropogenic input, excess of fertilizer application in the agricultural fields. During the wet season, pH and EC are negatively correlated, indicating a lower prevalence of cations and anions when water becomes alkaline. The strong correlation between EC and COD for both seasons indicates high organic pollutants, while the moderate association with PO43− implies anthropogenic input. A strong association between NO2− and NO3− suggest the same source of origin, likely an agricultural runoff with high fertilizer input.
3.2. Spatial Assessment of Water Quality Using DA
The analysis technique of DA method was used to determine how many discriminant water quality parameters between the two seasons. The DA result shows a temporal comparison of the three discriminant significant parameters: pH, Cl−, and Ca2+ between the dry and wet seasons (Figure 5). The pH, Cl−, and Ca2+ showed different behaviors between the two seasons. The pH measures acidity in water or represents the negative logarithm of the hydrogen-ion activity [59,60]. The pH value beyond 6.5 to 8.5 range represents its contamination or pollution [61]. On the other hand, pH has a significant association with dissolved oxygen (DO) in freshwater. Therefore, the breakdown of organic matter exceeds synthesis activities caused oxygen consumption to increase. In this study, the pH 7.42 ± 0.63 (dry season) and 6.97 ± 1.06 (wet season) were neither highly alkaline nor highly acidic. In the dry season, the water is slightly alkaline, while the water is slightly acidic in the wet season. This result also confirms that the fluctuations in the value of water quality parameters in the dry season are greater than those in the wet season. On the other hand, the concentrations of Cl− and Ca2+ were also relatively higher for the dry season than that of the wet season. Relatively low river discharge and higher evapotranspiration cause this seasonal difference in the concentration. Even though Cl− occurs naturally in water, the larger value of Cl− level can increase the corrosiveness of water, and in combination with sodium, it creates a salty taste.
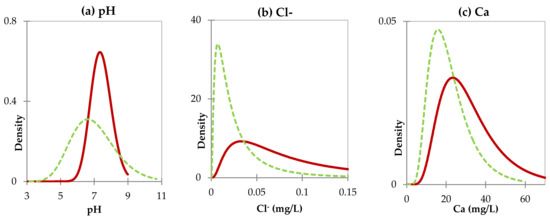
Figure 5.
Log-normal probability distribution of (a) pH, (b) Cl−, and (c) Ca2+ during the dry (red line) and wet seasons (green line).
The DA approach was also applied to identify the contribution of the most important parameters of water quality seasonal variations, especially concerning the contribution of the variables in discriminating in space. Therefore, the DA approach is used to determine the discriminant among clusters in the dry and wet seasons (Table 4 and Table 5). The significant parameters among clusters are the concentrations of NO2−, NO3−, and pH in the dry season and Cl− and Mg2+ in the wet season.
Table 4.
Unidimensional lambda test of the quality of water parameter equality in the dry season.
Table 5.
Unidimensional lambda test of the quality of water parameter equality in the wet season.
The discriminant of water pollutant level among different clusters (Cluster 3: inside the full-dike system, Cluster 2: inside the semi-dike system, and Cluster 1: outside of the dike system) was evaluated. The discriminant among clusters for selected parameters in both seasons was displayed by using box and whisker plots (Figure 6 and Figure 7). For the dry season, concentrations of pH, NO3−, NO2− were high in Cluster 3 in comparison with Clusters 1 and 2. Meanwhile, in the wet season, the highest concentration of Mg2+ was found in Cluster 2, followed by Cluster 3 and Cluster 1. The concentration of Cl− was found higher in Cluster 3 than that in Clusters 1 and 2 in the wet season.
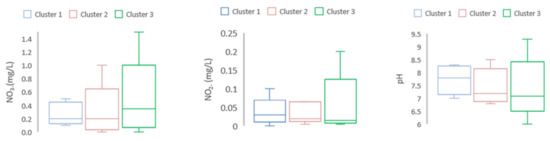
Figure 6.
Water quality variables among three Clusters in the dry season. NO3−, NO2−, and pH were found higher in Cluster 3 than those in Clusters 1 and 2.
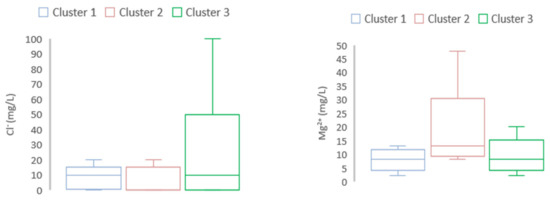
Figure 7.
Water quality variables among the three clusters in the wet season. Mg2+ was high in Cluster 2 while Cl− was high in Cluster 3.
3.3. Water Quality Classification Using WAWQI
Table 6 shows the range, mean, and standard deviation values of parameters, some of which were found to exceed the permissible standard for drinking water set by WHO and Vietnam national standard for both seasons. The higher values of these water quality parameters would lead to an increase in WAWQI. Overall, EC, NO2−, NH4+, COD, PO43−, and K+ were above the permissible standard set by WHO and Vietnamese standards. The EC is a measure of current carrying capacity due to the electrical current being carried by ions in a solution [62]; thus, as the concentration of dissolved salts increases, conductivity value also increases. On the other hand, EC is also used to determine the suitability of water for irrigation and firefighting [61]. Both NO3− and NO2− are nitrogen-containing compounds that generally indicate contamination from a pasture, decomposed vegetation, agricultural fertilizers, sewage, and rock–water interaction. NO3− is the essential nutrients in an ecosystem. Generally, water polluted by organic matter exhibits higher values of nitrate. In this study, the mean concentration of nitrate was 0.34 mg/L in the dry season and 0.5 mg/L in the wet season. Nitrate in all sample sites was below permissible standards.
Table 6.
Standards for drinking water and relative weight of parameters.
The Cl− mean values are 90 mg/L in the dry season and 20 mg/L in the wet season. The concentration of Cl− in surface water may come from human activities, namely, agricultural runoff and wastewater sources [61,63]. In this study, the high concentration of Cl− is also considered to be an indication of pollution due to the high organic waste from irrigation drainage, septic tank effluent, animal feed, and landfill leachates [59,60]. This also indicates poor governance and infrastructure to manage wastewater coming from both agricultural fields and urbanized areas.
The WAWQI of the present investigation from 40 sampling sites in both seasons were calculated. The WAWQI calculated from sampling Number 2 in the dry season is shown in Table 7 as an example.
Table 7.
Weighted arithmetic water quality index (WAWQI) calculation for sampling Number 2 as an example in the dry season.
The WAWQI is commonly used for the detection and evaluation of overall water pollution since it can reflect the influence of different quality parameters on the quality of water. The application of WAWQI is a useful method in assessing the suitability of water for various beneficial uses. The WAWQI was analyzed for two seasons, as shown in Appendix A1. From the WAWQI of the dry season samples, 70% of the total water samples was unsuitable for drinking, 10% was very bad, 17.7% was bad, and only 2.5% was good. The water quality of the wet season showed that 60% of the total water samples was unsuitable for drinking, 10% was very bad, 20% was bad, and 10% was good. In general, the surface water quality was better in the wet season than in the dry season.
Besides, the WAWQI of both the wet and dry seasons was mapped to show the spatial distribution of WAWQI using the IDW method (Figure 8). The bad conditions of water quality (high values of WAWQI) were located in the rice intensification areas. Some bad water quality could be found at tributaries of the Bassac River. It might be caused by water discharged from intensive rice crop areas, tourism and urban areas. In the area surrounded by the Mekong and Bassac Rivers in the northeast, the water quality is found to be better. It may be because the proper operation of the sluice-gates system and the alternatives of intensive rice crops (instead of 3 crops/year, it had shifted to 8 crops for every 3-years, and 5 crops for every 2-years by now). Being surrounded by the two large rivers is also advantageous in that the exchange of inside and outside dike systems may lead to a reduction in pollution by dilution.
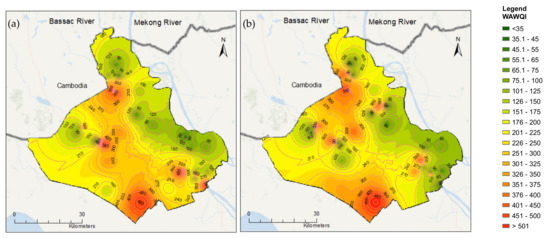
Figure 8.
Spatial distribution of weighted arithmetic water quality index (WAWQI) in the (a) dry and (b) wet seasons using inverse distance weighting (IDW) interpolation.
Overall, the WAWQI values in the wet season are more scattered among the different sites compared to that of the dry season. For example, extreme high WAWQI were found in the northwest and the southwest of An Giang, while the southeast of An Giang was found with good water quality. Regions with high WAWQI were mainly found in the triple-rice system, and the urban area inside the full-dike system was linked with high concentrations of EC, NH4+, COD, NO2−, and PO43−. Contrastingly, locations with low WAWQI mainly represent orchards located inside the full-dike system. The heavy rain in the wet season can dilute pollutant concentrations. Therefore, water quality in this region in the wet season is better than the dry season. The “hotspot” of water quality in the south most of An Giang province is found in both dry and wet seasons. This can be explained by the full triple rice cropping system inside the full-dike system in this location being linked with high concentrations of EC, COD, NO2−, and PO43−.
4. Discussion
Water is a precious resource for various activities in An Giang. However, due to a rapid rate of increase in rice intensification, urbanization, and tourist area, the water quality has decreased dramatically. This issue was found in various studies in the VMD in recent years [15,21]. The clarification of the seasonal change in water quality was important to evaluate the temporal variations of surface water pollution.
The results show that the concentration of NH4+, COD, PO43−, and K+ was relatively higher compared to the World Health Organization (WHO) and the Vietnamese standard for both seasons. Figure 9 and Figure 10 show the concentrations of COD and PO43− at the stations of Tan Chau and Chau Doc, respectively, which is close to the Cambodian border. The concentrations of COD showed an increasing trend from 1985 to 2011 at Tan Chau and in 2013 at Chau Doc station. Although COD concentration from 1996 to 2010 in Cambodia was higher than those in Vietnam, most of the COD values were below the permissible standard of Vietnam. From 2015 to 2017, COD has exceeded the Vietnamese standard for domestic use. Linear progress analysis shows the R2 values at 0.47 and 0.39 for Tan Chau and Chau Doc stations, respectively. The PO43− concentrations from 1995 to 2005 (Figure 10) in the Cambodia side were below the standard of Vietnam, while those concentrations in the Vietnam part fluctuated seasonally and were higher than the permissible standard of Vietnam for several years.
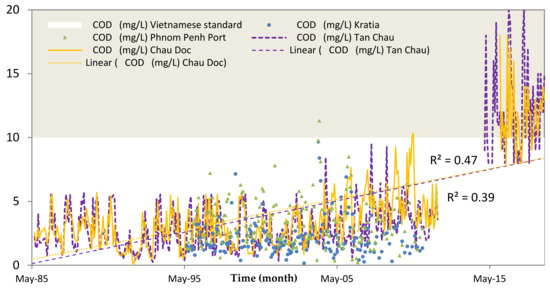
Figure 9.
Temporal concentrations of chemical oxygen demand (COD) in the Vietnamese side (Tan Chau and Chau Doc stations) from 1985 to 2017 and in the Cambodia side (Phnom Penh Port and Kratie) from 1995 to 2010.
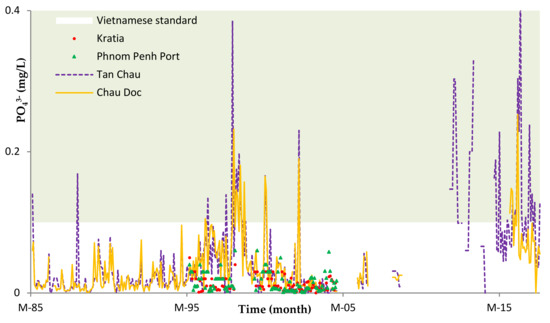
Figure 10.
Temporal concentrations of PO43− in the Vietnamese side (Tan Chau and Chau Doc stations) from 1985 to 2017 and in the Cambodia side (Phnom Penh Port and Kratie) from 1995 to 2005.
The results of this study show that pH, Cl−, and calcium were significant discriminant parameters between the two seasons. Cl− was chosen as an important indicator parameter since its values represent the degree of organic pollution, as mentioned above. The concentration of Cl− in the dry season was found extremely higher than that in the wets season.
The classification of water quality in this study clearly shows that the status of water bodies in the study area is eutrophic, and it is unsuitable for drinking. It is also observed that most of the pollution loads relatively high in the dry season compared to those in the wet season except NH4+ and COD. Anthropogenic pollutant load is relatively high, as indicated by a higher concentration of PO43−, NO2− and NO3−. These results support the hypothesis that considered water quality deterioration in the dry season.
Furthermore, high concentrations of NO3−, NO2− and pH in water samples of Cluster 3 inside the full-dike system in the dry season were detected. Meanwhile, high Cl− and Mg2+ were found in water samples of Cluster 3 and Cluster 2, respectively. Minh et al. [21] also found high nitrite and nitrate inside the full-dike system where the triple rice cropping system was dominant in An Giang. The high mean concentration of 90 mg/L in the dry season for Cl− inside the full-dike system was identified for the influence of wastewater surrounding the urban area and rice fields. Rivers typically have concentrations of Cl− less than 50 mg/L [64]. The high level of Cl− may have a negative impact on an ecosystem [64]. This may be an indicator of sewage pollution, which may be from a water softener or sewage contamination discharge from city, located inside the full-dike system. In summary, it also supports the hypothesis that water quality inside the full-dike system is worse than that of outside ones.
The WAWQI for 40 samples ranges from 34 to 1847 in the dry season and from 40 to 1584 in the wet season. Although the range of WAWQI, as well as the minimum values in the dry season, was lower than those in the wet season, the good water quality index of 10% of the location in the wet season was higher than 2.5% of the location in the dry season. The high value of WAWQI at these stations has been found to be mainly due to the higher levels of EC, NH4+, and COD. Spatial distribution of water quality using WAWQI values helped to identify factors and processes responsible for water quality evolution.
5. Conclusions
Overall, this study provides an approach for assessing surface water pollutant levels. Water quality in An Giang in the dry and wet seasons has deteriorated tremendously due to urban wastewater discharge and rice intensification in the past 30 years. During the flood season, water from the Upper Mekong River carries high concentrations of pollutants into An Giang. We found high NO3−, NO2−, Cl− concentrations inside the full-dike system, while high concentrations of COD and NH4+ were found in the urban area and the main river (Bassac River). Most of the water quality samples in both dry and wet seasons were bad or unsuitable for drinking. Thus, the water in An Giang Province should be treated before supplying for drinking water or domestic use. Water quality observation stations along the border should be strengthened to provide a better understanding of the primary pollutant sources that have influenced the surface water quality during the flood season in An Giang as well as the entire VMD.
Author Contributions
Conceptualization—H.V.T.M., R.A., M.K. and T.V.T.; methodology—H.V.T.M., R.A., M.K., P.K., K.N.L. and T.V.T.; writing—original draft preparation, H.V.T.M., R.A., M.K., P.K., K.N.L. and T.V.T.; writing—review and editing, H.V.T.M., R.A., M.K., P.K., K.N.L. and T.V.T. All authors have read and agreed to the published version of the manuscript.
Funding
This research received no external funding.
Acknowledgments
The authors thank the Vietnamese Ministry of Education and Training, Can Tho University, and Hokkaido University for supporting us to complete this research.
Conflicts of Interest
The authors declare no conflict of interest.
Appendix
Table A1.
The weighted arithmetic water quality index (WAWQI) at 40 sampling sites in the dry and wet season in 2018.
Table A1.
The weighted arithmetic water quality index (WAWQI) at 40 sampling sites in the dry and wet season in 2018.
| Sampling Site | Dry Season | Wet Season | ||
|---|---|---|---|---|
| WAWQI | Water Classification | WAWQI | Water Classification | |
| 1 | 443 | Unsuitable for drinking | 51 | Bad |
| 2 | 66 | Bad | 65 | Bad |
| 3 | 241 | Unsuitable for drinking | 361 | Unsuitable for drinking |
| 4 | 123 | Unsuitable for drinking | 208 | Unsuitable for drinking |
| 5 | 64 | Bad | 66 | Bad |
| 6 | 222 | Unsuitable for drinking | 205 | Unsuitable for drinking |
| 7 | 101 | Unsuitable for drinking | 124 | Unsuitable for drinking |
| 8 | 198 | Unsuitable for drinking | 98 | Very Bad |
| 9 | 1847 | Unsuitable for drinking | 1489 | Unsuitable for drinking |
| 10 | 448 | Unsuitable for drinking | 239 | Unsuitable for drinking |
| 11 | 1813 | Unsuitable for drinking | 1584 | Unsuitable for drinking |
| 12 | 187 | Unsuitable for drinking | 198 | Unsuitable for drinking |
| 13 | 561 | Unsuitable for drinking | 487 | Unsuitable for drinking |
| 14 | 159 | Unsuitable for drinking | 312 | Unsuitable for drinking |
| 15 | 339 | Unsuitable for drinking | 361 | Unsuitable for drinking |
| 16 | 111 | Unsuitable for drinking | 368 | Unsuitable for drinking |
| 17 | 131 | Unsuitable for drinking | 151 | Unsuitable for drinking |
| 18 | 131 | Unsuitable for drinking | 349 | Unsuitable for drinking |
| 19 | 161 | Unsuitable for drinking | 43 | Good |
| 20 | 81 | Very Bad | 63 | Bad |
| 21 | 111 | Unsuitable for drinking | 61 | Bad |
| 22 | 63 | Bad | 143 | Unsuitable for drinking |
| 23 | 76 | Very Bad | 75 | Bad |
| 24 | 73 | Bad | 76 | Very Bad |
| 25 | 52 | Bad | 107 | Unsuitable for drinking |
| 26 | 595 | Unsuitable for drinking | 307 | Unsuitable for drinking |
| 27 | 217 | Unsuitable for drinking | 281 | Unsuitable for drinking |
| 28 | 34 | Good | 369 | Unsuitable for drinking |
| 29 | 736 | Unsuitable for drinking | 66 | Bad |
| 30 | 334 | Unsuitable for drinking | 97 | Very Bad |
| 31 | 334 | Unsuitable for drinking | 310 | Unsuitable for drinking |
| 32 | 61 | Bad | 62 | Bad |
| 33 | 67 | Bad | 48 | Good |
| 34 | 94 | Very Bad | 77 | Very Bad |
| 35 | 319 | Unsuitable for drinking | 139 | Unsuitable for drinking |
| 36 | 1075 | Unsuitable for drinking | 177 | Unsuitable for drinking |
| 37 | 277 | Unsuitable for drinking | 369 | Unsuitable for drinking |
| 38 | 185 | Unsuitable for drinking | 274 | Unsuitable for drinking |
| 39 | 78 | Very Bad | 40 | Good |
| 40 | 102 | Unsuitable for drinking | 49 | Good |
References
- Venkatramanan, S.; Chung, S.; Ramkumar, T.; Rajesh, R.; Gnanachandrasamy, G. Assessment of groundwater quality using GIS and CCME WQI techniques: A case study of Thiruthuraipoondi city in Cauvery deltaic region, Tamil Nadu, India. Desalin. Water Treat. 2016, 57, 12058–12073. [Google Scholar] [CrossRef]
- Van Stokkom, H.; Witter, J. Implementing integrated flood risk and land-use management strategies in developed deltaic regions, exemplified by The Netherlands. Int. J. River Basin Manag. 2008, 6, 331–338. [Google Scholar] [CrossRef]
- Minh, H.V.T.; Ngoc, D.T.H.; Ngan, H.Y.; Men, H.V.; Van, T.N.; Ty, T.V. Assessment of groundwater level and quality: A case study in O Mon and Binh Thuy districts, Can Tho City, Vietnam. Fac. Eng. Naresuan Univ. 2016, 11, 25–33. [Google Scholar]
- Minh, H.V.T.; Avtar, R.; Kumar, P.; Tran, D.Q.; Ty, T.V.; Behera, H.C.; Kurasaki, M. Groundwater quality assessment using fuzzy-AHP in an Giang Province of Vietnam. Geosciences 2019, 9, 330. [Google Scholar] [CrossRef]
- El-Kowrany, S.I.; El-Zamarany, E.A.; El-Nouby, K.A.; El-Mehy, D.A.; Abo Ali, E.A.; Othman, A.A.; Salah, W.; El-Ebiary, A.A. Water pollution in the Middle Nile Delta, Egypt: An environmental study. J. Adv. Res. 2016, 7, 781–794. [Google Scholar] [CrossRef]
- Akaishi, F.; Satake, M.; Otaki, M.; Tominaga, N. Surface water quality and information about the environment surrounding Inle Lake in Myanmar. Limnology 2006, 7, 57–62. [Google Scholar] [CrossRef]
- Bowles, J. The Ayeyarwady River Endangered; Myanmar Development Research Institute (MDRI): Yangon, Myanmar, 2013; p. 42. [Google Scholar]
- Charron, D.F.; Thomas, M.K.; Waltner-Toews, D.; Aramini, J.J.; Edge, T.; Kent, R.A.; Maarouf, A.R.; Wilson, J. Vulnerability of waterborne diseases to climate change in Canada: A review. J. Toxicol. Env. Health Part A 2004, 67, 1667–1677. [Google Scholar] [CrossRef]
- Phung, D.; Huang, C.; Rutherford, S.; Chu, C.; Wang, X.; Nguyen, M. Climate change, water quality, and water-related diseases in the Mekong Delta Basin: A systematic review. Asia Pac. J. Public Health 2015, 27, 265–276. [Google Scholar] [CrossRef]
- Dat, T.Q.; Kanchit, L.; Thares, S.; Trung, N.H. Modeling the influence of river discharge and sea level rise on salinity intrusion in Mekong Delta. In Proceedings of the 1st Environment Asia International Conference, Bangkok, Thailand, 23–26 March 2011; Volume 35, pp. 685–701. [Google Scholar]
- Wilbers, G.-J.; Becker, M.; Nga, L.T.; Sebesvari, Z.; Renaud, F.G. Spatial and temporal variability of surface water pollution in the Mekong Delta, Vietnam. Sci. Total Environ. 2014, 485, 653–665. [Google Scholar] [CrossRef]
- Ikemoto, T.; Tu, N.P.C.; Watanabe, M.X.; Okuda, N.; Omori, K.; Tanabe, S.; Tuyen, B.C.; Takeuchi, I. Analysis of biomagnification of persistent organic pollutants in the aquatic food web of the Mekong Delta, South Vietnam using stable carbon and nitrogen isotopes. Chemosphere 2008, 72, 104–114. [Google Scholar] [CrossRef]
- Chea, R.; Grenouillet, G.; Lek, S. Evidence of water quality degradation in lower Mekong Basin revealed by self-organizing map. PLoS ONE 2016, 11, e0145527. [Google Scholar] [CrossRef] [PubMed]
- Berg, M.; Stengel, C.; Trang, P.T.K.; Viet, P.H.; Sampson, M.L.; Leng, M.; Samreth, S.; Fredericks, D. Magnitude of arsenic pollution in the Mekong and Red River Deltas—Cambodia and Vietnam. Sci. Total Environ. 2007, 372, 413–425. [Google Scholar] [CrossRef] [PubMed]
- Chau, N.D.G.; Sebesvari, Z.; Amelung, W.; Renaud, F.G. Pesticide pollution of multiple drinking water sources in the Mekong Delta, Vietnam: Evidence from two provinces. Environ. Sci. Pollut. Res. 2015, 22, 9042–9058. [Google Scholar] [CrossRef] [PubMed]
- Bartram, J.; Ballance, R. Water Quality Monitoring: A Practical Guide to the Design and Implementation of Freshwater Quality Studies and Monitoring Programmes; CRC Press: London, UK, 1996; p. 383. [Google Scholar]
- Mekong River Commission. Overview of the Hydrology of the Mekong Basin; PDR: Vientiane, Laos, 2005; p. 82. [Google Scholar]
- Wang, W.; Lu, H.; Ruby Leung, L.; Li, H.; Zhao, J.; Tian, F.; Yang, K.; Sothea, K. Dam construction in Lancang-Mekong River Basin could mitigate future flood risk from warming-induced intensified rainfall. Geophys. Res. Lett. 2017, 44, 10–378. [Google Scholar] [CrossRef]
- Open Development Mekong Population and Censuses. Available online: https://opendevelopmentmekong.net/topics/population-and-censuses (accessed on 26 May 2020).
- Mekong River Commission (MRC). Mekong Basin. Available online: http://www.mrcmekong.org/mekong-basin (accessed on 18 April 2020).
- Minh, H.V.T.; Kurasaki, M.; Ty, T.V.; Tran, D.Q.; Le, K.N.; Avtar, R.; Rahman, M.M.; Osaki, M. Effects of multi-dike protection systems on surface water quality in the Vietnamese Mekong Delta. Water 2019, 11. [Google Scholar] [CrossRef]
- Minh, H.V.T.; Avtar, R.; Mohan, G.; Misra, P.; Kurasaki, M. Monitoring and mapping of rice cropping pattern in flooding area in the Vietnamese Mekong Delta using Sentinel-1A data: A case of An Giang Province. ISPRS Int. J. Geo Inf. 2019, 8. [Google Scholar] [CrossRef]
- Tuan, L.A.; Minh, H.V.T.; Tuan, D.D.A.; Thao, N.T.P. Baseline Study for Community Based Water Management Project; Mekong Water Governance Program Vietnam: Hanoi, Vietnam, 2015. [Google Scholar]
- Fujii, H.; Fujihara, Y.; Hoshikawa, K. Expansion of full-dyke system and its impact in flood-prone rice area in the Mekong Delta. Trans. Jpn. Soc. Irrig. Drain. Rural Eng. 2013, 81, 271–278. [Google Scholar] [CrossRef]
- Nguyen, V.K.T.; Nguyen, V.D.; Fujii, H.; Kummu, M.; Merz, B.; Apel, H. Has dyke development in the Vietnamese Mekong Delta shifted flood hazard downstream? Hydrol. Earth Syst. Sci. 2017, 21, 3991–4010. [Google Scholar] [CrossRef]
- Ty, T.V. Scenario-based impact assessment of land use/cover and climate changes on water resources and demand: A case study in the Srepok River Basin, Vietnam—Cambodia. Water Resour. Manag. 2012, 26, 1387–1407. [Google Scholar] [CrossRef]
- DONRE Water Resource Distribution in an Giang. Available online: http://sotainguyenmt.angiang.gov.vn/TongQuan_TNN1.aspx (accessed on 2 September 2019).
- Allan, J.D. Landscapes and riverscapes: The influence of land use on stream ecosystems. Annu. Rev. Ecol. Evol. Syst. 2004, 35, 257–284. [Google Scholar] [CrossRef]
- Johnson, L.; Gage, S. Landscape approaches to the analysis of aquatic ecosystems. Freshw. Biol. 1997, 37, 113–132. [Google Scholar] [CrossRef]
- Wikipedia. An Giang Provice. Available online: https://en.wikipedia.org/wiki/An_Giang_Province (accessed on 10 May 2020).
- Yoshida, Y.; Lee, H.S.; Trung, B.H.; Tran, H.-D.; Lall, M.K.; Kakar, K.; Xuan, T.D. Impacts of mainstream hydropower Dams on fisheries and agriculture in lower Mekong Basin. Sustainability 2020, 12, 2408. [Google Scholar] [CrossRef]
- Tran, D.; Weger, J. Barriers to implementing irrigation and drainage policies in An Giang Province, Mekong Delta, Vietnam. Irrig. Drain. 2018, 67, 81–95. [Google Scholar] [CrossRef]
- The Southern Regional Hydro-meteorological Center. Supply and Exploit Data. Available online: http://www.kttv-nb.org.vn/index.php/dich-vu-kttv/cung-cap-khai-thac-so-lieu (accessed on 6 June 2020).
- Helena, B.; Pardo, R.; Vega, M.; Barrado, E.; Fernandez, J.M.; Fernandez, L. Temporal evolution of groundwater composition in an alluvial aquifer (Pisuerga River, Spain) by principal component analysis. Water Res. 2000, 34, 807–816. [Google Scholar] [CrossRef]
- Avtar, R.; Kumar, P.; Singh, C.K.; Sahu, N.; Verma, R.L.; Thakur, J.K.; Mukherjee, S. Hydrogeochemical assessment of groundwater quality of Bundelkhand, India using statistical approach. Water Qual. Expo. Health 2013, 5, 105–115. [Google Scholar] [CrossRef]
- Kido, M.; Yustiawati; Syawal, M.S.; Sulastri; Hosokawa, T.; Tanaka, S.; Saito, T.; Iwakuma, T.; Kurasaki, M. Comparison of general water quality of rivers in Indonesia and Japan. Environ. Monit. Assess. 2008, 156, 317. [Google Scholar] [CrossRef] [PubMed]
- Shammi, M.; Rahman, M.M.; Islam, M.A.; Bodrud-Doza, M.; Zahid, A.; Akter, Y.; Quaiyum, S.; Kurasaki, M. Spatio-temporal assessment and trend analysis of surface water salinity in the coastal region of Bangladesh. Environ. Sci. Pollut. Res. 2017, 24, 14273–14290. [Google Scholar] [CrossRef]
- Avtar, R.; Kumar, P.; Singh, C.; Mukherjee, S. A comparative study on hydrogeochemistry of Ken and Betwa Rivers of Bundelkhand using statistical approach. Water Qual. Expo. Health 2011, 2, 169–179. [Google Scholar] [CrossRef]
- Kumar, P.; Ram, A. Chapter 4: Integrating major ion chemistry with statistical analysis for geochemical assessment of groundwater quality in coastal aquifer of Saijo plain, Ehime prefecture, Japan. In Water Quality: Indicators, Human Impact and Environmental Health; Nova Publication: Haryana, India, 2013; pp. 99–108. [Google Scholar]
- Avtar, R.; Kumar, P.; Oono, A.; Saraswat, C.; Dorji, S.; Hlaing, Z. Potential application of remote sensing in monitoring ecosystem services of forests, mangroves and urban areas. Geocarto. Int. 2017, 32, 874–885. [Google Scholar] [CrossRef]
- Johnson, R.A.; Wichern, D.W. Applied Multivariate Statistical Analysis, 3rd ed.; Prentice-Hall: Englewood Cliffs, NJ, USA, 1992; p. 642. [Google Scholar]
- Ogbozige, F.J.; Adie, D.B.; Abubakar, U.A. Water quality assessment and mapping using inverse distance weighted interpolation: A case of River Kaduna, Nigeria. Niger. J. Technol. 2018, 37, 249–261. [Google Scholar] [CrossRef]
- Ke, W.; Cheng, H.P.; Yan, D.; Lin, C. The application of cluster analysis and inverse distance-weighted interpolation to appraising the water quality of Three Forks Lake. Procedia Environ. Sci. 2011, 10, 2511–2517. [Google Scholar] [CrossRef][Green Version]
- Mirzaei, R.; Sakizadeh, M. Comparison of interpolation methods for the estimation of groundwater contamination in Andimeshk-Shush Plain, Southwest of Iran. Environ. Sci. Pollut. Res. 2016, 23, 2758–2769. [Google Scholar] [CrossRef] [PubMed]
- Avtar, R.; Kumar, P.; Surjan, A.; Gupta, L.; Roychowdhury, K. Geochemical processes regulating groundwater chemistry with special reference to nitrate and fluoride enrichment in Chhatarpur area, Madhya Pradesh, India. Environ. Earth Sci. 2013, 70, 1699–1708. [Google Scholar] [CrossRef]
- Algina, J.; Keselman, H. Comparing squared multiple correlation coefficients: Examination of a confidence interval and a test significance. Psychol. Methods 1999, 4, 76. [Google Scholar] [CrossRef]
- Govindarajulu, Z. Rank correlation methods. Technometrics 1992, 34, 108. [Google Scholar] [CrossRef]
- Shrestha, S.; Kazama, F. Assessment of surface water quality using multivariate statistical techniques: A case study of the Fuji river basin, Japan. Environ. Model. Softw. 2007, 22, 464–475. [Google Scholar] [CrossRef]
- Molekoa, M.D.; Avtar, R.; Kumar, P.; Minh, H.V.T.; Kurniawan, T.A. Hydrogeochemical assessment of groundwater quality of Mokopane area, Limpopo, South Africa using statistical approach. Water 2019, 11, 1891. [Google Scholar] [CrossRef]
- Duan, W.; He, B.; Nover, D.; Yang, G.; Chen, W.; Meng, H.; Zou, S.; Liu, C. Water quality assessment and pollution source identification of the Eastern Poyang Lake Basin using multivariate statistical methods. Sustainability 2016, 8. [Google Scholar] [CrossRef]
- Wunderlin, D.A.; del Pilar Díaz, M.; Amé, M.V.; Pesce, S.F.; Hued, A.C.; de Los Ángeles Bistoni, M. Pattern recognition techniques for the evaluation of spatial and temporal variations in water quality. A case study: Suquía River Basin (Córdoba–Argentina). Water Res. 2001, 35, 2881–2894. [Google Scholar] [CrossRef]
- Poulsen, J.; French, A. Discriminant Function Analysis 2008. Available online: http://userwww.sfsu.edu/~efc/classes/biol710/discrim/discrim (accessed on 10 May 2020).
- Horton, R.K. An index number system for rating water quality. J. Water Pollu. Cont. Fed. 1965, 37, 300–305. [Google Scholar]
- Kachroud, M.; Trolard, F.; Kefi, M.; Jebari, S.; Bourrié, G. Water quality indices: Challenges and application limits in the literature. Water 2019, 11, 361. [Google Scholar] [CrossRef]
- World Health Organization. Guidelines for Drinking-Water Quality, 4th ed.; World Health Organization: Geneva, Switzerland, 2017; p. 631. [Google Scholar]
- Brown, R.M.; McClelland, N.I.; Deininger, R.A.; O’Connor, M.F. A water quality index—Crashing the psychological barrier. In Proceedings of the Indicators of Environmental Quality; Thomas, W.A., Ed.; Plenum Press: New York, NY, USA, 1972; pp. 173–182. [Google Scholar]
- Thuy, P.T.; Van Geluwe, S.; Nguyen, V.-A.; Van der Bruggen, B. Current pesticide practices and environmental issues in Vietnam: Management challenges for sustainable use of pesticides for tropical crops in (South-East) Asia to avoid environmental pollution. J. Mater. Cycles Waste Manag. 2012, 14, 379–387. [Google Scholar] [CrossRef]
- McCutcheon, S.; Martin, J.; Barnwell, T., Jr. Water Quality, Handbook of Hydrology; Maidment, D.R., Ed.; McGraw-Hill Inc.: New York, NY, USA, 1993. [Google Scholar]
- Edzwald, J.K. Water Quality and Treatment A Handbook on Drinking Water, 6th ed.; McGrawHill Education: New York, NY, USA; American Water Works Association: Denver, CO, USA, 2010. [Google Scholar]
- Spellman, F.R. The Drinking Water Handbook; CRC Press: Boca Raton, FL, USA, 2017; p. 388. [Google Scholar]
- Omer, N.H. Water quality parameters. In Water Quality-Science, Assessments and Policy; IntechOpen: London, UK, 2019; p. 18. [Google Scholar]
- APHA; AWWA; WEF. Standard methods for the examination of water and wastewater 21st Edition Method 5310 B. High temperature combustion method. In Standard Methods for the Examination of Water and Wastewater; American Public Health Association: Washington, DC, USA, 2005; pp. 5–21. [Google Scholar]
- Sharma, S.; Bhattacharya, A. Drinking water contamination and treatment techniques. Appl. Water Sci. 2017, 7, 1043–1067. [Google Scholar] [CrossRef]
- Brandt, M.J.; Johnson, K.M.; Elphinston, A.J.; Ratnayaka, D.D. Chemistry, microbiology and biology of water. In Twort’s Water Supply, 7th ed.; Brandt, M.J., Johnson, K.M., Elphinston, A.J., Ratnayaka, D.D., Eds.; Butterworth-Heinemann: Boston, MA, USA, 2017; pp. 235–321. [Google Scholar]
© 2020 by the authors. Licensee MDPI, Basel, Switzerland. This article is an open access article distributed under the terms and conditions of the Creative Commons Attribution (CC BY) license (http://creativecommons.org/licenses/by/4.0/).